Investment Opportunities in German Secondary Office Locations - Market Report Client: DEMIRE - Deutsche Mittelstand Real Estate AG Frankfurt am ...
←
→
Page content transcription
If your browser does not render page correctly, please read the page content below

Market Report
Investment Opportunities in
German Secondary Office Locations

Client: DEMIRE - Deutsche Mittelstand Real Estate AG
Frankfurt am Main, June 2017
SURVEY                                                                                                              bulwiengesa
INVESTMENT OPPORTUNITIES IN GERMAN SECONDARY OFFICE LOCATIONS

TABLE OF CONTENTS
                                                                                                                                                 Page

         PRELIMINARY REMARK                                                                                                                         1

1        EXECUTIVE SUMMARY                                                                                                                          2

2        STRUCTURE OF THE GERMAN OFFICE MARKET                                                                                                      3

3        PERFORMANCE OF THE OFFICE MARKETS IN SECONDARY OFFICE LOCATIONS                                                                            4

4        INVESTMENT MARKET                                                                                                                         11

         ANNEX

PROPRIETARY INFORMATION
The results and figures presented in this survey have been conducted on the basis of existing and compiled sources according to the best of our
knowledge and with appropriate care. A guarantee for factual accuracy can only be made with regard to information and data that has been elabora-
ted by bulwiengesa AG themselves. A guarantee for the factual accuracy of data and information provided by third parties cannot be made.

bulwiengesa AG remains the owner of this survey (electronic or printed form) until the agreed fee has been fully paid. The survey is protected by co-
pyright and registered by bulwiengesa AG. Only the client is entitled to disclose the survey or parts hereof (always citing the source) for the purpose
agreed at the time the survey was commissioned. The reproduction, publication and dissemination of contents to any third party is not permitted ex-
cept after prior written authorization by bulwiengesa AG (original source must be cited). Exempt from the foregoing is the use of this evaluation or
parts thereof for marketing brochures. In this case, prior written approval must be requested from the bulwiengesa AG without exception.

The results are interpreted and assessed in the context of bulwiengesa AG'S experience in its German and European research and consultancy activi-
ties.

    bulwiengesa AG

    Bettinastraße 62           Vorstand:            Aufsichtsratsvorsitzender:   Hauptsitz: Berlin               HypoVereinsbank München
    60325 Frankfurt am Main    Ralf-Peter Koschny   Hartmut Bulwien              Rechtsform: AG                  BLZ: 70020270, Kto.: 4410433058
    Tel. +49 69 75 61 467-60   Andreas Schulten     info@bulwiengesa.de          USt-ID: DE 164508347            BIC: HYVEDEMMXXX
    Fax +49 69 75 61 467-69    Thomas Voßkamp       www.bulwiengesa.de           Charlottenburg HRB 95407 B      IBAN: DE13700202704410433058

© bulwiengesa AG 2017 – P1704-3567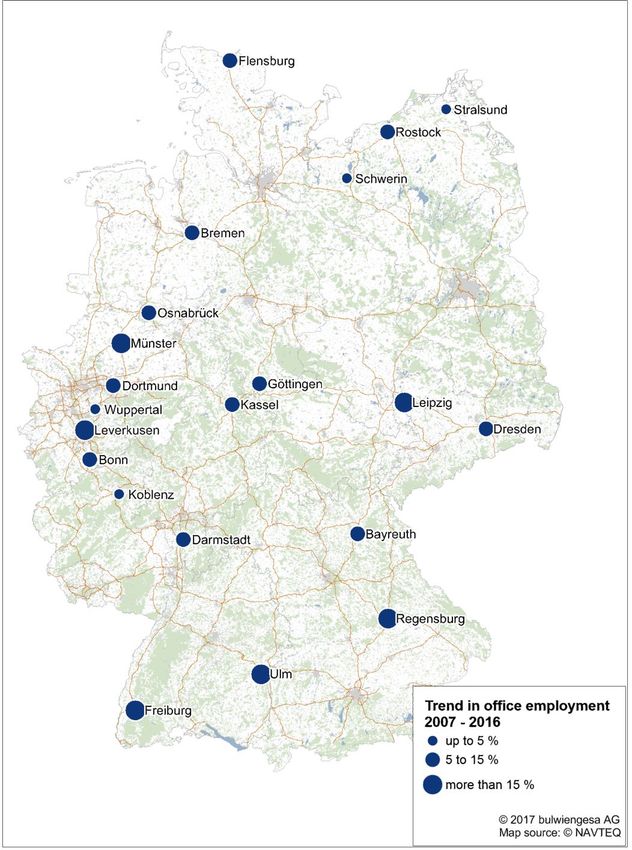
SURVEY                                                                                                     bulwiengesa
INVESTMENT OPPORTUNITIES IN GERMAN SECONDARY OFFICE LOCATIONS

PRELIMINARY REMARK                                                    About the Methodology

DEMIRE Deutsche Mittelstand Real Estate AG has commercial             The survey will use the data of bulwiengesa’s proprietary
real estate holdings in mid-sized cities and up-and-coming lo-        RIWIS1 database to increase the transparency of the smaller
cations on the periphery of German metropolitan areas. As the         markets or the secondary office locations. Also sourced for the
general market coverage tends to focus on the major metropo-          presentation of important projects is our in-house real estate
lises, the market perception of the smaller markets on the nati-      database.
onal level is rather underdeveloped. This is surprising insofar                        Overview of the cities surveyed
as many of these markets have been highly stable and have
prospered in recent years.

In order to increase the transparency of the smaller markets or
the secondary office locations, DEMIRE commissioned the in-
dependent German market research and consultancy firm of
bulwiengesa AG to conduct a market analysis of selected se-
condary markets in Germany. The analysis is focused on the
office segment. The analysed cities are depicted in the map
chart below.

Survey Structure

The survey before you divides into four consecutive analytic
steps, each of which builds on the preceding step. The first
step introduces the German office market, and takes a closer
look at its market structures. The next step of the analysis will
outline the rent and vacancy trends in the markets of the B to D
class cities, and juxtapose them with the performance of the
Class A markets. Since office employment is the most import-
ant demand variable of any office market, the survey will take a
closer look at its evolving performance and project its likely out-
look. With the market environment and the demand structure in
each market cluster having been detailed, the next step of the
analysis will be to profile the investment environment. In the
subsequent step, we will scrutinise the supply side of the sur-
veyed markets. To this end, we will juxtapose completions, the
volume of new construction, and the rental growth, among
other factors, with the trend in office employment. A brief con-
clusion will finally summarise the key findings of the survey.
                                                                          Map source © NAVTEQ

                                                                      1
                                                                           RIWIS = bulwiengesa’s proprietary regional information system for
                                                                           Germany’s real estate industry.

© bulwiengesa AG 2017 – P1704-3567                                                                                                   Page 1
SURVEY bulwiengesa
INVESTMENT OPPORTUNITIES IN GERMAN SECONDARY OFFICE LOCATIONS
1 EXECUTIVE SUMMARY
Due to the polycentric structure of the country’s economy, Ger- At the same time, some of the established business centres in
many is home to significant and prospering office real estate West Germany manifest extraordinary stability and low va-
markets that have evolved outside the major metropolises. The cancy levels. Individual markets like the one in Regensburg de-
survey now before you studies the risk/opportunity profile of se- veloped an above-average dynamic in recent years that is re-
lected secondary office locations and compares them to Ger- flected in rising rent rates. The chart below matches the rent
many’s Class A markets, the so-called “Big Seven.” The analy- volatility (a threat) of the past ten years with current yield op-
sis shows, on the one hand, that market activity and market portunities. Compared to the Class A markets, it becomes ob-
size differ significantly. On the other hand, the secondary office vious that many of the secondary office locations offer signifi-
locations have specific one-off supply and demand structures. cantly higher yield opportunities while their risk profiles (rent
These structures are generally defined by medium-sized enter- margin of fluctuation) are no higher or indeed lower than those
prises whose distinguishing features are a strong loyalty to lo- of the Class A cities.
cation and a high degree of stability.
Secondary office locations are generally characterised by little
Beyond that, secondary office locations present a rather hete- speculative building activity or none, on the one hand. On the
rogeneous market structure: In the early zero years, the office other hand, demand in many of these markets follows a stable
markets of East German cities in particular were characterised or upward trend. It is therefore safe to assume that market-con-
by an oversupply in office accommodation, which brought down sistent investments in these location will retain their balanced
rent levels. Yet over the past years, the majority of these mar- risk/return ratios.
kets have gathered momentum as a result of slow building acti-
vity and growing demand, and some of these markets show a
very dynamic performance.
Return / risk representation*
Selected
7.5 second office loc.
19 1 Bayreuth
2 Bonn
18 3 Bremen
7.0 4 Darmstadt
5 Dortmund
1 6 Dresden
9
6.5 7 11 7 Flensburg
21 8 Freiburg
Return (net initial yield, 2016, in %)
9 Göttingen
10 Kassel
6.0 17 10 11 Koblenz
13 12 Leipzig
15 13 Leverkusen
5.5 20 14 Münster
15 Osnabrück
4 3 16 Regensburg
16 17 Rostock
5.0 5 8 614 12 18 Schwerin
19 Stralsund
20 Ulm
2 21 Wuppertal
4.5
Class A cities
26 22 Berlin
28 23 23 Düsseldorf
4.0 24 Frankfurt
27 25 Hamburg
26 Cologne
24 27 Munich
3.5
28 Stuttgart
22
25
3.0
1 2 3 4 5 6 7 8 9 10 11 12 13 14 15
Risk (relative standard deviation of the average rent, in %)
* The standard deviation (average rent) refers to the period between 2007 and 2016.
Source: RIWIS
© bulwiengesa AG 2017 – P1704-3567 Page 2
SURVEY                                                                                                            bulwiengesa
INVESTMENT OPPORTUNITIES IN GERMAN SECONDARY OFFICE LOCATIONS

2         STRUCTURE OF THE GERMAN OFFICE                                              Structural data - office take-up (avg.), 2016
          MARKET
                                                                                 Class A markets                           510,600
Unlike other major office markets in Europe, such as those of
France or the UK, the German market for office real estate con-
sists of several metropolises, each of which has its own functio-                Class B markets            85,900
nal characteristics. In addition to these, there exists a large
                                                                                 Class C markets         22,500
number of midsize centres whose office real estate markets
prosper as often as not. In order to map the structure of this po-
lycentric market striation, bulwiengesa divided them into the                    Class D markets        8,000
market classes A through D. Determining factors such as total
office stock and office take-up play a key role in this classificati-                               0                                 500,000
on.
                                                                                                                    in sqm RA-C
               Structural data - total office stock 2016
                                                                               Source: RIWIS

                           21.6 %                                             Due to the geographic interdependencies of the markets, the
                                                                              demand for office accommodation in each is driven by different
                                            43.2 %                            types of market players.
                        14.7 %
                                                                              Market environment - key players defining the demand for space
                                20.5 %                                                           Regional         Inter-    Nation-      Inter-
                                                                                                  players       regional     wide       national
                                                                                                                 players    players     players
                          Class A markets            Class C markets           Class A markets       ✓              ✓          ✓           ✓

                          Class B markets            Class D markets           Class B markets       ✓             ✓           ✓
                                                                               Class C markets       ✓             ✓           ✓
    Source: RIWIS
                                                                               Class D markets       ✓
The office stock2 figures differ from one city to the next, depen-
ding on the market type: By the end of 2016, the seven Class A                In Class A markets, for instance, the demand for office accom-
                                                                              modation is generated by regional, inter-regional, national and
markets accounted for around 43.2% of the German office
                                                                              international players. This contrasts with B and C class markets
stock total (or around 79,463,000 sqm RA-C3). By contrast, the
                                                                              where regional and national players are the dominant demand
14 Class B cities claim an office stock share of around 20.5%
                                                                              groups. However, the market grid also includes cities like
(37,654,000 sqm RA-C), the 22 Class C cities a share of                       Darmstadt (a Class C market) whose specific economic fabric
around 14.7% (27,042,000 sqm RA-C) and the 84 Class D ci-                     generates demand even from international players.
ties a share of around 21.6% (39,787,000 sqm RA-C).
The discrepancies between the different market activities and
market sizes become even greater when you analyse the office
                                                                               Conclusion
take-up4: While the Class A cities reported an average take-up
of about 511,000 sqm RA-C in office space, the mean take-up                    Germany’s office market is defined by a polycentric structu-
in the Class B markets approximated 86,000 sqm RA-C. The fi-                   re. It is commonly divided into markets of the classes A
gures for the C and D class markets were around 22,500 and                     through D. While the large Class A markets are permanently
8,000 sqm RA-C, respectively.                                                  in the focus of international demand groups, smaller markets
                                                                               are dominated by locally rooted tenants who are loyal to
2
      Total office stock (net) = the net floor space stock (RA-C according     their location. As a result, these secondary office locations
      to the “gif” standard) only maps the net usable area, with the annu-     boast highly stable parameters, not least because regional
      al demolition rate also being taken into account.
                                                                               investors tend to have a long-term investment horizon.
3
      RA-C = lettable commercial floor area as defined by the “gif” re-
      search society for the real estate industry.
4
      Office take-up = the take-up is defined as year-end total, mainly re-
      presenting the office floor area absorbed by the market through let-
      tings but also including property developments pursued by owner-
      occupiers. The key date for the floor space take-up is the day a lea-
      se is signed or the day construction of owner-occupied properties
      starts, as the case may be.

© bulwiengesa AG 2017 – P1704-3567                                                                                                          Page 3
SURVEY                                                                                                                       bulwiengesa
INVESTMENT OPPORTUNITIES IN GERMAN SECONDARY OFFICE LOCATIONS

3                        PERFORMANCE OF THE OFFICE MAR-                                The rental growth spikes in the secondary office locations du-
                                                                                       ring the analysed time period are attributable to the market
                         KETS IN SECONDARY OFFICE LOCATI-                              upheavals in the East German states, among other reasons. In
                         ONS                                                           the cities of Leipzig and Dresden, for instance, brisk develop-
                                                                                       ment activity in the 1990s created an excess supply that the
A Look at the Supply Side                                                              market failed to absorb. To this day, the two cities show rela-
                                                                                       tively high vacancy rates that are explained by this historic
The prosperity and stability of the various markets is reflected                       background. Then again, the vacancy rates have been drop-
in the analysis of the office rent performance: As shown in the                        ping steadily over the past five years. As a result, rents reboun-
chart, the average rent5 growth differed starkly from one market                       ded and have drastically increased on average.
cluster to the next between the years 1997 and 2016. While the
Class A cities experienced fluctuations by more than 20%
within a matter of a few years, the secondary office locations (B                             Overview - average rents for CBD offices 2016*
through D class locations) typically have a highly stable perfor-                                    Average rent          Highest avg.   Lowest avg.
mance.                                                                                                (weighted)            rent level     rent level

                                                                                         Class A                             24.10           14.00
                                                                                                         19.40
    Performance of average rent, 1997 - 2020 (CBD offices)*                              markets                            (Munich)       (Cologne)

                         150                                                             Class B                              11.40          8.50
                                                                                                         9.80
                                                                                         markets                           (Mannheim)      (Bremen)
    Index (1997 = 100)

                         140
                         130                                                             Class C                              12.40           7.20
                                                                                                         8.60
                         120                                                             markets                           (Heidelberg)    (Bielefeld)
                         110                                                             Class D                              11.20           4.50
                         100                                                                             7.20
                                                                                         markets                              (Ulm)       (Halberstadt)
                          90                                                            * average rent in euros/sqm RA-C
                          80                                                            Source: RIWIS
                               97 99 01 03 05 07 09 11 13 15 17 19

                                     A cities    C cities                               Conclusion
                                     B cities    D cities
                                                                                        All things considered, we assume that the average rent in
    * weighted average
    Source: RIWIS; forecast by bulwiengesa for 2017 and years thereafter                the secondary office locations will see a positive performan-
                                                                                        ce in the coming years – see also the chart “Performance of
The volatility in the Class A cities must be blamed specifically                        average rent, 1997 - 2020”.
on the speculative6 building activity pursued in the late 1990s.
In conjunction with low take-up volumes, it resulted in a decline
of the rent average in Class A cities. Over the past years, the
reticent building activity on the Class A markets caused both
the prime and the average rent to rebound and start rising
again. By the end of 2016, asking rents showed a weighted
average of c. 19.40 euros/sqm RA-C.

5
                 Average rent = to determine the average rent, the rents negotiated
                 for the leases that were signed during the defined period of time
                 are weighted with the floor area rented before the mean is calcula-
                 ted.
6
                 Speculative building activity = property developments that move
                 ahead before the premises are pre-let.

© bulwiengesa AG 2017 – P1704-3567                                                                                                                Page 4
SURVEY bulwiengesa
INVESTMENT OPPORTUNITIES IN GERMAN SECONDARY OFFICE LOCATIONS
By contrast, the rental growth in Bonn progressed at a slower
Development of average rent (CBD offices) in the cities pace than in the other markets selected for this survey. Then
surveyed again, the city’s rents have maintained a high level since 2007.
By the end of 2016, Bonn reported an average office rent in the
Regensburg 27.4
inner city of 10.30 euros/sqm RA-C, putting the market in the
Osnabrück 25.8
top segment with the highest average rent level among the
Leipzig 25.3
Class B cities.
Kassel 23.6
Stralsund 22.0
The office vacancy rate represents an important indicator to be
Schwerin 21.4
factored in when juxtaposing the office supply currently on the
Freiburg (B.) 18.3
market with the demand side (office employment).
Wuppertal 17.9
Münster 17.6
Leverkusen 16.9 Development of the office vacancy rate, 1997 - 2020 (avg.)
Dresden 15.5
12.0
Ulm 14.9
Bremen 13.3 9.0
Göttingen 8.0
in %
Rostock 7.7 6.0
Koblenz 6.7
3.0
Flensburg 6.3
Bayreuth 6.0 0.0
Dortmund 5.0 97 99 01 03 05 07 09 11 13 15 17 19
Darmstadt 3.2
Bonn 3.0
A cities C cities
0% 10 % 20 % 30 % B cities D cities
Source: RIWIS; forecast by bulwiengesa for 2017 and years thereafter
2007 - 2016
The chart shown here illustrates that, within the market clusters
Source: RIWIS they are attributed to, the secondary office locations have tradi-
tionally had a lower office vacancy rate7 than the Class A cities.
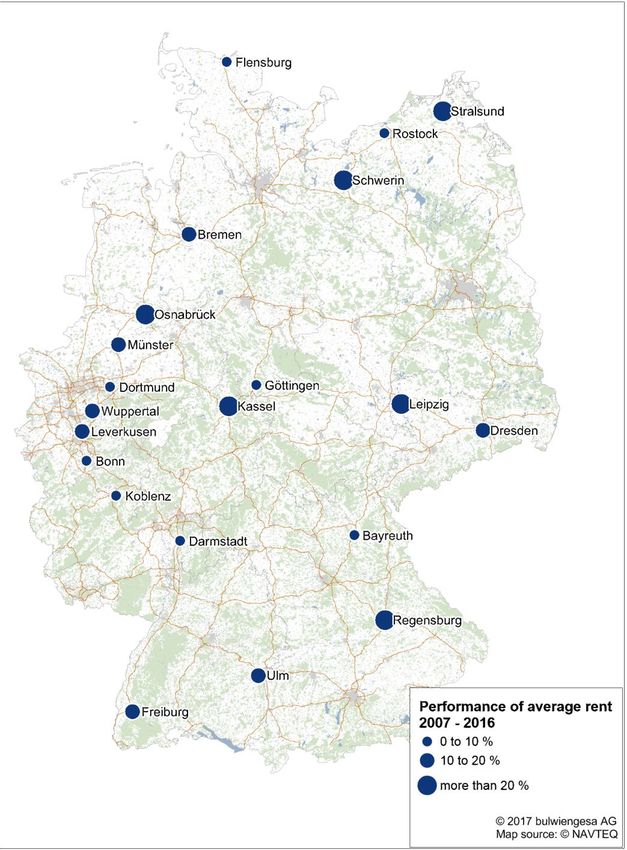
A detailed analysis of each market for the period 2007 through The main reason for this development is that you have virtually
2016 revealed a positive trend in the cities chosen for the case no speculative building activity in the secondary office locati-
study. The rent increases identified in the process straddle a ons.
bracket from about 3% to 27%. The steepest increases during
the period under review were registered in Regensburg (+ At the moment, however, several Class A cities show a shorta-
27.4%), Osnabrück (+25.8%) and Leipzig (+25.3%). ge in floor space. Vacancy rates in Munich, Stuttgart and Berlin
are down to a level of 2.7% to 3.0%. Frankfurt am Main is cur-
The rental growth in Regensburg is due to a broadly diversified rently the only one among the “Big Seven” cities with a double-
demand structure driven by the sectors of public administration digit vacancy rate. The decline in office vacancy rates is prima-
and research / teaching as well as by the administrative needs rily attributable to two factors. On the one hand, the take-up is
and services of the industrial sector, among other factors. Mo- increasing while, on the other hand, obsolete properties are re-
reover, the market action of the past years included few proper- cycled for other purposes (e.g. as residential buildings or ho-
ty developments, and these were pursued only in response to tels).
actual demand generated by the local market in Regensburg.
The market in Osnabrück also registered substantial rent hikes In analogy to the Class A cities, office vacancies in the secon-
because development activity in the city has proceeded at a dary office locations have also been rolled back in recent ye-
measured pace and been defined by owner-occupied or pre-let ars. The steepest drop in vacancy among the Class B cities
new buildings. The average office rent in downtown Osnabrück was accomplished in Leipzig with a reduction by 22 percentage
approximates 8.00 euros/sqm, thus matching the level of the points. Nonetheless, the city remains at the upper end of the
German Class C cities. Class B city ranking with a vacancy rate of 11.4%.
7
Office vacancy rate = the vacancy rate refers to the usable office
space vacant at the end of a given year; taking into account only
marketable properties while ignoring structural vacancy. The va-
cancy rate represents the ratio of vacant floor space to the total
floor space stock.
© bulwiengesa AG 2017 – P1704-3567 Page 5
SURVEY                                                                         bulwiengesa
INVESTMENT OPPORTUNITIES IN GERMAN SECONDARY OFFICE LOCATIONS

                                     Performance of average rent 2007 - 2016

© bulwiengesa AG 2017 – P1704-3567                                                     Page 6
SURVEY                                                                                                                   bulwiengesa
INVESTMENT OPPORTUNITIES IN GERMAN SECONDARY OFFICE LOCATIONS

The German Class C cities are generally known for their low         The development in Dresden, in analogy to Leipzig, is explai-
vacancy levels. The vacancy rate in Rostock, for instance, is       ned by a high level of speculative building activity during the
7%, that in Freiburg 1.4%. The vacancy rates of Class D cities      1990s and the excess supply it created. Meanwhile, Freiburg,
extend over a wider spectrum: While only 2.0% of the office         Göttingen, Bayreuth and Stralsund are following an inverse
space in Göttingen is vacant, the rate in Stralsund is 12.4%.       trend, as office vacancies have slightly increased. Then again,
                                                                    the vacancy rates in the first three of the above cities is on a
It is assumed that the decline in vacancies will continue           very low level (1.4% to 3.2%). Worth noting is also that these
through 2020, pushing vacancies rates down to a projected           markets fall short of the fluctuation reserve of 5.0% to 6.0% of
4.40% in the Class A cities, to 4.84% in the Class B cities, to     the office property stock that is considered necessary to ensure
5.13% in the Class C cities, and to 6.37% in the Class D cities.    the proper functioning of any office real estate market.

         Changes in vacancy rate in the surveyed cities             A Look at the Demand Site
                         (selected)
                                                                    Office employment is always the demand variable most rele-
         30.0                                                       vant in any office market studied. It is therefore mapped and
         25.0                                                       analysed in the chart below.
         20.0
  in %

         15.0
         10.0                                                                                     Trend in office employment, 1999 - 2020
          5.0
                                                                                            140
          0.0
                                                                       Index (1999 = 100)

                07   08   09    10   11   12   13   14   15   16                            130
                                                                                            120
                      Leipzig             Kassel                                            110
                      Regensburg          Münster
                                                                                            100
                      Dresden
                                                                                             90
 Source: RIWIS
                                                                                              1999 2002 2005 2008 2011 2014 2017 2020

Among the markets surveyed, Leipzig, Regensburg, Dresden,
                                                                                              A cities        B cities    C cities     D cities
Kassel and Münster – shown in the chart – were the cities most
successful in reducing their vacancies percentage-wise betwe-
                                                                     Source:RIWIS;forecast by bulwiengesa for 2017 and years thereafter
en 2007 and 2016. Especially the development of Leipzig’s of-
fice market should be highlighted in this context: Here, the of-
fice vacancy rate dropped from 26.3% at year-end 2007 down          On the whole, office employment followed an upward trend
to 11.4% by the end of 2016, not least because a large share of     across market clusters since 1999. Class A cities experienced
the vacant buildings in Leipzig were no longer fully marketable.    the briskest growth, followed by the class B, C and D markets.
The local vacancy rate was significantly reduced by taking the-     Office employment in the Class A cities currently adds up to
se off the market.                                                  around 2.9 million white collar jobs. This implies an increase by
                                                                    28% since 1999. Office employment in the secondary office lo-
Dresden – which is one of the three largest office markets in       cations followed a similar trend, rising between 17% and 25%.
East Germany, after Berlin and Leipzig – also registered a noti-    Office employment is likely to keep expanding across all mar-
ceable decrease in vacancies during the same time period: The       ket clusters in the coming years, making it reasonable to ex-
city’s vacancy rate went down from 11.3% in late 2007 to 8.4%       pect a persistently lively demand for office accommodation
by the end of 2016. Despite the regressive trend, this is still a   going forward.
rather high vacancy level for a Class B city.

© bulwiengesa AG 2017 – P1704-3567                                                                                                          Page 7
SURVEY                                                                                                    bulwiengesa
INVESTMENT OPPORTUNITIES IN GERMAN SECONDARY OFFICE LOCATIONS

The map below illustrates the positive growth in office jobs in
all of the surveyed cities – except in Stralsund (-7.4%) and               Growth in office employment in the cities surveyed
Schwerin (-2.1%) – during the period under review (2007
through 2016). Leipzig topped the list with a growth rate of +                   Leipzig                                   9.4
24.3%, followed by Freiburg (+22.2%) and Regensburg (+                     Regensburg                                  8.2
19.1%).                                                                    Freiburg (B.)                             6.9
                                                                                    Ulm                              6.7
Leipzig has managed to position itself in the domestic and in-                  Münster                              6.5
ternational competition as an attractive location marked by for-                   Bonn                          5.5
ward-looking industries, and as one of the economic powerhou-                 Dortmund                           5.2
ses in eastern Germany. In the recent past, Leipzig developed                  Dresden                           5.1
into a major automotive location after Porsche and BMW,                         Bremen                           5.1
among others, built major plants here. But conglomerates from                Flensburg                         3.4
other sectors, such as DHL and Siemens, have also set up fa-                Leverkusen                     2.8
cilities in Leipzig and thereby raised its economic standing.                 Göttingen                    2.7
                                                                             Darmstadt                    2.4
The increase in Freiburg is attributable to the prominence of                   Rostock                   2.1
the mid-market sector for the local economy and the strong                   Osnabrück                    1.8
service sector. Freiburg’s university encourages small and me-                  Koblenz                  1.6
dium-sized enterprises from the sectors solar technology, infor-               Bayreuth                  1.6
mation and media technology, as well as medical, environmen-                     Kassel                  1.1
tal and bio-technology to relocate to the city. The resulting clus-           Schwerin             -0.7
ters Green City, HealthRegion, BioRegion, Upper Rhine Valley                 Wuppertal            -1.5
and MicroTEC Südwest have enabled the city to position itself                 Stralsund          -2.1
as a regional and inter-regional player. The situation in Re-
gensburg is similar insofar as the research and education sec-                         -5 %        0%                      5%    10 %
tor evolved into one of the mainstays of the local economy ever                                  2016 - 2020
since the university was set up in the 1960s.

                                                                       Source: RIWIS

                                                                       Q           S

                                                                      The forecast period of 2016 through 2020 is expected to bring
                                                                      positive growth in office employment for all of the cities sur-
                                                                      veyed, with the exception of Schwerin, Wuppertal and Stral-
                                                                      sund. Outperformers like Leipzig (+9.4%), Regensburg (+8.2%)
                                                                      and Freiburg (+6.9%) will continue their upward trend (see the
                                                                      period between 2007 and 2016). Another two cities with growth
                                                                      prospects of more than 6% are Ulm and Münster.

                                                                      Stralsund, by contrast, will probably keep following a downward
                                                                      trend (outlook: -2.1%) because the current socio-economic pa-
                                                                      rameters (including an unemployment rate far above the state
                                                                      and federal average) do not point to an imminent boom cycle.

© bulwiengesa AG 2017 – P1704-3567                                                                                                Page 8
SURVEY bulwiengesa
INVESTMENT OPPORTUNITIES IN GERMAN SECONDARY OFFICE LOCATIONS
Trend in office employment, 2007 - 2016
© bulwiengesa AG 2017 – P1704-3567 Page 9SURVEY bulwiengesa
INVESTMENT OPPORTUNITIES IN GERMAN SECONDARY OFFICE LOCATIONS
locations beyond the Class A cities. The transformation of the
Trend in office employment by industry, 2007 - 2016 Germany economy away from the classic industrial sector and
towards the service industry keeps generating demand for of-
fice workspace.
Misc. high-end corp. The public sector assumes a prominent market position as a
services relevant demand variable, specifically with its floor space requi-
rements in the administrative and social sectors. Office employ-
ment in the secondary office locations generated a growth in
Publ. admin. & soc. demand between 10.4% and 17.8%.
serv.
High-end corporate services are expected to keep stimulating
the growth in office jobs more than any other sector, with se-
condary office locations projected to see growth rates between
TMT
12.1% and 13.8% in the years to come.
Another major role is played by technology-oriented busines-
ses, whose demand on the office real estate market grew by
Manufact. industry
3.2% to 6.7%. The low influence of the finance industry on the
office real estate markets in secondary office locations is
another stabilising factor. Possible consolidations in the ban-
king and finance sectors will have much less of an impact here
Finance & legal than on Class A markets.
Conclusion
-10 % 0 % 10 % 20 % 30 % 40 % 50 %
Class A-cities Unlike Germany’s Class A markets, the secondary office lo-
Class B-cities cations delivered a very stable performance in recent years
Class C-cities both in terms of average rental growth and in terms of office
Class D-cities vacancy rates. Demand in the secondary office locations is
Source: RIWIS principally driven by mid-market companies, whose most
distinct traits include strong loyalty to location and a high de-
gree of stability. Office employment, which is the chief indi-
Higher-end corporate services – which include companies from cator for demand on any office market, manifested a positive
the real estate industry, among others – were among the dri- trend across all market clusters over the past years. The co-
vers of office employment in recent years. This type of service ming years are expected to see the upward trend in office
generated an office job growth of 24.1% to 37.7% in the secon- employment continue, and to produce positive effects for the
dary office locations, nearly matching the relative growth rate of office markets in turn.
the Class A cities.
The segments TMT (technology, media, telecommunication), fi-
nancial technology (FinTech) and insurance technology (Insur-
Tech), which are also subsumed in this service category, clear-
ly prospered too. These segments achieved growth rates of up
to 18% in the secondary office locations. Indeed, the fact that
not just the “Big Seven” cities like Berlin but secondary office
locations benefited from this kind of growth is quite remarkable
in the context of this survey.
The manufacturing industry, which includes both elements of
the Old Economy and aspects of the new innovation-driven in-
dustries, actually outpaced the Class A markets (11.5%) in the
midsize markets (Class B markets) with a growth rate of
15.4%. It is yet more evidence that growth impulses from the
innovation industries have long moved on to include business
© bulwiengesa AG 2017 – P1704-3567 Page 10SURVEY bulwiengesa
INVESTMENT OPPORTUNITIES IN GERMAN SECONDARY OFFICE LOCATIONS
4 INVESTMENT MARKET then, the market continues to be driven by foreign investors
who are clearly seeing the minor markets as a viable worka-
round. This investor group accounted for 44% of all invest-
The success of a property investment is determined, on the
ments in 2016.
one hand, by sustainable rental income. The prevailing market
environment and the demand structure in each market cluster
In any of the commercial segments, office properties represent
was outlined in the preceding chapters. On the other hand, the
the most popular investment category. They attracted around
investment environment is considered the second most decisi-
45% of all property investments, followed by retail real estate at
ve value driver. It remains defined by a highly strained interest
around 25%.
environment and the absence of alternative investment-grade
asset classes. The resultant effect is a rising liquidity level on
Net Initial Yield
the investment market that exacerbates the market situation.
The net initial yield9 reflects the investor demand for a given
Transaction Volume
market cluster. In sync with investor demand in the respective
demand clusters, the persistent yield compression trend that
Transaction volume commercial property, 2008 - 2016* started in 2010 has continued ever since.
35
30 Net initial yield, 1997 - 2016 (CBD offices)*
in Mrd. Euro
25 8
20
15 7
10 6
in %
5
5
0
08 09 10 11 12 13 14 15 16 4
3
class A-cities
97 99 01 03 05 07 09 11 13 15
Secondary office locations
Other A-cities
* No data available on years before 2008, Source: RIWIS B-cities
C-cities
The demand for commercial real estate in Germany8 has main-
D-cities
tained a high level for a number of years now. The fact is re- * weighted average; Source: RIWIS
flected in a transaction volume of this market segment: It has
While the past few years were defined by investor demand for
been expanding since the crisis year 2009, although 2016 saw
core assets10 in the major metropolises, investors have lately
the volume consolidate on a high level. The total transaction
expanded their horizon to include properties outside the CBDs
volume came to approximately 53 billion euros by the end of
and outside the major markets. Net initial yield levels have
2016. Due to the growing shortage in investment opportunities
9
Net initial yield = this ratio puts the net rental income in relation to
in the country’s major metropolises, investors have increasingly the purchase price before the property-specific incidental acquisiti-
looked for alternatives in secondary office locations. Now, as on costs. Accordingly, a low net initial yield rate suggests a high
8 asking price.
Commercial real estate = office, retail and logistics real estate
along with certain other properties (hotels, senior-living real estate, 10
Core assets = real assets in prime locations let on excellent lease
etc.). covenants.
© bulwiengesa AG 2017 – P1704-3567 Page 11SURVEY bulwiengesa
INVESTMENT OPPORTUNITIES IN GERMAN SECONDARY OFFICE LOCATIONS
dropped to new all-time lows as a result. Class A cities, for in-
stance, registered a weighted mean net initial yield of 3.58% at Conclusion
year-end 2016. A yield level this low makes it harder and har-
der for investors to engage in financially lucrative property in- The current yield level steadily narrows the margin for finan-
vestment activities. Net initial yield rates in secondary office lo- cially viable investments in German metropolises. This mo-
cations matched the downtrend by dropping to 5.06% in Class ves the secondary office locations increasingly into focus for
B cities, to 5.69% in Class C cities and to 6.72% in Class D ci- investors because they offer attractive alternatives to the
ties. major cities. However, the strained market environment is
causing the situation to repeat itself in the secondary office
locations as transaction volumes grow and net initial yield
Net initial yield in the surveyed cities 2016 rates harden. The situation is not made easier by the fact
that most of the secondary office locations have a small
Stralsund 7.3 %
market footprint – strongly limiting investment volumes for
Schwerin 7.1 % office real estate investments.
Bayreuth 6.7 %
Göttingen 6.6 %
Flensburg 6.5 %
Koblenz 6.5 %
Wuppertal 6.4 %
Kassel 6.0 %
Rostock 6.0 %
Leverkusen 5.8 %
Osnabrück 5.7 %
Ulm 5.5 %
Bremen 5.3 %
Darmstadt 5.3 %
Regensburg 5.1 %
Dortmund 5.0 %
Dresden 5.0 %
Freiburg 5.0 %
Leipzig 5.0 %
Münster 5.0 %
Bonn 4.6 %
Source: RIWIS
At the end of 2016, the net initial yield rates in the surveyed ci-
ties ranged from 7.3% in Stralsund to 4.6% in Bonn. In terms of
prime yield (net initial yield), this makes Bonn’s investment
market the priciest one among the Class B cities. The head-
quarters of Deutsche Telekom AG in the federal district, for in-
stance, was sold by KGAL to a syndicate of institutional inves-
tors from South Korea for 200 million euros. Generally spea-
king, the city benefits increasingly from the short supply in in-
vestment products in the Class A cities. At the other end of the
scale of Stralsund with a net initial yield of 7.3%. Here, the
small size of the city’s market strongly limits the possible in-
vestment volume for office investments.
© bulwiengesa AG 2017 – P1704-3567 Page 12SURVEY bulwiengesa
INVESTMENT OPPORTUNITIES IN GERMAN SECONDARY OFFICE LOCATIONS
Bayreuth Bonn (Demire asset)
Key figures office market (Source: RIWIS) Key figures office market (Source: RIWIS)
Average Average
2007 2016 2007 2016
2007 - 2016 2007 - 2016
Total office Total office 3,126,700 3,220,900 3,193,900
405,000 sqm 418,000 sqm 412,000 sqm stock* sqm sqm sqm
stock*
Office take-up* 5,000 sqm 16,500 sqm 6,800 sqm Office take-up* 130,000 sqm 90,000 sqm 88,650 sqm
New office spa- New office spa-
0 sqm 5,200 sqm 2,100 sqm 41,900 sqm 41,500 sqm 26,250 sqm
ce added* ce added*
Average rent 6.70 euros/ 7.10 euros/ 6.80 euros/ Average rent 10.00 10.30 10.20
(CBD)* sqm sqm sqm (CBD)* euros/sqm euros/sqm euros/sqm
Office vacancy Office vacancy
11,000 sqm 13,500 sqm 11,500 sqm 133,000 sqm 85,000 sqm 114,150 sqm
rate* rate*
Net initial yield 8.0 % 6.7 % 7.7 % Net initial yield 5.8 % 4.6 % 5.5 %
Office employment Office employment
Number 19,434 22,135 20,792 Number 106,166 118,112 112,076
22,495 1.6 % 124,611 5.5 %
Forecast Forecast
(2020) (2016 - 2020) (2020) (2016 - 2020)
Sectors Sectors
Public administ- -4 % Public administ- -5 %
3,484 3,648 31,173 28,593
ration (2016 - 2020) ration (2016 - 2020)
Other high-end 13 % Other high-end 6%
1,896 2,406 7,743 8,169
corp. serv. (2016 - 2020) corp. serv. (2016 - 2020)
9% 1%
TMT 2,006 2,699 TMT 16,228 16,649
(2016 - 2020) (2016 - 2020)
Local companies Local companies
Scientific Research and Innovation; Information and Communication Technology;
Key clusters Key clusters
Creative Industry Healthcare
– Klinikum Bayreuth GmbH Local compa- – Deutsche Post AG
Local compa- – Deutsche Telekom AG
– TenneT TSO GmbH
nies (selected) – medi GmbH & Co. KG nies (selected) – Deutsche Postbank AG
Projects of new construction (selected) from 5,000 sqm Projects of new construction (selected) from 5,000 sqm
RA-C (07 - 20) RA-C (07 - 20)
The office real estate market in Bayreuth is of small-scale cha- Considering its office market, it is safe to say that the city has
racter and dominated by owner-occupiers. Local property de- made a success of its shift from federal capital to “federal
velopments reflect the fact: The biggest new-build construc- city.” The vacancy rate has steadily declined in the years sin-
tion project (between 2007 and 2016) was the development of ce 2007. Since the number of property developments now in
the customer centre of the local savings bank (completed in the pipeline is moderate, the vacancy reduction will continue
late 2016) with an office space of about 5,200 sqm RA-C. The despite the major construction projects that are expected to
property developments scheduled for the coming years are be kicked off in the coming years. One of these projects,
also predominantly intended for owner-occupancy. In addition which range between 50,000 and 60,000 sqm RA-C, is plan-
to the new building raised by Tennet GmbH on Nordring, the ned by the BSI German Federal Office for Information Securi-
company Rehau also plans to build an office scheme here. ty on Ludwig-Erhard-Allee (owner-occupier), while a new h.-r.
is to be raised in the prime location at Bundeskanzlerplatz.
* in RA-C
MF/G; **Gesamtanzahl der Mitarbeiter des Unternehmens
© bulwiengesa AG 2017 – P1704-3567 Page 13SURVEY bulwiengesa
INVESTMENT OPPORTUNITIES IN GERMAN SECONDARY OFFICE LOCATIONS
Bremen Darmstadt (Demire asset)
Key figures office market (Source: RIWIS) Key figures office market (Source: RIWIS)
Average Average
2007 2016 2007 2016
2007 - 2016 2007 - 2016
Total office 2,384,400 2,620,900 2,503,000 Total office 1,438,900 1,602,500 1,538,800
stock* sqm sqm sqm stock* sqm sqm sqm
Office take-up* 120,000 sqm 88,000 sqm 84,095 sqm Office take-up* 37,000 sqm 40,000 sqm 43,950 sqm
New office spa- New office spa-
49,900 sqm 51,100 sqm 32,490 sqm 55,710 sqm 18,150 sqm 26,190 sqm
ce added* ce added*
Average rent 7.50 euros/ 8.50 euros/ 8.00 euros/ Average rent 9.50 euros/ 9.80 euros/ 9.60 euros/
(CBD)* sqm sqm sqm (CBD)* sqm sqm sqm
Office vacancy Office vacancy
110,000 sqm 118,400 sqm 119,100 sqm 76,000 sqm 74,000 sqm 75,800 sqm
rate* rate*
Net initial yield 6.3 % 5.3 % 6.2 % Net initial yield 6.3 % 5.3 % 6.1 %
Office employment Office employment
Number 112,584 125,066 118,665 Number 41,500 45,397 43,287
131,469 5.1 % 46,472 2.4 %
Forecast Forecast
(2020) (2016 - 2020) (2020) (2016 - 2020)
Sectors Sectors
Public administ- 3% Public administ- -5 %
11,249 12,241 6,834 6,298
ration (2016 - 2020) ration (2016 - 2020)
Other high-end 23 % Other high-end 10 %
9,028 13,262 4,359 6,081
corp. serv. (2016 - 2020) corp. serv. (2016 - 2020)
8% 4%
TMT 12,004 14,173 TMT 7,850 8,690
(2016 - 2020) (2016 - 2020)
Local companies Local companies
Aviation and Aerospace; Maritime Economy
Key clusters Key clusters Chemistry; Pharma; Telecommunication
and Logistics; Automotive Industry
Local compa- – KAEFER Isoliertechnik GmbH & Co. – E.Merck KG
– Kühne + Nagel (AG & Co.) KG Local compa- – Ev. Kirche in Hessen und Nassau
nies (selected) – Bremer Lagerhaus-Gesellschaft nies (selected) – Vibracoustic GmbH
Projects of new construction (selected) from 5,000 sqm Projects of new construction (selected) from 5,000 sqm
RA-C (07 - 20) RA-C (07 - 20)
With a total floor space stock of around 2.6 million sqm RA-C, Darmstadt is an important location among the Class C cities.
Bremen is home to one of the midfield office markets among the But within the Rhine-Main metro region, Darmstadt is outper-
Class B cities. One of the largest property developments of recent formed by Frankfurt and Wiesbaden. The biggest new-build
years was the new head office of the Bremen state bank with construction scheme of recent years involved the TZ T-Online
around 20,000 sqm RA-C (owner-occupied; completed in 2016) building (completed in 2007) with about 72,500 sqm RA-C.
and the construction of a new Arcelor steel mill (completed in Aside from property developments pursued by owner-occu-
2007, around 20,000 sqm RA-C). Several projects are currently in piers, such as the group head office of Merck (about 8,500
the pipeline, one of them the Übersee-Tower with a floor area of sqm RA-C) or the headquarters of Alnatura (about 8,000 sqm
about 11,500 sqm RA-C. However, many developers hang on to
plots that are already zoned for development and whose planning RA-C), there are virtually no other developments in the pipe-
permit has already been obtained, waiting to ensure that a certain line.
pre-let ratio has been achieved.
* in RA-C
© bulwiengesa AG 2017 – P1704-3567 Page 14SURVEY bulwiengesa
INVESTMENT OPPORTUNITIES IN GERMAN SECONDARY OFFICE LOCATIONS
Dortmund Dresden
Key figures office market (Source: RIWIS) Key figures office market (Source: RIWIS)
Average Average
2007 2016 2007 2016
2007 - 2016 2007 - 2016
Total office 2,414,800 2,615,600 2,538,400 Total office 2,653,400 2,631,900 2,673,100
stock* sqm sqm sqm stock* sqm sqm sqm
Office take-up* 93,000 sqm 115,000 sqm 82,200 sqm Office take-up* 63,000 sqm 80,000 sqm 78,000 sqm
New office spa- New office spa-
5,500 sqm 18,900 sqm 27,000 sqm 500 sqm 13,400 sqm 12,700 sqm
ce added* ce added*
Average rent 10.00 10.50 10.40 Average rent 8.40 9.70 8.70
(CBD)* euros/sqm euros/sqm euros/sqm (CBD)* euros/sqm euros/sqm euros/sqm
Office vacancy Office vacancy
130,000 sqm 130,000 sqm 139,000 sqm 300,000 sqm 220,000 sqm 270,700 sqm
rate* rate*
Net initial yield 6.3 % 5.0 % 6.0 % Net initial yield 6.5 % 5.0 % 6.2 %
Office employment Office employment
Number 98,529 108,392 103,384 Number 101,551 112,919 106,948
Forecast 114,054 5.2 %
Forecast
118,632 5.1 %
(2020) (2016 - 2020) (2020) (2016 - 2020)
Sectors Sectors
Public administ- 7% Public administ- 2%
13,603 15,164 18,765 19,512
ration (2016 - 2020) ration (2016 - 2020)
Other high-end 13 % Other high-end 14 %
7,722 9,827 13,211 17,601
corp. serv. (2016 - 2020) corp. serv. (2016 - 2020)
-1 % -6 %
TMT 12,851 12,024 TMT 14,506 12,642
(2016 - 2020) (2016 - 2020)
Local companies Local companies
Microelectronics; Information and Communi-
Key clusters IT; Micro- and Nanotechnology; Biomedicine Key clusters
cation Technology
– TEDI GmbH & Co. KG – IKK classic
Local compa- – AOK NordWest – Gesundheitskasse
Local compa-
– AOK PLUS – Gesundheitskasse
nies (selected) – WILO SE nies (selected) – Technische Werke Dresden GmbH
Projects of new construction (selected) from 5,000 sqm Projects of new construction (selected) from 5,000 sqm
RA-C (07 - 20) RA-C (07 - 20)
Dortmund is home to the second-most important office market in The office take-up in Dresden has been stable over the past
the Ruhr metro area. The significance of Dortmund’s office market years. But notwithstanding the downward trend, the vacant
is illustrated above all by its annual take-up, which averaged floor space total remains high due to the excess supply crea-
around 82,000 sqm RA-C during the past 10 years. Aside from ted in the 1990s. This explains why completion rates have
the rather small-scale diversified economic structure of the mar- been low in recent years. The biggest development project
ket, the relatively high take-up is attributable not least to white-col- during the period 2007 through 2016 was the construction of
lar job growth. There are temporary spikes whenever the start of the new employment office (completed in 2015) with about
construction work on owner-occupied schemes drives up the 11,600 sqm RA-C. Three redevelopment projects for proper-
completions figure. The projects to be completed between now
and 2020 are mainly earmarked for owner-occupancy, the con- ties of more than 5,000 sqm RA-C each are in the pipeline for
struction of the new Amprion head office being a case in point. the coming years. All other development projects involve
smaller buildings.
* in RA-C
© bulwiengesa AG 2017 – P1704-3567 Page 15SURVEY bulwiengesa
INVESTMENT OPPORTUNITIES IN GERMAN SECONDARY OFFICE LOCATIONS
Flensburg (Demire asset) Freiburg (Breisgau) (Demire asset)
Key figures office market (Source: RIWIS) Key figures office market (Source: RIWIS)
Average Average
2007 2016 2007 2016
2007 - 2016 2007 - 2016
Total office Total office 1,233,700 1,347,400 1,289,500
369,400 sqm 390,300 sqm 382,400 sqm
stock* stock* sqm sqm sqm
Office take-up* 7,000 sqm 3,000 sqm 7,650 sqm Office take-up* 30,000 sqm 20,000 sqm 23,300 sqm
New office spa- New office spa-
3,500 sqm 0 sqm 3,210 sqm 6,300 sqm 23,640 sqm 15,010 sqm
ce added* ce added*
Average rent 6.30 6.70 6.50 Average rent 9.30 11.00 10.30
(CBD)* euros/sqm euros/sqm euros/sqm (CBD)* euros/sqm euros/sqm euros/sqm
Office vacancy Office vacancy
20,000 sqm 20,000 sqm 20,750 sqm 15,000 sqm 19,000 sqm 16,000 sqm
rate* rate*
Net initial yield 6.8 % 6.5 % 6.8 % Net initial yield 6.3 % 5.0 % 6.0 %
Office employment Office employment
Number 18,239 19,159 18,229 Number 52,891 64,650 58,834
19,802 3.4 % 69,096 6.9 %
Forecast Forecast
(2020) (2016 - 2020) (2020) (2016 - 2020)
Sectors Sectors
Public administ- 1% Public administ- 7%
3,379 3,519 8,514 10,235
ration (2016 - 2020) ration (2016 - 2020)
Other high-end 20 % Other high-end 12 %
1,006 1,611 4,897 6,393
corp. serv. (2016 - 2020) corp. serv. (2016 - 2020)
-49 % -2 %
TMT 2,575 1,129 TMT 6,920 6,994
(2016 - 2020) (2016 - 2020)
Local companies Local companies
Healthcare and Services; Mechanical Engi-
Key clusters neering and Shipbuilding; Mobile Communi- Key clusters Healthcare; BioTech
cation
– Ev.-Lutherische Diakonissenanstalt – Regionalverbund kirchlicher Krankenhäu
Flensburg Local compa- ser
Local compa- – Zustellgesellschaft Schleswig-Holstein nies (selected) – TDK-Micronas GmbH
nies (selected) mbH – badenova AG & Co. KG
– medien holding:nord gmbh
Projects of new construction (selected) from 5,000 sqm
Projects of new construction (selected) from 5,000 sqm
RA-C (07 - 20)
RA-C (07 - 20) The office market of Freiburg is relatively manageable and small
With its moderate rent level, a low vacancy rate, and a volatile in scale. The market action is rarely speculative in character, and
volume of new properties coming on-stream, Flensburg’s largely dominated by one-off projects. The biggest property deve-
market is small-scale and hardly speculative in character. No lopment between 2007 and 2016 was the construction of the new
developments exceeding 5,000 sqm RA-C were completed administrative building of the Rudolf Haufe Verlag publishing
during the analysed period. The development of the new dis- house with around 16,800 sqm RA-C. Large-scale developments
trict of Sonwik, while upgrading the city’s office market as a projected for the coming years include the completion of the first
whole, also led to the recent construction of high-end office construction stage of city hall and the construction of the new
accommodation, including e.g. the head office of the SHZ head office of the Volksbank cooperative bank.
publishing house
* in RA-C
© bulwiengesa AG 2017 – P1704-3567 Page 16SURVEY bulwiengesa
INVESTMENT OPPORTUNITIES IN GERMAN SECONDARY OFFICE LOCATIONS
Göttingen Kassel (Demire asset)
Key figures office market (Source: RIWIS) Key figures office market (Source: RIWIS)
Average Average
2007 2016 2007 2016
2007 - 2016 2007 - 2016
Total office 687,900 sqm 702,900 sqm 695,800 sqm Total office 1,047,500 1,146,700 1,098,000
stock* stock* sqm sqm sqm
Office take-up* 9,000 sqm 5,000 sqm 8,300 sqm Office take-up* 11,000 sqm 13,000 sqm 14,850 sqm
New office spa- New office spa-
6,400 sqm 2,000 sqm 2,750 sqm 2,110 sqm 14,250 sqm 12,472 sqm
ce added* ce added*
Average rent 7.50 euros/ 8.10 euros/ 7.80 euros/ Average rent 5.50 euros/ 6.80 euros/ 6.20 euros/
(CBD)* sqm sqm sqm (CBD)* sqm sqm sqm
Office vacancy Office vacancy
12,000 sqm 14,000 sqm 13,700 sqm 75,000 sqm 52,000 sqm 58,900 sqm
rate* rate*
Net initial yield 7.3 % 6.6 % 7.1 % Net initial yield 6.8 % 6.0 % 6.7 %
Office employment Office employment
Number 40,961 45,150 43,086 Number 44,373 49,419 47,326
46,364 2.7 % 49,977 1.1 %
Forecast Forecast
(2020) (2016 - 2020) (2020) (2016 - 2020)
Sectors Sectors
Public administ- -3 % Public administ- -6 %
4,569 4,493 8,494 8,375
ration (2016 - 2020) ration (2016 - 2020)
Other high-end 21 % Other high-end 21 %
3,020 5,222 4,316 7,279
corp. serv. (2016 - 2020) corp. serv. (2016 - 2020)
-10 % -8 %
TMT 6,444 5,708 TMT 3,246 3,249
(2016 - 2020) (2016 - 2020)
Local companies Local companies
Scientific Research; Measurement and
Key clusters Key clusters Renawable Energies
Control Technology; Photonics
– Georg-August-Universität Göttingen Stif- – K+S Aktiengesellschaft
tung Öffentliche Rechts Universitätsme- Local compa- – Vitos GmbH
Local compa- dizin nies (selected) – Wegmann Unternehmens-Holding GmbH
nies (selected) – Sartorius AG
– Novelis Deutschland GmbH Projects of new construction (selected) from 5,000 sqm
RA-C (07 - 20)
Projects of new construction (selected) from 5,000 sqm The office real estate market in Kassel is strongly defined by
RA-C (07 - 20) public and industrial administrative functions. Most of the mar-
The office market is dominated by owner-occupiers belonging ket action, however, is need-driven and rarely ever speculati-
in the fields of research and teaching as well as the public ad- ve. The largest construction project between 2007 and 2016
ministration sector. The market action documented throughout was the new finance centre of the state of Hesse (about
the years has been predominantly small-scale in character. 17,800 sqm RA-C) which was finished in 2008. Additional de-
None of the building projects registered between 2007 and velopments will go ahead before 2020, including the construc-
2016 involved more than 5,000 sqm RA-C. The single largest tion of the new IWES research buildings of about 5,000 sqm
project is the expansion of the Sartorius administrative buil- RA-C and the construction of the new employment office in
ding of about 25,000 sqm RA-C, which is intended for owner- Kassel of about 7,000 sqm RA-C.
occupancy and scheduled to be completed by mid-2018.
* in RA-C
© bulwiengesa AG 2017 – P1704-3567 Page 17SURVEY bulwiengesa
INVESTMENT OPPORTUNITIES IN GERMAN SECONDARY OFFICE LOCATIONS
Koblenz Leipzig (Demire asset)
Key figures office market (Source: RIWIS) Key figures office market (Source: RIWIS)
Average Average
2007 2016 2007 2016
2007 - 2016 2007 - 2016
Total office 922,648 sqm 992,728 sqm 963,576 sqm Total office 2,741,378 2,713,684 2,755,438
stock* stock* sqm sqm sqm
Office take-up* 20,000 sqm 15,000 sqm 19,800 sqm Office take-up* 85,000 sqm 97,000 sqm 91,850 sqm
New office spa- New office spa-
16,300 sqm 2,000 sqm 11,320 sqm 4,200 sqm 3,800 sqm 9,445 sqm
ce added* ce added*
Average rent 7.50 euros/ 8.00 euros/ 7.90 euros/ Average rent 7.50 euros/ 9.40 euros/ 8.20 euros/
(CBD)* sqm sqm sqm (CBD)* sqm sqm sqm
Office vacancy Office vacancy
37,000 sqm 32,000 sqm 38,300 sqm 720,000 sqm 310,000 sqm 509,300 sqm
rate* rate*
Net initial yield 7.0 % 6.5 % 6.9 % Net initial yield 6.3 % 5.0 % 6.0 %
Office employment Office employment
Number 37,899 39,678 38,523 Number 93,136 113,645 102,727
40,315 1.6 % 124,354 9.4 %
Forecast Forecast
(2020) (2016 - 2020) (2020) (2016 - 2020)
Sectors Sectors
Public administ- -2 % Public administ- -9 %
8,762 8,651 11,932 11,247
ration (2016 - 2020) ration (2016 - 2020)
Other high-end 6% Other high-end 21 %
2,947 3,071 11,853 17,285
corp. serv. (2016 - 2020) corp. serv. (2016 - 2020)
6% 13 %
TMT 3,197 3,208 TMT 12,028 15,505
(2016 - 2020) (2016 - 2020)
Local companies Local companies
IT; Logistics; Scientific Research Automotive Industry; Renewable Energies;
Key clusters Key clusters
Healthcare
– Debeka Lebensversicherungsverein – Leipziger Versorgungs- und Verkehrsge-
Local compa- – Bundesministerium für Verteidigung sellschaft mbH
nies (selected) – CompuGroup Medical SE Local compa- – Deutsche Rentenversicherung Mittel-
nies (selected) deutschland
Projects of new construction (selected) from 5,000 sqm
– Universitätsklinikum Leipzig
RA-C (07 - 20)
The office market in Koblenz is characterised by the public Projects of new construction (selected) from 5,000 sqm
administration and healthcare sectors, as well as by the fi- RA-C (07 - 20)
nance, lending and insurance industry. Large-scale property Leipzig’s office market has done rather well over the past ye-
developments have become rare – exceptions including the ars. The declining but still relatively high vacancy rate has
construction of the new Koblenz university of applied sciences caused building activity to remain reticent. Current projects
(about 20,000 sqm RA-C; completed in 2009), the Debeka in- are predominantly earmarked for owner-occupancy or under
surance services building (about 6,000 sqm RA-C, completed development on the strength of forward commitments – such
in 2010) and the new civil justice centre (about 12,000 sqm as the service centre of Deutsche Telekom with 9,000 sqm
RA-C). No development projects are in the pipeline for the co- RA-C (to be completed in 2018) or the new office scheme for
ming years. the German Biomass Research Centre (DBFZ).
* in RA-C
© bulwiengesa AG 2017 – P1704-3567 Page 18SURVEY bulwiengesa
INVESTMENT OPPORTUNITIES IN GERMAN SECONDARY OFFICE LOCATIONS
Leverkusen Münster
Key figures office market (Source: RIWIS) Key figures office market (Source: RIWIS)
Average Average
2007 2016 2007 2016
2007 - 2016 2007 - 2016
Total office 2,010,675 2,201,666 2,099,227
Total office stock* 619,359 sqm 660,636 sqm 646,804 sqm
stock* sqm sqm sqm
Office take-up* 33,500 sqm 28,000 sqm 15,100 sqm Office take-up* 62,000 sqm 60,000 sqm 60,900 sqm
New office space New office spa-
3,500 sqm 950 sqm 5,500 sqm 41,330 sqm 36,740 sqm 26,599 sqm
added* ce added*
Average rent 6.50 7.60 7.00 Average rent 8.50 10.00 9.10
(CBD)* euros/sqm euros/sqm euros/sqm (CBD)* euros/sqm euros/sqm euros/sqm
Office vacancy Office vacancy
38,000 sqm 35,000 sqm 40,100 sqm 110,000 sqm 67,000 sqm 88,650 sqm
rate* rate*
Net initial yield 6.2 % 5.8 % 6.2 % Net initial yield 6.5 % 5.0 % 6.1 %
Office employment Office employment
Number 23,007 26,310 24,827 Number 79,201 94,062 86,619
27,052 2.8 % 100,194 6.5 %
Forecast Forecast
(2020) (2016 - 2020) (2020) (2016 - 2020)
Sectors Sectors
Public administ- 3% Public administ- -4 %
1,644 1,913 15,425 15,598
ration (2016 - 2020) ration (2016 - 2020)
Other high-end -30 % Other high-end 7%
2,470 1,753 4,052 5,105
corp. serv. (2016 - 2020) corp. serv. (2016 - 2020)
3% 13 %
TMT 2,894 3,306 TMT 9,674 12,837
(2016 - 2020) (2016 - 2020)
Local companies Local companies
Pharma Industry; Automotive Suppliers; Food Industry; Mechanical Engineering; He-
Key clusters Key clusters
Plastic Industry alth Economy
– Bayer AG – Alexianer GmbH
Local companies – Covestro AG Local compa- – STRABAG Proberty and Facility Service
(selected) – Currenta GmbH & Co. OHG nies (selected) GmbH
– Universitätsklinikum Münster
Projects of new construction (selected) from 5,000 sqm
RA-C (07 - 20) Projects of new construction (selected) from 5,000 sqm
Due to the heavily industrialised character of the city, its office RA-C (07 - 20)
market is dominated by public and industrial administrative Münster has the most important office market in the region.
functions. It is also characterised by standard market action The office market of Münster is generally small-scale and do-
and dominated by owner-occupancy, apart from a few excepti- minated by local occupiers. The largest building project of the
ons. In the time since 2016, two major development projects last ten years were the office high-rises of Deutsche Telekom,
noticeably stimulated the market action, one being the Med which were completed as early as 2007, and which delivered
360°, the other the head office of the recently relocated health about 27,000 sqm RA-C. Two of the most striking future pro-
insurance company pronova BKK. The largest construction jects are the schemes Quartier 21 with around 7,500 sqm RA-
project of the past ten years created the new administrative C and Hafentor with around 10,000 sqm RA-C.
building of Bayer Vital GmbH (about 21,500 sqm RA-C).
* in RA-C
© bulwiengesa AG 2017 – P1704-3567 Page 19SURVEY bulwiengesa
INVESTMENT OPPORTUNITIES IN GERMAN SECONDARY OFFICE LOCATIONS
Osnabrück Regensburg (Demire asset)
Key figures office market (Source: RIWIS) Key figures office market (Source: RIWIS)
Average Average
2007 2016 2007 2016
2007 - 2016 2007 - 2016
Total office 843,800 sqm 910,800 sqm 875,500 sqm Total office 944,729 sqm 1,035,920 sqm 992,910 sqm
stock* stock*
Office take-up* 25,000 sqm 15,000 sqm 26,600 sqm Office take-up* 30,000 sqm 20,000 sqm 25,000 sqm
New office spa- New office spa-
11,900 sqm 8,000 sqm 9,780 sqm 32,087 sqm 7,500 sqm 14,533 sqm
ce added* ce added*
Average rent 6.60 euros/ 8.30 euros/ 7.60 euros/ Average rent 7.30 euros/ 9.30 euros/ 8.20 euros/
(CBD)* sqm sqm sqm (CBD)* sqm sqm sqm
Office vacancy Office vacancy
30,000 sqm 33,000 sqm 33,315 sqm 80,000 sqm 57,000 sqm 66,900 sqm
rate* rate*
Net initial yield 6.4 % 5.7 % 6.4 % Net initial yield 6.1 % 5.1 % 5.8 %
Office employment Office employment
Number 35,588 38,632 37,356 Number 43,775 52,124 47,236
39,332 1.8 % 56,377 8.2 %
Forecast Forecast
(2020) (2016 - 2020) (2020) (2016 - 2020)
Sectors Sectors
Public administ- -4 % Public administ- 2%
4,960 4,841 5,618 6,192
ration (2016 - 2020) ration (2016 - 2020)
Other high-end 19 % Other high-end 18 %
2,827 4,487 4,731 6,128
corp. serv. (2016 - 2020) corp. serv. (2016 - 2020)
4% 13 %
TMT 1,960 2,238 TMT 5,494 7,218
(2016 - 2020) (2016 - 2020)
Local companies Local companies
Steel and Metal Industry; Paper Industry; Automotive Industry; Life Science; Logistics;
Key clusters Key clusters
Automotive Industry Energy
– Hellmann Worldwide Logistics GmbH & – Barmherzige Brüder gemeinnützige Kran-
Co. KG Local compa- kenhaus GmbH
Local compa- – Kämmerer Paper GmbH
nies (selected) nies (selected) – Maschinenfabrik Reinhausen GmbH
– Paracelsus-Kliniken Deutschland GmbH – Bayerische Staatsforsten AöR
& Co. KGaA
Projects of new construction (selected) from 5,000 sqm
Projects of new construction (selected) from 5,000 sqm
RA-C (07 - 20)
RA-C (07 - 20) The market action in Regensburg in recent years has been
The building activity in Osnabrück is on a moderate level and characterised by successive one-off developments in response
defined both by owner-occupancy and prelet new buildings. to actual demand. Among the largest building projects underta-
The next few years are expected to bring a constant level of ken in recent years was the new plant of the Bayernwerk utility
construction, specifically on the former barracks grounds. company (completed: 2011, floor area: about 20,000 sqm RA-
C). The Marina Quartier development includes 15,000 sqm
RA-C in office units in addition to residential units, to be com-
pleted by 2018.
* in RA-C
© bulwiengesa AG 2017 – P1704-3567 Page 20You can also read