2018 Rankings Summary Report - ACSM American Fitness Index
←
→
Page content transcription
If your browser does not render page correctly, please read the page content below
ACSM               2018 Rankings
                         American           Summary Report
                         Fitness Index
                                       ®

                           www.americanfitnessindex.org

RGB
Blue R-10 G-121 B-193
Gray R-136 G-138 B-140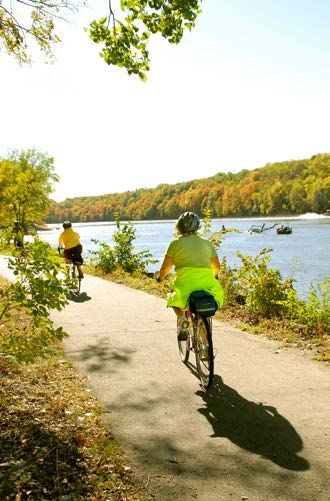
Acknowledgements
The ACSM American Fitness Index is generously supported by a grant from the Anthem Foundation. The
opinions expressed in this report are those of the authors and do not necessarily reflect the views of the
Anthem Foundation.

Report Authors
• Gretchen S. Patch, M.P.H., Director, Strategic Health Programs, American College of Sports Medicine
• Terrell W. Zollinger, Dr.P.H. Professor Emeritus, Indiana University Richard M. Fairbanks School of Public
   Health; Principal, T. Zollinger and Associates, LLC
• Jessica M. Coffing, M.P.H., Research Associate, T. Zollinger and Associates, LLC
• Derek A. Zollinger, M.S., Data Analyst, T. Zollinger and Associates, LLC
• Barbara E. Ainsworth, Ph.D., M.P.H., FACSM, FNAK, Regents Professor, Arizona State University

Advisory Board
ACSM greatly appreciates the contributions of Fitness Index Advisory Board members:

•  Chair: Barbara E. Ainsworth, Ph.D., M.P.H., FACSM, FNAK, Arizona State University
•   Steven N. Blair, P.E.D., FACSM, University of South Carolina
•    John M. Jakicic, Ph.D., FACSM, University of Pittsburgh
•     Elizabeth A. Joy, M.D., M.P.H., FACSM, Intermountain Healthcare/University of Utah School of Medicine
•      NiCole R. Keith, Ph.D., FACSM, Indiana University/Regenstrief Institute, Inc.
•       Roseann M. Lyle, Ph.D., FACSM, Purdue University
•        Melinda M. Manore, Ph.D., R.D., CSSD, FACSM, Oregon State University
•         Kenneth E. Powell, M.D., M.P.H., FACSM, Epidemiologic and Public Health Consultant
•          Angela D. Smith, M.D., FACSM, Nemours/Alfred I. duPont Hospital for Children, Thomas Jefferson
            University
• Walter R. Thompson, Ph.D., FACSM, Georgia State University
• Stella L. Volpe, Ph.D., R.D.N., L.D.N., FACSM, Drexel University
• Kathleen B. Watson, Ph.D., U.S. Centers for Disease Control and Prevention

The report authors, the Fitness Index Advisory Board, and ACSM would like to thank the individuals and
communities that contributed to the stories included in this report.

Recommended citation: American College of Sports Medicine. ACSM American Fitness Index 2018
Rankings Summary Report.                                                   ACSM
                                                                           American
Questions and comments on the ACSM American Fitness Index or this report should be directed to the
                                                                           Fitness Index
                                                                                                                ®
American College of Sports Medicine at afi@acsm.org.

                                                                                 ACSM
                                                                                 American
                                                                                 Fitness Index
                                                                                                                ®

                                                Actively Moving America to Better Health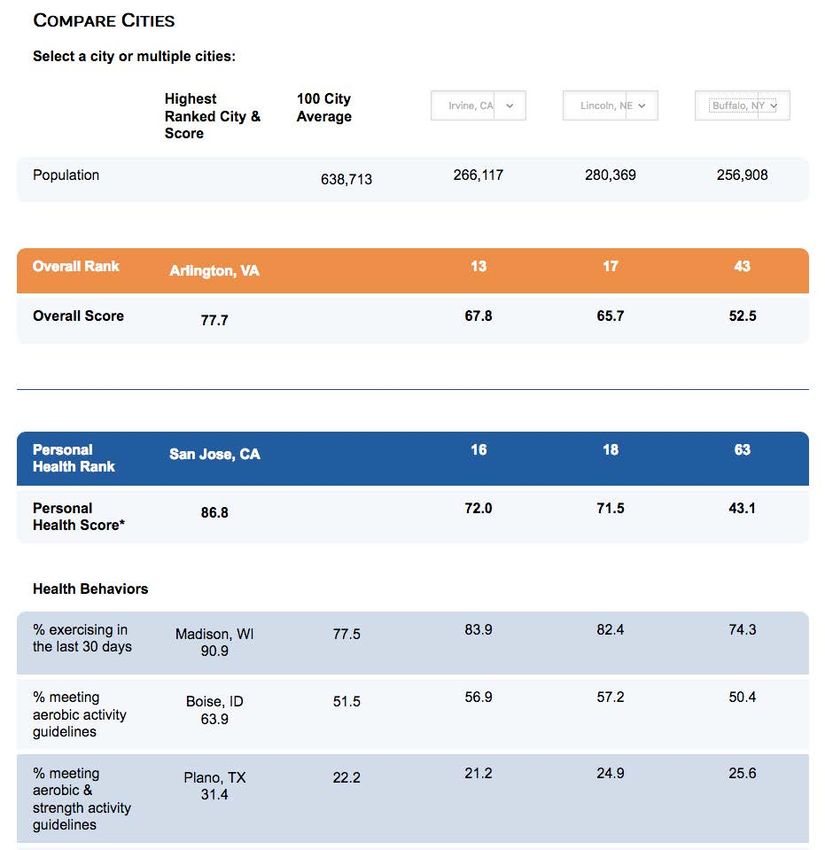
RGB                 May 2018
Blue R-10 G-121 B-193
Gray R-136 G-138 B-140

                    Dear Colleagues:

                    This year’s edition of the American College of Sports Medicine’s (ACSM) American Fitness Index® brings a
                    very exciting change. For the first time ever, the Fitness Index has expanded from 50 metropolitan service
                    areas to the 100 largest U.S. cities! Our ability to positively impact more communities and residents has never
                    been greater.

                    With great anticipation, we begin our second decade as the sole sponsor of the Fitness Index. This year’s report
                    takes a fresh approach by focusing on informing, engaging and building healthier, more active cities. Using a
                    methodology that includes a composite of health behaviors, chronic diseases and community infrastructure,
                    the Fitness Index assesses the fitness ranking of 100 cities. This data can be used by these cities to expand
                    local capacity and partnerships to implement policy and infrastructure changes that facilitate physically active
                    lifestyles for their residents.

                    Through our longstanding partnership with ACSM, the Anthem Foundation has successfully promoted better
                    fitness and health with the Fitness Index. An extensive strategic plan and effective communications help reach
                    millions of people with key messages regarding the Fitness Index, making it one of the most recognized and
                    reliable measures of community fitness. This allows us to recognize achievements and stimulate community
                    action based on credible scientific data.

                    This year, we want to congratulate Arlington, Virginia as the number one fittest city in the U.S. Arlington led
                    Minneapolis and Washington D.C. in the top three in 2018. Achieving a balance of both healthy behaviors
                    and community infrastructure, as well as ranking in the top 10 for 13 of the 33 indicators, Arlington performed
                    extremely well against the expanded list of cities and sets a high standard for the future.

                    Together, ACSM and the Anthem Foundation are confident that our new approach helps us achieve an even
                    higher standard of quality results. Expanding to the 100 largest U.S. cities allows us to be more inclusive in the
                    number of communities we can impact, recognizing that central cities and surrounding suburban areas have
                    different health behaviors and community-level infrastructure to support physical activity. In the end, better
                    data will lead to better outcomes for more communities.

                    As always, thank you for your interest in the ACSM American Fitness Index, sponsored by the Anthem
                    Foundation. We encourage you to use and share this year’s report to help improve your community. To learn
                    more, please visit AmericanFitnessIndex.org.

                    Sincerely,

                    Craig Samitt, M.D.
                    Chief Clinical Officer
                    Anthem, Inc.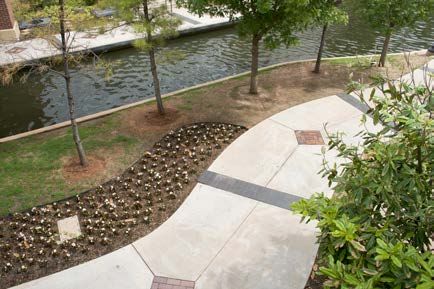
Need for Action                                                                 Physical activity. Any
Regular physical activity is one of the most important ways people can          bodily movement produced by the
improve and maintain their health.1-4 Media messages encouraging                contraction of skeletal muscle that
exercise and advertisements for fitness-related gear have become                increases energy expenditure above
commonplace as health organizations and businesses recognize the                a basal level.
growing interest in adopting healthy behaviors. While a significant             Exercise. A subcategory of
proportion of Americans are physically active, less than 25 percent of          physical activity that is planned,
adults meet national physical activity guidelines.2 With obesity rates          structured, repetitive, and purposive
climbing to 40 percent of adults and obesity-related medical costs              in the sense that the improvement
exceeding $147 billion yearly, increasing physical activity has never           or maintenance of one or more
been more important to the nation’s health and economic outcomes.5-6            components of physical fitness is the
                                                                                objective.
    Physical Health
    For adults, regular exercise can reduce the risk of premature               Physical fitness. The ability to
    death, heart disease, stroke, high blood pressure, Type 2 diabetes,         carry out daily tasks with vigor and
    breast cancer, colon cancer, and the risk of falls. For children            alertness, without undue fatigue,
    and adolescents, regular physical activity can decrease body fat            and with ample energy to enjoy
    and improve bone health, cardiorespiratory fitness and muscular             leisure-time pursuits and respond
    strength.1-4                                                                to emergencies. Physical fitness
                                                                                includes a number of components
    Mental and Social Health                                                    consisting of cardiorespiratory
    Beyond physical health benefits, regular exercise and physical              endurance (aerobic power),
    activity also provide mental and social health benefits including           skeletal muscle endurance, skeletal
    decreasing the risk of depression in adults and reducing depression         muscle strength, skeletal muscle
    symptoms and stress in young people.8-11 Designing spaces with              power, flexibility, balance, speed of
    parks, green spaces, trails, and bike lanes can not only increase           movement, reaction time, and body
    physical activity, but also increase a sense of community cohesion          composition.
    and improve public perception of a city.12-16                               —Centers for Disease Control and
                                                                                  Prevention (CDC)7
    Economic Health
    Physical activity isn’t only good for health, it’s good for a city’s
    bottom line. There is strong evidence of significant economic
    benefits of local policies and city planning that support physical activity, walkability, and bikeability. Well-
    designed cities experience increased home values, retail activity, as well as business and job growth.15, 17-18

Emerging public health research suggests that to improve health and fitness, prevent disease and disability,
and enhance quality of life for all Americans through physical activity, we must create a culture that integrates
physical activity into our daily lives.2

  “The health and economy of communities are often strongly correlated. Healthier
  communities tend to be economically more prosperous and vice versa. Improved
 community conditions for health, such as clean and safe neighborhoods, access to
 healthful food options, and opportunities for exercise and physical activity, can help
   positively influence health behaviors and lead to a more productive workforce.’’

                                         VADM Jerome M. Adams, M.D., MPH
                                            20th U.S. Surgeon General19

4                                                                ACSM American Fitness Index® 2018 Rankings Summary Report
ACSM American Fitness Index Approach
The ACSM American Fitness Index (Fitness Index) celebrates healthy, active lifestyles and encourages city
leaders to enact policies and make system changes to promote these behaviors. The Fitness Index focuses on
three strategies to support this effort:

      1. Inform: Demonstrate the health, social, and economic benefits of physical activity as well as the
          policies and infrastructure that promote healthy behaviors.
          The Fitness Index, in partnership with the Anthem Foundation, now ranks the 100 largest cities in
          the United States on a composite of health behaviors, chronic diseases, and community infrastructure.
          These rankings give city leaders the necessary information to improve their residents’ health through
          local policies and system changes.

      2. Engage: Inspire city leaders and residents to celebrate the factors that contribute to their city’s culture
          of health and fitness.
          The Fitness Index has a strong history of sharing the annual rankings, as well as success stories from
          cities making healthy changes, through strategic dissemination and communications planning. Using
          traditional and social media, it is estimated that the Fitness Index reaches 355 million people annually
          to recognize achievements as well as stimulate community action and advocacy based on the most
          recent scientific data available.

      3. Build: Expand local capacity and partnerships to implement policy and infrastructure changes to
          facilitate a physically active lifestyle for all residents.
          The Fitness Index is more than an annual ranking of cities. Since 2011, the Fitness Index has provided
          direct assistance and support to low-ranking cities and to cities needing help to improve their ranking.
          This tailored support helps city leaders identify opportunities for improvement and to create plans for
          implementing changes.
          City leaders can also access Fitness Index resources like the Community Action Guide and the My AFI
          Community Application Toolkit. These tools allow any city, regardless of whether it is in the Fitness
          Index rankings, to assess its local health and fitness to develop and implement plans for improvement.

The Fitness Index approach aligns with the American College of Sports Medicine’s work to address health and
fitness through research and education. After all, the journey to a healthier future begins where we live, learn,
work and play. The Fitness Index indicators address social and physical environments that promote good health
for all.20

     “The ACSM American Fitness Index provides opportunities for ACSM members
         to get involved with people and groups in their community to enhance
                     physical activity and adopt healthful behaviors.’’

                          Barbara E. Ainsworth, Ph.D., MPH, FACSM, the 55th President of the
                            American College of Sports Medicine (2011-2012), chair of the
                         ACSM American Fitness Index Advisory Board, and Regents professor at
                                               Arizona State University

Actively Moving America to Better Health                                                                                5
Methodology
In the first 10 years of the Fitness Index, the rankings acknowledged the interaction between the central city
and the surrounding suburban areas. The results provided in earlier years included measures and rankings of
the entire metropolitan statistical areas (MSA) for the 50 largest cities in the United States. This approach
provided important and valuable general messages, but limited the ability to provide targeted assistance to city
and community leaders that need specific data at the local level.21-23

Understanding that the central city and surrounding suburban areas may have different health behaviors and
community-level infrastructure to support physical activity, for the first time the Fitness Index focuses on
cities rather than metro areas with the 2018 rankings. This approach distinguishes the largest suburbs from the
central cities in the same metro areas. The expanded report now covers the 100 largest U.S. cities and provides
a more inclusive approach by adding cities in states that weren’t represented previously.

The updated analysis included city-level data for all community/environment indicators. Personal health
indicator data were analyzed for the county(ies) where the city proper was located.* Groups of counties were
used when the city limits extend across county lines. For example, the city of Denver, CO is located only
in Denver County; however, New York City, NY is located in the
five counties of Bronx, Kings, New York, Queens, and Richmond.
The updated method allows the Fitness Index to target assistance                 7
                                                                               Health
to specific city leaders and community-based organizations. It also          Behaviors
provides more local-level data that city leaders need to implement                         Personal
targeted, healthy policies and programs.                                                    Health
                                                                                                                          Subscore
                                                                                                          9
The 2018 Fitness Index was calculated using 33 indicators from                                         Health
                                                                                                      Outcomes
reliable, publicly accessible, and up-to-date sources. Indicators were
combined to create sub-scores for personal health and community
and environment indicators. Individual indicators were weighted                                           7
relative to their impact on community fitness, converted to ranks, and                                   Built                            Total
                                                                                                     Environment                          Score
combined in a straight-forward manner described in the methodology
section on the website. The two sub-scores were then combined to
form the total score.
                                                                                                           8
                                                                                                      Recreational       Community/
                                                                                                        Facilities       Environment
Although the analysis changed how cities were defined, the statistical                                                    Subscore
methodology to produce the Fitness Index scores and rankings
remains unchanged from previous years.** For more information on                                          2
the development of the Fitness Index, including indicator selection,                                   Policy/
data sources, and counties included in the analysis, please visit:                                     Funding
www.americanfitnessindex.org/methodology.

*There was an insufficient number of BRFSS survey respondents from Webb County where Laredo, Texas, is located to report health measures for
  only Webb County. To obtain the minimum amount of responses required by CDC for data reporting, the geographical area was expanded to
  include the six adjacent counties: Dimmit, Duval, LaSalle, Jim Hogg, Maverick, and Zapata. All of the other indicator data are for the city of Laredo
  only.

**Due to updates to the Fitness Index, comparisons between 2018 and previous years should be avoided.

6                                                                                 ACSM American Fitness Index® 2018 Rankings Summary Report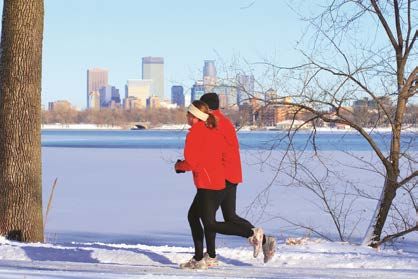
Fitness Index Indicators

Personal Health Indicators                           Community/Environment Indicators

Health Behaviors                                     Built Environment

% any exercise in the last 30 days                   Parkland as % of city

% meeting aerobic activity guidelines                Acres of parkland/1,000 residents

% meeting aerobic & strength activity guidelines     Farmers’ markets/1,000,000 residents

% consuming 2+ fruits/day                            % using public transportation to work

% consuming 3+ vegetables/day                        % bicycling or walking to work

% getting 7+ hours of sleep/day                      Walk Score®

% smoking                                            % within a 10-minute walk to a park

Health Outcomes                                      Recreational Facilities

% with obesity                                       Ball diamonds/10,000 residents

% in excellent or very good health                   Dog parks/100,000 residents

% physical health not good during the past 30 days   Park playgrounds/10,000 residents

% mental health not good during the past 30 days     Basketball hoops/10,000 residents

% with asthma                                        Park units/10,000 residents

% with high blood pressure                           Recreational centers/20,000 residents

% with angina or coronary heart disease              Swimming pools/100,000 residents

% with stroke                                        Tennis courts/10,000 residents

% with diabetes                                      Policy & Funding

                                                     Park expenditure/resident (adjusted)

                                                     Physical education requirement

Actively Moving America to Better Health                                                     7
Rankings
The 2018 ACSM American Fitness Index ranked Arlington, VA as the fittest city in America. Cities with
the highest scores are considered to have strong community fitness, a concept analogous to individuals having
strong personal fitness. Cities that rank near the top of the Fitness Index have more strengths and resources that
support healthy living and fewer challenges that hinder it. The opposite is true for cities near the bottom of the
rankings.

Additional information, including sub-scores and individual city data, is available in a new, interactive table on
the website: www.americanfitnessindex.org/rankings.

Overall Rank            City           Overall Score       Overall Rank              City             Overall Score
       1        Arlington, VA                77.7                 26         Durham, NC                     57.2
       2        Minneapolis, MN              77.2                 27         Sacramento, CA                 57.1
       3        Washington, D.C.             74.0                 28         Albuquerque, NM                57.0
       4        Madison, WI                  72.4                 29         Cincinnati, OH                 57.0
       5        Portland, OR                 71.6                 30         Virginia Beach, VA             56.9
       6        Seattle, WA                  71.5                 31         Dallas, TX                     56.7
       7        Denver, CO                   70.2                 32         Chicago, IL                    56.7
       8        St. Paul, MN                 70.2                 33         Omaha, NE                      55.8
       9        San Jose, CA                 69.8                 34         Milwaukee, WI                  55.8
      10        Boise, ID                    69.2                 35         Chula Vista, CA                55.3
      11        Oakland, CA                  68.5                 36         Pittsburgh, PA                 55.1
      12        Plano, TX                    67.9                 37         Tampa, FL                      55.0
      13        Irvine, CA                   67.8                 38         Orlando, FL                    54.8
      14        San Francisco, CA            67.3                 39         Long Beach, CA                 54.8
      15        Boston, MA                   67.1                 40         Santa Ana, CA                  53.7
      16        San Diego, CA                66.4                 41         Anaheim, CA                    52.8
      17        Lincoln, NE                  65.7                 42         Austin, TX                     52.5
      18        Raleigh, NC                  62.9                 43         Buffalo, NY                    52.5
      19        Fremont, CA                  62.3                 44         Norfolk, VA                    51.9
      20        Atlanta, GA                  61.5                 45         New Orleans, LA                51.8
      21        Anchorage, AK                60.6                 46         Honolulu, HI                   51.5
      22        Aurora, CO                   60.5                 47         Tucson, AZ                     51.5
      23        St. Petersburg, FL           60.4                 48         Reno, NV                       50.0
      24        Colorado Springs, CO         58.1                 49         Cleveland, OH                  49.2
      25        Miami, FL                    57.4                 50         Los Angeles, CA                48.9

8                                                              ACSM American Fitness Index® 2018 Rankings Summary Report
All cities are commended for their achievements and
encouraged to use the Fitness Index findings to track
and focus their efforts to achieve a more healthy and
active population.

Overall Rank                   City                Overall Score             Overall Rank                   City                 Overall Score
        51           Garland, TX                          48.9                        76           Chandler, AZ                        40.9
        52           New York, NY                         48.6                        77           Corpus Christi, TX                  40.6
        53           Hialeah, FL                          48.2                        78           Baltimore, MD                       40.5
        54           Irving, TX                           48.1                      79.5           Columbus, OH                        40.3
        55           Richmond, VA                         47.7                      79.5           El Paso, TX                         40.3
        56           Fort Worth, TX                       47.6                        81           Mesa, AZ                            40.2
        57           St. Louis, MO                        47.4                        82           Philadelphia, PA                    39.8
        58           Glendale, AZ                         47.3                        83           Arlington, TX                       39.7
        59           Charlotte, NC                        47.2                        84           Fort Wayne, IN                      39.2
        60           Houston, TX                          46.9                        85           Stockton, CA                        38.8
        61           Scottsdale, AZ                       46.9                        86           Newark, NJ                          38.6
        62           Riverside, CA                        45.8                        87           Lubbock, TX                         36.6
        63           Las Vegas, NV                        45.1                        88           Memphis, TN                         35.5
        64           Jacksonville, FL                     45.0                        89           Laredo, TX                          34.9
        65           Nashville, TN                        44.2                        90           Winston-Salem, NC                   34.5
        66           Bakersfield, CA                      44.0                        91           Tulsa, OK                           34.4
        67           Baton Rouge, LA                      43.4                        92           North Las Vegas, NV                 34.0
        68           San Antonio, TX                      43.4                        93           Gilbert, AZ                         33.5
        69           Jersey City, NJ                      43.2                        94           Fresno, CA                          33.0
        70           Lexington, KY                        42.9                        95           Wichita, KS                         32.5
        71           Greensboro, NC                       42.8                        96           Toledo, OH                          30.3
        72           Phoenix, AZ                          42.5                        97           Detroit, MI                         30.0
        73           Henderson, NV                        42.4                        98           Louisville, KY                      27.0
        74           Kansas City, MO                      41.5                        99           Indianapolis, IN                    26.9
        75           Chesapeake, VA                       41.5                       100           Oklahoma City, OK                   26.3

Scores have been rounded to the nearest tenth of a point resulting in some apparent ties; however, the rankings are based on the full calculated
score values that were not equal in those cases.

Actively Moving America to Better Health                                                                                                           9
Summary of Findings
Good health starts in our homes, schools, and communities. That’s why the Fitness Index looks at both
personal health indicators, meaning what we’re doing individually to get and stay healthy, as well as the built
environment indicators like parks, playgrounds, and recreation centers that help us do so.

Arlington, VA’s balance of both healthy behaviors and community infrastructure earned them the #1 rank
in the 2018 ACSM American Fitness Index with a score of 77.7. While they ranked #4 in personal health
and #5 in community sub-scores, the balance of their combined score was enough to edge out #2 ranked
Minneapolis, MN’s overall score of 77.2. Balancing healthy behaviors and community infrastructure was a
common characteristic of cities that ranked in the top 25 overall.

Arlington, VA ranked #1 in good/excellent health & low
smoking rates

                                  Arlington, VA                100 City Average                  Lowest Ranked City

% Very Good or Excellent Health                   63.9                         51.9                       23.5

                    % Smoking       5.9                             15.0                                   25.7

Arlington, VA also ranked in the top 10 cities for 11 other indicators in the Fitness Index:
  • residents meeting aerobic and strength activity guidelines
  • low levels of residents with obesity, high blood pressure, and diabetes
  • number of farmers markets, local parks, dog parks, and tennis courts
  • residents that live within a 10-minute walk to a park
  • funding for public parks
  • high use of public transportation

While Minneapolis, MN and Washington, D.C. ranked #2 and #3 respectively, Madison, WI’s #4 ranking
stands out in the 2018 Fitness Index. Madison ranked among the top 10 for 13 of the 33 total indicators in
the Fitness Index and scored highest on four personal health indicators and three community/environmental
indicators.

10                                                            ACSM American Fitness Index® 2018 Rankings Summary Report
Madison, WI ranked #1 in seven indicators
Madison, WI ranked #1 in seven indicators
Personal Health Lowest Ranked Madison, WI
City
% Any Exercise Last 30 Days 56.7 90.9
49.9 74.3
% Sleeping 7+ Hours
% High Blood Pressure 18.5 39.7
0.7 9.6
% Stroke
Community/ Lowest Ranked Madison, WI
Environment City
Park Units/10,000 1.2 11.6
Basketball Hoops/10,000 0.2 9.8
0.7 7.1
Playgrounds/10,000
City vs. MSA
While direct comparisons cannot be made between Fitness Index scores for MSAs and cities, this year’s
rankings indicate that for MSAs that were ranked high in the 2017 Fitness Index, the central cities of those
MSAs are also ranked high in the 2018 rankings. Similarly, for MSAs ranked low in the 2017 Fitness Index,
the central cities of those MSAs were also ranked low in the 2018 rankings. Of the 73 central or suburban cities
represented in both the 2017 and 2018 rankings, 41 (56 percent) were in the same quartile both years,
19 (26 percent) improved from a lower quartile to a higher one, and 13 (18 percent) slipped from a higher
quartile to a lower one.
One notable example is Plano, TX, which ranked #12 in the 2018 rankings of the 100 largest cities; in 2017
it was part of the Dallas MSA that was ranked #38. Plano, TX outscored neighboring cities in most of the
personal health indicators, but not in community/environment indicators. This reflects the Fitness Index’s
maxim that every city has something to celebrate and something that may be improved.
Actively Moving America to Better Health 11Cities that Inspire
Arlington, VA
Community Engagement &
Coalition Building
Arlington, VA is home to the Pentagon, Arlington National Cemetery, Civil War battlefields, great
local parks, as well as many people living healthy lifestyles that contribute to their #1 ranking in the
2018 American Fitness Index. In addition, Arlington is currently engaging community members to
identify the key issues that impact children’s health. With 26 percent of pre-kindergarten children
having an unhealthy weight, Arlington is building a plan to address the barriers families face to
leading healthy, active lifestyles. This comprehensive planning will propose a range of strategies to
address the barriers while engaging the community, local coalitions, and policymakers. Arlington,
like so many communities, benefits from the collective impact of local organizations that are
working toward common goals.
49 miles of paved
multi-use trails
Arlington, VA
1 of 15 communities
awarded Gold Walk
Friendly Community
from Pedestrian and
Bicycle Information Silver Level Bike
Center (PBIC) Friendly Community
from League of
American Bicyclists
12 ACSM American Fitness Index® 2018 Rankings Summary ReportCities that Inspire
Washington, D.C.
Private/Public Partnerships &
Social Media
After holding the title of “America’s Fittest City” for three consecutive years, Washington, D.C.
came in second to Minneapolis, MN in the 2017 American Fitness Index rankings. VIDA Fitness,
a D.C.-based fitness studio, partnered with Mayor Muriel Bowser’s #FITDC movement and
D.C. Department of Parks and Recreation to launch the Take Back #1 Campaign. Through this
community-wide effort to regain the top spot, VIDA and D.C. Parks Department offer a series of
free workouts, walks and runs, nutrition seminars, and health expos to help D.C. residents jump-
start and maintain their exercise programs. This private-public partnership is a great example of
how to use the Fitness Index to rally a community to healthy action.
100% of D.C.
residents live
within 2 miles of a
recreation center
70+ miles
of bike lanes
Washington, DC
1,100+ bikes
available after
expanding bike
sharing system
Actively Moving America to Better Health 13Personal Health
The Fitness Index’s personal health indicators range from individual health behaviors to health outcomes
including self-reported perceptions of physical and mental health.
San Jose, CA, ranked #9 overall, ranked #1 across the collective personal health indicators with a score of 86.8.
While San Jose, CA didn’t rank at the top of any one indicator, they ranked among the top 10 cities for eight of
16 personal health indicators, including high rates of aerobic and strength activity, vegetable consumption and
low rates of smoking, obesity, asthma, high blood pressure, and stroke.
Physical Activity
ACSM and CDC recommend at least
On average, 77.5 percent of adults in the 100 largest cities in the US 150 minutes per week of moderate-
reported engaging in any physical activity in the previous month, with intensity aerobic activity, 75 minutes
only 51.5 percent meeting aerobic activity guidelines and of vigorous aerobic activity, or a
22.2 percent meeting guidelines for both aerobic and strength combination of both for adults. They
activities. also suggest muscle strengthening
twice a week.24-25
77.5%
of adults reported
any physical activity
last month
51.5%
of adults met
aerobic activity
guidelines
14 ACSM American Fitness Index® 2018 Rankings Summary Report22.2% of adults met aerobic activity & strength guidelines Madison, WI residents reported the most physical activity with 90.9 percent exercising in the previous month, while Boise, ID topped the charts for aerobic activity with 63.9 percent meeting guidelines. Plano, TX scored highest for residents meeting both aerobic and strength activity guidelines at 31.4 percent. Denver, CO and Boise, ID, respectively ranked #7 and #10 overall, ranked in the top ten for all three physical activity indicators. Top 10 Most Active Cities Any Exercise Aerobic Activities Aerobic & Strengthening Activities 1. Madison, WI 1. Boise, ID 1. Plano, TX 2. Portland, OR 2. San Diego, CA 2. Arlington, VA 3. Boise, ID 3. Chula Vista, CA 3. Boise, ID 4. Seattle, WA 4. San Jose, CA 4. Denver, CO 5. Charlotte, NC 5. Seattle, WA 5. Reno, NV 6. Raleigh, NC 6. Reno, NV 6. San Jose, CA 7. Minneapolis, MN 7. San Francisco, CA 7. Virginia Beach, VA 8. Colorado Springs, CO 8. Portland, OR 8. Colorado Springs, CO 9. Durham, NC 9. Madison, WI 9. St. Petersburg, FL 10. Denver, CO 10. Denver, CO 10. Albuquerque, NM In cities ranked in the top 25 overall, 82.0 percent of the residents on average reported engaging in any exercise in the previous month with an average of 24.6 percent meeting aerobic and strength guidelines. This exceeded the physical activity of residents in cities ranked in the last quartile which averaged 73.6 percent exercising in the previous month and 19.9 percent meeting aerobic and strength guidelines. Across all cities there is a need to increase strengthening activities that contribute to increases in lean muscle mass and stronger bones. Actively Moving America to Better Health 15
Cities that Inspire

Indianapolis, IN
Getting Residents Outside

When was the last time you went outside to play — not
just to watch your kids play, but to engage in play yourself?
Indy Parks and Recreation is working to get residents out of
the house and into local parks and greenways. Leveraging                           “As we create places and
                                                                                   experiences that inspire,
a combination of funding sources and local partnerships,
                                                                                   Indy Parks wants to be seen
Indy Parks offers state-of-the-art playgrounds and innovative                      as a leader in health and
programming for all ages and abilities. This means offering                        wellness efforts. Every day,
classes and programs that include English country and                              our team offers a variety of
                                                                                   fitness options for residents
hip-hop dancing, jazz and Shakespeare in the park, art                             young and old to get and
and bird watching classes, and ensuring that children with                         stay healthy. From biking,
various disabilities have a safe place to play and explore                         walking, and running on our
                                                                                   135 miles of trails to taking a
through special sensory rooms. Using social media and
                                                                                   water aerobics class to simply
community engagement events, Indy Parks inspires residents                         discovering ways to exercise
to get outside and get active by making fitness fun and not                        in one or all of our 211 parks,
work.                                                                              Indy Parks is doing its part to
                                                                                   help children and their families
                                                                                   live healthier lives.”
                                                                                   —Linda Broadfoot, Director, Indy Parks
                                                                                     and Recreation

                                                Courtesy of Indy Parks and Recreation

Courtesy of Indy Parks and Recreation

16                                                          ACSM American Fitness Index® 2018 Rankings Summary Report
11,372 estimated
200+ miles of bike
jobs created by the
lanes planned over
world class Cultural
the next 12 years
Trail
Indianapolis, IN
Top 10 best
Complete Streets
policy awarded by
National Complete
Streets Coalition
Actively Moving America to Better Health 17Nutrition
A diet high in fruits and vegetables is widely recommended by health CDC recommends that
professionals. The Fitness Index scores show that adults tended to eat fruit more adults consume 1.5–2
regularly than vegetables. Across all 100 cities, an average of 30.0 percent of cups of fruit and 2–3 cups
adults reported eating at least two servings of fruits per day while only of vegetables daily.26
18.0 percent reported eating three or more servings of vegetables per day.
3 in 10 18%
adults reported eating 2+ of adults reported eating 3+ servings
servings of fruits/day of vegetables/day
Buffalo, NY, ranked #43 overall, was the leader in fruit consumption at 38.9 percent while San Francisco, CA,
ranked #14 overall, led in eating vegetables at 27.5 percent. Washington, D.C. and Reno, NV, ranked #48
overall, scored in the top 10 for both fruit and vegetable consumption.
Top 10 Fruit & Vegetable Consumers
2+ Fruits/Day 3+ Vegetables/Day
1. Buffalo, NY 1. San Francisco, CA
2. Denver, CO 2. Portland, OR
3. Chicago, IL 3. St. Petersburg, FL
4. Milwaukee, WI 4. Washington, DC
5. Reno, NV 5. Anchorage, AK
6. Stockton, CA 6. San Jose, CA
7. Oakland, CA 7. San Antonio, TX
8. Freemont, CA 8. Nashville, TN
9. Tampa, FL 9. Austin, TX
10. Washington, DC 10. Reno, NV
In cities ranked in the top 25 overall, an average of 32.4 percent of residents reported eating two or more
servings of fruit per day and 19.9 percent reported eating three or more servings of vegetables per day. Cities
ranked in the bottom quartile overall averaged 27.5 percent of residents eating two or more servings of fruit
and 16.2 percent of residents eating three or more servings of vegetables. As with strength activities mentioned
above, there is a need to increase fruit and vegetable consumption in all 100 cities.
Self-Care
Sleep, which is so important to physical and mental health, can be challenging to get in sufficient quantities.
On average, about two-thirds (65.4 percent) of residents in the 100 largest cities reported getting seven or more
hours of sleep per night. Madison, WI topped the charts with 74.3 percent of residents getting seven or more
hours of sleep. Laredo, TX, ranked #89 overall, came in second on this measure with 73.2 percent reporting
sleeping seven or more hours per night.
18 ACSM American Fitness Index® 2018 Rankings Summary ReportNot smoking or using tobacco products is an important 10.6%
way to support a healthy and active lifestyle. Arlington, VA
led the way with only 5.9 percent of residents smoking.
average smoking
The average smoking rate across all 100 Fitness Index rate in 16 largest
cities was 15.0 percent; the highest smoking rate was CA cities
25.7 percent. Seven California cities ranked in the top 10
for lowest smoking rates. The average smoking rate across
all 16 California cities in the Fitness Index was
10.6 percent, well below the average for all 100 cities.
Top 10 Cities for Self-Care
7+ Hours of Sleep Fewest Smokers
1. Madison, WI 1. Arlington, VA
2. Laredo, TX 2. San Jose, CA
3. Plano, TX 3. Stockton, CA
4. Minneapolis, MN 4. Irvine, CA
5. Aurora, CO 5. Santa Ana, CA
6. St. Paul, MN 6. Anaheim, CA
7. Lincoln, NE 7. Oakland, CA
8. Denver, CO 8. Fremont, CA
9. Seattle, WA 9. Durham, NC
10. Boise, ID 10. Seattle, WA
Health Outcomes
Cities in the top 25 overall also scored well in health outcomes, likely as a result of their healthy personal
behaviors and community resources. One interesting exception is mental health. Only three of the top 25
cities overall also ranked in the top 10 on the mental health indicator. The remaining seven cities ranked in the
bottom half of the overall rankings.
Lowest Rate of Poor Mental Health City Overall Rank
1. (tied) Miami, FL 25
1. (tied) Hialeah, FL 53
3. Chesapeake, VA 75
4. Plano, TX 12
5. Laredo, TX 89
6. Greensboro, NC 71
7. Jersey City, NJ 69
8. St. Petersburg, FL 23
9. Bakersfield, CA 66
10. Newark, NJ 86
Actively Moving America to Better Health 19On average, one-third (35 percent) of residents in all 100 cities reported that their mental health was not good
on at least one of the past 30 days. The top 25 cities averaged 35.8 percent of residents reporting poor mental
health in the past 30 days. In the city with the worst mental health rank, 44.1 percent of residents reported
experiencing poor mental health in the previous month.
“Even among the top cities, over one-third of residents report poor mental health.
And while research indicates a positive relationship between physical activity
and mental well-being, we know that mental health is impacted by a number of
other factors. Promoting a healthy lifestyle should be one part of a comprehensive
approach to improving mental health.’’
Chad Rethorst, Ph.D., University of Texas-Southwestern,
Exercise Is Medicine Ambassador Co-Chair
Heart disease is another indicator where cities outside of the top 25 scored well. Six of the top 10 cities with
the lowest rates of diagnosed angina or coronary heart disease fell in the bottom half of the overall rankings,
including five cities in Texas and four cities in California.
Lowest Rate of Heart Disease City Overall Rank
1. Fresno, CA 94
2. Fort Worth, TX 56
3. Oakland, CA 11
4. Fremont, CA 19
5. San Francisco, CA 14
6. New Orleans, LA 45
7. El Paso, TX 79.5
8. Arlington, TX 83
9. Plano, TX 12
10. Lubbock, TX 87
Lubbock, TX, ranked #87 overall, ranked among the top 10 for four health outcome indicators with high rates
of residents reporting good physical health and low rates of heart disease, diabetes, and stroke.
“If exercise could be packed in a pill, it would be the single most
widely prescribed and beneficial medicine in the nation.’’
Robert N. Butler, M.D.,
Former Director, National Institute on Aging
20 ACSM American Fitness Index® 2018 Rankings Summary ReportCommunity/Environment
The Fitness Index encourages local officials to implement policies, such as Complete Streets, that improve
the built environment for all residents. This includes the availability, maintenance, and improvement of
infrastructure like safe sidewalks, bike lanes, trails, parks, recreational centers, and ball fields and courts. This
infrastructure provides opportunities for better health and social outcomes as a result of play, recreation,
exercise, and active transportation such as walking or biking to school, work, and for daily errands.
Pittsburgh, PA, ranked #36 overall, ranked #1 in community/environment indicators with a score of 81.3.
Similar to San Jose, CA’s results in the personal health indicators, Pittsburgh, PA didn’t lead any single
indicator, but ranked in the top 10 for six of the 17 community/environment indicators, including number of
per capita farmers’ markets, residents walking or biking to work, public parks, ball diamonds, playgrounds, and
swimming pools.
Parks & Recreational Facilities
Parks and recreation facilities are important pieces of the built environment that support a community culture
of physical activity and healthy lifestyles. The number, location, and size of public parks are key factors in
residents being physically active on a regular basis. Anchorage, AK, ranked #21 overall, topped the list with
2992.9 park acres per 1,000 residents and 84.2 percent of the city allocated as parkland.
Parks/10,000 Residents Park Acres/1,000 Residents Parkland as % of City
1. Madison, WI 1. Anchorage, AK 1. Anchorage, AK
2. Arlington, VA 2. Chesapeake, VA 2. Fremont, CA
3. Cincinnati, OH 3. Scottsdale, AZ 3. Honolulu, HI
4. Atlanta, GA 4. Fremont, CA 4. North Las Vegas, NV
5. St. Petersburg, FL 5. Jacksonville, FL 5. Chesapeake, VA
6. Las Vegas, NV 6. New Orleans, LA 6. New Orleans, LA
7. Buffalo, NY 7. North Las Vegas, NV 7. Scottsdale, AZ
8. St. Paul, MN 8. Virginia Beach, VA 8. Albuquerque, NM
9. Anchorage, AK 9. Nashville, TN 9. San Diego, CA
10. Pittsburgh, PA 10. Albuquerque, NM 10. Irvine, CA
Excluding Anchorage, AK because its allocated park space was very large, the top 25 cities averaged 21.2 park
acres per 1,000 residents and 15.0 percent of the city as parkland. Cities in the bottom quartile averaged
15.8 park acres per 1,000 residents and 7.1 percent of the city as parkland.
Top 25 cities have more than
twice as much parkland 1st Quartile Cities 15.0%
as a percentage of the city
compared to cities in the 4th Quartile Cities 7.1%
lowest quartile.
*Excludes Anchorage, AK due to data outliers
Actively Moving America to Better Health 21Cities that Inspire Minneapolis, MN Local Coordination Building a culture of physical activity isn’t done overnight. Minneapolis, MN reaps the rewards of early planning to set aside important parklands and establish a semi-autonomous parks board to maintain and protect the lands. Featuring over 6,800 acres in the park system and 102 miles of biking and walking paths, Minneapolis Parks and Recreation Board (MPRB) is once again looking to the future by thinking differently about local investment and access to infrastructure. Using innovative funding mechanisms, joint use agreements with schools, and community collaborations, MPRB is working to ensure all neighborhoods have access to parks, recreation centers, and other park amenities — specifically neighborhoods that have historically lacked access. These efforts are in line with city departments that are also working toward similar equity efforts. The public works and health department serve critical roles in assessing asset conditions, transportation needs, air quality, and environmental impacts that support active transportation and recreation. In addition to Complete Streets infrastructure like safe sidewalks, bike lanes, and lighting, they also provide walking and biking activities, programming, and events to benefit residents from all neighborhoods. Beyond collaboration between agencies and city departments, Minneapolis has a strong culture of local civic engagement. This resident-driven advocacy ensures elected officials value and prioritize policies and funding that support a physically active city. Courtesy of Meet Minneapolis Minneapolis Parks and Recreation, Courtesy of Meet Minneapolis 22 ACSM American Fitness Index® 2018 Rankings Summary Report
75 miles of bikes
     lanes and trails
    added in the past
        six years

                                           Minneapolis, MN

   Gold Level Bicycle
  Friendly Community
    Award from the
  League of American
        Bicyclists

                                                             18% of Minneapolis
                                                                Public School
                                                             students live within
                                                                  an easily
                                                              walkable distance
                                                                  to school

Actively Moving America to Better Health                                        23
Active Transportation
Proximity to work, school, retail, and entertainment facilitates residents using active transportation. Across
all 100 cities, an average of 4.6 percent of residents walk or bike to work and 65.7 percent are located within
a 10-minute walk to a park. Cities in the top 25 overall averaged 7.1 percent of residents walking or biking to
work and 81.0 percent located within a 10-minute walk to a park. Cities in the bottom quartile averaged
2.9 percent of residents walking or biking to work and 56.5 percent located within a 10-minute walk to a park.
4.6% 65.7%
of residents of residents are located
walk or bike to work within a 10-minute walk
to a park
Five cities ranked in the top 10 for walkability, residents that walk or bike to work, and parks located within a
10-minute walk from residential areas. Washington, D.C. led the way with 18.3 percent of residents walking
or biking to work and 97.4 percent of parks located within a 10-minute walk. Washington, D.C. also ranked in
the top 10 for park expenditures, swimming pools, recreation centers, use of public transportation, and farmers
markets.
Walkability Score Walk or Bike to Work Parks within 10-minute walk
1. New York, NY 1. Washington, DC 1. San Francisco, CA
2. Jersey City, NJ 2. Boston, MA 2. Boston, MA
3. San Francisco, CA 3. San Francisco, CA 3. Arlington, VA
4. Boston, MA 4. Seattle, WA 4. Washington, DC
5. Newark, NJ 5. Madison, WI 5. New York, NY
6. Miami, FL 6. Pittsburgh, PA 6. St. Paul, MN
7. Philadelphia, PA 7. Portland, OR 7. Minneapolis, MN
8. Chicago, IL 8. Norfolk, VA 8. Philadelphia, PA
9. Washington, DC 9. New York, NY 9. Seattle, WA
10. Seattle, WA 10. Minneapolis, MN 10. Chicago, IL
“Walking and bicycling are easy, pollution-free ways to get around town. They
are environmentally friendly, and burn a substantial number of calories. Whether
commuting to work or just for recreation, walking and biking have been shown to
lower the risk of chronic diseases like obesity, diabetes, and heart disease.’’
David R. Bassett, Jr., Ph.D., University of Tennessee Knoxville,
chair of the ActivEarth Taskforce
24 ACSM American Fitness Index® 2018 Rankings Summary ReportInterpreting the Rankings
It is important to consider both the score as well as the rank for each city when using the Fitness Index. While
the rankings list the cities from the highest score to the lowest score, the scores for many cities are very similar,
indicating there may be relatively little real difference among their fitness levels.
For example, Cincinnati, OH scored 57.0 overall and ranked #29 while Milwaukee, WI scored 55.8 overall and
ranked #34. While Cincinnati, OH ranked higher than Milwaukee, WI in the 2018 Fitness Index, these two
cities are actually very similar across most of the indicators as evidenced by the close scores; thus, there is little
difference in the community fitness levels of the two.
Also, while one city ranks #1 and another ranks #100, this does not necessarily mean that the highest ranked
city has excellent values across all indicators and the lowest ranked city has the lowest values on all indicators.
The ranking merely indicates that, relative to each other, some cities scored better than others.
It’s also important to remember that a majority of the personal health indicators do not change rapidly and it
will take time for the impact of new initiatives to be seen in most of the health indicators. While improvements
in community and built environment indicators are important investments, a notable change in the health of
residents is expected to slowly but surely follow.
Cities with the best scores, and even those with scores close to the best, are commended for their efforts to
improve and maintain the health and fitness of their residents. These cities demonstrate the ability to support
healthy lifestyles; thus, their approaches serve as examples to cities working to improve similar indicators.
The Fitness Index celebrates the
tremendous efforts that all cities put into
improving the health and well-being of
their residents as we all move toward a
healthier future for America.
Actively Moving America to Better Health 25Cities that Inspire Oklahoma City, OK Planning, Infrastructure, & Funding Oklahoma City, OK continues to build on recent healthy policy improvements through the local initiative known as planokc, the city’s first new comprehensive plan since 1977. This plan includes policies, among others, that promote mixed-use development and human-scale site designs, provides for pedestrian circulation, encourages neighborhood-scale retail, and uses wayfinding and placemaking features to encourage walking and biking. All of this activity is done with an eye toward preserving rural areas, natural landforms, and the open character of the landscape. Oklahoma City has a rich culture and history that are important to preserve as the city continues to grow and develop. Oklahoma City is also making efforts to improve its residents’ health and physical activity in several ways including funding for infrastructure that supports an active lifestyle. In the 2017 American Fitness Index rankings, Oklahoma City’s cost-of-living adjusted spending on parks was $58 per resident. That spending grew to $83 per resident in the 2018 analysis of park expenditures. Pursuing and diversifying funding sources is one of many policies in planokc that support growing a sustainable and robust parks, recreation, and trail system. In September 2017, Oklahoma City residents passed a temporary one-cent sales tax to support Better Streets, Safer City projects (www.okc.gov/residents/better-streets-safer-city-projects). The 27-month sales tax is expected to generate $240 million dollars dedicated to resurfacing streets, street enhancements, sidewalks, trails, and bicycle infrastructure including bike lanes. This infrastructure will provide safe opportunities for residents to be healthy and active while enhancing opportunities for economic development. 26 ACSM American Fitness Index® 2018 Rankings Summary Report
$57.7 million
   90+ miles of multi-                      allocated to build
       use trails                          new sidewalks and
                                              trails by 2021

          Oklahoma City, OK

                                             #12 ranked in
                                              2018 Fitness
                                           Index for acres of
                                            parkland/1,000
                                               residents

Actively Moving America to Better Health                         27
References 16. S
ugiyama T, Cerin E, Owen N, et al. Perceived neighbourhood
environmental attributes associated with adults’ recreational
walking: IPEN Adult study in 12 countries. Health Place.
1. U
.S. Department of Health and Human Services, Office of the 2014;28:22–30.
Surgeon General National Prevention Council. 2011, June.
National Prevention Strategy. [cited 2018 March 26]. Available 17. G
uo JY, Gandavarapu S. An economic evaluation of health-
from: http://www.surgeongeneral.gov/priorities/prevention/ promotive built environment changes. Prev Med. 2010;50:44-49.
strategy/report.pdf
18. U
.S. Environmental Protection Agency. 2012, December.
2. U
.S. Centers for Disease Control and Prevention. 2018, March 02. Smart Growth and Economic Success: Benefits for Real Estate
Physical Activity. [cited 2018 March 26]. Available from: Developers, Investors, Business, and Local Governments. [cited
https://www.cdc.gov/physicalactivity/ 2018 March 26]. Available from: https://www.epa.gov/
smartgrowth/smart-growth-and-economic-success-benefits-
3. A
merican College of Sports Medicine. (n.d.). ACSM | Position real-estate-developers-investors-business-and
Stands. [cited 2018 March 26]. Available from:
http://www.acsm.org/public-information/position-stands 19. A
ssistant Secretary for Legislation. 2017, December 01.
Encouraging Healthy Communities: Perspective from Surgeon Gen.
4. U
.S. Department of Health and Human Services, Healthy People [cited 2018 March 30]. Available from: https://www.hhs.gov/
2020. 2018, March 22. Physical Activity. [cited 2018 March about/agencies/asl/testimony/2017-11/encouraging-healthy-
26]. Available from: http://www.healthypeople.gov/2020/ communities-perspective-surgeon-gen.html
topicsobjectives2020/overview.aspx?topicid=33
20. H
asson RE, Brown DR, Dorn J, et al. Achieving equity in physical
5. H
ales CM, Fryar CD, Carroll MD, Freedman DS, Ogden CL. Trends activity participation. Med Sci Sports Exerc. 2017;49(4):848-
in obesity and severe obesity prevalence in US youth and adults by 858.
sex and age, 2007-2008 to 2015-2016. JAMA. 2018 Mar 23.
doi:10.1001/jama.2018.3060 [E-pub ahead of print]. 21. C
astrucci BC, Rhoades EK, Leider JP, Hearne S. What gets
measured gets done: an assessment of local data uses and
6. U
.S. Centers for Disease Control and Prevention. 2018, March 05. needs in large urban health departments. J Pub Health Manag
Overweight & Obesity. [cited 2018 March 26]. Available from: Pract. 2015;21(Suppl 1):S38–S48.
https://www.cdc.gov/obesity/data/adult.html
22. N
ational Committee on Vital and Health Statistics. 2017, March.
7. U
.S. Centers for Disease Control and Prevention. 2015, June Measuring Health at the Community Level: Data Gaps and
10. Glossary of Terms. [cited 2018 March 26]. Available from: Opportunities U.S. Department of Health and Human Services A
https://www.cdc.gov/physicalactivity/basics/glossary/index.htm Workshop Summary and Project Overview. [cited 2018 March
8. V
an den Berg AE, Maas J, Verheij RA, Groenewegen PP. Green 26]. Available from: https://www.ncvhs.hhs.gov/wp-content/
space as a buffer between stressful life events and health. Soc Sci uploads/2017/04/Measuring-Health-at-the-Community-Level-
Med. 2010;70(8):1203-1210. Data-Gaps-and-Opportunities.pdf
9. A
lcock I, White MP, Wheeler BW, Fleming LE, Depledge MH. 23. R emington PL. County Health Rankings and the Cult of the
Longitudinal effects on mental health of moving to greener and less Imperfect. Health Serv Res. 2015;50(5):1407-1412.
green urban areas. Environ Sci Technol. 2014;48(2):1247-1255. 24. G
arber CE, Blissmer B, Deschenes MR, et al. Quantity and quality
10. T aylor AF, Kuo FE. Children with attention deficits concentrate better of exercise for developing and maintaining cardiorespiratory,
after walk in the park. J Atten Disord. 2009;12(5):402-409. musculoskeletal, and neuromotor fitness in apparently healthy
adults: guidance for prescribing exercise. Med Sci Sports Exerc.
11. W
ells NM, Evans GW. Nearby nature: a buffer of life stress 2011;43(7):1334-1359.
among rural children. Environ Behav. 2003;35(3), 311-330.
25. U
.S. Centers for Disease Control and Prevention. 2016,
12. Leyden KM. Social capital and the built environment: the November 29. Current Physical Activity Guidelines. [cited 2018
importance of walkable neighborhoods. Am J Pub Health. March 26]. Available from: https://www.cdc.gov/cancer/
2003;93(9):1546-1551. dcpc/prevention/policies_practices/physical_activity/
guidelines.htm
13. S
allis JF, Floyd MF, Rodriguez DA, Saelens BE. Role of built
environments in physical activity, obesity, and cardiovascular 26. U
.S. Centers for Disease Control and Prevention. Adults Meeting
disease. Circulation. 2012;125(5):729-737. Fruit and Vegetable Intake Recommendations - United States,
2013. MMWR. 2015 [cited 2018 March 26];64(26). Available
14. S
allis JF, Cerin E, Conway TL, et al. Physical activity in relation
from: https://www.cdc.gov/mmwr/preview/mmwrhtml/
to urban environments in 14 cities worldwide: a cross-sectional
mm6426a1.htm
study. Lancet. 2016;387(10034):2207-2217.
15. S
allis JF, Spoon C, Cavill N, et al. Co-benefits of designing
communities for active living: an exploration of literature. Int J
Behav Nutr Phys Act. 2015;12(30).
28 ACSM American Fitness Index® 2018 Rankings Summary ReportVisit www.americanfitnessindex.org/rankings to compare city rankings, download resources, and request assistance for your city. Check out the Fitness Index blog or follow us on social media for tips on getting active and creating a healthier community. Actively Moving America to Better Health 29
About the American College
                         of Sports Medicine
                         The American College of Sports Medicine is the largest sports
                         medicine and exercise science organization in the world. More than
                         50,000 international, national and regional members are dedicated to
                         advancing and integrating scientific research to provide educational
                         and practical applications of exercise science and sports medicine.
                         More details can be found at www.acsm.org.

                         ACSM is a global leader in promoting the benefits of physical
                         activity and advocates for legislation that helps government and the
                         health community make it a priority. ACSM encourages Congress to
                         support continued funding of parks, trails and safe routes to school,
                         as well as the need for all Americans to meet the prescribed physical
                         activity recommendations included in the National Physical Activity
                         Guidelines, and the need for the guidelines to be regularly updated
                         every 10 years.

                         About the Anthem Foundation
                         The Anthem Foundation is the philanthropic arm of Anthem, Inc.
                         and through charitable contributions and programs, the Foundation
                         promotes the inherent commitment of Anthem, Inc. to enhance the
                         health and well-being of individuals and families in communities that
                         Anthem, Inc. and its affiliated health plans serve. The Foundation
                         focuses its funding on strategic initiatives that address and provide
                         innovative solutions to health care challenges, as well as promoting
RGB
Blue R-10 G-121 B-193
Gray R-136 G-138 B-140

                         the Healthy Generations Program, a multi-generational initiative
                         that targets specific disease states and medical conditions. These
                         disease states and medical conditions include: prenatal care in the first
                         trimester, low birth weight babies, cardiac morbidity rates, long term
                         activities that decrease obesity and increase physical activity, diabetes
                         prevalence in adult populations, adult pneumococcal and influenza
                         vaccinations and smoking cessation. The Foundation also coordinates
                         the company’s year-round Associate Giving program which provides a
                         50 percent match of associates’ pledges, as well as its Volunteer Time
                         Off and Dollars for Doers community service programs. To learn more
                         about the Anthem Foundation, please visit www.anthem.foundation
                         and its blog at https://medium.com/anthemfoundation.

                  30                          ACSM American Fitness Index® 2018 Rankings Summary Report
Notes _________________________________________________________________________________________ _________________________________________________________________________________________ _________________________________________________________________________________________ _________________________________________________________________________________________ _________________________________________________________________________________________ _________________________________________________________________________________________ _________________________________________________________________________________________ _________________________________________________________________________________________ _________________________________________________________________________________________ _________________________________________________________________________________________ _________________________________________________________________________________________ _________________________________________________________________________________________ _________________________________________________________________________________________ _________________________________________________________________________________________ _________________________________________________________________________________________ _________________________________________________________________________________________ _________________________________________________________________________________________ _________________________________________________________________________________________ _________________________________________________________________________________________ _________________________________________________________________________________________ _________________________________________________________________________________________ _________________________________________________________________________________________ _________________________________________________________________________________________ _________________________________________________________________________________________ _________________________________________________________________________________________ _________________________________________________________________________________________ Actively Moving America to Better Health 31
You can also read