NHS England Impact Analysis of implementing NHS Diabetes Prevention Programme, 2016 to 2021
←
→
Page content transcription
If your browser does not render page correctly, please read the page content below
NHS England Impact Analysis of
implementing NHS Diabetes Prevention
Programme, 2016 to 2021
1. Purpose
The purpose of this document is to describe both the estimated resource implications
to NHS England of implementing the NHS Diabetes Prevention Programme in
England over the next 5 years (2016-2021), and the expected return of the
programme in the short and long run.

2. Scope
In the Five Year Forward View, NHS England committed to implement a national
evidence-based diabetes prevention programme at scale. Plans for a national
diabetes prevention programme have been developed in response to this
commitment.

The NHS Diabetes Prevention Programme (NDPP) is a joint initiative with Public
Health England and Diabetes UK which aims to deliver services, at a large scale,
which identify those with non-diabetic hyperglycaemia (i.e those at high risk of
developing type 2 diabetes) and offer them a lifestyle intervention encompassing
group educational sessions subject to an evidence-based specification to reduce
their weight and increase physical activity.

This impact assessment considers the impact of the NDPP on NHS resources and
the extent to which the NDPP will improve health outcomes of people at high risk of
developing type 2 diabetes.

3. Summary

This paper presents a range of estimates to describe the financial and health
impacts of the NDPP. The estimates are based on the programme lasting five years
with a three year gradual roll-out to expand the programme to 100,000 people per
year by the third year of the programme. Any benefits which would be accrued by
continuing the programme beyond five years are not included.

The estimates cover a range of scenarios, modelling the impact of a variety of
provider costs for the intervention, and a series of effectiveness estimates for the
programme. The results are all based on the detailed analytical model created by the
University of Sheffield’s School for Health and Related Research (ScHARR). The
intervention costs used in the analysis were based on an estimated range prior to

Produced in February 2016                                                             1
prices being finalised. A revised Impact Analysis incorporating actual provider prices
will be produced before the end of the year to inform the business case for
investment in 2017/18.

Based on a medium end average cost1 of £270 per participant enrolled (equivalent to
an estimated tariff (or core price)2 of approximately £435 for each participant who
completes the programme), and base case effectiveness assumptions (from the
ScHARR model), the total gross cost for a five year cohort of 390,000 participants,
excluding implementation and support costs, is estimated to be £105 million3 over
five years. The programme would yield net positive economic returns (taking into
account health gains) from year 8, and would financially break even (be cost saving)
at year 14.

By the end of the 5th year of the programme, the model estimates that 18,000 cases
of diabetes will have been prevented or delayed among this five year cohort of
390,000 participants. Out of those attending the first session of the programme this
represents around 1 in 20 high risk cases of diabetes being prevented 4. Assuming
base case effectiveness, for every 100,000 people enrolled in the NDPP the
cumulative impact over the following 5 years is approximately 4,500 diabetes
diagnoses prevented or delayed.

Over a 20 year horizon the net cumulative financial impact of the NDPP is a saving in
the region of £35 million3 (excluding implementation, support, and local costs). Over
this 20 year horizon the cumulative direct health benefits of the programme are
estimated to be 18,000 Quality Adjusted Life Years (QALYs) saved relative to the do-
nothing (undiscounted and not taking into account additional QALY gains from NHS
savings).

Taking the example of a £270 average cost over 20 years, valuing any estimated
cost savings to reflect the additional benefits of health care expenditure in terms of
saved lives made possible by the reduced demand for NHS resources, the overall
undiscounted economic net benefit estimated is £1.2bn (£967m discounted) for the 5
year cohort. A £1.2bn net benefit (£967m discounted) implies that the programme
modelled in this assessment will be more cost effective at saving QALYs than other
NHS services (at the margin).

Using the lowest average cost estimate (£155) and the highest effectiveness
assumption (the ‘best case’ scenario), the programme would yield net positive

1
  Average cost = the actual cost that the commissioner would pay to the provider taking account of the
expected drop-off rate. The actual cost to NHS England would vary dependent on the success of
providers in retaining participants: low success/retention = lower average cost; and success/high
retention = higher average cost.
2
  Tariff or “core price” = the theoretical cost per person that the provider is paid for every participant
who completes the intervention. This does not take account of the expected drop off rate.
3
  Assuming constant prices, undiscounted
4
  This includes participants who drop out of the intervention before completion hence will understate
the actual treatment effect of the whole programme.

Produced in February 2016                                                                               2
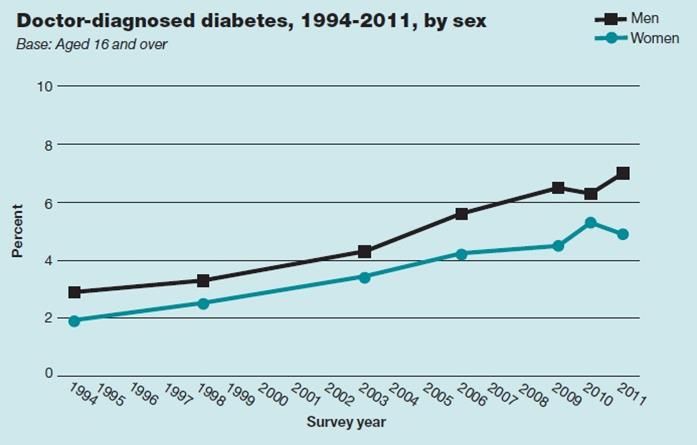
economic returns (taking into account health gains) from year 6, and would be cost
saving at year 9.

Using the highest average cost estimate (£350) and the lowest effectiveness
assumption (the ‘worst case scenario), the programme would yield net positive
economic returns (taking into account health gains) from year 11, but would not
reach a point at which it would be cost saving.

If the higher effectiveness estimate is applied the number of cases of diabetes
prevented or delayed among the cohort of 390,000 participants would be 24,000.
Given that the NDPP will be closely aligned to NICE guidelines it may be possible for
the programme to achieve this higher level of effectiveness. Furthermore, if the
effectiveness rates seen in the Finnish Diabetes Prevention Study [1] are applied to
the anticipated NDPP cohort of 390,000 participants, an estimated 29,000 cases of
diabetes would be prevented or delayed.5

4. What is the problem under consideration and why is government
   intervention necessary?

In 2013, 2.7 million or 6% of the adult population in England had diagnosed diabetes
[2], of whom approximately 90% had type 2 diabetes [3]. In addition an estimated
500,000 people had type 2 diabetes but were undiagnosed [4], and a further 5 million
people were at high risk of developing type 2 diabetes [5].

The prevalence of diagnosed diabetes has increased significantly over the past two
decades from 2.9% of men in 1994 to 7.0% in 2011, and from 1.9% of women in
1994 to 4.9% in 2011 [6]. The prevalence of undiagnosed diabetes has followed a
similar trend (Figure 1) [6]. These rising trends are expected to continue with the
number of adults with diabetes projected to rise to 4.6 million by 2030 [2].

5
  Based on retention assumptions of 50% of the cohort being retained for at least 75% of the
intervention programme and therefore receiving maximum benefit from the intervention, and absolute
risk reduction of 15% reported in the Finnish Diabetes Prevention Study.

Produced in February 2016                                                                        3
Figure 1:
Source: Health Survey for England, 2011
The costs of treating diabetes are significant, estimated at over £8 billion a year in
the UK, with approximately 80% of these costs associated with the treatment of
complications, including cardiovascular disease, amputations, renal failure and sight
loss [7].
• In 2012-13 there were 50,000 hospital admissions in England with a main
diagnosis of diabetes [7]
• People with diabetes are five times more likely to have heart disease or a
stroke than someone without [2]
• Diabetic retinopathy is the leading cause of preventable sight loss in people
of working age in England and Wales [2]
• Diabetes is the single most common cause of end-stage renal (kidney)
failure, requiring dialysis or a transplant [8]
• Depression is nearly twice as high among people with Type 2 diabetes than
those without the condition [2]
• There were 4,974 deaths in England and Wales in 2013 for which diabetes
was the underlying cause [9]
• There were 236 avoidable deaths in England and Wales in 2013 for which
diabetes was the primary cause [10]
• In 2013 there were 23,986 premature deaths in England and Wales due to
diabetes [18]
Non-diabetic hyperglycaemia, also known as pre-diabetes or impaired glucose
regulation, refers to raised blood glucose levels, but not in the diabetic range. People
with non-diabetic hyperglycaemia are at increased risk of developing type 2
diabetes. They are also at increased risk of other cardiovascular conditions.
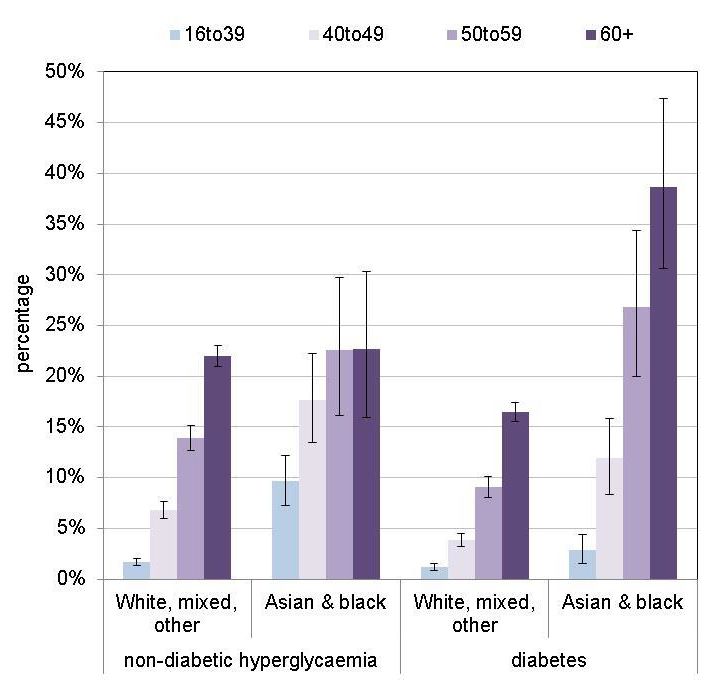
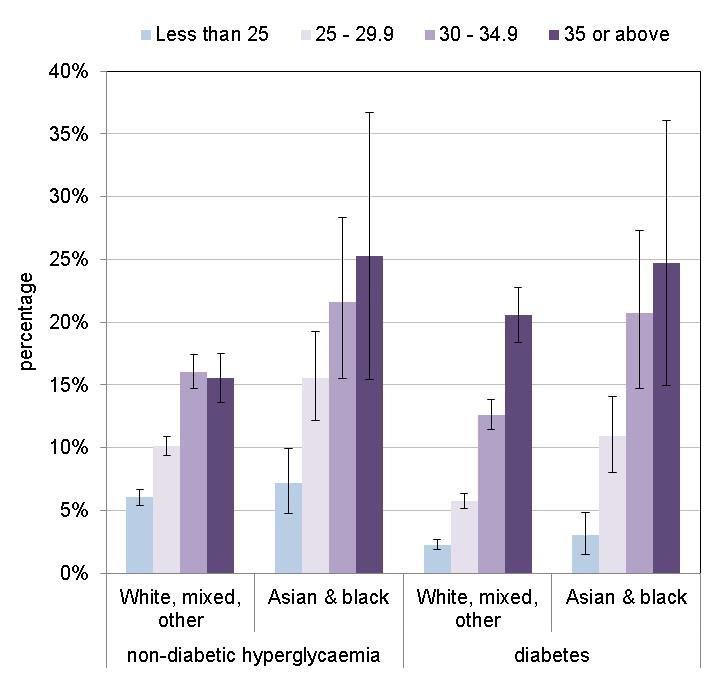
Produced in February 2016 4Recent analysis for the NDPP by the National Cardiovascular Intelligence Network has estimated prevalence of non-diabetic hyperglycaemia in England at 10.7%. Risk factors for type 2 diabetes and non-diabetic hyperglycaemia include genetic factors, age and ethnicity (Figure 2), however a large proportion of cases are associated with modifiable risk factors, particularly obesity (Figure 3). Figure 2: Prevalence on non-diabetic hyperglycaemia and type 2 diabetes in Health Survey for England (2009-2013) population by age and ethnicity Figure 3: Prevalence on non-diabetic hyperglycaemia and type 2 diabetes in Health Survey for England (2009-2013) population by body mass index and ethnicity 90% of people aged 15-54 with diabetes are overweight or obese [2].The risk of developing diabetes is seven times greater for people who are obese, and three Produced in February 2016 5
times greater for those who are overweight, compared to those of a healthy weight
[8].
There is therefore potential to prevent or delay a large number of cases of diabetes
by addressing modifiable risk factors such as overweight and obesity, before people
develop the disease.
The risk of developing type 2 diabetes is far greater among some groups in the
population. People from Black African and Caribbean backgrounds are three times
more likely, and people of South Asian heritage are six times more likely, to develop
type 2 diabetes, compared with white Europeans [2]. Type 2 diabetes affects people
from these backgrounds a decade or more earlier than white Europeans [9].
As the increased risk of type 2 diabetes associated with obesity is so great, the rising
prevalence of obesity has led, and will continue to lead, to a rise in the prevalence of
non-diabetic hyperglycaemia and diabetes [2]. The proportion of people who were
categorised as obese increased from 13% of men in 1993 to 24% in 2012 and from
16% of women in 1993 to 25% in 2012. It has been estimated that if current trends
continue, by 2050 obesity will affect 60% of adult men and 50% of adult women [2].
The number of adults with diabetes is projected to rise to 4.6 million by 2030.
Approximately a third of this increase is attributable to obesity, whilst the rest is due
to aging and the changing ethnic structure of the population [2].
There is good international evidence from multiple randomised control trials for the
effectiveness of intensive lifestyle intervention programmes to prevent or delay type
2 diabetes in at risk populations. Despite this evidence, such programmes have not
been systematically implemented in England. The NDPP is seeking to ensure that
such interventions are available throughout England in order to slow the rising trend
in incidence of type 2 diabetes.
5. What are the objectives and intended effects of the NDPP?
The objectives the NDPP is aiming to achieve are:
More people at high risk of developing diabetes will receive lifestyle
interventions to support them to lower their risk
The increase in incidence of type 2 diabetes will slow down compared with
current predictions, and
The incidence of heart, stroke, kidney, eye and foot problems (and associated
mortality) related to diabetes will reduce compared with current predictions
The key measures of success for the programme will be:
Retention of people on the programme
Weight reduction in participants of the programme
Risk reduction in participants of the programme measured via blood test
Produced in February 2016 6 Reduction in the incidence of type 2 diabetes 6. Evidence base for this type of programme/intervention There is strong evidence, from randomised control trials and systematic reviews, of the effectiveness of lifestyle intervention programmes (comprising diet and physical activity interventions) in preventing or delaying the development of type 2 diabetes in people at high risk of developing the condition. A 2007 systematic review and meta-analysis of randomised control trials (RCTs) by Gilles et al. [10] demonstrated a 49% relative reduction in risk of developing type 2 diabetes in trial intervention arms compared with control arms. This systematic review, which informed the NICE guideline on preventing type 2 diabetes, also reported results for a small number of RCTs which included longer term follow up of participants. These studies demonstrate the potential longer term impact of NDPP- style interventions. For example, the Finnish RCT reported that at the 6 year follow up point the cumulative incidence of diabetes was 38% in the control group, and 23% in the intervention group; an absolute reduction in risk of type 2 diabetes of 15% [1]. The effectiveness of lifestyle intervention programmes has also been reported in systematic reviews and meta-analyses of translational studies, exploring whether such programmes are effective in real world settings. For example, Dunkley et al. [11] found that translational diabetes prevention programmes significantly reduced body weight among participants in their intervention arms by a mean 2.3 kg at 12 months of follow-up. In addition, in the more limited number of studies where these data were available, significant reductions were reported in other diabetes and cardiovascular risk factors, including blood glucose, BP, and some cholesterol measures. This study was used to in the economic model of the NDPP undertaken by ScHARR, which has informed this impact assessment. A further rapid review [12] commissioned in 2015 to inform the NDPP concluded that programmes similar to the NDPP can reduce incidence of type 2 diabetes among those who receive a diabetes prevention programme by 26% compared with those receiving usual care. People supported by diabetes prevention programmes lose on average 1.57kg more weight than those not on a programme aiming to significantly reduce diabetes risk. NICE guidelines [13] recommend that people at high risk of developing type 2 diabetes are offered referral to a local, evidence-based, quality- assured intensive lifestyle-change programme. Such programmes should offer ongoing tailored advice, support and encouragement to help people increase their levels of physical activity, improve diet and gradually lose weight to reach and maintain a BMI within the healthy range. Produced in February 2016 7
7. Procurement, provider payment and tariffs

   7.1. National procurement
The provision of evidence based intensive lifestyle interventions is central to the
implementation and delivery of the programme. A proposal for a national
procurement was approved in principle by the Prevention Board on 10th March
2015, on the basis that there is currently only limited provision of services providing
evidence-based lifestyle interventions. These interventions are more intensive than
existing Tier 2 weight management services and designed specifically to reduce
diabetes risk, rather than primarily to deliver weight loss. A national procurement
enables NHS England to directly manage the development of the market, to ensure
consistently high standards of quality and to deliver the new service at pace.

The procurement will put in place a framework agreement that will set the ceiling
price for the delivery of diabetes prevention services against the national
specification. NHS England will work with CCGs or groups of CCGs to run
competitive mini competitions to procure the services to deliver locally specific
diabetes prevention programmes.

    7.2. Provider payment
The framework contract will incorporate the payment mechanism setting the ceiling
(i.e. maximum) rate of payment for the delivery of a course of interventions to an
individual. The rationale for this approach to pricing is that it introduces competition
at the point where a contract is awarded for a particular area and enables local
market forces requirements to be taken into account. Therefore the actual cost for
delivery of a course in any given area may be lower than the ceiling price.

Providers will be paid according to their tariff (core price) (per participant) for
complete delivery of a course. The tariff is the theoretical cost per person that the
provider is paid for every participant who completes the intervention. This does not
take account of the expected drop off rate. It is expected these tariffs may vary year
by year as the provider learns and introduces efficiencies.

A key objective of the payment mechanism is to incentivise providers to retain
participants on the programme of intervention and to encourage as many as possible
to complete the full programme. This objective will be incorporated into the payment
mechanism in two ways:

Staged Payments: it is proposed to make staged payments for those participants
who complete defined milestones on each course. The desire is to weight the
payments to be made at each milestone to encourage providers to actively engage
participants to keep them attending the course. A number of profiles of staged
payments were considered but the data to assess the implications of different

Produced in February 2016                                                                  8
profiles is not available and it was therefore decided to propose a flat weighting across the programme milestones, as shown in Figure 4. Figure 4: Expected payment stages During the selection of the framework providers, bidders will have the opportunity to modify the payment made at each stage, potentially taking on more commercial risk in relation to the retention of participants. Participant Retention: The retention of the participants will be an important driver to the success of the service and the payment mechanism needs to account for the number of participants that the providers are able to retain through-out the programme and complete the course of interventions. The following milestones will be used to determine when a stage is completed and payment made: Milestone 1: An appropriate referral has been accepted onto a course (registered) and attended the first (face to face) meeting. Milestone 2: 25% of the planned course time will have passed (eg. 3 months if a 12 months course length is proposed). Milestone 3: 50% of the planned course time will have passed (eg. 6 months if a 12 months course length is proposed). Milestone 4: 75% of the planned course time will have passed (eg. 9 months if a 12 months course length is proposed). Milestone 5: 100% of the planned course time will have passed (eg. 12 months if a 12 months course length is proposed). A participant will be deemed to have achieved a milestone, if that participant has attended 75% of the planned interventions due to have been delivered by that time. This permits participants to miss a few interventions due to other personal commitments but still meet a milestone. This also allows the provider of the service to recover milestone payments if they encourage an individual to return to the course and complete at least 75% of the activities by the next milestone. Retention evidence is limited but expert opinion, drawn from experience of delivering similar services, indicates the overall retention from registration to the completion of intervention programmes is expected to be around 20%, with the following profile over a 12-18 month period, as shown in Figure 5. Produced in February 2016 9
Figure 5: Retention evidence to date for intervention programmes

In call-off contracts and throughout the service delivery, the agreed tariff rates in
addition to the actual participant volumes, retention and payment stages will form the
amount that the NHS England need to pay providers.

The tariff (core price) is the cost of a single participant completing the whole course.
This is converted to average cost per participant by taking into consideration the
assumed retention rate and the profiling of staged payments. This effectively means
that the actual cost to NHS England will be dependent on the success of providers in
retaining participants. Low success in participant retention implies a lower average
whereas more success in ensuring high retention of participants implies a higher
average cost.

8. NDPP financial assessment

The financial modelling estimates the additional financial costs and the additional
savings of the NDPP compared with no intervention. These costs are calculated 20
years into the future. Whilst this enables us to observe the longer term impacts, it is
worth noting that the level of uncertainty in our estimates increases with the forecast
period. The financial modelling assumes that the NDPP is implemented with a three-
year roll out with full roll-out achieved at the end of year 3 of the programme, and
sustained for the following 2 years only, as follows: Year 1, 30,000 enrolled; Year 2:
60,000 enrolled; Year 3, 100,000 enrolled; Year 4, 100,000 enrolled, Year 5 100,000
enrolled.

   8.1. Rationale for overall programme capacity (100,000 enrolled/year)

Initial modelling undertaken for the programme estimated that if the NHS Health
Check programme is offered to 20% of the population aged 40-74 each year, and
49% take up the offer of a Health Check, then, based on the Impact Assessment for
the NHS Health Check (undertaken for Department of Health in 2010), 136,000
people could be identified as eligible for the programme each year. Using an
estimate of the likely uptake rate for the intervention of 37% (of those identified as
being at risk via the NHS Health Check), the number of people who could be
enrolled on the intervention through this route was estimated to be approximately

Produced in February 2016                                                             10
50,000 people per year by 2019/20. This assumes a 10% year on year growth in
uptake of the NHS Health Check, based on PHE projections, and the introduction of
validated identification tool for diabetes risk in place of the current NHS Health
Check diabetes filter. It is now believed that these assumptions may over-estimate
the numbers identified via the NHS Health Check as the diabetes filter has not yet
been changed and there is uncertainty about whether the projected growth in uptake
will be achieved.

Many people at high risk of type 2 diabetes will not be eligible for an NHS Health
Check due to pre-existing cardiovascular conditions. However, these people may be
identified as part of routine care in general practice, and in some cases may be on a
general practice register for people with non-diabetic hyperglycaemia. If each CCG
was able to identify 250 people who could be enrolled on the programme each year,
this would secure an additional 50,000 participants in the programme per year.

Data from NDPP demonstrator sites suggest that across the demonstrator sites
where GP registers for non-diabetic hyperglycaemia have been established the
mean rate of patients on GP registers per 1000 population aged 40-74 is 50. Based
on an average CCG population aged 40-74 of 104,000 [14], an average-sized CCG
could potentially have 7,000 people on GP registers for non-diabetic
hyperglycaemia; therefore, the expectation that an average sized CCG could identify
500 people per year (through the NHS Health Check or GP registers) to be enrolled
on the programme seems reasonable. We will revise these figures as more data is
received from the demonstrator sites.

Uncertainty about uptake and retention rates, due to a lack of available data from
similar programmes, is a limitation in modelling the likely impacts of the programme,
and is a key risk to the implementation of the programme. A further route through
which it may be possible to recruit people to the programme is through providers
being able to recruit the public directly (rather than via an NHS Health Check or GP
referral). Providers have been asked to provide costs for delivering the programme in
this way in their tender submissions, however direct recruitment approaches are not
covered by this impact assessment due to lack of information about costs and
benefits.

9. NDPP modelling

   9.1. Previous NDPP modelling

At the start of the NDPP programme, a model was developed to calculate the costs
and impacts of the programme based on the RCT evidence that NDPP interventions
could delay the onset of diabetes. It assumed that one in ten people who attended a
NDPP lifestyle intervention had some benefit, and that, based on RCT evidence,
onset of disease was delayed by 4 years on average. Estimates of the annual cost of

Produced in February 2016                                                          11
treating diabetes were taken from the published evidence and from Department of
Health modelling undertaken for the NHS Health Check impact assessment in 2010.
The cost of the intervention was based on the NICE guideline on diabetes prevention
published in 2012 [9], which gave an upper limit for the unit cost of a NDPP
programme of £310 (for the NDPP programme the cost of the intervention will be
determined through the procurement process).

This initial modelling provided a basic estimate of the scale of cost savings for the
programme. The savings were initially calculated using the average cost of diabetes,
however, the first years of treatment of diabetes are likely to be well under average
cost. The initial savings estimates are therefore likely to be an over estimate. In
addition, the cost savings depend on whether the delay in onset of disease delays all
further stages of diabetes progression as patient ages or whether disease
progression “catches up” as a person ages. Given the simplified assumptions and
uncertainties in the initial modelling, a more robust model, based on changes in
metabolic risk rather than an average delay in disease progression only, was
commissioned.

   9.2. Commissioned analysis

NHS England commissioned a financial model from the University of Sheffield
School of Health and Related Research (ScHARR) to forecast the financial costs
and health impact of the NDPP. This analysis was based on an existing disease
progression and cost-effectiveness model for type 2 diabetes that had been
extensively peer-reviewed and widely published by the research team and used by
NICE. The analysis used NDPP-specific inputs and assumptions based on the best
available evidence and on evidence-based projections for the programme.

   9.3. Brief description of the model and the analysis used to inform the NDPP
        Impact Assessment

The ScHARR model is a disease progression and cost-effectiveness model for type
2 diabetes, which was specifically developed to be capable of evaluating a wide
range of prevention interventions within a single framework. The model is a patient
simulation model of individual risk of developing diabetes based on metabolic
factors including body mass index (BMI), systolic blood pressure (SBP), cholesterol
and measures of blood glucose (including HbA1c). The baseline population consists
of a representative sample of the English population without pre-existing diabetes.

The model assumes that the eligible population for the NDPP matches the eligible
population for the NHS Health Check. NHS Health Checks are targeted at all
individuals aged between 40 and 74 without pre-existing cardiovascular disease and
not already treated with anti-hypertensives or statins. It is assumed that each year
20% of individuals in the eligible group are invited for a Health Check and risk of
diabetes is assessed. Those assessed as high risk are offered a blood test and

Produced in February 2016                                                          12
confirmatory blood test if diabetes is suspected. Those confirmed to be at high risk
are offered a diabetes prevention lifestyle intervention. If they take up the
intervention, their risk factors (BMI, blood pressure, cholesterol and HbA1c) reduce
and they are less likely to develop diabetes or the complications associated with
diabetes.
The full effectiveness of the intervention is applied in the first year only, then
assumed to decline linearly, reaching zero effect after five years.
9.3.1. Estimates of intervention effectiveness
The estimates for reduction in BMI, blood pressure, cholesterol and HbA1c in the
ScHARR model were based on data published in a systematic review and meta-
analysis of pragmatic studies of interventions similar to the NDPP [11]. The majority
of the studies included in this review were undertaken on an intention-to-treat basis
meaning that these studies estimated the average effectiveness of the intervention
for all participants in the intervention groups who started the intervention, regardless
of whether or not they completed it6. Therefore the base case analysis undertaken
for the NDPP programme assumed that the model estimated the average health
benefits and cost savings for all participants who started a NDPP intervention,
including those participants who dropped out before the end of the programme.
The same study reported an average weight loss of 2.32kg across all included
studies. A sensitivity analysis was undertaken that assumed no change in weight for
those with missing data (i.e. those who had not completed the programme) in studies
that were not performed on an intention to treat basis. This analysis suggested that
average weight loss could be 0.5kg lower than average weight loss in the primary
analysis. This suggests that the effectiveness data used in the ScHARR model may
overestimate the effectiveness that would be expected for the NDPP. To take
account of this, a second scenario was modelled that assumed a 25% lower
effectiveness rate than the base case scenario. This assumes that there is a
reduction equivalent to the weight reduction in the other metabolic factors modelled
(blood pressure, cholesterol and HbA1c).
The systematic review also reported analysis showing that adherence to published
guidelines on NDPP interventions increased effectiveness7. As the NDPP will be
6
Twenty-two of the twenty-five studies reported in the systematic review were rated + or ++ on the
intention-to-treat quality criteria, and three were not rated. None of the studies were given a minus
rating. (Dunkley, Bodicoat et al 2012)
7
The systematic review assessed the extent to which the interventions in the included studies
adhered to evidence-based guidance (Dunkley, Bodicoat et al 2012) The authors reported that
fourteen of the 25 included studies attained an overall score of ≥9 out of a possible 12 in relation to
meeting NICE guideline recommendations. Adherence to guidelines was significantly associated with
a greater weight loss (an increase of 0.4 kg per point increase on a 12-point guideline-adherence
Produced in February 2016 13based on a service specification that adheres closely to NICE guidelines, it is possible that the base case may underestimate the effectiveness of the intervention since the effectiveness estimates were derived from a meta-analysis that included studies that did not adhere closely to NICE guidelines. To take account of this, a third scenario was modelled that assumed a 25% higher effectiveness rate than the base case estimate. In summary, we provide the following sensitivity estimates around the effectiveness of the intervention: 1. Base case 2. 25% less effective 3. 25% more effective 9.4. Setting the tariff and calculating the average cost for the intervention Section 7 describes the procurement, provider payments and tariffs for the NDPP. The tariff (core price) is the cost of a single participant completing the whole course. The average cost per participant takes into consideration the assumed retention rate and the profiling of staged payments. The SCHARR modelling requires the average cost as an input to the model. We have not yet received bids from providers so we do not yet know what the tariff or average cost will be, however we have modelled three scenarios based on the evidence available to us which represent a low, medium and high scenarios for the cost of the programme. When the bids have been submitted, further analysis will be undertaken to present the impact of costs based on the prices submitted. We anticipate that these will lie within the range of costs presented in this paper. 10. Costs and benefits 10.1. Costs associated with programme implementation In addition to the intervention costs described above, there will be additional costs associated with implementing the NDPP at scale across England. The estimated cost of implementing the programme over the 3 year roll out period (2016/17 – 2018/19) is £8,350,000. Beyond the first 3 years it is estimated that the ongoing cost of supporting the programme will be £1,300,000/year. The breakdown of these costs is summarised in Table 1, and outlined below. scale). A 25% increase in effectiveness of the NDPP would equate to an average weight loss of 2.9kg (baseline 2.32kg) Produced in February 2016 14
Table 1: NHS NDPP Implementation Costs (excluding intervention costs)

                                                         Costs (000s)(£) 2016 - 2021

                                       2016/17        2017/18   2018/19   2019/20   2020/21   Total
                                                                                              cost

    Contract management and
    coordination                               500       500       500       500       500     2500
    Quality assurance                          150       300       500       500       500     1950
    Regional support                           300       300       300       300       300     1500
    Funding to support local
    implementation                            1,500     1,500     2,000                        5,000
    Total                                     2,450     2,600     3,300     1300       1300   10,950

          10.1.1.        Contract management and quality assurance

Robust monitoring of the programme will be important to ensure

      -   The contracted provider(s) are delivering the service according to the service
          specification
      -   Local health economies are identifying and referring into the programme
          appropriately
      -   The programme is meeting the needs of the target population

We envisage that contract management for the programme will be provided by a
Commissioning Support Unit. This will include day-to-day management of contracts
with providers, overseeing the submission of management data by providers, and
providing collated data for assurance and evaluation purposes. The estimated cost
of this contract management function is £500,000 per year.

In addition, we anticipate that quality assurance of providers will cost £150,000 in
year 1, and £500,000 per year at full roll out. This is based on the assumption that a
random sample of 5% of all cases enrolled by a provider will be subject to review to
verify participant engagement and outcomes, and that the cost to the contract
management function of undertaking or arranging a review will be up to £100 per
case.

          10.1.2.        Support for local delivery of the programme

Regional Support : Implementation support at regional level will be needed to
support the implementation of the programme in local health economies. The
estimated cost of this support is £1.5m8 over 5 years. This is based on four regional

8
    £75,000 per NHS England region per year

Produced in February 2016                                                                         15
leads being appointed within NHS England regions to support liaison between the
central programme team and lead partner CCGs and local authorities.
Support for local health economies: Local health economies were invited to express
an interest in delivering the first wave of the programme. More than 60 expressions
of interest were received (many from groups of CCGs and local authorities
collaborating together) and around 27 of these are expected to join the programme
in 2016/17. The areas selected to work with the programme cover just over 1/3 of the
England population. It is envisaged that by the end of 2017/18 the programme will be
available in areas covering 2/3 of the population, and that 100% coverage will be
achieved by the end of 2018/19. Local health economies participating in the
programme will need to put systems in place to ensure that people identified through
these mechanisms can be referred to the programme and followed up. This will
include:
- Establishing referral mechanisms including safe transfer of data between local
referrers and the national provider.
- Establishing practice registers for people with non-diabetic hyperglycaemia.
- Auditing practice databases and offering referral to people who already have
a blood glucose reading in the relevant range.
Local Authorities (as NHS Health Check commissioner) and Clinical Commissioning
Groups (as co-commissioners of primary care, and in their quality improvement role)
will be responsible for putting these arrangements in place. To support
implementation additional funding will be provided for each area (or group of areas
where a joint expression of interest has been submitted) to support this work in the
year that they join the programme. It is proposed that in 2016/17 £1.5 million will be
made available to support implementation across the areas joining the programme.
Estimated costs assume that this cost would only be incurred in the first year of
participation in each area.
10.1.3. Evaluation
Whilst there is good evidence from randomised control trials for the effectiveness of
intensive lifestyle interventions to prevent type 2 diabetes, it is essential that the
programme is evaluated to demonstrate the outcomes achieved when such
programmes are made available at scale, for all members of the population who are
at high risk of type 2 diabetes. Evaluation costs will be met by other organisations,
rather than NHS England, and are therefore not included in this Impact Assessment.
Produced in February 2016 1610.2. Financial costs and benefits of the NDPP
We present three scenarios for the NDPP financial assessment. Each scenario
represents a different average cost (and tariff) paid to providers per participant.
These are as follows:
Scenario 1 – a low end average cost of £155 (equivalent to an estimated tariff of
approx. £250)
Scenario 2 – a medium end average cost of £270 (equivalent to an estimated tariff of
approx. £435).
Scenario 3 - a high end average cost of £350 (equivalent to an estimated tariff of
approx. £560)
Each scenario table presents the following key estimates:
Number of individuals enrolling on the programme
Programme intervention costs (i.e. average cost paid to provider per
participant x No of participants)
Impact on NHS costs depending on effectiveness of programme
Implementation and support costs of programme (these are specified in more
detail in the previous section)
The overall net financial cost of the programme, both excluding and including
implementation and support costs
Negative figures represent savings. Tables 2-4 show detailed breakdowns of costs
for each year of the programme, which assume that all intervention costs (ie
payments to DPP providers) are incurred in the year in which a participant is enrolled
in the programme,39 In reality participant involvement in the programme may span
multiple years, however we do not yet have information on provider payment
schedules or retention rates which would allow more detailed annual cost
calculations to be undertaken.
Scenario 1: Average cost of £155/Tariff price of £250, 3 year roll-out
We take the low end average cost of £155 (equivalent to tariff £250) and apply it to
the 3-year roll-out. The annual and cumulative cost/savings projections for the next
20 years can be seen in Table 2.
The gross financial cost of the NDPP (undiscounted, constant prices and excluding
implementation costs), assuming an average cost of around £155, for a planned five
year cohort of 390,000 participants in total was estimated to be just over £60m
(£70m including estimated implementation and support costs).
9
For discounted costs and savings please look in Appendix 2
Produced in February 2016 17The gross anticipated savings to the NHS from improved outcomes during this period lie in the range £18m-£29m depending on programme effectiveness. The net cost to the NHS over five years is, therefore, anticipated to be £31m - £43m (£41m-£53m including implementation and support costs). Figure 6 shows the cumulative financial impact over 20 years. Over this period this scenario is cost saving as the impact of reduced NHS resource use extends further than 5 years. Total net savings lie in the range £33m-£111m over this period depending on programme effectiveness (£24m – £103m including estimated implementation and support costs). Depending on programme effectiveness, the intervention achieves a cumulative cost saving position in years 9-12 of the NDPP. Figure 6: Scenario 1 - cumulative cost/saving profile of £155 average cost excluding implementation costs Scenario 2: Average cost of £270/Tariff price of £435, 3 year roll-out Under scenario 2 providers are paid medium end average cost of £270 (equivalent to an estimated tariff of £435). This is the average cost required to achieve break-even in 10-15 years under a three year roll-out. The annual and cumulative cost/savings projections for the next 20 years can be seen in Table 3. Produced in February 2016 18
The gross financial cost of the NDPP (undiscounted, constant prices and excluding
implementation costs), assuming an average cost of around £270, for a planned five
year cohort of 390,000 participants in total was estimated to be just over £105m
(£115m including estimated implementation and support costs).

The gross anticipated savings to the NHS from improved outcomes during this
period lie in the range £18m-£29m depending on programme effectiveness.

The net cost to the NHS over five years is anticipated to be £76m - £88m (£86m-
£97m including implementation and support costs).

Figure 7 shows the cumulative financial impact over 20 years. Over this period this
scenario is cost saving in both the base and higher effectiveness cases. Cost saving
is achieved in years 14 and 13 respectively. In the lower effectiveness case, a
cumulative cost saving position is reached in the 26th year.

Total net savings lie in the range -£12m (i.e. a net cost) to £67m over this period
depending on programme effectiveness (-£22m to £57m including estimated
implementation and support costs).

Figure 7: Scenario 2 - cumulative cost/saving profile of £270 average cost excluding
implementation costs

Produced in February 2016                                                             19
Scenario 3: Average cost of £350/Tariff price of £560, 3 year roll-out

As a high end scenario, providers are paid £350 as an average cost (equivalent to
an estimated tariff of £560). This is the average cost required to achieve break-even
in 15-20 years under a three year roll-out. The annual and cumulative cost/savings
projections for the next 20 years can be seen in Table 4.

The gross financial cost of the NDPP (undiscounted, constant prices and excluding
implementation costs) assuming an average cost of around £350, for a planned five
year cohort of 390,000 participants in total was estimated to be £137m (£146m
including estimated implementation and support costs).

The gross anticipated savings to the NHS from improved outcomes during this
period lie in the range £18m-£29m depending on programme effectiveness.

The net cost to the NHS over five years is anticipated to be £107m-£119m (£117m-
£129m including implementation and support costs).

Figure 8 shows the cumulative financial impact over 20 years. Over this period this
scenario is cost saving in both the base and higher effectiveness cases. Cost saving
is achieved in years 19 and 15 respectively. In the lower effectiveness case, a
cumulative cost saving position is never reached based on the model.

Total net savings lie in the range -£43m (i.e. a net cost) to £35m over this period
depending on programme effectiveness (-£53m to £25m including estimated
implementation and support costs).

Produced in February 2016                                                             20
Figure 8: Scenario 3 - cumulative cost/saving profile of £350 average cost excluding
implementation costs

Produced in February 2016                                                          21
Table 2 – Scenario 1 - Annual cost/savings profile assuming £155 average cost (£250 tariff)

 Year                                           2016/17      2017/18   2018/19   2019/20   2020/21   2021/22   2022/23   2023/24   2024/25   2025/26   2026/27   2027/28   2028/29   2029/30   2030/31   2031/32   2032/33   2033/34   2034/35   2035/36
 No. of interventions                               30,000   60,000    100,000   100,000   100,000      0         0         0         0         0         0         0         0         0         0         0         0         0         0         0
 Intervention Costs (£'000)                         4,650    9,300      15,500    15,500    15,500      0         0         0         0         0         0         0         0         0         0         0         0         0         0         0
 NHS Costs (£'000)
    25% less effective                              -525     -1,618    -3,452    -5,251     -6,841    -6,376   -5,584    -4,937    -5,013     -5,936    -7,239    -8,057    -7,896    -6,761    -5,355   -3,955    -3,141     -2,126   -1,380    -1,579
    Base case                                       -684     -2,135    -4,575    -7,040     -9,210    -8,727   -7,747    -7,083    -7,291     -8,769   -10,616   -11,838   -11,730   -10,611    -8,858   -7,148    -5,672     -4,385   -3,247    -3,091
    25% more effective                              -846     -2,612    -5,629    -8,686    -11,442   -10,854   -9,685    -8,605    -8,564    -10,074   -12,322   -13,925   -14,185   -13,156   -11,333   -9,171    -7,333     -5,543   -4,121    -3,788
 Annual net costs exc. implementation (£'000)
   25% less effective                               4,125     7,682    12,048    10,249     8,659     -6,376   -5,584    -4,937    -5,013     -5,936    -7,239    -8,057    -7,896    -6,761    -5,355   -3,955    -3,141     -2,126   -1,380    -1,579
   Base case                                        3,966     7,165    10,925    8,460      6,290     -8,727   -7,747    -7,083    -7,291     -8,769   -10,616   -11,838   -11,730   -10,611    -8,858   -7,148    -5,672     -4,385   -3,247    -3,091
   25% more effective                               3,804     6,688    9,871     6,814      4,058    -10,854   -9,685    -8,605    -8,564    -10,074   -12,322   -13,925   -14,185   -13,156   -11,333   -9,171    -7,333     -5,543   -4,121    -3,788
 Implementation and support costs (£'000)           2,450     2,600    3,300     1,300      1,300        0        0         0         0          0         0         0         0         0         0        0         0          0        0         0
 Annual net costs inc. implementation (£'000)
   25% less effective                               6,575    10,282    15,348    11,549     9,959     -6,376   -5,584    -4,937    -5,013     -5,936    -7,239    -8,057    -7,896    -6,761    -5,355   -3,955    -3,141     -2,126   -1,380    -1,579
   Base case                                        6,416    9,765     14,225    9,760      7,590     -8,727   -7,747    -7,083    -7,291     -8,769   -10,616   -11,838   -11,730   -10,611    -8,858   -7,148    -5,672     -4,385   -3,247    -3,091
   25% more effective                               6,254    9,288     13,171    8,114      5,358    -10,854   -9,685    -8,605    -8,564    -10,074   -12,322   -13,925   -14,185   -13,156   -11,333   -9,171    -7,333     -5,543   -4,121    -3,788

 Cumulative net costs exc. implementation (£'000)    Yr 1     Yr 2      Yr 3      Yr 4      Yr 5      Yr 6      Yr 7      Yr 8      Yr 9       Yr 10    Yr 11     Yr 12      Yr 13    Yr 14     Yr 15     Yr 16     Yr 17      Yr 18    Yr 19    Yr 20
   25% less effective                               4,125    11,807    23,855    34,104    42,763    36,387    30,803    25,867    20,854     14,917    7,678      -379     -8,276   -15,037   -20,392   -24,347   -27,488    -29,614 -30,993 -32,573
   Base case                                        3,966    11,132    22,056    30,517    36,807    28,080    20,334    13,251    5,960      -2,810   -13,426   -25,263   -36,994   -47,604   -56,462   -63,610   -69,282    -73,667 -76,914 -80,005
   25% more effective                               3,804    10,492    20,363    27,177    31,235    20,381    10,696    2,091     -6,474    -16,548   -28,870   -42,794   -56,979   -70,135   -81,467   -90,639   -97,972   -103,515 -107,636 -111,424

Produced in February 2016                                                                                                                                                                                                                               22
Table 3 – Scenario 2 - Annual cost/savings profile assuming £270 average cost (£435 tariff)
Year 2016/17 2017/18 2018/19 2019/20 2020/21 2021/22 2022/23 2023/24 2024/25 2025/26 2026/27 2027/28 2028/29 2029/30 2030/31 2031/32 2032/33 2033/34 2034/35 2035/36
No. of interventions 30,000 60,000 100,000 100,000 100,000 0 0 0 0 0 0 0 0 0 0 0 0 0 0 0
Intervention Costs (£'000) 8,100 16,200 27,000 27,000 27,000 0 0 0 0 0 0 0 0 0 0 0 0 0 0 0
NHS Costs (£'000)
25% less effective -525 -1,618 -3,452 -5,251 -6,841 -6,376 -5,584 -4,937 -5,013 -5,936 -7,239 -8,057 -7,896 -6,761 -5,355 -3,955 -3,141 -2,126 -1,380 -1,579
Base case -684 -2,135 -4,575 -7,040 -9,210 -8,727 -7,747 -7,083 -7,291 -8,769 -10,616 -11,838 -11,730 -10,611 -8,858 -7,148 -5,672 -4,385 -3,247 -3,091
25% more effective -846 -2,612 -5,629 -8,686 -11,442 -10,854 -9,685 -8,605 -8,564 -10,074 -12,322 -13,925 -14,185 -13,156 -11,333 -9,171 -7,333 -5,543 -4,121 -3,788
Annual net costs exc. implementation (£'000)
25% less effective 7,575 14,582 23,548 21,749 20,159 -6,376 -5,584 -4,937 -5,013 -5,936 -7,239 -8,057 -7,896 -6,761 -5,355 -3,955 -3,141 -2,126 -1,380 -1,579
Base case 7,416 14,065 22,425 19,960 17,790 -8,727 -7,747 -7,083 -7,291 -8,769 -10,616 -11,838 -11,730 -10,611 -8,858 -7,148 -5,672 -4,385 -3,247 -3,091
25% more effective 7,254 13,588 21,371 18,314 15,558 -10,854 -9,685 -8,605 -8,564 -10,074 -12,322 -13,925 -14,185 -13,156 -11,333 -9,171 -7,333 -5,543 -4,121 -3,788
Implementation and support costs (£'000) 2,450 2,600 3,300 1,300 1,300 0 0 0 0 0 0 0 0 0 0 0 0 0 0 0
Annual net costs inc. implementation (£'000)
25% less effective 10,025 17,182 26,848 23,049 21,459 -6,376 -5,584 -4,937 -5,013 -5,936 -7,239 -8,057 -7,896 -6,761 -5,355 -3,955 -3,141 -2,126 -1,380 -1,579
Base case 9,866 16,665 25,725 21,260 19,090 -8,727 -7,747 -7,083 -7,291 -8,769 -10,616 -11,838 -11,730 -10,611 -8,858 -7,148 -5,672 -4,385 -3,247 -3,091
25% more effective 9,704 16,188 24,671 19,614 16,858 -10,854 -9,685 -8,605 -8,564 -10,074 -12,322 -13,925 -14,185 -13,156 -11,333 -9,171 -7,333 -5,543 -4,121 -3,788
Cumulative net costs exc. implementation (£'000) Yr 1 Yr 2 Yr 3 Yr 4 Yr 5 Yr 6 Yr 7 Yr 8 Yr 9 Yr 10 Yr 11 Yr 12 Yr 13 Yr 14 Yr 15 Yr 16 Yr 17 Yr 18 Yr 19 Yr 20
25% less effective 7,575 22,157 45,705 67,454 87,613 81,237 75,653 70,717 65,704 59,767 52,528 44,471 36,574 29,813 24,458 20,503 17,362 15,236 13,857 12,277
Base case 7,416 21,482 43,906 63,867 81,657 72,930 65,184 58,101 50,810 42,040 31,424 19,587 7,856 -2,754 -11,612 -18,760 -24,432 -28,817 -32,064 -35,155
25% more effective 7,254 20,842 42,213 60,527 76,085 65,231 55,546 46,941 38,376 28,302 15,980 2,056 -12,129 -25,285 -36,617 -45,789 -53,122 -58,665 -62,786 -66,574
Produced in February 2016 23Table 4 – Scenario 3 - Annual cost/savings profile assuming £350 average cost (£560 tariff)
Year 2016/17 2017/18 2018/19 2019/20 2020/21 2021/22 2022/23 2023/24 2024/25 2025/26 2026/27 2027/28 2028/29 2029/30 2030/31 2031/32 2032/33 2033/34 2034/35 2035/36
No. of interventions 30,000 60,000 100,000 100,000 100,000 0 0 0 0 0 0 0 0 0 0 0 0 0 0 0
Intervention Costs (£'000) 10,500 21,000 35,000 35,000 35,000 0 0 0 0 0 0 0 0 0 0 0 0 0 0 0
NHS Costs (£'000)
25% less effective -525 -1,618 -3,452 -5,251 -6,841 -6,376 -5,584 -4,937 -5,013 -5,936 -7,239 -8,057 -7,896 -6,761 -5,355 -3,955 -3,141 -2,126 -1,380 -1,579
Base case -684 -2,135 -4,575 -7,040 -9,210 -8,727 -7,747 -7,083 -7,291 -8,769 -10,616 -11,838 -11,730 -10,611 -8,858 -7,148 -5,672 -4,385 -3,247 -3,091
25% more effective -846 -2,612 -5,629 -8,686 -11,442 -10,854 -9,685 -8,605 -8,564 -10,074 -12,322 -13,925 -14,185 -13,156 -11,333 -9,171 -7,333 -5,543 -4,121 -3,788
Annual net costs exc. implementation (£'000)
25% less effective 9,975 19,382 31,548 29,749 28,159 -6,376 -5,584 -4,937 -5,013 -5,936 -7,239 -8,057 -7,896 -6,761 -5,355 -3,955 -3,141 -2,126 -1,380 -1,579
Base case 9,816 18,865 30,425 27,960 25,790 -8,727 -7,747 -7,083 -7,291 -8,769 -10,616 -11,838 -11,730 -10,611 -8,858 -7,148 -5,672 -4,385 -3,247 -3,091
25% more effective 9,654 18,388 29,371 26,314 23,558 -10,854 -9,685 -8,605 -8,564 -10,074 -12,322 -13,925 -14,185 -13,156 -11,333 -9,171 -7,333 -5,543 -4,121 -3,788
Implementation and support costs (£'000) 2,450 2,600 3,300 1,300 1,300 0 0 0 0 0 0 0 0 0 0 0 0 0 0 0
Annual net costs inc. implementation (£'000)
25% less effective 12,425 21,982 34,848 31,049 29,459 -6,376 -5,584 -4,937 -5,013 -5,936 -7,239 -8,057 -7,896 -6,761 -5,355 -3,955 -3,141 -2,126 -1,380 -1,579
Base case 12,266 21,465 33,725 29,260 27,090 -8,727 -7,747 -7,083 -7,291 -8,769 -10,616 -11,838 -11,730 -10,611 -8,858 -7,148 -5,672 -4,385 -3,247 -3,091
25% more effective 12,104 20,988 32,671 27,614 24,858 -10,854 -9,685 -8,605 -8,564 -10,074 -12,322 -13,925 -14,185 -13,156 -11,333 -9,171 -7,333 -5,543 -4,121 -3,788
Cumulative net costs exc. implementation (£'000) Yr 1 Yr 2 Yr 3 Yr 4 Yr 5 Yr 6 Yr 7 Yr 8 Yr 9 Yr 10 Yr 11 Yr 12 Yr 13 Yr 14 Yr 15 Yr 16 Yr 17 Yr 18 Yr 19 Yr 20
25% less effective 9,975 29,357 60,905 90,654 118,813 112,437 106,853 101,917 96,904 90,967 83,728 75,671 67,774 61,013 55,658 51,703 48,562 46,436 45,057 43,477
Base case 9,816 28,682 59,106 87,067 112,857 104,130 96,384 89,301 82,010 73,240 62,624 50,787 39,056 28,446 19,588 12,440 6,768 2,383 -864 -3,955
25% more effective 9,654 28,042 57,413 83,727 107,285 96,431 86,746 78,141 69,576 59,502 47,180 33,256 19,071 5,915 -5,417 -14,589 -21,922 -27,465 -31,586 -35,374
Produced in February 2016 2410.2.1. Overall health benefits
Figure 9 shows the cumulative number of QALYs gained for the different levels of
intervention effectiveness over the next 20 years compared with no intervention
(assuming three year roll-out).
Figure 9: 20 year cumulative impact of NDPP on QALYs
QALYs are gained from the first year of the NDPP with the largest annual gain of
1,000-1,600 QALYs occurring in the thirteenth year of the programme.
Subsequently, the annual QALY gains reduce as the population ages and dies, and
individuals succumb to delayed disease. Please see table 9 for the table
corresponding to this figure.
10.2.2. Diabetes cases delayed
Figure 10.shows the cumulative impact on the number of diabetes diagnoses over
the next 20 years compared with no intervention (assuming three year roll-out).
Produced in February 2016 25Figure 10: 20 year cumulative impact of NDPP on diabetes diagnoses
Figure 10 shows that the lifestyle intervention reduces diabetes risk with an
increasing number of prevented diabetes diagnoses during the first few years of the
programme. When the programme finishes (assuming the programme ends after 5
years), the number of diabetes diagnoses is less than it would have been with no
intervention for several years, under the assumption that there is a diminishing
duration of effect that lasts 5 years. This effect is counteracted by an increase in
diabetes diagnoses as the patient ages due to individuals succumbing to delayed
disease. The cumulative peak overall reduction in diabetes diagnoses occurs in the
6th year of the programme with 15,000-24,000 cases reduced. By the 20th year of
the programme, the cumulative net reduction in diabetes falls to 2,200-3,000 (that is,
it was delayed rather than prevented altogether).
Assuming base case effectiveness, for every 100,000 people enrolled in the NDPP
the cumulative impact over the following 5 years is approximately 4,500 diabetes
diagnoses prevented or delayed. If the programme continued beyond five years
benefits, such as further cases of diabetes being delayed or prevented, would
continue to accrue for new participants on the programme.
10.2.3. Cardiovascular disease cases avoided
Figure 11 shows the cumulative impact on the number of cardiovascular disease
cases over the next 20 years compared with no intervention (assuming three year
roll-out).
Produced in February 2016 26Figure 11: 20 year cumulative impact of NDPP on cardiovascular disease cases
The model estimates that 1,000-1,500 cumulative cases of CVD could be avoided in
the first 5 years. The peak annual reduction in CVD cases occurs in the 5th year of
the programme when 160-240 cases are prevented in that year. After this, there is a
slow increase in the number of net CVD cases as individuals succumb to delayed
CVD and as the population ages.
Additional information about modelling assumptions, sensitivity analysis and
modelling limitations are presented in the appendix.
10.3. Economic assessment
We can extend the financial assessment to take into account the economic costs and
benefits of the programme. There are 2 key components to this calculation:
1. We value estimated savings (costs) to reflect the additional benefits of health
care expenditure (opportunity cost of health care expenditure) in terms of
saved lives made possible by the reduced demand (additional demand) for
NHS resources. This is done by translating any net financial costs/savings into
the number of Quality Adjusted Life Years (QALYs) lost/gained using a cost-
effectiveness threshold of £20,000 (i.e. taking the bottom end of the NICE
estimated threshold of the cost of saving a QALY in the NHS at the margin).
The number of QALYs lost/gained is then multiplied by the value-per-QALY.
Current estimates find a QALY to be valued at around £60,000.
Produced in February 2016 272. We supplement this calculation with the QALYs gained directly from the
programme (i.e. not through any additional costs/savings). For example, the
number of diabetes diagnoses prevented directly as a result of the NDPP are
converted into equivalent QALY gains and valued at £60,000 per QALY.
3. The net economic impact is the sum of (1) and (2) above.
Table 5 summarises the economic assessment over 5 and 20 years after taking
these factors into account – note that the figures are undiscounted. Table 5.1
provides the undiscounted financial costs and savings position for comparison.
Table 5: Economic assessment of NDPP programme
Base-case effectiveness, 3yr roll-out, undiscounted
5 years 20 years
Year cumulative Net economic Net economic
Average cost
benefits > costs benefit (£'000) benefit (£'000)
£155 6 -55,355 1,315,917
£270 8 -189,905 1,181,367
£350 9 -283,505 1,087,767
Table 5.1
Financial costs/savings:
Base-case effectiveness, 3yr roll-out
5 years 20 years
Year cumulative Net financial Net financial
Average cost
savings > costs costs (£'000) costs (£'000)
£155 10 36,807 -80,005
£270 14 81,657 -35,155
£350 19 112,857 -3,955
Assuming a three year roll-out, by the end of the fifth year of the NDPP, the model
estimates 14,000-21,000 cases of diabetes will have been prevented and 1,000-
1,500 cases of cardiovascular disease depending on intervention effectiveness (note
that variations in tariff prices are not dependent on variation in effectiveness). Out of
those attending the first session of the programme this represents around 1 in 20
Produced in February 2016 28You can also read