Techno-Economic Trade-Off between Battery Storage and Ice Thermal Energy Storage for Application in Renewable Mine Cooling System - MDPI
←
→
Page content transcription
If your browser does not render page correctly, please read the page content below
applied
           sciences
Article
Techno-Economic Trade-Off between Battery Storage
and Ice Thermal Energy Storage for Application in
Renewable Mine Cooling System
Sajjan Pokhrel , Ali Fahrettin Kuyuk, Hosein Kalantari           and Seyed Ali Ghoreishi-Madiseh *
 NBK Institute of Mining Engineering, The University of British Columbia, Vancouver, BC V6T 1Z4, Canada;
 sajjan12@mail.ubc.ca (S.P.); alikuyuk@mail.ubc.ca (A.F.K.); hoseink@mail.ubc.ca (H.K.)
 * Correspondence: ali.madiseh@ubc.ca

 Received: 18 July 2020; Accepted: 24 August 2020; Published: 31 August 2020

 Abstract: This paper performs a techno-economic assessment in deploying solar photovoltaics to
 provide energy to a refrigeration machine for a remote underground mine. As shallow deposits are
 rapidly depleting, underground mines are growing deeper to reach resources situated at greater
 depths. This creates an immense challenge in air-conditioning as the heat emissions to mine ambient
 increases substantially as mines reach to deeper levels. A system-level design analysis is performed to
 couple PV with a refrigeration plant capable of generating 200 tonne of ice per day to help to mitigate
 this issue. Generated ice can directly be used in cooling deep underground mines via different types
 of direct heat exchangers. State-of-the-art technology is used in developing the model which aims to
 decrease the size and cost of a conventional refrigeration system run on a diesel generator. Costs
 associated with deploying a solar system are computed as per the recent market value. Energy savings,
 carbon emissions reduction, and net annual savings in employing the system are quantified and
 compared to a diesel-only scenario. In addition, two different energy storage strategies: an ice storage
 system and a battery storage system, are compared. A detailed economic analysis is performed over
 the life of the project to obtain the net cash flow diagram, payback period, and cumulative savings for
 both systems. Moreover, a sensitivity analysis is proposed to highlight the effect of solar intensity on
 solar system size and the area required for installment. The study suggests that the use of solar PV
 in mine refrigeration applications is technically feasible and economically viable depending on the
 sun-peak hours of the mine location. Additionally, the economics of deploying an ice storage system
 compared to the battery storage system has a better payback period and more cumulative savings.

 Keywords: deep mine cooling; solar electric refrigeration; ice thermal energy storage; techno-economic
 assessment; solar PV design; renewable energy in mining; solar-powered ice maker

1. Introduction
     Industrial energy usage accounts for 40% of the overall global energy demand in 2018, greater than
any other end-use sectors [1]. Mining is the second most energy-intensive industry after construction,
draining 6.2% of the global energy share [2]. Mine ventilation and refrigeration could account for about
30–40% of a deep underground mine’s total energy expense [3]. Mines are going deeper and deeper to
meet global consumer needs. In ultra-deep mines (2500 m or deeper), gravitational compression of the
intake air sinking in the downcast shaft and geothermal heat acting on the mine ambient can cause a
substantial increase in the temperature in association with the depth (auto-compression). Additionally,
virgin rock temperature in such mines could be as high as 65 ◦ C [4] due to the geothermal gradient.
However, regardless of auto-compression impact and virgin rock temperature, mine ambient air
wet-bulb temperature should not exceed 28 ◦ C [5]. Consequently, more cooling would be required for

Appl. Sci. 2020, 10, 6022; doi:10.3390/app10176022                             www.mdpi.com/journal/applsci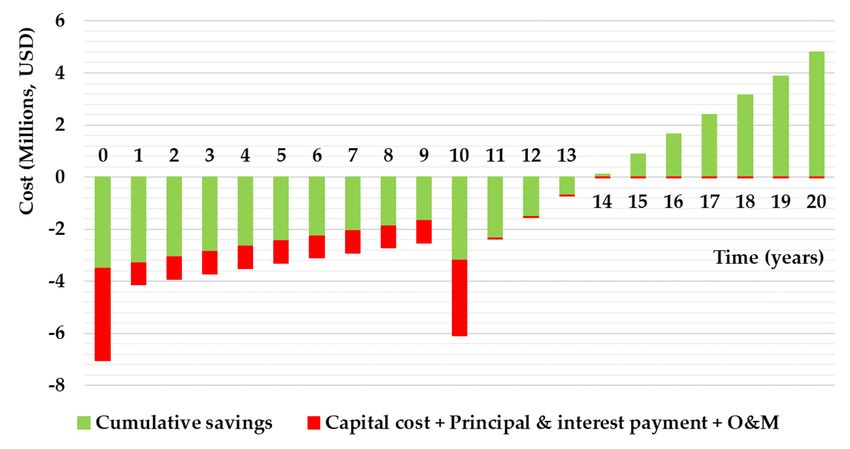
Appl. Sci. 2020, 10, 6022                                                                            2 of 16

such mines to maintain safe climatic conditions. The design of a mine cooling system is usually based
on the peak summer condition to ensure year-round, stable coolth generation. However, a refrigeration
scheme designed over peak surface load requires a relatively large size of chillers, cooling towers,
and condensers due to overestimation of annual demand. This overestimation is inevitable as the
peak load acting on these systems are usually seasonal or happen for a very limited period of the year.
This results in redundant project cost and could affect the project feasibility negatively. Fortunately,
this problem could be solved by employing a ‘by-pass’ system that could trim the peak cooling demand
and help downsize the capital cost.
      The literature suggests that energy savings in a mine ventilation and refrigeration system could be
expanded to 22% of the current trend, reducing it from 17.5 MJ/tonne of ore to 13.6 MJ/tonne of ore [6].
Zietsman et al. [7] reports annual savings of ZAR 1.65 million (South African Rand) by implementing
peak clipping via thermal storage arrangement in deep platinum mine. Plessis et al. [8] simulated an
energy efficiency strategy to forecast the potential savings of implementing a peak shaving strategy in
a real-life mine cooling system and concluded that a decrease of 33% is possible in overall electrical
energy consumption. A cooling load management initiative taken in two different South African
mines has shown that about 25% of electricity savings is an attainable figure in mine refrigeration [9].
Another energy-saving strategy for a mine cooling system with a power usage of 22 MW resulted in
132 GWh savings, equivalent to 30 million ZAR or 38% of annual refrigeration cost [10]. Undoubtedly,
gradual deepening of mines calls for more research in energy generation, storage, and management to
overcome future mine refrigeration challenges. This paper proposes a strategy to manage the peak
cooling demand of a remote underground mine using ice cubes generated from a solar photovoltaics
(PV)-driven refrigeration system.
      The concept of cooling underground mines via ice goes back to the 1980s [11]. However, back then,
the complex and delicate architecture of ice plants made it viable only for mines greater than 3000 m
in depth. With improved technology, the reduced cost of mine cooling creates more opportunity to
deploy such systems at shallower depths more feasibly. Studies show that the feasible depth has
moved from 3000 m in 1980 to 2500 m in 2010 to 1760 m in 2014 [12,13]. It is important to note that such
mines otherwise are cooled with chilled air or chilled water from the surface. It is also worthwhile to
mention that the specific heat capacity of water and the latent heat of fusion of ice is about 4.2 and
334 times the specific heat capacity of air, respectively. Chilled air is the most cost-effective cooling
solution, but lower specific heat capacity makes it unsuitable to remove extra heat from greater depths.
Hence, chilled water is used to remove heat at higher depths. However, as the depth further increases,
the pumping requirements for returning water from underground leads to considerable operation cost.
Due to the higher specific heat capacity of ice over water, the volume of ice required to dissipate an
equal amount of thermal energy is between 20% to 30% of the chilled water [14,15]. In such ultra-deep
mines, ice is used as a coolant to enhance the system performance. Belle et al. [14] mentions that
with the development in technology, the coal mines in the Bowen basin in Australia might have to
move towards ice-cooling in the near future. Although notable mines including Phakisa gold mine
and Impala gold mine in South Africa are currently using this technology, the potential use of solar
electricity for ice generation is a novel concept in mine sites.

1.1. Motivation of the Research
      Today, amidst the gradual depletion of mining resources, more and more mine enterprises are
moving to remote locations with no electric grid access. In remote sites, fossil fuels including diesel
and natural gas are the main sources of energy. In 2017, 18,364 k tonne of diesel is consumed in mining:
about 18% of the total industrial share [2]. Diesel emissions are the major contributors to the CO2
accumulation in the earth’s atmosphere by adding 123 ppm between the pre-industrial era and 2016 [16].
In mining, 71% of the emission is from fossil fuels while 29% is due to electricity usage [17]. In addition
to its environmental impacts, diesel dependence also created an escalation in the cost of electricity
generation from diesel generators. Utility cost of electricity generation from a diesel generator can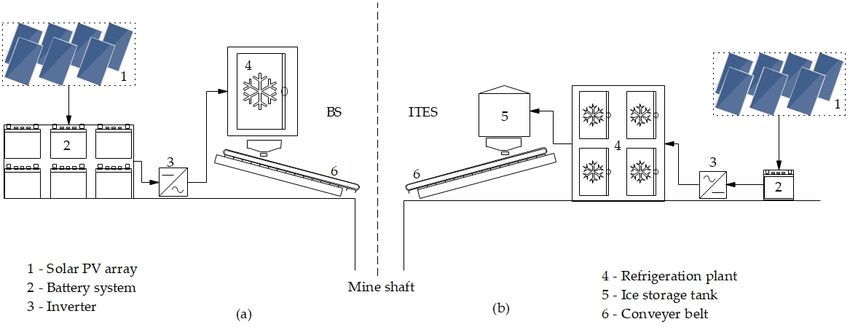
Appl. Sci. 2020, 10, 6022                                                                          3 of 16

be as high as 0.76 USD/kWh for some remote locations excluding carbon tax [18]. Thermal duties of
refrigeration units in deep mines are typically in the range of 0.5 and 20 MW [14,19]. The use of diesel
generators to generate this huge energy is a financial and an environmental concern. The motivation
of the research is the need to lower the high cost of energy that remote mines are currently using
in addition to their higher environmental footprints. The penetration of renewable energy in mine
chilling application not only assists to break the complicated relationship of mining and renewable
energy, but also improves the public perception of environmental consciousness towards mining.

1.2. Relevant Works
      Relevant works on this domain are the works that discuss about employing solar technologies in
mine sites and the energy storage technology that they opt for. Deployment of solar energy in mining
is relatively a new topic, contrary to residential and commercial sectors. The first MW-scale solar
PV system in a mine site was installed in 2012 at Cronimet’s South African chromium ore operation
generating up to 1.8 GWh of energy per year [20]. A historical breakthrough of solar penetration in
mining took place in 2013 after the installation of a 10-MW solar thermal plant in a Copper mine in
the Atacama Desert. Owned by Minera El Tesoro, the plant replaced more than 55% of the diesel fuel
consumed in the heating process for electro-extraction of copper [21]. Musselwhite mine in Canada,
Chevron molybdenum mine in the USA, and few other mines in Chile are utilizing solar energy in mine
sites. As a matter of fact, many of the world’s remote mine activities are located between 35◦ latitude
north and south where the sun is intense and reliable [22]. An ice storage technology run on solar
PV can aid in reducing the cooling plant maximum capacity in a Canadian mine [23]. Baig et al. [24]
recommends four mine sites in the Northern Territory of Australia for Concentrating Solar Panel
installation at the regional cluster level. Kim Trapani demonstrated the potential of floating solar
panels in a remote McFaulds lake in Ontario to generate electricity of 400 MW that could provide
electricity to 16 mines in this area [25]. A comprehensive literature review suggests that the solar
technology is penetrating slowly but surely in the mining industry. However, most of the current
and proposed applications include heating and electricity generation while only two publications are
discovered for cooling [23,26].
      Solar cooling has various technological options. Most widely investigated are solar electric and
solar thermal. Before 2000, only solar thermal option was considered for chilling applications due to
the high price of PV as compared to thermal collectors. However, the price in solar PV dropped by
half from 2000 to 2010 and another halving took place from 2010 to 2015 [27]. The literature suggests
that the Vapor Compression Refrigeration System (VCRS) based on solar electric has surpassed solar
thermal schemes in 2013 [28–30]. Today, PV-driven solar cooling costs about half of the best thermally
driven systems [27]. Different works of the literature are reported in solar electric cooling for diverse
domestic applications [31–33]. However, applications in mining remain largely undiscovered.
      Solar electric cooling couples VCRS with solar PV. Solar PV installed for industrial applications
like mining, requires large scale energy storage systems to resolve the intermittency problem. A battery
storage system, which stores energy in a chemical medium, is the most widely used solar energy
storage technology [34]. However, in recent years, a new realm in solar refrigeration is added after the
battery bank is completely replaced or partially substituted with Ice Thermal Energy Storage (ITES)
system. In this scheme, energy is stored in ice which later is adapted for chilling purposes. The ITES
from solar PV has a great advantage as it can be used in reducing peak refrigeration demand resulting
in peak shaving and capital cost savings. Xu et al. [35] performed an experimental research on solar
PVs operated as energy generators for ice thermal storage chillers for air-conditioning applications
and concluded that a battery bank could completely be replaced by the ITES system. Axaopoulos
and Theodoridis [33] successfully presented an autonomous battery-less solar-powered ice maker.
Salilih et al. [36] performed an analysis and simulation of solar PV-driven VCRS in a real weather
condition without battery storage. National Renewable Energy Laboratory (NREL) projects the energy
storage cost in using Li-ion battery at a utility-scale solar PV is about 80% of the total cost of a PV
Appl. Sci. 2020, 10, 6022 4 of 16
Appl. Sci. 2018,
installation 8, x FOR
[37]. The PEER REVIEW
average total annualized cost of a thermal storage system is about 12% of a4Li-ion of 17
battery, while the efficiency is about half [38]. It would be interesting to compare these two energy
of a Li-ion battery, while the efficiency is about half [38]. It would be interesting to compare these
storage technologies in an industry-scale refrigeration application.
two energy storage technologies in an industry-scale refrigeration application.
This paper examines the techno-economic aspects of installing solar PV for operating an
This paper examines the techno-economic aspects of installing solar PV for operating an ice-
ice-generating machine to cool an underground mine. A thorough literature review suggests only
generating machine to cool an underground mine. A thorough literature review suggests only two
two publications to study the use of solar energy in mine cooling applications [23,26]. Both of the
publications to study the use of solar energy in mine cooling applications [23,26]. Both of the analyses
analyses are performed for a specific mine site and are unsuitable to apply in decision making for
are performed for a specific mine site and are unsuitable to apply in decision making for the other
the other mine locations. They also compare thermal storage strategies with a battery system but do
mine locations. They also compare thermal storage strategies with a battery system but do not
not consider the battery replacement cost after standard charging and discharging cycles. This paper
consider the battery replacement cost after standard charging and discharging cycles. This paper
presents a detailed numerical code developed in Excel to design a solar PV system and to compare
presents a detailed numerical code developed in Excel to design a solar PV system and to compare
two different energy storage technologies for the proposed application: battery storage and ITES.
two different energy storage technologies for the proposed application: battery storage and ITES. A
A system-level analysis is performed for a PV-run refrigeration system capable of generating 200 tonne
system-level analysis is performed for a PV-run refrigeration system capable of generating 200 tonne
ofofice per day. Carbon emission reduction is quantified in substituting a diesel-operated conventional
ice per day. Carbon emission reduction is quantified in substituting a diesel-operated conventional
refrigeration
refrigerationsystem
systemwith
withaasolar-operated
solar-operatedarrangement.
arrangement. The financial impact
The financial impact of
of substituting
substitutingbattery
battery
with ITES is performed in terms of cash flow analysis, capital cost, cumulative savings,
with ITES is performed in terms of cash flow analysis, capital cost, cumulative savings, and payback and payback
period
periodconsidering
consideringthe thetime
time value
value ofof money.
money. ToTo make
make anan analysis
analysis independent
independent of of refrigeration
refrigeration
requirement and mine locations, results are presented in terms of sun peak hours
requirement and mine locations, results are presented in terms of sun peak hours enabling enabling easy decision
easy
making for investors. Finally, a sensitivity analysis is proposed to investigate the variation
decision making for investors. Finally, a sensitivity analysis is proposed to investigate the variation of solar
intensity on energyonand
of solar intensity economic
energy indexes. indexes.
and economic
2. Methodology
2. Methodology
Solar
SolarPV PVisisan
anintegral
integralcomponent
componentofofthetheproposed
proposediceicerefrigeration
refrigerationsystem,
system,asasshown
shownininFigure
Figure1.
Electricity from
1. Electricity solar
from PV PV
solar operates the the
operates refrigeration plant
refrigeration to generate
plant 200200
to generate tonne of ice
tonne perper
of ice day. This
day. ice
This
can be fed into the vertical shafts of underground mines which later can be used for
ice can be fed into the vertical shafts of underground mines which later can be used for refrigeration refrigeration
purposes.
purposes.AAconveyer
conveyerbelt
beltisisused
usedto
tocarry
carry ice
ice from
from the
the refrigeration
refrigeration plant
plant to the vertical
to the vertical shaft.
shaft.
Figure1.1.(a).
Figure (a).Flow
Flowschematics
schematics of
of Battery
Battery Storage
Storage System
System (BS)
(BS) and
and (b).
(b). Flow
Flow schematic
schematic of
of Ice
IceThermal
Thermal
EnergyStorage
Energy StorageSystem
System(ITES).
(ITES).
The
The refrigeration
refrigeration plant
plant isis assembled
assembled in in two
two unique
unique configurations.
configurations. TheseThese twotwo different
different
arrangements
arrangementswith with corresponding
corresponding component
component denomination
denomination are are presented
presented as as options
options 11 and
and 22 in
in
Figure
Figure1.1.In
In both
both configurations, solarPV
configurations, solar PVisisused
usedtoto generate
generate electricity
electricity thatthat ultimately
ultimately powers
powers the
the refrigeration
refrigeration plant.plant. The configurations
The configurations only in
only differ differ
terms inofterms of their design
their internal internal design
aspects; aspects;
however,
they should
however, theystill share still
should many commonalities
share (i.e., number(i.e.,
many commonalities of conveyor
number belts, size of PV
of conveyor required,
belts, size ofand
PV
so on.) Inand
required, option 1, DCInfrom
so on.) solar1,PV
option DCis from
storedsolar
in a PV
lithium-ion
is storedbattery bank that isbattery
in a lithium-ion connectedbankto that
the
isinverter.
connected This
to inverter provides
the inverter. This AC power
inverter neededAC
provides to power
operateneeded
the refrigeration
to operate plant. Then, the
the refrigeration
refrigeration
plant. Then, theplant generates plant
refrigeration ice to generates
be fed to the vertical
ice to be fedintake
to theshaft withintake
vertical the help ofwith
shaft conveyors and
the help of
belt system.
conveyors andOption 2 is different
belt system. Optionthan option 1 in
2 is different thanterms of the
option 1 inbattery
terms bank
of theand the ice
battery bankstorage tank.
and the ice
The battery bank in option 2 is smaller as compared to option 1 and only acts as a buffer stock between
solar panel and compressor of the refrigerator. Here, the use of the battery is just to supply theAppl. Sci. 2020, 10, 6022 5 of 16
storage tank. The battery bank in option 2 is smaller as compared to option 1 and only acts as a buffer
stock between solar panel and compressor of the refrigerator. Here, the use of the battery is just to
supply the constant voltage with minimum noise, and the initial surge current requirement rather than
energy storage. It is significant to note that option 2 can only operate during sun hours and the system
is designed to generate a fixed amount of cooling per day (200 tonne of ice). Hence, the capacity factor
of the refrigeration plant for this system is lower than the option 1 it requires a greater number of
refrigerators. In option 2, ice generated from solar configuration is stored in the storage tank which
later is used for refrigeration purposes during evening or night hours when there is no sun in the sky.
For convenience, option 1 is referred to as Battery Storage System (BS) and option 2 is referred to as Ice
Thermal Energy Storage System (ITES) hereafter.
2.1. State-of-the-Art Comparison
State-of-art technology is used in designing the solar-refrigeration system. Components with
improved durability and lowered costs, and which are available in the market are employed. Today,
independently confirmed efficiencies of solar cells and modules are easily higher than 20% [39];
however, the industrially manufactured solar modules have an efficiency in the range of about 20%.
The PV module used in this analysis is a poly-crystalline module with an efficiency of 19.2% [40].
Several companies in Europe and America manufacture ice-generation refrigerators for different
applications ranging from concrete cooling to mine cooling to fish processing to beverage cooling.
These machines can generate ice from the water with a temperature of up to 35 ◦ C and an ambient
temperature as high as 40 ◦ C [41]. Similarly, several companies manufacture industrial-scale ice storage
systems that could store any type of ice for several days. The typical size of these devices ranges from
20 to 250 tonne per container. They have a fully automatic ice discharge system with a conveyer belt
and are suitable for standard or tropical climate. The refrigeration plant and the ice storage system
considered for this analysis are manufactured by KTI-Plersch Kältetechnik, Germany. These refrigerator
plants rely on ammonia as a refrigerant, and have a designed evaporator temperature of −13 ◦ C and
can generate pure ice from the intake water [42]. Lead-acid batteries were the best options for solar
PV systems a few years ago. However, with recent developments in technology, lithium-ion batteries
outperformed lead-acid batteries [43,44]. In addition to a higher life, they have low losses and extended
cycle life with lower storage depletion rates as compared to lead-acid batteries [45]. Hence, in this
analysis, the lithium-ion batteries with a battery management system is used.
2.2. Mathematical Modeling
2.2.1. Solar PV Design
Mathematical modeling of the system starts with the rated power of the refrigerator. This rated AC
power of the machine is obtained from the manufacturer datasheet and is denoted as Prated . The power
needed is provided by the solar PV and battery system which is connected to the refrigerator through
inverter of efficiency ηinv . With this efficiency, the maximum power needed in DC from the solar
system is calculated using Equation (1). Inverter efficiencies of up to 99% can be found thanks to the
research and development in power electronics. Inverter used in this analysis has a DC-to-AC ratio of
1.0 and an efficiency of 97% [46].
Prated
Maximum power required in DC (Pmax, DC ) = (1)
ηinv × DC − AC ratio
This power is consumed by the refrigeration machine throughout a day to generate 200 tonne
of ice. Consequently, the total energy required in kWh by the system per day is calculated by
using Equation (2).
Total energy demand per day in DC (Etotal ) = Pmax,DC × 24 (2)Appl. Sci. 2020, 10, 6022 6 of 16
This is the total amount of energy to be generated using solar PV each day. The solar system is
designed to be a stand-alone solar power system. Solar PV module chosen for this application is a
400 W poly-crystalline module manufactured by Canadian solar with a rated efficiency of 19.2% [40].
Electrical data including optimum operating voltage and optimum operating current are obtained from
the datasheet available from the manufacturer. To calculate the design operating voltage, Equation (3),
a voltage efficiency of 90% is used. This analysis is performed to ensure acceptable module output
current which is less than optimum operating current.
PV operating voltage Voperating = V opt. power voltage × ηvoltage (3)
The guaranteed power output from a single PV module at STC is obtained from relation (4)
with a safety factor of 1.10. This number is also verified from the I–V curve available from the
manufacturer’s datasheet.
Voperating × Ioperating
Gurrented power P gurrented = (4)
S.F.
Output power from a solar PV also depends on ambient operating temperature. So, thermal
efficiency is accounted for obtaining an output power form PV by using Equation (5). An equation to
determine the thermal efficiency of the module is given by Equation (6). Proposed by Evans [47], βre f
in the equation represents the temperature coefficient of the module, while Tc and Tre f are the solar
cell temperature and reference temperature respectively. Since, the system is not designed for specific
mine location, no ambient temperature data is available to calculate exact thermal efficiency of the
system. Thermal efficiency considered for this design analysis is 90%.
Poperating = P gurrented × ηthermal (5)
h i
ηthermal = 1 − βre f Tc − Tre f (6)
Total energy output from each module per day is calculated using peak sun hours for the desired
location using Equation (7) with a safety factor of 1.10. Peak sun hours (SHPeak ) is the number of
hours during which the intensity of sunlight is 1000 W/m2 for that specific place per day. The code
is developed in such a way that; with the input of sun peak hours for any mine location, a system
feasibility result can be concluded.
Poperating × SHpeak
Eper module per day = (7)
S.F.
Using this number, the total number of modules required to meet the energy demand is calculated
using Equation (8) !
Etotal
Ntotal = (8)
Eper module per day
Equation (9) gives the number of modules required per string. These are the numbers of solar
panels that should be connected in series to provide an adequate voltage to the battery supply. This is
also equal to the inverter input DC voltage supply.
Vinverter, DC
Nseries = (9)
Voperating
The total number of strings in parallel is calculated by using the following relation (10).
In computing the number of series and parallel panels, every panel number is adjusted to the
next higher integer.
Ntotal
Nparallel = (10)
NseriesAppl. Sci. 2020, 10, 6022 7 of 16
Finally, nominal rated array output is calculated using Equation (11). This is the rated module
output in watts as per the manufacturer.
Nominal rated array output = Ntotal × PVrated power (11)
The total area of the solar field required is calculated by multiplying the individual area of the solar
panel with total numbers of solar panels as following. A solar panel used is of size 2108 × 1048 × 40 mm
in dimensions.
Total area of solar field = Ntotal × area of a module (12)
2.2.2. Battery System Design
The solar system can generate the energy required to operate the machine by converting energy
from the sunlight into a flow of electrons using the photovoltaic effect. However, this energy is
generated only when there is solar irradiation. This section describes the design of the battery bank,
which is the essential component for BS. The total energy required for the refrigeration machine from
Equation (2) is used as a design criterion for the battery bank. This amount of energy is to be supplied
by the battery system in a single day to operate the system efficiently. This battery storage system
is designed independently from the photovoltaic array. To size the battery bank, the total electrical
load is converted from watt-hours to amp-hours. Battery capacity in amp-hours is calculated by
using Equation (13).
Etotal required × 1000
Total amp-hour demand per day = (13)
Batterybus voltage
This battery bus voltage provides the nominal operating DC for the system. The battery bus
voltage for this application is picked as 600 V, which also corresponds to the DC input voltage for the
inverter. The maximum fraction of capacity that can be withdrawn from the battery, also known as
the allowable depth of discharge, is considered in designing the battery system. For this application,
0.8 depth-of-discharge is considered. This gives the actual required battery capacity, as shown
in Equation (14).
Total amp-hour demand per day
Actual battery capclity = (14)
depth-o f -discharge
Once the total required capacity of the battery bank is estimated, the battery to be used in the
system is selected. The Tesla Powerball battery specification data sheet is used for the selection of the
battery. Accordingly, the battery selected in this case has a usable energy storage capacity of 13.5 kWh.
The total number of batteries in series and parallel is given by the Equations (15) and (16).
Actual battery capacity
Nparallel = (15)
amp-hour capacity of selected battery
Battery bus voltage
Nseries = (16)
voltage of selected battery
Batteries in series are arranged in such a way that the DC voltage provided by the battery system
corresponds to the inverter DC input voltage. Additionally, the number of batteries in parallel is fixed
to provide the battery required capacity. The overall idea is to make sure that the required amp-hour
is supplied with the required voltage supply. Equations (17) and (18) provide the total number of
batteries required and total battery capacity, respectively.
Ntotal = Nseries × Nparallel (17)
Total battery capacity = Ntotal × Usable energy of sin gle battery (18)Appl. Sci. 2020, 10, 6022 8 of 16
2.2.3. Calculations of Savings
In this section, power savings, energy savings, diesel savings, reductions in carbon emissions,
and carbon tax savings are quantified. Here, rated AC power of the refrigerator is used as a reference
to perform an analysis. Energy savings per year in kWh is given by Equation (19),
Esavings = Powersavings × 24 × 365 (19)
The equivalent amount of diesel savings is calculated by converting energy savings to joules
and dividing by the calorific value of diesel. The calorific value of diesel used in this analysis is
35.9 MJ/liter [48]. The efficiency of a diesel generator is accounted for in calculating the total amount
of energy used. In this study, the efficiency of the diesel generator is used as 33% and the amount of
diesel savings is given by Equation (20).
Esavings
Dieselsavings = (20)
calori f ic value × η generator
The quantification of diesel emission is made based on the amount of diesel saved over a year.
This quantity is given by relation (21). For this calculation, an emission rate of 2.63 kg of CO2 per liter
of diesel is used while a carbon tax rate of USD 35 per tonne of CO2 is used in the analysis [16].
CO2 savings = quantity of diesel savings × emission per liter (21)
Finally, total cost savings is the summation of energy cost savings from diesel generators and
carbon savings. This is calculated by using formula (22).
Cost savings = Energysavings × Diesel cos t + (CO2 emissions × carbon tax) (22)
2.2.4. Economic and Financial Calculations
Net Present Value (NPV) of the project is calculated based on Equation (23), where i is the discount
rate and Fn is the net cash flow in year n. Net cash flow is the difference between net savings and net
expenditure over the year. Net savings include the savings from energy and carbon emissions savings,
while the net expenditure includes the capital cost, principal and interest payment, and Operation and
Maintenance cost.
N
X Fn
NPV = (23)
n=0
( 1 + i)n
Annual loan payment for the project is calculated using the following Formula (24), where i and n
are interest rate and the loan payback period in years, respectively.
i × (1 + i)n
" #
Annual loan payment amount = Total loan amount × (24)
(1 + i)n − 1
Levelized cost of energy (LCOE) is that cost that, if assigned to every unit energy produced by the
system over the analysis period, will equal the total life-cycle cost of the project discounted back to the
base year. LCOE is calculated using an Equation (25). The numerator in Equation (25) represents all
costs of the project over its life while the denominator is the total energy generated from the project
over its life, both converted to a present value. Here, Cn is the total cost and Qn is the energy produced
in year n.
PN Cn
n = 0 (1 + i)n
LCOE = P Qn
(25)
N
n = 1 (1 + i)nAppl. Sci. 2020, 10, 6022 9 of 16
Table 1 summarizes the different economic parameters used in the analysis. The solar installation
and system commissioning time is assumed to take a year. For both systems, half of the total capital
cost comes from the company’s equity whereas another half from a loan. The borrowed loan is paid
back in 10 equal installments in 10 years from the time after the system is commissioned. This loan
repayment schedule is also known as ‘even total payment’ method. The installation cost of PV and
battery systems are obtained from the National Renewable Energy Laboratory (NREL) report as of 2018
pricing structure [37]. Additionally, the cost of the panel, inverter, and battery is verified with other
manufacturing companies [46,49–51]. The cost of a refrigeration plant and its accessories are obtained
from a plant manufacturing company. Fixed cost, variable cost, direct cost, and indirect cost associated
with the project execution are also accounted for in the analysis. The proposed system assumes that the
solar system and battery system are co-located. The cost of the solar system is expressed in USD/kW
while the cost of the storage system in USD/kWh and the cost of refrigeration plant in USD/tonne of
ice generation.
Table 1. Economic evaluation parameters of proposed systems.
Time Parameters Solar Cost Share (USD per W) Battery Cost Share (USD per kWh)
Analysis year 2020 Solar Panel 0.47 Battery 209
Year construction starts 2020 Inverter 0.08 Structural 13
Construction period (year) 1 Structural and electrical 0.25 Electrical 36
Project life (years) 20 Installations and labor 0.13 Installations and labor 23
Inflation/discount rate (%) 2 Shipping and handling 0.16 Shipping and handling 12
Financing Parameters PII 0.09 PII 8
Equity (%) 50 Sales tax 0.05 Sales tax 22
Loan (%) 50 Developer overhead 0.36 Developer overhead 10
Financing rate (%) 8 Contingency 0.04 Contingency 10
Loan term years 10 Developer net profit 0.11 Developer net profit 18
Salvage factor (%) 5 Total 1.74 Total 361
Note: PII = Construction permitting, interconnection, testing, and commissioning.
3. Results and Discussions
3.1. Solar PV
The total power drawn by the compressor and its accessories is 443 kW, which provides a cooling
capacity of 1.2 MW with a COP of 2.8. To run this device merely with solar system, nominal array
output of 2.5 MW is needed for a place with 6-h of sun peak. Since most of the remote mines are
located in high solar intensity zones, this solar irradiation intensity is considered as a standard number
and is used in analysis hereafter. Additionally, 3.4 acres of land is needed to install the proposed
solar photovoltaic system. Figure 2 illustrates the design change in the solar PV system, and the
corresponding change in the Levelized Cost of Energy (LCOE) and the area of the solar field required
for different sun peak hours. As expected, there is a strong correlation between solar intensity, LCOE,
and the area of the solar field required associated with sun peak hours. An increase in sun peak hours
leads to an obvious decrease in installation capacity, LCOE, and area of installation field required.Appl. Sci. 2020, 10, 6022 10 of 16
Appl. Sci. 2018, 8, x FOR PEER REVIEW 10 of 17
6000 14
PV size
Area of field (acres) & LCOE (United
5000 Area of field 12
LCOE
10
4000
PV size (kW)
States Cents)
8
3000
6
2000
4
1000 2
0 0
3 4 5 6 7 8 9
Number of sun peak hours
Figure 2. PV size, Levelized Cost of Energy (LCOE), and area variation with solar intensity.
Figure 2. PV size, Levelized Cost of Energy (LCOE), and area variation with solar intensity.
3.2. Battery
3.2. Battery
To operate a refrigeration plant for a day, 11.5 MWh of energy is required. This energy is to be
storedToinoperate a refrigeration
the battery bank. The plant for abank
battery day, is 11.5 MWh ofwith
designed energy is required.
an allowable This of
depth energy is to be
discharge of
stored in the battery bank. The battery bank is designed with an allowable depth
0.8 and provides 600 V of battery bus voltage to the inverter. With these design criteria, the totalof discharge of 0.8
and provides
battery 600ofV23.9
capacity of battery bus14.3
KA-h and voltage
MWh to is
the inverter.
required to With these
operate thedesign
system.criteria,
However, the total battery
in designing
capacity
the batteryof 23.9 KA-h
system, andthe
since 14.3 MWh is required
refrigeration plant istoinoperate
operation thethroughout
system. However,
the day,in designing
the only energythe
battery
requiredsystem, since
to operate thethe refrigeration
system plant ishours
during no-sun in operation throughout
is to be stored the day,bank.
in the battery the only
That energy
means,
required to operate
the refrigerator is in the systemduring
operation duringthe
no-sun
sunshinehours is tofor
hours be which
storedthein the battery
energy bank.
is not ThatWith
stored. means,
this
the refrigerator
approach, is inbattery
the total operation during
capacity the sunshine
required hours for
for the system which
is 10.6 MWh theand
energy
17.9 is not stored. With
KA-h.
this approach, the total battery capacity required for the system is 10.6 MWh and 17.9 KA-h.
3.3. Savings
3.3. Savings
Table 2 summarizes the key technical findings, along with the annual savings after the project comes
to execution. On replacing
Table 2 summarizes thekey
the conventional refrigeration
technical findings, alongsystem
with the with a solar-powered
annual savings afterrefrigeration
the project
system,tototal
comes energy savings
execution. On replacingof 10.6the MWh per day is refrigeration
conventional achieved. It system
is worthwith mentioning that this
a solar-powered
savings is just for a single refrigeration unit. If multiple units are to be
refrigeration system, total energy savings of 10.6 MWh per day is achieved. It is worth mentioning used depending on the
refrigeration
that demand,
this savings is just this
for anumber will get multiplied
single refrigeration accordingly.
unit. If multiple unitsSimilarly,
are to be usedenergy savings per
depending on
yearrefrigeration
the per unit is 3.9 GWh. In
demand, thisaddition,
number considering capital accordingly.
will get multiplied cost and operation andenergy
Similarly, maintenance
savingscost,
per
the Levelized
year Cost
per unit is 3.9of Energy
GWh. In (LCOE)
addition, from the solar system
considering capital is calculated
cost as USDand
and operation 0.06/kWh. This energy
maintenance cost,
is achieved
the Levelized at the
Costcost
of of 1180 Kilo
Energy (LCOE) litersfrom
of diesel with system
the solar a dieselisgenerator
calculated running
as USD at 0.06/kWh.
an efficiency of
This
33%. The calorific value of diesel considered is 35.9 MJ/liter [48]. With global
energy is achieved at the cost of 1180 Kilo liters of diesel with a diesel generator running at an average diesel price [52],
and including
efficiency transportation
of 33%. The calorific and storage
value costs, total
of diesel savingsisfrom
considered 35.9 fuel is USD
MJ/liter 0.95
[48]. million
With globalperaverage
annum.
Unit cost
diesel priceof[52],
diesel
andper liter is USD
including 0.81 and the
transportation andcost of energy
storage costs, from diesel generator
total savings from fuelisiscalculated
USD 0.95
million per annum. Unit cost of diesel per liter is USD 0.81 and the cost of energy from comes
as USD 246 per MWh. Moreover, electricity generated from diesel plants is ineffective and diesel
at the costisofcalculated
generator significantasenvironmental
USD 246 per MWh. risks. These risks electricity
Moreover, may be associated
generatedwith fromdiesel
dieselparticulate
plants is
matter, vapor,
ineffective andand greenhouse
comes at the cost gases. Although environmental
of significant the effect of particulates
risks. These andrisks
vapor mayis not accounted
be associated
for, the GHG emission effect is evaluated. A total of
with diesel particulate matter, vapor, and greenhouse gases. Although 2.63 kg of CO is released per liter
2 the effect of particulates of diesel
and
combustion
vapor [16] and afor,
is not accounted total
theemission
GHG emissionof 3103effect
tonneis is saved in A
evaluated. penetrating
total of 2.63solarkg ofsystem to run a
CO2 is released
refrigerator.
per With combustion
liter of diesel a carbon tax [16]rate and
of USD 35 per
a total tonne of CO
emission 31032 , total
tonnecarbon
is savedsavings is computed
in penetrating to
solar
USD 108k per annum.
system to run a refrigerator. With a carbon tax rate of USD 35 per tonne of CO2, total carbon savings
is computed to USD 108k per annum.Appl. Sci.
Appl. Sci. 2020,
2018, 10,
8, x6022
FOR PEER REVIEW 11
11 of 17
of 16
Table 2. Key technical findings.
Table 2. Key technical findings.
S.N. Variable Value Unit
S.N. 1 Variable
Solar PV capacity Value
2.5 MW Unit
1 2 Energy
Solar storage capacity
PV capacity 10.6
2.5 MWh/day MW
2 3 Energy
Levelized storage
Cost capacityfrom PV
of Energy 10.6
0.06 MWh/day
USD/kWh
3 Levelized Cost of Energy from PV 0.06 USD/kWh
4 Energy savings from Diesel 3.9 GWh/year
4 Energy savings from Diesel 3.9 GWh/year
5 5 Dieselsavings
Diesel savings 1180
1180 Kilo liter/year
Kilo liter/year
6 6 Total cost of diesel per
Total cost of diesel per liter
liter 0.81
0.81 USD USD
7 7 Diesel energycost
Diesel energy costper
per
MWhMWh 246246 USD USD
8 8 Carbon emission
Carbon emissionsavings
savings 3103
3103 Tonne/year
Tonne/year
9 Operating expenses savings 1.1 million (USD)/year
9 Operating expenses savings 1.1 million (USD)/year
3.4.
3.4. Capital
Capital Cost
Cost
With
With thethe cost
costbreakdown
breakdownfrom from Table
Table 1, total
1, the the total capital
capital cost ofcost of the is
the project project is calculated.
calculated. Figure 3
Figure
depicts3thedepicts the waterfall
waterfall chart showing
chart showing the capital the capital
cost cost requirement
requirement for two scenarios.
for two different different scenarios.
The total
The total
initial initial investment
investment for solar for solar
panel andpanel and its accessories
its accessories is foundistofound
be USD to be
4.3USD 4.3 including
million million including
AC/DC
AC/DC
inverter.inverter.
With the With the battery
battery management
management cost included,
cost included, the capital
the capital cost cost of the
of the battery
battery system
system is
is calculated as USD 3.8 million. Considering the decrease in electrochemical
calculated as USD 3.8 million. Considering the decrease in electrochemical performance during performance during
charging
charging and discharging cycles
and discharging cyclesof ofthe
thelithium-ion
lithium-ionbattery,
battery,battery
batteryreplacement
replacement is is required
required every
every 10
10 years
years or after
or after 36003600
cyclescycles
[53]. [53]. Therefore,
Therefore, for theforbattery-based
the battery-based
system, system, an additional
an additional cost is
cost is needed
needed
at the endat the end 10-year
of each of each operational
10-year operational
period. Thisperiod. This isasshown
is shown ‘battery asreplacement’
‘battery replacement’ cost
cost in Figure
in
3b.Figure 3b. The
The price price of lithium-ion
of lithium-ion batteries
batteries after afteris10projected
10 years years is based
projected based
on the on the published
available available
published resources
resources [54–56], and [54–56], and accounting
accounting the time value the of
time valueThe
money. of money. The of
capital cost capital costrefrigeration
a single of a single
refrigeration
plant is USDplant is USD 910k
910k including includingand
installation installation
commission and commission
charge. The charge.
storage The
coststorage
of ice iscost
USDof32 iceper
is
USD
kWh 32 andperthekWh
totaland
cost the
oftotal cost of the
the required required
storage storage
system system
is USD 350k is [38].
USDFor 350k [38].aFor
ITES, ITES,
small a small
amount of
amount of battery is required to supply sufficient voltage and current for the refrigerator.
battery is required to supply sufficient voltage and current for the refrigerator. This number at least This number
at least should
should be equal betoequal
the to the number
number of batteries
of batteries in series
in series givengiven by Equation
by Equation (15).(15). However,
However, to betoon
be the
on
the
safesafe side,
side, thethe battery
battery system
system is is designed
designed totosupply
supplycontinuous
continuousenergyenergydemand
demandfor forhalf
half an
an hour.
Corresponding total cost of such a designed battery system
Corresponding total cost of such a designed battery system is USD 100k. is USD 100k.
(a) (b)
Figure 3.
Figure 3. (a) Capital cost breakdown for ITES
ITES and
and (b)
(b) Capital
Capital cost
cost breakdown
breakdown for
for BS.
BS.
Clearly,
Clearly,the
theinvestment
investmentcostcostofofBS
BSisis higher
higher than
than that
that of
of ITES.
ITES. Although
Although both
both systems
systems shown
shown here
here
share
share the
the same
same solar
solar PV
PV cost,
cost, the
the difference
differencecan canbe
beattributed
attributedto tothe
thebattery
batterycost.
cost. Another
Another important
important
point
point that
that should
should bebe noted
noted isis the
the cost
cost of
of a refrigerator
refrigerator in
in an
an ITES.
ITES. The refrigeration
refrigeration cost
cost for
for this
this option
option
is
is four
four times
times the
the BS.
BS. As mentioned earlier,
earlier, both
both systems
systems areare designed
designed to
to generate
generate an
an equal
equal amount
amount ofof
ice
ice each
eachday,
day,and
andITES
ITESdoes notnot
does have a battery
have bankbank
a battery to operate duringduring
to operate non-sun hours. hours.
non-sun Hence, Hence,
to ensure
to
the required
ensure amount amount
the required of ice generation, multiple multiple
of ice generation, refrigerators should beshould
refrigerators used. This analysis
be used. Thisassumes
analysis
assumes the number of sun-peak sours to be six, hence four such refrigerators are needed which
increases the capital cost of refrigerators in ITES.Appl. Sci. 2020, 10, 6022 12 of 16
the number of sun-peak sours to be six, hence four such refrigerators are needed which increases the
capital cost of refrigerators in ITES.
3.5. Cash Flow Analysis
The financial model of the analysis considers that half of the total investment cost in both cases is
from the company’s equity while the remaining half is loaned from a financial institution. As mentioned
in Table 1, inflation and interest rates used in the analysis are 2% and 8%, respectively [57]. With this
hypothesis, as can be inferred from Table 3, the total financed amount is equal to USD 4.1 million in
ITES and USD 5.6 million in BS. In both cases, loan financing is done at the beginning of the project
and is paid back in 10 equal installments over the first 10 years after the project comes in operation.
Although the total capital cost of the project is higher in BS, this amount also includes the battery
replacement cost that will take place after 10 years of operation. It is worth mentioning that the useful
life of the mine considered is 20 years and the economics will change for a shorter or longer mine
lifecycle period. Since half of the total project investment comes from a loan at the beginning of the
project, battery replacement cost is the part of company’s equity. Due to this reason, as shown in
Table 3, initial equity in ITES is considered as USD 4.1 million, which accounts for USD 500k more than
of BS’ equity share. Although the equity amount of ITES at the beginning is more than that of BS, due to
the larger loan amount, annual loan payment of the project is higher in BS than ITES by USD 218k.
Table 3. Key economic findings (Currency: USD).
Loan Equity
Option Total Capital Cost Annual Loan Payment Total Savings Payback Period
Year ‘00 Year ‘00 Year ‘100
ITES 8.3 million 4.1 million 4.1 million - 612k 7.8 million 10 years
BS 11.2 million 5.6 million 3.6 million 2.0 million 830k 4.8 million 13 years
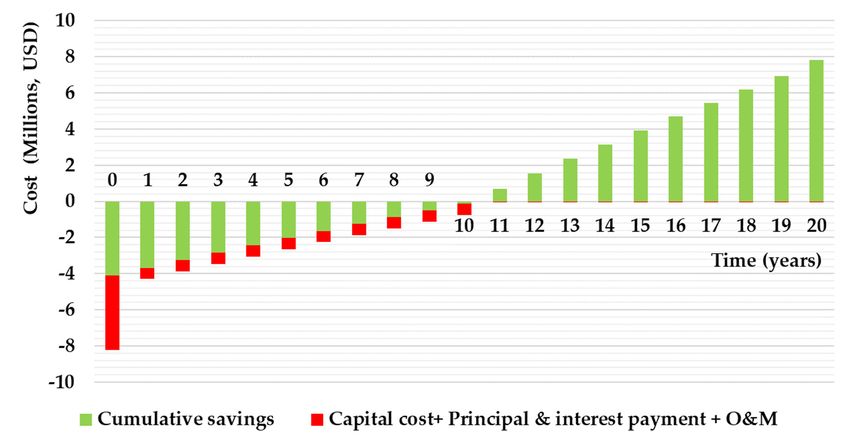
Figures 4 and 5 represent the net cash flow diagram for two different setups. The red color in
the figures indicates the net cash outflow, while the green color represents total cumulative savings
at the end of each fiscal year. Cash outflow includes capital cost, loan payment (principal and
interest), and operation and maintenance cost while cumulative savings is the operating income from
annual savings. Net Present Values are used in calculating cumulative savings for a sound economic
comparison. As bank loan is paid in the first 10 years, cash outflow after the 10th year represents only
operation and maintenance costs. Year ‘zero’ is the construction year and no savings are made until
the project comes in operation, which is at the beginning of the year ‘one’. This means, cash flow in
year ‘zero’ refers only to the initial investment made from the company’s equity. It should be recalled
that both proposed systems generate equal cooling effect irrespective of the energy storage technology
chosen. This results in an equal amount of operating income or savings over a year. Equal annual
savings with unequal loan payment amount results in different cumulative savings over the period.
As depicted in Figures 4 and 5, investing in ITES returns more savings. With project implementation,
at the end of the project life, total savings for BS and ITES are estimated at USD 4.8 million and
7.8 million, respectively.
Hence, from the company’s viewpoint, with an initial equity investment of USD 4.1 million,
ITES pays USD 7.8 million in total at the end of the project. On the other hand, BS returns only
USD 4.8 million for an initial investment of 5.6 million. This indicates that both options are in profit at
the end of the project. But, while comparing these two systems, cumulative savings for the ITES is
greater than the BS by USD 3.0 million.
Cash flow diagram also depicts the payback period for both projects. As initial equity of the
ITES is higher than the BS by USD 500k, the cumulative saving of ITES is more negative than BS
at the beginning of the project. But once the project comes in operation, things go in the opposite
direction due to more amount of loan payment in BS. One more factor to deaccelerate the payback
period of the BS is the additional capital requirement in replacing the Li-ion battery at the end of theAppl. Sci. 2020, 10, 6022 13 of 16
10th year. This decreases the cumulative savings by USD 2 million and hence increases the payback
period. For ITES, a period of 10 years is enough to pay back the investment. However, this time
increases to 13 years for the BS due to larger capital size and higher annual loan of the associated
system. Hence, the ITES storage system is a better option out of two considered alternatives in terms
Appl. Sci. 2018, 8, x FOR PEER REVIEW 13 of 17
of cumulative savings and payback period.
Appl. Sci. 2018, 8, x FOR PEER REVIEW 13 of 17
Figure 4. Cash flow diagram for ITES.
Figure 4.
Figure Cashflow
4. Cash flow diagram
diagram for
for ITES.
ITES.
Cashflow
Figure5.5.Cash
Figure flowdiagram
diagramofofBS.
BS.
Figure 5. Cash flow diagram of BS.
4. Conclusions
Cash flow diagram also depicts the payback period for both projects. As initial equity of the ITES
Cash
is higherThisthan flowthediagram
BS by also
techno-economic depicts
analysis
USD the cumulative
500k,explored
the payback period
the potential for
saving both
of using
of ITESprojects.
solar Asnegative
initial equity
photovoltaics
is more inthan ofBSthe
cooling atITES
remote
the
is higher
underground
beginning than the BS
of themines.
project.by
The USD
But 500k,
proposed the
once the solar cumulative
projectsystem saving
comesprovides of ITES
electric
in operation, is more
energy
things negative
to the
go in operate than BS at the
a refrigeration
opposite direction
beginning
due moreofamount
unittocapable the project.
of generating
of loanBut200
once the of
tonne
payment project
in ice
BS.per comes
One day.
morein operation,
The studytofinds
factor things
thatgo
deaccelerateto in thepayback
generate
the opposite
a coolingdirection
period effect
of
due
of BS
the to more
8.3 isMWh amount of
per day, 2.5
the additional loan payment
MWrequirement
capital in BS. One
of solar photovoltaics more
in replacing factor
should to deaccelerate
be installed
the Li-ion battery atinthe the
a place payback
end ofwiththe anperiod
10th average
year.of
the
This BS
sun-peak is
decreasesthe additional
hourthe capital
of cumulative
6. The Levelized requirement
savingsCost in replacing
of Energy
by USD the
fromand
2 million Li-ion
solar battery
PV increases
hence at
for a projectthe end
thewith of the 10th
a lifeperiod.
payback year.
of 20 years
For
ITES, a period of 10 years is enough to pay back the investment. However, this time increases to For
This
is decreases
found as 0.06the cumulative
USD/kWh. Thesavings by
penetrationUSD of2 million
the solarand hence
system increases
could save the
the payback
carbon period.
footprint 13by
ITES,
3100 for
years a period
tonne theper of 10 years
yeartoinlarger
BS due is enough
addition to
to 1180k
capital pay
size and back
liters the investment.
of diesel.
higher annual Twoloan However,
scenarios this time
are developed
of the associated system.increases
inHence, to
storingthe 13
the
yearsstorage
ITES for the BS due to
system is larger capital
a better sizeout
option andofhigher annual loanalternatives
two considered of the associated
in termssystem. Hence, the
of cumulative
ITES storage
savings systemperiod.
and payback is a better option out of two considered alternatives in terms of cumulative
savings and payback period.Appl. Sci. 2020, 10, 6022 14 of 16
electric energy from the solar system: Ice Thermal Energy Storage System (ITES) and Battery Storage
system (BS). Economic analysis suggests that capital cost of USD 11.2 million is required to establish
the BS which is about USD 2.9 million greater than ITES. While both systems return enough to pay
back the investment during their lifetime, a higher initial investment cost leads to a relatively slower
payback period for BS. While ITES pays back in 10 years, BS takes 13 years to pay back the amount
invested. In addition, ITES and BS generate cumulative savings of USD 7.8 million and USD 4.8 million
respectively at the end of the project lifetime.
In conclusion, this paper recommends the use of solar PV for mine cooling applications in
places with average sun peak hours of 6 or greater. Besides, Ice Thermal Energy Storage System is
recommended over Battery System due to lower capital investment cost, higher savings, and a smaller
payback period.
Author Contributions: S.P.: Conceptualization, investigation, methodology, software, validation,
writing—original draft, writing—review & editing. A.F.K.: conceptualization, validation, writing—review
& editing. H.K.: conceptualization, validation, writing—review & editing. S.A.G.-M.: conceptualization,
validation, resources, supervision, writing—review & editing. All authors have read and agreed to the published
version of the manuscript.
Funding: This research received no external funding.
Conflicts of Interest: The authors declare no conflict of interest.
References
1. Energy Information Administration. International Energy Outlook 2019 with Projections to 2050; Energy
Information Administration: Washington, DC, USA, 2019.
2. International Energy Agency. World Energy Statistics 2018; International Energy Agency: Paris, France,
2018; p. 860.
3. Bluhm, S. Improving Mine Ventilation Electricity Consumption. Mining Review Africa. 26 September 2008.
Available online: https://www.miningreview.com/top-stories/improving-mine-ventilation-electricity-
consumption/ (accessed on 26 August 2020).
4. Stephenson, D. Distribution of water in deep gold mines in South Africa. Mine Water Environ. 1983, 2, 21–30.
[CrossRef]
5. Biffi, M.; Stanton, D.; Rose, H.; Pienaar, D. Ventilation strategies to meet future needs of the South African
platinum industry. J. S. Afr. Inst. Min. Metall. 2007, 107, 59–66.
6. Norgate, T.; Haque, N. Energy and greenhouse gas impacts of mining and mineral processing operations.
J. Clean. Prod. 2010, 18, 266–274. [CrossRef]
7. Zietsman, L.N.; Marais, J.H.; Joubert, H.P.R. Identification model for cost-effective electricity savings on a
deep-level mine surface refrigeration system. In Proceedings of the 2018 International Conference on the
Industrial and Commercial Use of Energy (ICUE), Cape Town, South Africa, 13–15 August 2018; pp. 1–6.
8. Du Plessis, G.E.; Arndt, D.C.; Mathews, E.H. The development and integrated simulation of a variable water
flow energy saving strategy for deep-mine cooling systems. Sustain. Energy Technol. Assess. 2015, 10, 71–78.
[CrossRef]
9. Nel, A.; Van Rensburg, J.F.; Cilliers, C. Improving existing DSM initiatives on mine refrigeration systems
for sustainable performance. In Proceedings of the 2017 International Conference on the Industrial and
Commercial Use of Energy (ICUE), Cape Town, South Africa, 15–16 August 2017; pp. 1–7.
10. Schutte, A.; Kleingeld, M.; Van Der Zee, L. An integrated energy efficiency strategy for deep mine ventilation
and refrigeration. In Proceedings of the 2014 International Conference on the Eleventh industrial and
Commercial Use of Energy, Cape Town, South Africa, 19–20 August 2014; pp. 1–9.
11. Mining Technology. Ice Cooling Takes the Heat Off at Harmony’s Phakisa Gold Mine; Mining Technology: London,
UK, 2015; pp. 1–3. Available online: https://www.mining-technology.com/features/featureice-cooling-takes-
the-heat-off-at-harmonys-phakisa-gold-mine-4454482/ (accessed on 26 August 2020).
12. Mackay, L.; Bluhm, S.; van Rensburg, J. Refrigeration and cooling concepts for ultra-deep platinum mining.
S. Afr. Inst. Min. Metall. 2010, 4, 285–292.You can also read