SUSTAINABLE AIRPORT ENERGY MANAGEMENT: THE CASE OF KANSAI INTERNATIONAL AIRPORT - Ijtte
←
→
Page content transcription
If your browser does not render page correctly, please read the page content below
Baxter G. et al. Sustainable Airport Energy Management: The Case of Kansai International Airport
UDC: 656.7:725.39]:620.92                                                        DOI: http://dx.doi.org/10.7708/ijtte.2018.8(3).07

SUSTAINABLE AIRPORT ENERGY MANAGEMENT: THE CASE
OF KANSAI INTERNATIONAL AIRPORT
Glenn Baxter1, Panarat Srisaeng2, Graham Wild3
1,2
     School of Tourism and Hospitality Management, Suan Dusit University, Huahin Prachaup Khiri Khan, Thailand
3
    School of Engineering, RMIT University, Box 2476, Melbourne, Victoria, Australia
Received 16 April 2018; accepted 7 June 2018

Abstract: Airports play a vital role in the global air transport industry facilitating the interchange
between the air and surface transport modes. The growth in passenger and air cargo traffic has resulted
in increased energy requirements that airports need to satisfy. Airports are extremely energy intensive.
To mitigate the environmental impact from energy consumption, airports have introduced a wide range
of energy saving measures. Using a longitudinal case study research design, this study examines Osaka’s
Kansai International Airport sustainable energy management, energy sources, energy consumption and
the methods and technologies that have been implemented to mitigate the environmental impact of
energy at the airport. The study period was from 2002 until 2015. The qualitative data was examined
by document analysis. Electricity, natural gas, hydrogen and wind power are the airports principal
energy sources. Despite the growth in passengers and aircraft movements, the airport has been able to
reduce its energy consumption. Energy-saving initiatives including the use of hydrogen, solar, and wind
power, fixed electrical ground power for aircraft, widespread use of LED lighting, more efficient use of
air conditioning systems and ceiling fans, and the use of low emission vehicles.

Keywords: airports; Kansai International Airport; energy; hydrogen-power; photovoltaic
systems; solar panels; sustainability.

1. Introduction                                                 3.79 billion passengers and some 52.6 million
                                                                tonnes of air cargo (International Civil
A n air por t is essentially one or more                        Aviation Organization, 2017). However,
runways for aircraft operations together                        airports also consume substantial amounts
with associated buildings or terminals                          of energy (Ziębik and Hoinka, 2013), a by-
where passengers or air cargo transported                       product of which are the CO2 emissions from
by aircraft are processed (Doganis, 2005).                      energy generation. The airport industry,
Airports are an integral component of the                       like many other industries, is confronting
world air transport system – the places                         the effects of increasing environmental
where airlines and the customers converge                       pressure (Graham, 2014). Hence, the global
(Baxter et al., 2018; Dempsey, 2000). The                       community is currently paying greater
basic infrastructure and facilities provided                    attention to the impact that airports have
by airports compromises runways, taxiways,                      on the environment and airports are working
apron space (ramp), passenger terminals,                        to make themselves more environmentally
air cargo terminals, and ground transport                       friendly (Vanker et al., 2013). Airports have
interchange facilities (Ashford et al., 2011).                  adopted a range of strategies to become
In 2016, the world’s airports handled around                    more environmentally sustainable including

1
    Corresponding author: panarat_sri@dusit.ac.th

             334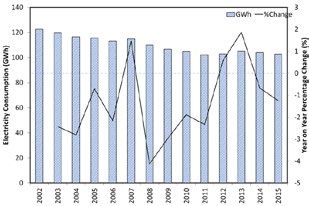
International Journal for Traffic and Transport Engineering, 2018, 8(3): 334 - 358

initiatives to reduce their contribution to                               are also empirically examined in this paper.
climate change through such measures as
reducing their CO2 emissions and increasing                               The remainder of the paper is structured as
energ y ef f icienc y a nd i n f rast r uct u re                          follows. Section 2 reviews the literature on
resiliency (Preston, 2015).                                               energy management at airports. The research
                                                                          methodology used to underpin the case study
One such airport that has sustainably                                     is presented in section 3. The case study of
managed its energy management is Osaka’s                                  Kansai International Airport sustainable
Kansai International Airport, Japan’s third                               energy management follows in section 4.
busiest airport. Kansai International Airport                             Section 5 presents the findings of the study.
has historically placed a very high focus on
sustainable environmental management,                                     2. Background – Sustainable Airport
and, on sustainable energy management. A                                  Energy Management
key objective of Kansai International Airport
is for the airport to be a smart airport that is                          Airports are extremely energy-intensive areas
both people and earth-friendly. Importantly,                              (Alba and Manana, 2017). This is due to the
the airport is driven by its objective of                                 large buildings (both passenger terminals
becoming a pollution-free airport that also                               and non-passengers areas) equipped with
co-exists and prospers with the local Kansai                              heating and air-conditioning systems, and the
region (New Kansai International Airport,                                 high-power demand for lighting and electric
2 013). Consequent ly, env i ron menta l                                  equipment and the energy requirements from
management forms an integral part of                                      the many facilities located within the airport
Kansai International Airport governance,                                  precinct (Cardona et al., 2006). An airport’s
strategy and management system. Most                                      heating, ventilation and air conditioning
importantly, the airport has implemented                                  (HVAC) system will use the largest share
and adopted a wide-ranging sustainable                                    of energy consumed in airport terminal
environment policy that is underpinned                                    buildings (Akyüz et al., 2017). In addition
by three fundamental principles – Green                                   to the provision of electrical energy required
Innovation, Eco Operations and Eco Relations – as                         for the aids to air transport operations,
well as five basic sustainable environmental                              for example, lighting and meteorological
principles – an airport that co-exists with the                           systems, electrical energy is also required
local region, airports that protect a sound                               for airport buildings, aircraft hangers and
local environment, airports with a minimal                                other airport facilities (Kazda et al., 2015).
impact on the global environment, airports                                Thus, energy management, which includes
that recycle resources, and airports that keep                            heating, ventilation, air conditioning, and
biodiversity in mind (Kansai Airports, 2016).                             lighting, is extremely important for airports
                                                                          (Graham, 2014). Indeed, airports require
The objective of this paper is to analyze                                 a guaranteed, appropriately priced, and
Kansai International Airport’s sustainable                                secure energy supply to meet peak demand
energy management systems. The energy                                     from their service partners and passengers
sources and consumption, as well as the                                   thereby optimizing their operationa l
methods and technologies that have been                                   capacity. The maintenance of an ambient
implemented to mitigate the environmental                                 temperature and air quality within airport
impact of the energy consumed at the airport                              passenger terminals to ensure passenger

                                                                                                            335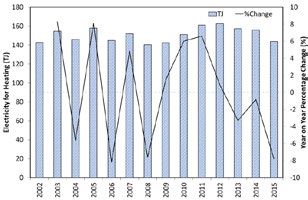
Baxter G. et al. Sustainable Airport Energy Management: The Case of Kansai International Airport

comfort typically represents the single most                necessary for safe airport management also
significant contribution to energy usage and                facilitates the capture of natural resources
management at most airports (Thomas and                     that fuel renewable energy (Barrett, 2015). In
Hooper, 2013).                                              addition, airports can also achieve potential
                                                            returns from selling surplus energy back
To reduce their long-term operating costs and               into the power grid. Renewable energy
to ensure that energy demand can be satisfied               technology has increasingly developed
when the needs arises, airports are placing                 over t he past 2 0 yea rs (McGor mely,
a higher focus on energ y-conservation                      2011). Energy consumed by airports can
measures in the design (and operations)                     be broadly split into the energy consumed
of terminal buildings and infrastructure                    by the airside activities undertaken at the
(Thomas and Hooper, 2013). Some airports                    airport as well as the energy consumed
have also developed and operate new power-                  in the provision of the airport’s landside
generation systems that provide reliable                    area activities. In the airport’s airside area,
and affordable sustainable energy whilst                    energy requirements include the fuel that is
also lowering their energy costs (Budd and                  consumed by aircraft during the landing and
Budd, 2013). Furthermore, airports often                    take-off (LTO) cycles. Also, ground vehicles
work closely with tenants, concessionaires,                 serving aircraft at the apron/gate complex
and ser vice partners to reduce energ y                     consume energy. In the airport landside area,
consumption through the introduction of                     the primary consumers of energy are the
low-energy equipment and systems (Thomas                    airport ground access systems/modes and
and Hooper, 2013).                                          passenger and air cargo terminals as well
                                                            as other administrative buildings serving
There are several energ y technologies                      the airport. In all cases, the primary energy
that are currently being developed as                       sources are from non-renewable fossil fuels
energy sources for airports, including solar                and to a moderate degree from renewable
photovoltaic, concentrating solar power,                    wind, water, and solar sources (Janić, 2011).
wind power, oil and natural gas extraction,
steam-generated power production and                        Electrical energy is normally sourced from
electricity transmission (Barrett et al., 2014).            different sources and is supplied directly to
                                                            the airport through dedicated sub-stations.
R enewable energ y has become a n                           This energy is principally consumed for
increasingly cost-effective business option                 heating, cooling, lighting, and operating
for air por ts because of technological                     the airport’s facilities, equipment, and
ad v a nc e ment , m a rk et m at u r it y a nd             other devices in the processes of servicing
public-sector investment (Barrett, 2015).                   passengers and their baggage and air cargo
Airports have characteristics that enhance                  consignments in passenger and cargo
the financial viability of on-site renewable                terminals, respectively. Electrical energy
energy, particularly for solar photovoltaics                is also consumed in the provision of heating,
(PV). Airport land and buildings can provide                cooling (air conditioning), and lighting other
suitable sites for solar facilities that otherwise          administrative buildings at airports (Janić,
do not generate financial benefit. The open                 2011).
landscape and geographic position of airports

          336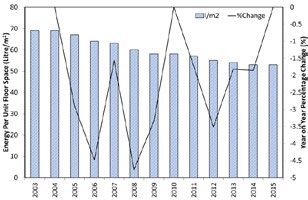
International Journal for Traffic and Transport Engineering, 2018, 8(3): 334 - 358

3. Research Method                                                        Payne, 2004; Scott and Marshall, 2009).
                                                                          Prior to conducting the formal analysis of
This study used a qualitative longitudinal                                the documents gathered in the study, the
research design (Court, 2010; Hassett and                                 context in which the documents were created
Paavilainen-Mäntymäki, 2013) that was                                     was determined and the authenticity of the
exploratory in nature. The study followed                                 documents was assessed (Love, 2003).
an inductive approach using both qualitative                              Authenticity involves an assessment of the
and quantitative research methods (Hair et                                collected documents for their soundness
al., 2015; Lancaster, 2005). The goal of such                             a nd aut hor sh ip. Scot t a nd M a r sha l l
an approach is to expand and build theories                               (2009, p.188) note that ‘soundness refers
rather than perform statistical analysis                                  to whether the document is complete and
to test a certain hypothesis (Rahim and                                   whether it is an original and sound copy.
Baksh, 2003). A case study, whilst like an                                Authorship relates to such issues as collective
experiment, does not represent a sample,                                  or institutional authorship. In this study
and the researcher’s role is to expand and                                the source of the case study documents
generalize theories (analytical generalization)                           was Kansai International Airport. The
and not to enumerate frequencies (statistical                             documents were available in the public
generalization) (Yin, 2009).                                              domain. The credibility criterion concerns
                                                                          the accuracy and sincerity of a document.
The qualitative data for this study was                                   The representativeness criterion involved an
obtained from a range of documents,                                       assessment of the availability and survival
including the airport’s annual environmental                              of the documents gathered. The fourth
and Smart Island reports Qualitative data                                 criterion, meaning, is a most important
was also gathered from web sites, air                                     matter and occurs at two levels. The first is
transport and airport industr y-related                                   the literal understanding of a document, by
magazines, and press articles. The study                                  which is meant its physical readability, the
therefore used secondary data analysis to                                 language used and whether it can be read,
investigate the research problem. The three                               as well as the date of the document (Scott
principles of data collection suggested by                                and Marshall, 2009).
Yin (2017) were followed in this study: the
use of multiple sources of case evidence,                                 The documents collected in this study covered
creation of a database on the subject, and                                the period 2002 to 2015. All the gathered
the establishment of a chain of evidence.                                 documents were downloaded and stored
                                                                          into a case study database (Yin, 2017). The
The empirical data collected for the case                                 documents collected for the study were all in
studies was examined using document                                       English. Each document was carefully read,
analysis. Document analysis is often used in                              and key themes were coded and recorded.
case studies and focuses on the information                               Triangulation was also used to avoid potential
and data from formal documents and                                        bias, add discipline to the study’s qualitative
company records (Oates, 2006; Ramon Gil-                                  research, to ensure stronger accuracy, and to
Garcia, 2012). The documents collected                                    demonstrate verification of the data. This
for the study were examined according                                     approach helped verify the themes that were
to four criteria: authenticity, credibility,                              detected in the documents gathered in the
representativeness and meaning (Payne and                                 study (Morris, 2017).

                                                                                                            337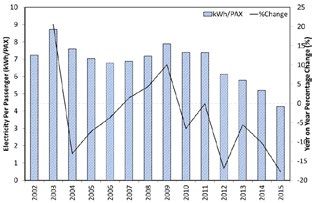
Baxter G. et al. Sustainable Airport Energy Management: The Case of Kansai International Airport

4. Case Study                                            project involved the development of a
                                                         further man-made island 545 hectares in
4.1. Kansai International Airport: A Brief               size. The airport’s second runway, which is
Overview                                                 4,000 metres in length, was also built on the
                                                         island (Dempsey, 2000). The second island is
Kansai International Airport is located in               located 200 metres off-shore from the initial
the southern area of the very large Osaka                island (Morikawa et al., 2007). The airport
Bay in the K ansai Reg ion of western                    officially opened its second runway in 2007
Japan (Morikawa et al., 2007). The airport               (Kansai International Airport Company Ltd,
was constructed as a man-made island                     2007) thereby providing the airport with
five kilometres off-shore in Osaka Bay                   the ability to become an international hub.
(Edgington, 2000). The concept for Kansai
International Airport appeared in 1968,                  Kansai International A irport has t wo
following a survey of potential airport sites            passenger terminals. Terminal One has a
in the Osaka area. Due to the high population            total floor area of 303,944 square metres.
density in the Osaka region and the scarcity             The domestic departures f loor is located
of available land, a man-made island was                 between the International Arrivals (Floor
determined to be the only feasible option for            1) and the International Departures on
the new airport. Noise pollution as well as              Floor 4. Terminal 2 is dedicated to the low-
other environmental concerns assisted the                cost carriers (LCCs) serving the airport
Ministry of Transport to permit construction             and has a total floor area of 29,680 square
of the airport in 1986 (Moorman, 1994).                  metres (Kansai Airports, 2018a). It has been
The airport, which cost around $USD 13                   estimated that there are around 15,000
billion (Ishikura et al., 2005), commenced               people working at the airport.
operations in 1994 as Japan’s first 24-hour
airport and now plays a key role as an                   Figure 1 shows the total annual domestic
important international hub in the global air            and international passengers at Kansai
transport network (Morikawa et al., 2007).               International Airport since its inception of
                                                         operations in 2002 to 2015. The impacts of
In the Kansai International Airport first                the aftermath of 9/11 and the 2008 global
phase project, an airport island with a land             financial crisis (GFC) can clearly be observed
area of approximately 510 hectares was                   in the both the annual enplaned domestic and
reclaimed on which a 3,500 metre runway                  international passengers. Figure 1 also shows
and the related infrastructure were built                that international passengers constitute the
(Morikawa et al., 2007). During the early                largest number of passengers travelling via
1990s, the number of aircraft departures                 the airport. Domestic flights are operated
and arrivals during morning and early                    from Kansai International Airport; however,
evening peak periods exceeded the airport’s              Osaka International Airport primarily acts
handling capacity of 30 aircraft movements               as the major local domestic terminal for the
per hour. Thus, to accommodate demand                    city of Osaka. Furthermore, since 2012, the
and operate as an international hub airport,             low-cost carriers (LCCs) have emerged in the
the second phase of the airport development              Japanese market and appear to be particularly
commenced in 1999 (Furudoi, 2010). The                   important for Kansai International Airport.
second phase Kansai International Airport                Peach Aviation (a joint venture including

         338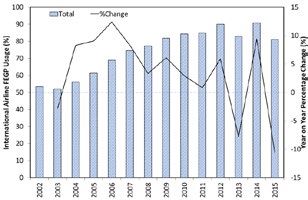
International Journal for Traffic and Transport Engineering, 2018, 8(3): 334 - 358
ANA) is now one the airport’s leading airlines Like Peach Aviation, Jetstar Japan has also
in terms of weekly departures. In July 2012, expanded their services from the airport. The
Jetstar Japan, also an LCC, commenced LCCs are therefore helping to drive traffic
business at Kansai International Airport. growth at the airport (Anna Aero, 2014).
Fig. 1.
Annual Enplaned Domestic and International Passengers at Kansai International Airport: 2002-2015
Source: data derived from (Kansai Airports, 2018b)
4.2. Kansai International Airport Kansai International Airport is electricity,
Management Plan which is purchased from the municipal
authorities. Other energy sources include
Energy management is a critical aspect of natural gas, solar power, hydrogen as well
airport operations as airports are extremely as wind power.
energy-intensive areas. A key objective of
Kansai Airports, the airport operator, is that 4.4. Kansai International Airport Energy
electricity consumption and its generation Consumption
at Kansai International Airport is to be
managed in an integrated way and that 4.4.1. Annual Electricity Consumption at
energy conservation is to be promoted, Kansai International Airport
including the reduction of electricity during
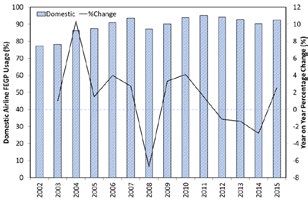
peak times at the airport (Kansai Airports, The total annual energy consumption at
2016). Kansai International Airport from 2002 to
2015 that is managed by the New Kansai
4.3. Energy Sources at Kansai International Airport Company is presented in
International Airport Figure 3. During the period 2002 to 2015, the
airport was able to reduce its annual electricity
As noted earlier, electrical energy is normally consumption from a high of 122 GWh in 2002
sourced from various sources and is supplied to 102 GWh in 2015 (Figure 3). As discussed
directly to the airport through dedicated below, the airport has implemented a wide
sub-stations. The principal energy source at range of energy management initiatives that
339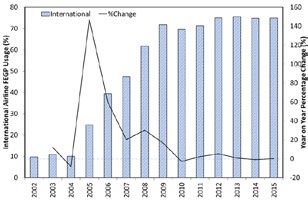
Baxter G. et al. Sustainable Airport Energy Management: The Case of Kansai International Airport

have played a very important role in reducing              percentage change line graph, which is more
the airport’s energy consumption throughout                negative than positive (more values below the
this period. This is shown in the year on year             zero line than above).

Fig. 3.
Annual Electricity Consumption at Kansai International Airport and Year-on-Year Change (%): 2002-2015
Source: data derived from (Kansai Airports, 2016; New Kansai International Airport Company 2013)

4.4.2. Annual Energy Consumption Per at Kansai International Airport from 2002
Passenger and Aircraft Movement      to 2015. Despite the increase in passengers
                                                           (and aircraft movements), the airport has
Airport energy efficiency can be measured by               been able to reduce the energy consumption
energy consumed per passenger and energy                   per passenger from 2010 to 2015; which is
consumed per aircraft movement (Janić, 2011).              illustrated by the year-on-year percentage
Figure 4 shows the annual energy per passenger             change line graph being more negative.

Fig. 4.
Energy Per Passenger at Kansai International Airport and Year-on-Year Change (%): 2002-2015
Source: data derived from (Kansai Airports, 2016; New Kansai International Airport Company 2013)

         340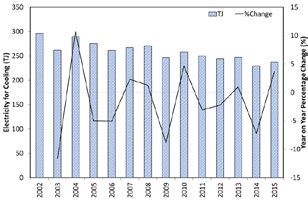
International Journal for Traffic and Transport Engineering, 2018, 8(3): 334 - 358

The annual energy per aircraft movement                                   reduce the energy per aircraft movement
at K ansai Internationa l A ir por t f rom                                from a high in 2003 to a low in 2015. This
2002 to 2015 is shown in Figure 5. Like                                   is despite the increased domestic and
the trend in energy per passenger, Kansai                                 international aircraft movements at the
International A irport has been able to                                   airport.

Fig. 5.
Energy per Aircraft Movement at Kansai International Airport and Year-on-Year Change (%): 2002-2015
Source: data derived from (Kansai Airports, 2016; New Kansai International Airport Company 2013)

4.4.3. Annual Energy Consumption for                                      2002-2015. During this period the annual
Cooling at Kansai International Airport                                   energy consumption for the provision has
                                                                          remained relatively constant. From 2011
The weather in Osaka-city is typically                                    to 2015, the average annual consumption
quite mild. However, during the city’s                                    for cooling has been around 241 TJ, which
summer weather can be both hot and humid                                  represents a significant reduction on the
(Tsutsui, 2013). Thus, it necessary for Kansai                            energy consumption for cooling that was
International Airport to provide cooling                                  recorded in the 2002 and 2004 fiscal years
for passenger terminals and other airport-                                (Figure 6). The relatively constant state is
related buildings during such times. Figure                               highlighted by the year-on-year percentage
6 shows Kansai International Airport’s                                    change line graph, which is fairly balanced
total annual consumption for cooling from                                 about the zero line.

                                                                                                          341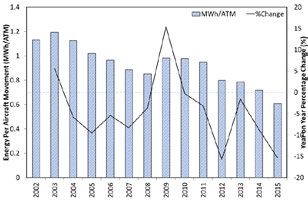
Baxter G. et al. Sustainable Airport Energy Management: The Case of Kansai International Airport

Fig. 6.
Energy for Cooling at Kansai International Airport and Year-on-Year Change (%): 2002-2015
Source: data derived from (Kansai Airports, 2016; New Kansai International Airport Company 2013)

4.4.4. Annual Energy Consumption for                      As can be seen in Figure 7, there have been
Heating at Kansai International Airport                   marked spikes in the annual energy acquired
                                                          for heating in 2003, 2005, 2007, 2011, and
The average maximum and minimum winter                    2012 (as seen in the year on year percentage
temperatures in Osaka are around 10C and                  change line graph). These spikes could be
3C, respectively (Climates to Travel, 2018).              attributed to the cold winter temperatures
Thus, during these periods of wintry weather,             recorded in Osaka. Also, Kansai International
Kansai International Airport is required to               Airport opened its new low-cost carrier
heat airport buildings and offices. The annual            terminal (Terminal 2) on the 29th October
energy required for heating at the airport                2012, which increased the size of the facilities
from 2002 to 2015 is presented in Figure 7.               that require heating.

Fig. 7.
Energy for Heating at Kansai International Airport and Year-on-Year Change (%): 2002-2015
Source: data derived from (Kansai Airports, 2016; New Kansai International Airport Company 2013)

         342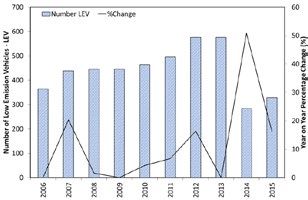
International Journal for Traffic and Transport Engineering, 2018, 8(3): 334 - 358

4.4.5. Annual Natural Gas Consumption                                     is a subsidiary of Kansai Airports (New
at Kansai International Airport                                           Kansai International Airport Company,
                                                                          2014a). The large spikes in natural gas usage
In addition to the electricity supplied from the                          in 2014 and 2015 can be attributed to the
municipal authorities, Kansai International                               natural gas usage requirements of Kansai
Airport also purchases supplies of natural gas.                           International Airport Heating and Cooling
Figure 8 shows the total annual quantities of                             Supply Company (KHC). This company’s
natural gas purchased by the airport during                               data was incorporated into the Kansai
the period 2002 to 2015. As can be seen in                                Airport’s annual environmental reports in
Figure 8, from 2007 to 2012, the annual                                   2014. Because of this reporting change, the
volumes of natural gas declined. The heating                              year-on-year changes recorded in 2014 and
and cooling for the airport’s air conditioning                            2015 showed marked spikes because of the
system and the supply of hot water comes from                             Kansai International Airport Heating and
the Kansai International Airport Heating                                  Cooling Supply Company (KHC) natural
and Cooling Supply Company (KHC), which                                   gas consumption.

Fig. 8.
Kansai International Airport Total Annual Natural Gas Consumption and Year-on-Year change (%):
2002-2015
Note: Primary energy managed by the New Kansai International Airport Company
Source: Data derived from (Kansai Airports, 2016; New Kansai International Airport Company 2013)

In Figure 8, the values for 2014 and 2015                                 a two-sample t-test was utilized. The two-
are significantly greater than those for the                              sample t-test assuming unequal variance
proceeding years (specifically, the values for                            between the years 2002-2013 and 2014-2015,
these two years are greater than 3 standard                               yielded a t-statistic of 12.0, which is greater
deviations above the mean for 2002 to 2013).                              than the critical value of 6.31. Hence, we can
As such, a two-stage statistical analysis has                             conclude that there has been a statistically
been utilized. First, to assess the statistical                           significant increase from 2002-2013 to 2014-
significance of the change from 2013 to 2014,                             2015 in the volume of natural gas consumed.

                                                                                                            343
Baxter G. et al. Sustainable Airport Energy Management: The Case of Kansai International Airport
The result of the t-test indicates that a corresponding critical value with degrees of
significant variable needs to be factored freedom 2 and 11 at the 99% confidence level
into the regression analysis to capture this for a one tailed test is 5.7. As the calculated
increase from 2013 to 2014. To facilitate the F-statistic is greater than the critical value,
regression analysis is it therefore necessary the null hypothesis can be rejected, and we
to utilize multiple linear regression, with an can conclude that the model is statistically
additional dummy variable to account for the significant, and that the volume of natural
observed jump. Thus, a dummy variable has gas consumption has decreased with time. It
a value of 0 from 2002 to 2013, and a value also can be concluded that some additional
of 1 for 2014 to 2015 (0 = no contribution, unknown variable has resulted in an increase
1 = contribution from unknown variable). in natural gas consumption between 2013
To analyze the significance of this model and 2014. It is likely that additional processes
for natural gas consumption at Kansai utilizing significantly larger quantities
I nter nat iona l A i r por t, a n F-test was of natural gas came online in 2014. For
conducted. The statistics tested the following example, ground vehicles utilizing natural
hypotheses: gas, or changes in water heating may have
been used; however, no explanation can
Null hypothesis (H0): ß 1 = ß2 = 0 be found to define this variance. Figure 9
Alternative hypothesis (H A): ß 1 > 0, ß2 < 0 is a plot showing the “line of best fit” for
the model over the actual values of Kansai
For Kansai International Airport’s natural International Airport’s annual natural gas
gas consumption, the F-statistic is 272. The consumption.
Fig. 9.
Plot Showing the Actual Kansai International Airport Natural Gas Consumption: 2002-2015 and the
Gas Consumption Predicted by the Multiple Linear Regression Model
Note: Primary energy managed by Kansai International Airport Company
Source: Data derived from (Kansai Airports, 2016; New Kansai International Airport Company 2013)
344International Journal for Traffic and Transport Engineering, 2018, 8(3): 334 - 358
4.4.6. Annual Energy Consumption Per from 2003 to 2015. It is also interesting
Unit of Floor Space to note that over this period, the actual
area of floor space has increased. The low-
The annual energy consumption per unit of cost carriers terminal (Terminal 2) was
floor space (crude oil equivalent) at Kansai opened in October 2012. Kansai Airports
Airport from 2003 to 2015 is presented in also completed the expansion of Terminal
Figure 10. The first notable feature is that 2 in January 2017. As noted earlier, the
the year on year percentage change line main terminal building has 116,126m 2 of
graph is always negative, indicating that f loor space, whilst Terminal 2 now has
there has been a continuous reduction in 66,000 m 2 of floor space (Kansai Airports,
the crude oil equivalent at Kansai Airport 2018b).
Fig. 10.
Kansai International Airport Total Annual Energy Consumption per Unit of Floor Space (Crude Oil
Equivalent) and Year-on-Year Change (%): 2003-2015
Note: 2002 data is not available
Source: data derived from (Kansai Airports, 2016; New Kansai International Airport Company 2013)
4.5. Kansai International Airport Energy 4.5.1. Energy Savings from the Use of
Saving Initiatives Passenger Terminal Ceiling Fans
In recent years, Kansai International Airport In 2014, the airport in conjunction with the
has placed a high focus on sustainable energy University of Tokyo conducted a research
management and has implemented a wide project whose aim was to better understand
range of initiatives (measures) aimed at the seasonal trends in electrical energy
reducing the air por t’s env ironmental consumption at the airport. The study
impact and each of these are examined in found that electrical energy consumption
the following section. is very high in both the summer and winter
345Baxter G. et al. Sustainable Airport Energy Management: The Case of Kansai International Airport
periods, with winter mornings tending to automated energy-saving air conditioning
have especially high consumption during system. The system links the on-off function
the hours that the air conditioning system of the air conditioning equipment with the
is in operation. Consequently, the Kansai airport’s passenger information system
International Airport Energy Conservation (PIS). The results of this initiative are as
Committee conducted a variety of tests in follows:
relation to the introduction of new energy-
saving technologies, such as ceiling fans in • A shortening of the gate lounge air
the terminal buildings. The effectiveness cond it ion i ng operat ion t i mes by
of the use of ceiling fans was confirmed. In approximately 6 hours per day;
the 2013 fiscal year, the airport installed • A reduction in the energy consumption
two ceiling fans, measuring three metres of the air conditioning system of
in diameter, in the Terminal 2 international approximately 34 per cent;
passenger f l ight wa it ing lounge, a nd • Approximately 1,000 kilo litres/year
confirmed the energ y sav ings effects. (crude oil equivalent) saving in the
This initiative resulted in a 28 per cent total amount of energy conserved at
reduction in electricity consumption for the airport;
the air conditioning system operating in that • A reduction in carbon dioxide (CO2)
area, without having any negative impact on emissions of approximately 1,500 tons/
the indoor air temperatures (New Kansai year; and
International Airport Company, 2014a). • A reduction in the heating costs of
around ¥65 million/per year (Kansai
4.5.2. Efficient Operation of Passenger International Airport Company, Ltd.,
Terminal Air Conditioning Systems Using 2012, p. 16).
Information Technology (IT)
4.5.3. Hydrogen Energy Model: Kansai
As previously noted, airports are extremely International Airport Hydrogen Grid
energ y-intensive areas. The passenger Project
terminal(s) typically consume substantial
amounts of energy, which is used primarily Kansai International Airport is actively
for the provision of air conditioning as well pursuing the use of clean energy sources
as lighting. At Kansai International Airport as part of its commitment to sustainable
the main passenger terminal is comprised of airport operations. This objective is guided
a very large continuous stretch of space that by the airport’s Smart Island Vision. In
has no partitions and is constantly used by May 2014, a decision was taken to proceed
the airport’s customers. Thus, in principle, with the full-scale launch of the airport’s
all areas of the terminal must remain in Hydrogen Grid Project (Figure 11). This is an
operation from the first f light of the day important pillar of the airport’s Smart Island
through to the final flight of the day. This Vision. The Hydrogen Grid Project received
results in the use of a large amount of energy the support of Japan’s national government
(Kansai International Airport Company, and made use of its “Comprehensive Special
Ltd., 2012). Because passengers are dispersed Zones for International Competitiveness
throughout the terminals in each gate lounge, Development program” (New K ansai
to save power, the airport developed a fully International Airport Company, 2015b).
346International Journal for Traffic and Transport Engineering, 2018, 8(3): 334 - 358
The use of hydrogen as an energy source these forklifts will result in a reduction of
has been attracting considerable attention emissions of CO2 , as well as providing an
as it has been suggested that hydrogen is the improvement in working efficiency. The
ultimate clean energy source. The airport’s forklift can be refueled in approximately
Hydrogen Grid Project was the first in Japan three minutes and does not require the
to demonstrate the large-scale introduction recharging or change of batteries (New
and use of hydrogen energy at the airport’s Kansai International Airport Company,
facilities (New Kansai International Airport 2015a). In March 2016, All Nippon Airways
Company, 2014b). and the Japan Airlines Groups commenced
the use of two fuel-cell hydrogen powered
Kansai International Airport was the first fork lifts. The forklifts use the same type of
Asia-based airport to introduce the use of fuel cell as the hydrogen-powered Mirai car
hydrogen powered forklifts. The use of (Kansai Airports, 2016).
Fig. 11.
Kansai International Airport Hydrogen Grid Concept
Legend: FC fuel cell, GH2 gaseous hydrogen, LH2 liquid hydrogen, ITM Osaka International Airport,
KIX Kansai International Airport
Source: Based on (New Kansai International Airport Company Ltd, 2014a, 2015a)
In addition, over the past decade, hydrogen much more efficiently than the traditional
and f uel cel l technolog ies have been internal combustion (IC) engines. The
viewed as one of the viable solutions to other advantages of fuel cells are that they
mitigate air pollution issues. Thus, a way completely avoid the emissions of carbon
of mitigating the pollution from airport dioxide (CO 2), carbon monoxide (CO),
ground service equipment (GSE) could hydrocarbons (HCs), nitrogen oxides (NOX),
come from the replacement of the traditional and carcinogenic substances (Testa et al.,
GSE propulsion system, that quite often 2014). Kansai International Airport has
are based on fossil fuels, with hydrogen- adopted the use of hydrogen as a fuel source
based fuel cell technologies. Fuel cells are for airport ground service equipment (GSE)
systems that can generate energy from fuel and vehicles operating at the airport. In May
347Baxter G. et al. Sustainable Airport Energy Management: The Case of Kansai International Airport
2007, Kansai International Airport installed sources to ensure the least environment
a hydrogen station at the airport. Vehicles impact of using this energy source.
that are running on hydrogen-powered
engines are operated for commercial use. In 4.5.4. Kansai International Airport Energy
addition, between October 2012 and March Conservation Committee
2014, buses that are powered by hydrogen
fuel cells, were in trial operation as shuttle I n t he 2 0 0 2 f i sc a l yea r, t he K a n sa i
buses operating between the Aeroplaza and International Airport Energy Conservation
Terminal 2. The airport received positive Committee was established. The aim of the
feedback from the passengers regarding committee is to improve energy efficiency
their quietness during this trial period. at the airport. The committee meets on
Also, it was estimated that around 3.2 tons an annual basis and discusses energ y-
of CO 2 emissions were reduced from the efficiency policies and measures and works
use of these buses during the trial (Kansai on operational improvements and upgrade
Airports, 2016). Since the 2010 fiscal year, projects. Other energy conservation activities
the airport has conducted trial operations of include the inspection of interior lighting and
a mobile power supply truck that is equipped air conditioning/temperature, by conducting
with fuel cells that run on pure hydrogen. “Energy Conservation Patrols” (New Kansai
The truck has been used during dragon International Airport Company Ltd, 2015a).
boat competitions as well as other outdoor
events (New Kansai International Airport In July 2006, Kansai International Airport’s
Company Ltd, 2013). In addition, it was Passenger Terminal Building and the
anticipated that fuel-cell vehicles (FCVs) Aeroplaza complex were designated as
would be sold in Japan in the 2015 fiscal year a Class 1 Specific Plant, which obligated
onwards and the airport is thus promoting the airport to implement energy savings
the construction of hydrogen fueling stations as prescribed in the Law Concerning the
along the Phase 2 island main roads (New Rational Use of Energy (enacted in April
Kansai International Airport Company Ltd, 2009). A Class 1 specific plant under the
2014a). Energy Conservation Law is a plant that uses
3,000 kilolitres (KL) or more of fuel and
It is important to note, however, that the 1,200kWh or more of electricity. Such plants
production of hydrogen from non-renewable are obligated to create and submit an energy
feedstock (coal, natural gas, and oil), conservation plan (medium- and-long-term
however, causes the production of carbon plan) and periodically report their results
dioxide (CO 2) gases (Balachandar et al., (Kansai International Airport Company
2016; Dincer and Joshi, 2013) which are Ltd, 2007, p. 21).
detrimental to the environment. In contrast,
hydrogen produced using renewable sources 4.5.5. Light-Emitting Diodes (LEDs)
would not create greenhouse emissions or,
in the case where biomass is used as the Light-emitting diodes (LEDs) are a practical
feedstock, then this would create near zero option for airports due to the requirement
emissions (Yeang and Woo, 2010). Thus, it is for coloured light as well as low light output
important for airports to consider sourcing requirements. Airports all around the world
hydrogen produced from renewable energy are increasingly transitioning to the use of
348International Journal for Traffic and Transport Engineering, 2018, 8(3): 334 - 358
LED systems (Freyssinier, 2014). Kansai converted to LEDs (2,550 fixtures). Also,
International Airport is one such airport that in 2015 the airport undertook taxiway
is working toward the full transition to LED improvements associated with the Phase 2
lighting, and has been moving steadily to island terminal. As part of this project, 664
convert to LED equipment not only for aviation LED units that are used for taxiway centre
lighting but also in existing facilities. Kansai line lights, taxiway edge lights, and aircraft
International Airport has installed LEDs as taxiing guidance signs were installed. The
the taxiway edge lights on Runway 2. Around airport estimates that these LEDs will reduce
700 blue LED lights are used to indicate the energy consumption by 70 to 90 per cent as
edge of the taxiway along the approach to the compared to the use of conventional halogen
airport’s apron area. These taxiway edge lights bulb lighting (Kansai Airports, 2016).
are among the approximately 3,500 lights that
compromise the aviation lighting system on the 4.5.6. Introduction of Low-Emission
Phase 2 Island during the times when Runway 2 Vehicles
is in service (New Kansai International Airport
Company Ltd, 2015a). Air pollution at an airport is not only produced
by aircraft during the landing and take-off
LED lights are also highly energy-efficient, (LTO) cycle but also from the ground service
consuming around about one-third the equipment (GSE) used during airport ground
electricity as compared to the conventional handling operations (Testa et al., 2014). Hence,
halogen lights that were previously used in addition to the carbon dioxide (CO 2)
at the airport. LED light sources also have emissions generated by aircraft, aircraft ground
significantly lower maintenance costs due operations carbon dioxide (CO2) emissions can
to their lower power requirements and long also be significant at airports (International
life (Ehiorobo, 2017). Kansai International Airport Review, 2010). The replacement of
Airport has observed that their LED lighting internal combustion engine powered airport
running costs are significantly lower, and ground support vehicles and equipment could
the LED lights service lives are anywhere potentially reduce carbon monoxide (CO),
from 50 to 100 times longer. In addition hydrocarbons (HC), nitrogen oxides (NOx),
to the lower operating costs of the LED and particulate matter (PM) (Gellings, 2011).
lighting, in the 2013 fiscal year the airport Kansai International Airport is gradually
boosted the efficiency of apron lighting and introducing “eco-cars” (electric, fuel cell,
combining reflective displays with LED units natural gas, hybrid, plug-in hybrid, and ultra-
in road information signage. This initiative fuel-efficient vehicles) when vehicles require
combined with the other energy saving replacement. At the same time, the airport
initiatives undertaken in the 2013 fiscal has been encouraging contractors to convert
year enabled the airport to cut around 727 their fleets to low-emission vehicles (New
tons of carbon dioxide (CO2) from its total Kansai International Airport Company Ltd,
annual emissions (New Kansai International 2015a). In August 2006, Kansai International
Airport Company Ltd, 2015a). Airport and Rinku Town were selected as a
region for the dissemination and promotion
In the 2015 fiscal year, lighting in the of the use of compressed natural gas (CNG)
parkade and airport station concourse, powered vehicles (Kansai International
Aeroplaza building, and other areas was Airport Company Ltd, 2007).
349Baxter G. et al. Sustainable Airport Energy Management: The Case of Kansai International Airport
T hus, another impor tant sustainable vehicles can also be used to reduce carbon
environment strategy implemented by Kansai emissions (Larminie and Lowry, 2012). In
International Airport has been a policy to March 2015, there were 329 low emissions
gradually introduce “eco-cars” (electric, fuel “Eco-cars” (vehicles) authorized to operate
cell, natural gas, hybrid, plug-in hybrid, and inside the airport’s restricted areas, of these,
ultra-fuel-efficient vehicles) when vehicles are 191 were electric-powered vehicles (New
being replaced or when other opportunities Kansai International Airport Company
arise. The airport is also encouraging Ltd, 2015a). Figure 12 shows the trend in
companies and operators providing services the number of “eco-cars” operating at the
at the airport to convert their fleet to “eco- airport and the year-on-year change (%)
cars”. The Kansai International Airport registered and authorized to operate at the
Taxi Operators Council, for example, is airport from 2006 to 2015. It can be seen
introducing eco-friendly vehicles (New in Figure 12 that there has been a clear
Kansai International Airport Company upward trend from 2006 to 2012 in both
Ltd, 2014b). Electric-powered cars have the number of low emissions “eco-cars” used
several important environmental benefits: at the airport. However, in 2014, there was
a reduction in noise and pollution, and they a marked reduction in the number of “eco-
also help to reduce the reliance of transport cars” operating at the airport Figure 12. This
modes on oil – providing, of course, that decline was due to a new Japanese stricter
the power is produced from fuels other local government regulation on eco-engine
than oil. Importantly, electric-powered vehicles.
Fig. 12.
The Number of Low-Emission Vehicles Operating at Kansai International Airport and the Year-on-Year
Change (%): 2006 to 2015
Note: data prior to 2006 is not available
Source: data derived from (Kansai Airports, 2016; New Kansai International Airport Company Ltd,
2013, 2014a, 2015a)
350International Journal for Traffic and Transport Engineering, 2018, 8(3): 334 - 358
In Figure 12, the values for 2014 and 2015 the findings of Section 4.4.5; however, no
are significantly less than those for the official explanation can be found to define
proceeding years, as can be seen in the year- the dummy variable
on-year percentage change line graph. As
such, two-stage analysis has been utilized. In addition, charging stations are required to
First, to assess the statistical significance of promote the greater use of electric vehicles
the change from 2013 to 2014, a two-sample at the air por t. Consequently, K ansai
t-test was utilized. The two-sample t-test International Airport has installed electric
assuming unequal variance between the vehicle charging stations (New Kansai
years 2006-2013 and 2014-2015, yielded International Airport Company Ltd, 2015a).
a t-statistic of 4.93, which is greater than Kansai International Airport installed rapid-
the critical value of 2.13. Hence, we can charging stations for electric vehicles in the
conclude that there has been a statistically Observation Hall parking lot in March 2011,
significant decrease from 2006-2013 to and their operation commenced the following
2014-2015 in the number of low emission month. The chargers used for household use
vehicles. The result of the t-test indicates that typically take between eight to ten hours to
a significant variable needs to be factored charge a vehicle. However, the rapid chargers
into the regression analysis to capture this installed at Kansai International Airport can
increase from 2013 to 2014. To facilitate the charge a vehicle battery to around 80 per
regression analysis is it therefore necessary cent of capacity within approximately thirty
to utilize multiple linear regression, with an minutes. In December 2012, the airport
additional dummy variable to account for the installed two regular chargers (plug-in type)
observed jump. Thus, a dummy variable has in the airport car parks P1 and P2 (New
a value of 1 from 2006 to 2013, and a value Kansai International Airport Company Ltd,
of 0 for 2014 to 2015 (0 = no contribution, 2014a). A rapid charger, which is available 24
1 = contribution from unknown variable). hours per day, was installed in Parking Lot
5 at Terminal 2 in June 2014 (New Kansai
For Kansai International Airport’s low International Airport Company Ltd, 2014b).
emission vehicles, the F-statistic is 71. The With these charging facilities, customers
corresponding critical value with degrees can now come arrive at the airport with the
of freedom 2 and 7 at the 99% confidence knowledge that they will be able to charge
level for a one tailed test is 7.2. As the their electric vehicles. The airport plans
calculated F-statistic is greater than the to continue with these initiatives to be not
critical value, the null hypothesis can be only more environmentally friendly, but also
rejected, and we can conclude that the create greater convenience for customers
model is statistically significant and that as well (New Kansai International Airport
the number of low emission vehicles has Company Ltd, 2014a).
increased with time, and some additional
unknown variable has resulted in a decrease 4.5.7. Promoting the Use of Fixed
in low emission vehicles between 2013 and Electrical Ground Power (FEGP) Systems
2014. One possible explanation for this could for Aircraft Ground Servicing
be fleet renewal, and the use of alternative
emission vehicles, for example natural gas To reduce emissions of CO2 and air pollutants
power vehicles, which also correlates to from the use of aircraft auxiliary power units
351Baxter G. et al. Sustainable Airport Energy Management: The Case of Kansai International Airport
(APUs), Kansai International Airport has Airport from 2002-2015. As can be seen in
installed fixed electrical ground power Figure 13, the percentage of international
units (GPUs) at aircraft parking spots to a i rl i nes operat i ng at t he a i r por t a nd
provide electricity and air conditioning. The utilizing FEGP have, following a relatively
airport requests airlines to use this system. In slow start, increased the adoption of the
January 2010, Kansai International Airport system, specifically since 2009. The figure
became the first Japan-based airport to indicates the ratio of actual number of
reduce the amount of time an aircraft can times (that is, f lights) ground power units
use its APU prior to its scheduled departure; (GPUs) were provided compared to the
the time was reduced to 15 minutes from number of opportunities to provide ground
the previous 30 minutes (New Kansai power for f lights. For fiscal years 2001 to
International Airport Company Ltd, 2014a, 2008, the ratio indicates only stationary
p.13). GPUs, whilst from fiscal year 2009 onward
it also includes mobile units. Importantly,
Figure 13 presents the percentage uptake the calculations from fiscal year 2012
in FEGP usage amongst international onward excludes low-cost carrier (LCC)
carriers and the corresponding year-on- airlines, which t y pically have shor ter
year changes (%) at Kansai International aircraft parking times.
Fig. 13.
Annual International Airlines Ground Power Unit (GPU) Usage Ratio and Year-on-Year Change (%):
2001-2015
Source: Data derived from (Kansai Airports, 2016)
Figure 14 presents the percentage uptake domestic, airlines ser ving the airport
of FEGP for domestic airlines and the have historically adopted the use of the
cor respond i ng yea r-on-yea r cha nge FEGP systems, with annual usage rates
(%) at K a nsa i I nter nat iona l A i r por t being more than 90 per cent during the
f rom 2 0 0 2 -2 015 . T he Japa n-ba sed , period 2009- 2013.
352International Journal for Traffic and Transport Engineering, 2018, 8(3): 334 - 358
Fig. 14.
Annual Japanese-based Domestic Airlines Ground Power Unit (GPU) Usage Ratio and Year-on-Year
Change (%): 2002-2015
Source: Data derived from (Kansai Airports, 2016)
Figure 15 presents the FEGP uptake for all Also, as can be observed in Figure 15, the total
airlines (domestic/international) and the annual FEGP system usage is showing an
corresponding year-on-year changes (%) at upward trajectory, given the greater utilization
Kansai International Airport from 2002-2015. of the system by airlines operating at the airport.
Fig. 15.
Total Annual Airlines Ground Power Unit (GPU) Usage Ratio and Year-on-Year Change (%): 2002-2015
Source: Data derived from (Kansai Airports, 2016)
4.5.8. Installation of Photovoltaic energy management policy. A photovoltaic
Systems system with 358 panels has been installed
on t he roof of t he med ica l produc t s
Kansai International Airport has installed a temperature-controlled building, which
solar power system as part of its sustainable was constructed in September 2010, and is
353Baxter G. et al. Sustainable Airport Energy Management: The Case of Kansai International Airport
in the airport’s international freight zone prevention awareness campaign targeted at
(New Kansai Airport Company Ltd, 2014a). drivers and passengers at the airport during
In the 2012 fiscal year, the airport invited the annual International Environment
applications from electricity venders to Month (each June) (New Kansai Airport
install solar panels on the roofs of air cargo Company Ltd, 2014a).
terminals as well as on the land adjacent to
runways. The successful applicants were 4.5.10. Wind Power Generation
decided in April 2013. Panels were installed
along planned taxiways expansion on the KIX Sora Park is located by Terminal 2. Since
south side of Runway B and on the air cargo the 2012 fiscal year, Kansai International
terminal roofs (New Kansai International Airport’s Sora Park has had three small
Airport Company Ltd, 2013). The “KIX wind turbine and solar powered lights (New
Megasolar” system has been generating Kansai Airport Company Ltd, 2014b). In
electricity, since February 2014. About July 2014, a small 5-kilowatt wind turbine
70,000 solar panels have been installed. The commenced operations. In the 2014 fiscal
system is anticipated to generate around 12 year, the new turbine system generated
million kilowatt-hours of electricity. This is around 1,191 kilowatts of electricity. This
equivalent to around 7 per cent of the total was the first time such a system had been
electricity consumed at Kansai Airport (New installed at an airport in Japan and it is being
Kansai Airport Company Ltd, 2014a). used to conduct impact studies on such
aspects as noise and low frequency sound
In September 2015, photovoltaic panels with and the verification of electricity generation
a capacity to generate around 1.2 megawatts capacity (New Kansai Airport Company
of power commenced operations. These Ltd, 2015a).
photovoltaic panels have been installed on
the roof of a Phase 1 air cargo warehouse 5. Conclusion
(New Kansai Airport Company Ltd, 2015a).
The new photovoltaic system generated a This study has examined the sustainable
total of 48,000KWh in the 2015 fiscal year energ y management at Osaka’s Kansai
(Kansai Airports, 2016). International A irport. The study was
underpinned by a longitudinal qualitative
4.5.9. Reducing Vehicle Idling Times case study research design. The period of the
study was from 2002 to 2015. The qualitative
As an entity that is prescribed under Japan’s data was analyzed using document analysis.
Nitrogen Oxides and Particulate Matter Act,
the airport is required to prepare a vehicle- Kansai International Airport has multiple
use management plan to reduce emissions of sources of power. Electricity and natural gas
nitrogen oxides (NOx) and particulate matter is sourced from the municipal authorities.
(PM) (New Kansai Airport Company Ltd, The airport has installed photovoltaic
2015a). To reduce vehicle idling times at systems, wind power turbines and has
the airport, signs and posters are displayed adopted the use of hydrogen as other key
in parking lots and other public places at energy sources. Over the study period,
Kansai International Airport. The Smart the amount of electricity purchased has
Island Council also conducts a vehicle idling- declined from 122,767MW h per annum
354International Journal for Traffic and Transport Engineering, 2018, 8(3): 334 - 358
in 2002 to 102,774MWh in 2015. This is ground servicing. In addition, the airport
despite a significant increase in the number has installed a large scale photovoltaic
of passengers and aircraft movements at system (KIX Megasolar System) as well
the airport. The energy consumption per as wind powered system that is used for
passenger and per aircraft movement has lighting in the airport’s Sora Park precinct.
also displayed a downward trend from 2010 In accordance with statutory requirements,
to 2015. The airport also uses natural gas as the airport also conducts vehicle idling time
an important energy source and the annual awareness campaigns. Kansai Airports is also
consumption was quite consistent from 2002 planning for its future and foresees the use
to 2013, but in 2014 and 2015 the airport of hydrogen and clean energy as playing a
was required to purchase greater volumes vital role as key energy sources, especially in
of natural gas to satisfy its requirements. the Second Phase Island Passenger Terminal
The annual amount of energy consumed for precinct.
cooling from 2011 to 2015 has been around
241,450GJ, which represented a significant References
reduction on the amount of energy consumed
for cooling in the 2002 and 2003 fiscal years. Akyüz, M.K.; Altuntaş, Ö.; Söğüt, M. Z. 2017. Economic
The annual consumption of energy for and environmental optimization of an airport terminal
heating oscillated quite significantly over the building’s wall and roof insulation, Sustainability 9(10):
study period peaking in 2012 (162,491GJ) 1849.
before declining in the three subsequent
years. The annual consumption of energy Alba, S.O.; Manana, M. 2017. Characterization and
for cooling in 2015 was 143,704GJ. analysis of energy demand patterns in airports, Energies
10(1): 119.
Throughout the study period, Kansai
International Airport has implemented a Anna Aero. 2014. Kansai International Airport Benefits
wide range of energy-saving measures on from LCC Expansion from Peach Aviation and Jetstar
both the airside and landside precincts. Japan. Available from internet: .
ceiling fans, a more efficient operation of
the passenger terminal air conditioning Ashford, N.J.; Mumayiz, S.A.; Wright, P.H. 2011. Airport
system (using information technology), the engineering: planning, design, and development of 21st century
introduction and use of hydrogen as a key airports, Fourth Edition. John Wiley & Sons, USA. 753 p.
energy source, the formation of an Energy
Conservation Committee and the wide- Ashford, N.J., et al. 2013. Airport operations, Third
spread use of light emitting diodes (LEDs). Edition. McGraw-Hill, Inc. USA. 640 p.
Other energy saving measures include the
introduction of low emission vehicles by Balachandar, G.; Roy, S.; Das, D. 2016. Production
Kansai Airports, the airport operator, and process via fermentation. In book (eds. Stolten, D.,
other businesses operating at the airport Emonts, B.) Hydrogen Science and Engineering: Materials,
and the promotion of the fixed electrical Processes, Systems and Technology. Wiley-VCH Verlag,
ground power systems (FEGP) for aircraft Germany: 412-438.
355You can also read