City of Hollister: Transportation Issues for the Future 2001-2011 - December 2002
←
→
Page content transcription
If your browser does not render page correctly, please read the page content below
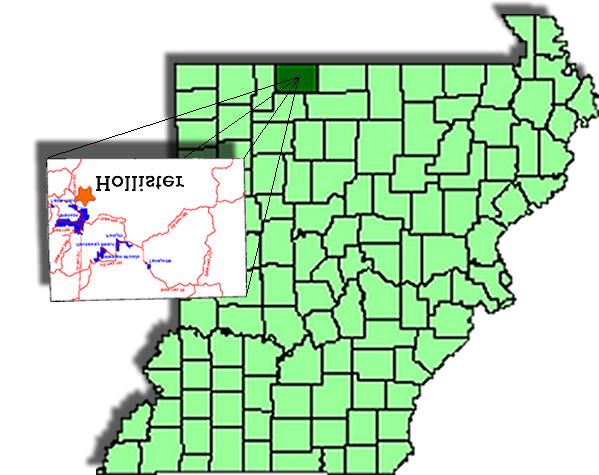
City of Hollister:
Transportation Issues for the Future
            2001-2011

               December 2002

                 215 Middlebush
              Columbia, MO 65211
          http://www.cpac.missouri.edu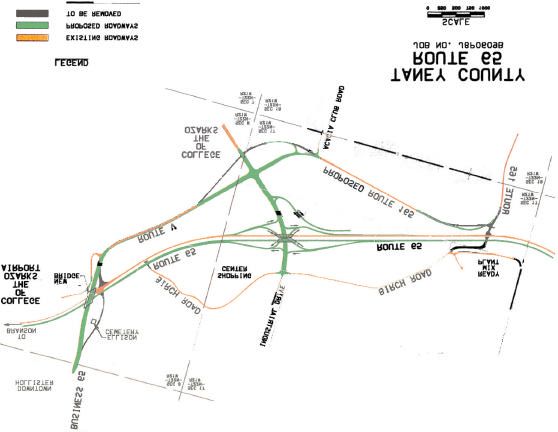
City of Hollister Transportation Study:
                    2001-2011
                                                by

                                  Anna E. Kovalyova

                         Reports B-2002-05; S-2002-04
                       Community Policy Analysis Center
                        University of Missouri-Columbia
* Anna Kovalyova is a Research Coordinator with the Community Policy Analysis Center, UMC.
** Taney County Route 65 map is the courtesy of the City of Hollister.
Table of Contents
Page
Acknowledgements ..................................................................................................1
Executive Summary .................................................................................................2
Findings ....................................................................................................................3
City of Hollister Baseline without Congestion: Summary Table ..............................4
City of Hollister Baseline with Congestion: Summary Table ...................................5
City of Hollister Scenario 1: Summary Table...........................................................6
City of Hollister Scenario 2: Summary Table...........................................................7
City of Hollister Scenario 3: Summary Table...........................................................8
Project Overview......................................................................................................9
Brief Description of City’s Economic Conditions…………………………...............10
Summary of Traffic Data........................................................................................11
Forecasts and Analysis:
I. Socio-Demographic Characteristics……………… ………………………15
II. Labor Market Characteristics………………... ……………………………21
III. Economic Characteristics……………… …………………………………26
IV. Fiscal Characteristics ...........................................................................34
Conclusions............................................................................................................36
Show Me model and Scenario Development ........................................................37
Appendix ................................................................................................................37
Community Policy Analysis Center iii City of Hollister Baseline and ScenariosAcknowledgements
A number of people made valuable contributions to the preparation of this report. The
Community Policy Analysis Center wishes to thank the hard work and dedication of the Hollister
Transportation Project Advisory Panel. CPAC especially appreciates the leadership of Rick
Ziegenfuss, Director of Community and Economic Development, City of Hollister and all his
work in coordinating meetings and correspondence with the Advisory Panel. Special thanks go
to Andrew Mueller, Area Engineer, MODOT for his invaluable support in obtaining traffic-related
data for the study, who went beyond the call of duty sharing his expertise and suggestions with
the study participants. Finally, a round of applause goes to John Lewis, City Administrator and
Vonnie Fuqua-Mathiesen for their overall guidance and support. CPAC accepts full
responsibility for the research findings and any errors in this report.
Hollister Transportation Study Advisory Panel
Mr. Dave Cox, Developer
Mr. Joe Chowning, Presiding Commissioner, Taney County
Mr. Gary Demster, Manager, Lowe’s
Ms. Vonnie Fuqua-Mathiesen, Director of Public Relations, City of Hollister
Dr. Howell Keeter, College of the Ozarks
Ms. Virginia Kenyon, Ozark Mountain Bank, Vice-President
Mr. Tom Keohan, Business & Industry Specialist, University of Missouri Outreach & Extension
(UO/E)
Mr. John Lewis, City Administrator, City of Hollister
Mr. Andrew Mueller, Area Engineer, Branson Project Office, MODOT
Mr. Cyrus Murray, Director of Community Development, White River Valley Electric Cooperative
Mr. Mike Rankin, Economic Development Director, City of Branson
Mr. Mattew C. Seiler, P.E., Traffic Engineer, MODOT
Mr. Evan Shark, Developer
Mr. James Strahan, Taney County Assessor, Village of Kirbyville
Mr. Jay Waggoner, Project Manager, MODOT
Mr. Rick Ziegenfuss, Director of Community and Economic Development, City of Hollister
These people contributed insights, questions and important comments throughout the project.
2001 City of Hollister Baseline and Scenarios 1Executive Summary
This report describes a set of annual baseline and scenario projections1 on demographic,
economic, and fiscal conditions through 2011 for the City of Hollister, Taney County, Missouri.
Findings are based on a comprehensive statistical analysis of the most recent secondary data
available, as well as important input provided by the Community Advisory Panel. 2001 serves
as a base year for the forecasts, since the majority of available data is for 2001. Thus, some of
the data in the base year are actual, and some are projected. Dollar figures are reported in
constant 2001 terms, with no attempt to estimate future inflation rates. The actual data in the
figures accompanying the report are separated from their forecasted counterparts by dotted line.
Since the actual data for cities is much more scarce than it is for counties, many charts depict
only the data for the Census years with no estimates in between.
The Advisory Panel, using their personal knowledge of economic conditions in the region, came
to a consensus on likely key growth rates for variables that guide the forecasts in the statistical
model. The forecasts in this report are based on the following projected annual growth rates:
Employment growth rate in the City of Hollister 2.00% 2.86%
Real Per Capita Income growth rate in the City of Hollister 2.08% 2.17%
Employment growth rate in surrounding communities 1.41% 1.86%
Labor Force growth rate in surrounding communities 1.00% 1.59%
where the first set of growth rates is chosen for the first 2 years of the forecast, and the second
– for the remaining 8 years of the forecast. Two different sets of the growth rates that guide the
forecasts were chosen by the Advisory Panel to reflect a slow-down in the economy in response
to the nation-wide recession of 2000. The Advisory Panel selected these growth rates after a
careful study of trends in these variables over the past 10 years, as well as current economic
conditions in the region.
The baseline in this report does not represent a forecast of local economic conditions. Rather, it
is a tool designed to help decision-makers see local economic activity as a comprehensive
system that is both logically consistent and statistically valid. The baseline was then used as a
tool to estimate the direct and total effects of expected changes in the transportation system in
the area. The model does not account for changes due to the national business cycle or other
macroeconomic effects.
1
For definition of baseline and scenarios, see “Show Me Model and Scenario Development” section.
The Community Policy Analysis Center 2Findings
• Over the next 10 years, Hollister is expected to continue its growth in a number of socio-
demographic, economic and fiscal variables. This growth would be accelerated if the
problem of road congestion is alleviated.
• Under current conditions (baseline with congestion), Hollister population is expected to grow
at an average annual rate of 1.3 percent. This is in contrast to 2.7 percent population
growth that would have occurred if the City growth were not restricted by congestion.
• The majority of Hollister residents are employed in service sector. This is also the fastest
growing sector in the area.
• City growth over the baseline period will stimulate demand for over 200 additional housing
units in baseline with congestion, and about 470 units – if congestion were to be eliminated.
• Per capita income – before inflation – is projected to grow by 1.6 percent annually through
2011. Total personal income is expected to grow from almost $52 million to just over $68
million (in 2001 Dollars) over the projection period in the presence of congestion – a real
growth rate of 3.1 percent per year. In the absence of congestion, the total personal income
in the City is expected to grow at average annual rate of 4.8 percent, reaching almost $77
million in 2011.
• Changes in City income and employment will lead to 0.8 percent in annual growth of taxable
retail sales in the presence of congestion, and 1.6 percent – in its absence.
• Hollister finances the bulk of public goods and services it provides via sales taxes. This type
of revenues comprised 46 percent of total revenues in 2001. Sales tax receipts for the City
are expected to grow at a moderate growth rate of 0.8 percent per year in a baseline with
congestion, and at a faster rate of 1.7 percent in the absence of congestion.
• Between 2002 and 2011, the City total revenues are expected to grow at 1.1 percent per
year, if current economic conditions in the City prevail.
• In the absence of congestion, City total revenues are expected to grow at an average
annual rate of 2.4 percent (between 2002 and 2011).
• The growth of all variables in Scenario 3 (as defined in “Project Overview” section) is
expected to exceed that of the baseline without congestion.
2001 City of Hollister Baseline and Scenarios 3Baseline Summary Table, 2001-2011
City of Hollister
(Reported in 2001 Dollars)
No Congestion is Assumed 1
Absolute Annual
Variables 2001 2011 Change Growth Rate
Demographics and Workforce
Characteristics
Population 3,933 4,987 1,054 2.68%
Labor force 2,213 2,763 550 2.48%
Employment by Workplace 2,550 3,352 802 3.15%
Employment by Residence 1,957 2,465 508 2.60%
Incommuters 2 1,493 1,941 447 3.00%
Outcommuters 1,630 1,809 179 1.10%
Unemployed 257 298 42 1.63%
School Enrollment 1,133 1,437 304 2.68%
Persons Younger 16 745 1,006 261 3.50%
Persons Older 65 641 808 167 2.60%
Demand for Housing 1,764 2,236 473 2.68%
Economics
Real Per Capita Income $13,209 $15,376 $2,167 1.64%
Real Total Personal Income ($1,000) $51,948 $76,681 $24,733 4.76%
Assessed Property Value ($1,000) $29,889 $46,598 $16,709 5.59%
Retail Sales ($1,000) $76,397 $88,574 $12,177 1.59%
Revenues ($1,000)
City Property Tax Receipts $137 $180 $43 3.12%
City Sales Tax Receipts $1,363 $1,594 $231 1.69%
Intergovernmental Revenues $155 $197 $42 2.68%
Total Revenues ($1,000) 3 $2,952 $4,714 $1,762 5.97%
1. Scenario 1 eventually becomes Baseline without Congestion once the newly constructed road becomes fully operational.
2. At the time when this report was written, Census 2000 data for incommuters have not yet been released.
Therefore, CPAC used itsf own projection for incommuting 2000.
3. Excludes Operating Transfers.
The Community Policy Analysis Center 42001 City of Hollister Baseline and Scenarios 5
The Community Policy Analysis Center 6
2001 City of Hollister Baseline and Scenarios 7
The Community Policy Analysis Center 8
Project Overview
 The City of Hollister Transportation Project has been a collaborative effort between the City and
 the Community Policy Analysis Center (CPAC). The Advisory Panel met on a regular basis
 between the months of June and December, 2002 to form background information and basic
 assumptions for the study. Panel members represented not only the various organizations of
 the City of Hollister but of the neighboring cities of Kirbyville and Branson, as well as the County
 officials and MODOT representatives. The forecasts on demographic, economic, and fiscal
 conditions through 2011 described in this report will assist public officials and community
 residents in addressing economic changes. Its findings are the result of an extensive analysis
 of the local economy, achieved through discussion with key public and private sector leaders
 throughout the community, and use of the Show Me Community Model, developed by CPAC.

 The Advisory Panel proposed the following scenarios:
 •   1st scenario: construction of highway 65 (industrial park) interchange and 4-lane expansion starting
     in 2004 and completed in 2006;

 •   2nd scenario: same as scenario 1, delayed until 2007;
 •   3rd scenario: 1st scenario plus East-West road construction.

 The report analyzes the following: baseline without the congestion, baseline with the
 congestion, and scenarios. Findings in this report are discussed in four separate sections. The
 first section describes future socio-demographic characteristics in the City of Hollister with and
 without major highway improvements. The second section reports on labor market, and the
 third – on economic conditions in Hollister under proposed scenarios. The fourth section
 examines related fiscal implications for city government in the same settings.

 CPAC baselines assume normal growth, under normal infrastructure development. Baseline
 without congestion reflects the economic conditions Hollister would have if there were no road
 congestion. Whereas roads per se do not create growth, the absence of roads or poor road
 conditions hinder economic development. Thus, baseline with congestion shows where
 Hollister would be 10 years from now if the current road conditions were to prevail.
 Subsequently, scenarios show how overall Hollister economy will be affected once the road
 improvements are made. Scenario 1 eventually becomes baseline without congestion. This
 does not, however, happen with scenario 2 since the longer the construction is postponed, the
 wider is the gap between the baselines with and without congestion.

 The City of Hollister feels that by implementing the three phases of road construction (an X-
 interchange, a four-lane section of U.S. 65 from the Taneycomo Bridge to U.S. 165 intersection,
 and an East-West corridor linking Kirbyville, Hollister and U.S. Highway 65), the City would be
 able to improve traffic patterns, minimize congestion, improve safety at school entrances and in
 residential neighborhoods, lessen the emergency time response, expand opportunities for
 developers and protect the environment, among other things.

 The first 2 scenarios assume hiring 100 workers for each scenario for Highway 65
 improvements. The 3rd scenario assumes hiring additional 100 workers for the construction of
 EW road to Kirbyville, for a total of 200 construction workers. The entire construction cost of the
 project (US 65 improvements and EW road) is estimated at $38 million. Note that the scenarios
 in this report do reflect the temporary increase in employment due to roads’ construction and
 improvement. Keep in mind that this report examines the total impact of transportation industry
 only. It does not examine the impact of the retail, industrial or housing development that might
 be attracted to Hollister after road construction is completed.

 2001 City of Hollister Baseline and Scenarios                                                              9
Brief Description of City’s Economic Conditions2 Hollister, Missouri can be found in the heart of Ozark Mountain County’s Tri-lakes Region. It is located 35 miles south of Springfield, Missouri on U.S. Highway 65. Hollister shares the shores of Lake Taneycomo with its closest neighbor, Branson, Missouri. It is a 10-minute drive from some of the greatest family entertainment and recreational destinations our nation has to offer. In addition to Lake Taneycomo’s world-class trout fishing, Table Rock and Bull Shoals Lakes offer crystal clear water for boating, swimming and fishing. For an added entertainment bonus, Hollister’s closest neighbor is Branson, Missouri, with its wide variety of entertainment for the whole family. According to the State of Missouri Department of Public Safety and Missouri State Highway Patrol, the City of Hollister has no reported crimes. Many changes have taken place in the City of Hollister in the last two decades. The city’s population experienced a 2.7 time increase over its 1980 level and over 100 new business enterprises have started up since 1990.3 Rapid growth of the tourism industry in the Branson area during the early 1990s has facilitated these increases in population and development within the City of Hollister. Whereas the area’s tourism industry has created economic opportunity for Hollister residents, it has also introduced many challenges to the City. Throughout the 1990s, Hollister has been directing its resources to the growing resident population and business community. Located in the second fastest growing county (after Christian County) in the State of Missouri,4 Hollister is experiencing significant economic expansion after decades of stagnation and expects continued immigration of population over the next decade. This expansion is largely due to aggressive city planning and Branson’s “boom” in economic growth. Another significant factor in Hollister’s economic and community expansion is U.S. Highway 65 that bisects the City. The southern section of the highway provides, among other things, access to Hollister Industrial Park and a retail complex. Planned improvements to the U.S. Highway 65 between Branson and Hollister, as well as proposed improvements to Highway 65 between Hollister and the Arkansas boarder, are expected to further catalyze business development in Hollister. Hollister understands the necessity of taking a proactive role in planning for its future in order to provide the adequate quality of life to its future generations. As an integral part of this planning process the City of Hollister commissioned the University of Missouri’s Community Policy and Analysis Center to assist in assessing Hollister future growth under current transportation conditions and proposed road improvements. Regional economic development brings both opportunities and challenges. As future population and income levels in the City increase, this will lead to new demands for both public and private sectors. For example, as the number of housing starts in the community rise, it will place new pressures on water and sewage treatment systems. Local governments will need to play a more active role in developing public infrastructure as part of the overall economic development to assure drinking water quality, sufficient law enforcement, and adequate transportation system, among other things, for its residents in the 21st century to ensure that the City of Hollister remains a nice place to work and live. 2 The “Description of City’s Economic Conditions” section is largely based on the information from Rick Ziegenfuss, Director of Community and Economic Development, City of Hollister and Hollister Comprehensive Plan, Southwest Missouri State University. 3 Source on new business licenses: Hollister City Clerk’s Office. 4 The growth is determined by examining the counties’ population levels in 1990 and 2000 (according to the Census data). The Community Policy Analysis Center 10
Summary of Traffic Data5
As was mentioned earlier, CPAC baselines assume normal growth, under normal infrastructure
improvements. However, in 2000 average traffic count on US 65 from Hollister to the State line
exceeded its projected capacity by 78 percent. The following information that was generously
provided by MODOT engineers will give us the insight into traffic flow in Hollister and its
surroundings.
                       Figure 1. Average Daily Vehicle Miles of Travel
                                               on the State Highway System, 1989-2001
                                                            Taney County
                    1,400,000

                    1,200,000

                    1,000,000
    Vehicle Miles

                     800,000

                     600,000

                     400,000

                     200,000

                           0
                                1989   1990   1991   1992   1993   1994    1995     1996      1997   1998   1999   2000   2001
                                                                          Year
    Source: Missouri Department of Transportation, Annual Traffic Monitoring Systems Report
    Analysis by CPAC

Average daily vehicle miles of travel (ADMV) are calculated as the average of traffic counts on a
highway times the highway mileage. ADMV for Taney County includes travelers from other
counties/states. The chart shows traffic increase around 1993 corresponding to Branson boom.
In recent years (after 1999), ADMV showed some decline.

5
 The majority of the information in this section was provided by MODOT, and particularly by Andrew Mueller,
Area Engineer, Branson Project Office.

2001 City of Hollister Baseline and Scenarios                                                                                    11
TANEY COUNTY ROUTE MILEAGE
ROUTE MILEAGE
US 65 23.39
US 160 43.11
MO 76 42.32
MO 165 11.28
MO 176 15.86
MO 86 4.66
MO 125 30.71
MO 248 10.82
MO 265 9.49
MO 376 1.77
RT F 3.46
RT H 7.52
RT J 8.07
RT K 2.69
RT M 11.73
RT O 2.94
RT P 1.77
RT T 6.86
RT U 3.81
RT V 0.75
RT W 4.32
RT Y 3.42
RT AA 5.31
RT BB 4.17
RT DD 7.21
RT EE 1.04
RT FF 3.99
RT HH 5.18
RT JJ 8.72
RT KK 4.19
RT MM 1.49
RT OO 3.13
RT VV 2.12
TOTAL MILEAGE 297.3
Source: MODOT
As evident from the table, Taney County has 297 miles of roads, of which US Highway 65
occupies 23 miles, or almost 8 percent. Of these miles, almost 12 miles will be affected by the
proposed construction/improvement on US 65. In particular, the proposed "Hollister
Interchange" project will affect 2.89 miles of Route 65 beginning at the end of the divided
pavement near the Kahill Road Bridge over 65 and ending just south of Route 165. The
remainder of the Route 65 Freeway project, which MODOT intends to complete from Route 165
to the Arkansas state line is 9.01 miles in length.6
6
Source: MODOT
The Community Policy Analysis Center 12AVERAGE ANNUAL DAILY TRAFFIC COUNTS ON SOUTH 65 TO THE ARKANSAS LINE
Existing Routes
1990 1991 1992 1993 1994 1995 1996 1997 1998 1999 2000 2001
76 TO V 9,268 12,444 13,352 18,780 17,030 17,438 17,926 17,786 18,284 24,084 24,084 24,518
V TO 165 9,268 9,436 10,124 14,240 12,912 13,222 13,592 13,486 13,864 18,258 18,258 18,586
165 TO 265 9,242 10,406 11,144 13,944 14,656 15,008 15,428 15,578 16,014 19,024 13,324 14,343
265 TO 86 9,242 9,408 10,076 12,608 13,252 13,570 13,950 14,086 14,480 17,202 12,749 13,724
86 TO State Line 5,506 5,920 6,340 7,934 8,338 8,538 8,778 8,864 9,112 10,824 9,320 10,033
Source: Courtesy of MODOT
The first column in the table above indicates a beginning and ending point of various sections of
US 65. For example, "76 to V" indicates the section of U.S. 65 beginning at the Route 76
Interchange in Branson and ending at the traffic signal at Business 65/Route V in Hollister. The
next segment begins at the Business 65/Route V traffic signal and ends at the traffic signal at
the 165/Birch Road intersection and so on. "SL" stands for "State Line."
The average traffic counts grew the fastest from 1992 to 1993 and from 1998 to 1999.
However, between 1999 and 2000, the average traffic counts experienced as much as 30
percent decline (between MO 165 and MO 265 intersections).
Figure 2. City of Hollister and the Region
Traffic Counts on South 65 to Arkansas Line, 1990-2001
25,000
76 TO V
V TO 165
20,000 165 TO 265
Average Annual Daily Traffic
265 TO 86
86 TO State Line
15,000
10,000
5,000
0
1990 1991 1992 1993 1994 1995 1996 1997 1998 1999 2000 2001
Year
Source: Courtesy of Missouri Department of Transportation
Analysis by CPAC
Figure 2 provides graphical representation of the traffic counts on US 65 south (by intersection)
from the table above and gives us some idea of traffic growth patterns in the area. Keep in
mind that the counts are AADTs (Average Annual Daily Traffic). Understandably, there were
more than 24,000 vehicles per day traveling between Route 76 and Route V on July 4, 2001.
However, by using AADT we can draw meaningful comparisons with other routes across the
state on any given day of the year.
2001 City of Hollister Baseline and Scenarios 13AVERAGE DAILY TRAFFIC COUNTS FOR ALL STATE ROUTES IN HOLLISTER AREA
(BESIDES US 65)
Route 2000 2001 mileage
Bus. 65 from MO 76 West to US 65 N 13,058 12,992 1.83
Route V from US 65 N to College of the Ozarks 7,366 7,330 0.95
Route BB from Bus. Route 65 to the end 1,298 1,292 3.62
Route 165 from College of Ozarks to MO 165 5,256 5,230 0.98
These data show the distribution of the average daily traffic on all state routes in Hollister.
Comparison of these numbers with the traffic counts on US 65 shows that the portion of US 65
that goes through Hollister carries, on average, more traffic than any other road in Hollister area.
PROJECTED AVERAGE DAILY TRAFFIC COUNTS* ON SOUTH 65 AND BIRCH ROAD
Route miles of road 2005*** 2025
Bus. 65 up to intersection of
Bus. 65, 165 (Current Route V) from downtown Hollister 0.95 13,875 27,750
165 (Current Route V) 0.98 11,875 23,750
Bus. 65/165**** West of 65 0.33 17,000 34,000
East of 65 0.12 13,650 27,300
does not exist yet, MODOT
is in the process of
SW Outer Road completing it 0.32 3,000 6,000
US 65 North of the interchange 1.66 29,050 58,100
South of the interchange 0.79 19,100 38,200
Birch Road** (existing road) North of the interchange 0.78 10,425 20,850
South of the interchange 0.554 3,350 6,700
Total 6.484
* Represents average number of vehicles travelling per day.
** Not a state road; maintained by the City of Hollister.
*** Represents FY 2005 that runs from July 1, 2004 to June 30, 2005.
**** This is the road from College of the Ozarks entrance to Industrial Drive.
It does not have the actual name yet.
Source: Projections by MODOT
The last table gives us the MODOT estimates of average daily traffic counts on south US 65
and Birch Road. These projected numbers were used in this study to derive the expected
increase in Hollister employment due to road improvement. In addition, 6,000 vehicles per day
were assumed to be traveling on the East-West road upon its completion. The 6,000 traffic
count figure came from the Advisory Panel and is based on the personal knowledge of their
economy. The Panel assumed that out of these 6,000 vehicles, only 10-12 percent will be
brand new traffic, and the remaining 90 percent will be the redistribution of traffic from the
existing roads.
According to the Panel, as Branson keeps growing, it is likely that Hollister will continue to
develop as a bedroom community for Branson.
The Community Policy Analysis Center 14Forecasts and Analysis
I. Socio-Demographic Characteristics
The following population figure can help citizens understand trends in their community that can
be used to analyze future service needs for community’s population.
Figure 3. City of Hollister
Population, 1990-2011
5,000
4,500
4,000
3,500
3,000
Persons
2,500
2,000
Census Extrapolation
Scenario 1
1,500
Baseline With Congestion
Scenario 2
1,000 Baseline Without Congestion
500
0
1990 1991 1992 1993 1994 1995 1996 1997 1998 1999 2000 2001 2002 2003 2004 2005 2006 2007 2008 2009 2010 2011
Year
Source: US Census Bureau
Analysis by CPAC
Figure 3 illustrates the population change in the City since 1990. According to Census 2000,
Hollister has 3,867 people. Hollister population increased by approximately 47 percent between
1990 and 2000. Note that the chart also shows intercensal estimates for population7 from 1990
to 1999 derived by the Census Bureau. However, the Bureau estimates largely “overshot” the
actual data as evident from comparing 1999 estimate with 2000 Census data. Census Bureau
is to interpolate its population estimates between 1990 and 2000 sometime this year in order to
make them consistent with 2000 figures.
The City of Hollister accounted for about 10 percent of total population in Taney County in both
1990 and 2000. Hollister has a relatively young population base. According to Census 2000,
the median age in the City is about 35 years, vs. 39 years for Taney County and 36 years for
the State of Missouri. In 1990, median age in Hollister was 37 years.
If the current economic conditions prevail, Hollister population is expected to increase by
approximately 500 persons between 2001 and 2011 – an annual growth rate of 1.3 percent. For
comparison, the average annual population growth rate for the State of Missouri is 0.77 percent
since 1990. If on the other hand, Hollister were to reach its baseline without congestion, then its
7
Intercensal estimates represent an extrapolation, or a projection of the variable from the known observation
forward (say, beginning with Census 1990 figure). Interpolation, on the other hand, is the projection between the
two end points (say, between Census 1990 and 2000 data).
2001 City of Hollister Baseline and Scenarios 15population would have increased by approximately 1,050 persons between 2001 and 2011,
representing 2.7 percent annual growth. This is approximately 550 persons more than expected
population increase in baseline with congestion.8 Scenario 2, on the other hand, would have led
to an increase of about 360 persons over the baseline with congestion in 2011.9
We also examined the two population groups that are generally not part of the labor force:
young persons in the City (people younger than 16), as well as older population (persons over
65). The young people usually do not make moving/allocation decisions themselves, but rather
follow their families. The older part of the population typically constitutes retirees who may, and
often do, have a profound effect on the community’s economy. In 2000, young population
comprised about 19 percent of the total population in Hollister, and retirees – 16 percent.
Figure 4. City of Hollister
Persons Younger than 16, 1990-2011
1000 Baseline with Congestion
Scenario 1
Scenario 2
800 Baseline Without Congestion
Persons
600
400
200
0
1990 1991 1992 1993 1994 1995 1996 1997 1998 1999 2000 2001 2002 2003 2004 2005 2006 2007 2008 2009 2010 2011
Year
Source: US Census Bureau
Analysis by CPAC
Figure 4 illustrates the change in persons younger than 16 in the City for years 1990 and 2000-
2011. In examining the actual data for this segment of the population, one can notice, that its
2000 level is almost 35 percent larger than its 1990 level. In the baseline with congestion (i.e.,
assuming that the current economic conditions will prevail), “young” population in the City is
expected to increase by about 120 persons between 2001 and 2011 – an annual growth rate of
1.7 percent. This is in contrast to the baseline without congestion that will lead to an expected
increase of 260 persons, or 3.5 percent average annual growth. Thus, scenario 1 is expected to
exceed baseline with congestion by over 130 persons, whereas scenario 2 – by just under 100
persons in 2011.
8
Again, scenario 1 eventually becomes baseline without congestion.
9
Scenario 3 is not depicted in this and other charts in order to avoid clustering.
The Community Policy Analysis Center 16Figure 5. City of Hollister
Persons over 65, 1990-2011
900
Baseline with Congestion
800
Scenario 1
Scenario 2
700 Baseline Without Congestion
600
Persons
500
400
300
200
100
0
1990 1991 1992 1993 1994 1995 1996 1997 1998 1999 2000 2001 2002 2003 2004 2005 2006 2007 2008 2009 2010 2011
Year
Source: US Census Bureau
Analysis by CPAC
Figure 5 represents the changes in persons over 65 in the City for years 1990 and 2000-2011.
In examining the actual data for this segment of the population, one can notice that its 2000
level is only 8.6 percent higher than its 1990 level (vs. 35 percent for “young” persons, as
observed above) supporting our observation about Hollister population base remaining young.
In the baseline with congestion, the “older” population in the City is expected to increase by
approximately 80 people between 2001 and 2011, at an annual growth rate of 1.2 percent. This
is in contrast to the baseline without congestion in which “older” population is expected to
increase by almost 170 persons between 2001 and 2011, growing at an average annual rate of
2.6 percent. In 2011, scenario 2 is expected to exceed baseline with congestion by just under
60 retirees, in contrast to almost 90 retirees in scenario 1.
If the actual population grows through the baseline period as expected, this growth will lead to
increased demands for housing, health services, higher and continuing education, and family
recreation activities.
2001 City of Hollister Baseline and Scenarios 17Figure 6. City of Hollister
School Enrollment, 1990-2011
1,600
Baseline With Congestion
1,400
Scenario 1
Scenario 2
1,200 Baseline Without Congestion
1,000
Students
800
600
400
200
0
1990 1991 1992 1993 1994 1995 1996 1997 1998 1999 2000 2001 2002 2003 2004 2005 2006 2007 2008 2009 2010 2011
Year
Source: Missouri Department of Elementary and Secondary Education (DESE)
Analysis by CPAC
Figure 6 shows the actual and projected growth in public school enrollment, corresponding to
the population trends in school age children. Actual school enrollment in the City of Hollister
grew steadily between the years of 1991 and 1995, amounting to 31 percent growth in this time
period. The projected growth rate in school enrollment for the baseline with congestion is 1.3
percent per year, leading to an absolute change of approximately 145 pupils over the next 10
years. On the other hand, in the baseline without congestion school enrollment grows at an
average annual growth rate of 2.7 percent that translates into an increase of about 300 students
over the baseline period. In 2011, scenario 2 is expected to exceed baseline with congestion by
just over 100 students, in contrast to 160 students in scenario 1.
The Community Policy Analysis Center 18Figure 7. City of Hollister.
Public School Enrollment by Grade
1990, 1995, 2001 (Fall Semester)
120
1990
1995
100
2001
80
Pupils
60
40
20
0
K 1 2 3 4 5 6 7 8 9 10 11 12
Grades
Source: Missouri Department of Elementary and Secondary Education (DESE)
Analysis by CPAC
Figure 7 shows pupils’ enrollment by grade for Fall semester for years 1990, 1995 and 2001. In
2001, third grade had the largest enrollment, and 12th – the smallest. The Panel also wished to
examine the dropout rates among senior students in Hollister public school. The following table
comes from the Department of Elementary and Secondary Education (DESE) and examines the
annual dropout rates for years 1998-2002:
Annual Dropout Rate 1998-2002
As a Percent of Total Enrollment
Hollister R-V Missouri
Year 1998 1999 2000 2001 2002 1998 1999 2000 2001 2002
Dropouts 9-
12 20 18 15 32 25 13,105 12,327 11,717 11,276 9,982
Dropout Rate
9-12 (%) 7.4 6.1 4.7 9.9 7.1 5 4.8 4.5 4.3 3.8
Source: Missouri Dept. of Elementary and Secondary Education,
http://www.dese.state.mo.us/schooldata/four/106005/dropnone.html
As submitted to Core Data by Missouri Public Schools
High school dropout rate is the number of dropouts divided by (September enrollment plus transfers in minus transfers out
minus dropouts added to total September enrollment then divided by two).
Data as of November 25, 2002
Source: MO Department of Elementary and Secondary Education
As evident from the table, dropout rates for Hollister exceed those for the State of Missouri in
any given year, with 2001 dropout rate being 2.3 times larger than the corresponding State
figure. Thus, highschool dropout rates in Hollister represent an issue, because of the
employment opportunities readily available to teenagers in the area.
2001 City of Hollister Baseline and Scenarios 19Figure 8. City of Hollister
Demand for Housing, 2001-2011
2,500
Baseline with Congestion
Scenario 1
Number of Housing Units Demanded
Scenario 2
Baseline Without Congestion
2,000
1,500
1,000
500
0
2001 2002 2003 2004 2005 2006 2007 2008 2009 2010 2011
Year
Analysis by CPAC
Housing was mentioned by the Advisory Panel as one of the issues faced by the City.
According to Census 2000, there are 2.5 persons per household in the State of Missouri, and
2.37 persons per household in Hollister. Figure 8 represents the forecasted demand for
housing for years 2001 – 2011. The Hollister demand for housing for the baseline with
congestion is expected to increase by almost 300 housing units over the 10 years of the
projection, at an average annual rate of 1.3 percent. This is in contrast to the demand for
housing for the baseline without congestion that is expected to increase by approximately 470
housing units between 2001 and 2011, growing at an annual average rate of 2.7 percent.
Housing projection follows that of the population.
The Community Policy Analysis Center 20II. Labor Market Characteristics
Workforce characteristics include the labor force, employment and unemployment levels, and
commuting patterns.
Figure 9. City of Hollister
L a b o r F o r c e , 1 9 9 0 -2 0 1 1
3000
Baseline With Congestion
Scenario 1
2500 Scenario 2
Baseline Without Congestion
2000
Labor Force
1500
1000
500
0
1990 1991 1992 1993 1994 1995 1996 1997 1998 1999 2000 2001 2002 2003 2004 2005 2006 2007 2008 2009 2010 2011
Year
Source: US Census Bureau
Analysis by CPAC
Figure 9 illustrates expected growth in the civilian labor force – the number of adults who live in
the City and are now either gainfully employed or actively seeking work. Between 1990 and
2000, actual labor force in the City of Hollister grew substantially (by 963 persons, or 79
percent), reflecting, among other things, the national trend of increased labor force participation
and Branson boom in the early 1990s. In baseline with congestion, the labor force is expected
to increase by approximately 260 persons by 2011 over its 2001 level, representing a 1.2
percent annual growth. This increase is composed of growth in both local labor force and
number of incommuters. For comparison, in baseline without congestion, the labor force is
expected to increase by 550 persons by year 2011, at an annual average rate of 2.5 percent. In
2011, scenario 2 is expected to exceed baseline with congestion by just over 180 persons, in
contrast to almost 290 persons in scenario 1.
Ten largest employers in the City of Hollister (in order of largest to smallest) are: College of the
Ozarks, Hollister Public Schools, Lowe’s Home Improvement Center, Country Mart Grocery,
Nowells Foods, United States Postal Service, City Of Hollister, United Parcel Service, Branson
Daily News and Spirit Shop/Fast Trip. These firms/organizations employ a total of about 900
employees.10 According to the Advisory Panel, Hollister employment is characterized not only
by large employers such as College of the Ozarks, Hollister public schools and Lowe’s, but also
by a large number of self-employed people and family businesses.
Figure 10 represents employment by residence (i.e., the number of Hollister residents who hold
jobs, regardless of where these jobs are located: inside or outside the city limits). Employment
by residence data is equal to Labor Force - Unemployment (i.e., it already accounts for the net
commuting). For the baseline with congestion, the employment by residence is expected to
grow by approximately 240 employees between 2001 and 2011 – at an average annual growth
rate of over 1.2 percent. At the same time, for the baseline without congestion, employment by
10
Per Rick Ziegenfuss, Director of Community and Economic Development, City of Hollister.
2001 City of Hollister Baseline and Scenarios 21residence increases by 500 employees – at an average annual rate of 2.6 percent. In 2011,
scenario 2 is expected to exceed baseline with congestion by just over 170 employees, in
contrast to almost 270 employees in scenario 1.
Figure 10. City of Hollister
Employment by Residence, 1990 -2011
3000
Baseline With Congestion
Scenario 1
Scenario 2
2500 Baseline Without Conge stion
Persons Employed
2000
1500
1000
500
0
1990 1991 1992 1993 1994 1995 1996 1997 1998 1999 2000 2001 2002 2003 2004 2005 2006 2007 2008 2009 2010 2011
Year
Source: US Census Bureau
Analysis by CPAC
Figure 11 represents Hollister employment by major industry for years 1990 and 2000. Service
sector provides the largest number of jobs in the City, followed by retail sector. Services is also the
largest growing sector in the City - between 1990 and 2000, it grew by 718 jobs, or 175 percent.
This is consistent with the current national trend for employment growing fastest in the services and
retail trade sectors. On the other hand, agriculture, wholesale and public administration provide the
smallest number of jobs in the City. Three sectors, agriculture, transportation and wholesale,
actually experienced a decline in the number of jobs between 1990 and 2000.
The Community Policy Analysis Center 22Figure 12. City of Hollister
Employment by Workplace, 1990-2011
3500
Baseline With Congestion
Scenario 1
3000
Baseline Without Congestion
Scenario 2
2500
Number of Jobs
2000
1500
1000
500
0
1990 1991 1992 1993 1994 1995 1996 1997 1998 1999 2000 2001 2002 2003 2004 2005 2006 2007 2008 2009 2010 2011
Year
Analysis by CPAC
Figure 12 depicts employment by workplace (i.e., the number of jobs located in the City
regardless of who is taking those jobs – local residents or in-commuters), exhibiting the trend
similar to that of the labor force. Namely, between the years 1990 and 2000, Hollister
employment experienced a 79 percent growth, amounting to about 960 job increase.11 The
Panel noted that the opening of Lowe’s in February 2001 contributed to an increase of jobs
located in Hollister.
After considerable discussion, members of the Advisory Panel concluded that the future rate of
employment growth would be smaller than the current one. More specifically, the Panel decided
that it is reasonable to expect the employment (without congestion) to grow at a rate of 2.00
percent per year for the first two years of the projection, and at a faster annual rate of 2.86
percent for the remaining years of the projection. The Panel believes that this rather high
growth is likely to prevail in the future, as Taney County continues to play a role of one of the
tourist attractions in Missouri. Thus, for an overall projection without congestion, employment
by workplace is expected to gain 800 jobs by 2011 over its 2001 level. In analyzing baseline
with congestion, employment by workplace is expected to increase by 380 jobs at the average
annual rate of 1.5 percent per year. Note that since scenario’s 2 construction is delayed until
2007, the employment does not reach the level of baseline without congestion by 2011. In
2011, scenario 2 is expected to exceed baseline with congestion by just over 320 jobs, in
contrast to about 420 jobs in scenario 1.
11
Note that there is no secondary data available for employment by workplace on a city level. Census Bureau
only publishes employment by residence for places (i.e., for cities, towns and villages). The Hollister numbers
for employment by workplace were derived by the Advisory Panel. As a starting point in the discussion, the
number of Hollister residents employed (employment by residence), the number and size of major employers,
the number of households and the number of business licenses in Hollister in year 2000 were analyzed. The
Advisory Panel concluded that in 2000, Hollister had approximately 2,500 jobs, taken by both local residents
and in-commuters. The Panel felt that conducting a survey of the city employers would not refine this number.
The Panel believed that the survey response rate would be less than 10 percent. The possibility of obtaining
the employment data through the local Chamber of Commerce was also ruled out.
2001 City of Hollister Baseline and Scenarios 23The temporary increase in employment in both scenarios (see Figure 12) reflects the presence
of construction workers in the area (100 construction workers that will be employed directly on
the highway improvement project will lead to a total of 152 new jobs in the area).12 After the
construction workers leave, the employment will go back to its pre-construction level of the
baseline with congestion. This decline in employment is denoted by a “bump” on the chart that
is due to the lag between a new road coming into operation and subsequent increase in
Hollister employment. There were no “bumps” on the previous charts because these
construction workers will not be moving into Hollister to live, and as such are not expected to
add to Hollister population.
There are a couple of points worth mentioning with regards to data interpretation:
1. Employment data by workplace includes both full- and part-time jobs and therefore,
represents number of jobs, not number of people. Thus, data for employment by
workplace does not report employment in FTE (full time equivalent), and as such, tend to
overestimate actual employment; and
2. In our model, we explicitly consider commuters, rather than implicitly accounting for net
commuters, i.e. we use the following identity: Labor Force = Employment (by workplace)
+ Unemployment + Outcommuters – Incommuters.
Figure 13. City of Hollister
Unemployment, 1990-2011
350
Baseline With Congestion
Scenario 1
300 Scenario 2
Baseline Without Congestion
Unemployed Persons
250
200
150
100
50
1990 1991 1992 1993 1994 1995 1996 1997 1998 1999 2000 2001 2002 2003 2004 2005 2006 2007 2008 2009 2010 2011
Year
Source: US Census Bureau
Analysis by CPAC
Figure 13 shows the number of unemployed adults in Hollister labor force. From the actual
data, City unemployment increased by 112 persons, or 79 percent between 1990 and 2000. It
is worth noting that in 1993 high unemployment was occurring throughout the state. In our
baseline with congestion, the number of unemployed persons is expected to increase by
approximately 20 persons by 2011, growing at an annual average rate of 0.8 percent. For the
baseline without congestion, unemployment is expected to increase by about 40 persons by
12
Similarly, 200 construction workers that will be employed directly in Scenario 3 will lead to a total of
approximately 304 new jobs in the area. For a decomposition of employment impact of 200 construction
workers in Scenario 3 on the overall county economy, see Appendix.
The Community Policy Analysis Center 242011 or 1.6 percent annually. In 2011, scenario 2 is expected to exceed baseline with
congestion by just over 10 unemployed, in contrast to about 20 unemployed in scenario 1.
Figure 14. City of Hollister
Commuting, 2001-2011
2,000
1,800
1,600
Number of Commuters
1,400
1,200
Incommuters Outcommuters
1,000
800
600
400
200
0
2001 2002 2003 2004 2005 2006 2007 2008 2009 2010 2011
Year
Source: US Census Bureau
Analysis by CPAC
Figure 14 represents expected changes in the number of commuters for baseline with
congestion.13 Incommuters are people who live outside of the community, but whose place of
employment is within the community. Outcommuters are residents of Hollister who work outside
of the city. Commuting patterns in the City changed tremendously since 1990. In particular, in
2000, outcommuting increased by almost 82 percent over its 1990 level.14 Forecasts of
commuting patterns are especially important in estimating changes in retail sales. In the
baseline with congestion, forecasted incommuting experiences an average annual growth of 1.5
percent through 2011. Outcommuting is expected to grow at an average of 0.6 percent per year
over the years of the forecast. Outcommuting affects employment by residence, resulting in
different behavior.
On the chart, incommuting is fast approaching outcommuting because of the growth rates
chosen by the Panel: since the growth rates for Hollister employment (as well as for external
labor force) is higher than for external employment, the incommuters will eventually
cross/exceed the outcommuters.
13
The baseline without congestion and scenarios are not shown here in order to keep the chart clean.
14
At the time when this report was written, Census 2000 data on incommuting has not been released. In addition,
Census 1990 only published outcommuting data for cities, but not incommuting. Therefore, CPAC used its own
projections for incommuting between the years 1990 and 2000. CPAC also had to adjust outcommuting data from
Census 2000, because Census data were based on the number of persons employed 16 years and older that answered
“yes” to a question: “Were you at work last week?” (i.e., at the time the Census was conducted), not on the total
employment by residence.
2001 City of Hollister Baseline and Scenarios 25III. Economic Characteristics
Figure 15. City of Hollister
Real Per Capita Income (in 2001 Dollars), 1990-2011
Hollister
20,000 Missouri
Taney County
15,000
Dollars
10,000
5,000
0
1990 1991 1992 1993 1994 1995 1996 1997 1998 1999 2000 2001 2002 2003 2004 2005 2006 2007 2008 2009 2010 2011
Year
Note: BEA's definition of personal income differs from that used by the Census Bureau. In general, the BEA's definition is much
more inclusive of different kinds of income than the Bureau's.
Source: US Census Bureau
Analysis by CPAC
Hollister per capita personal income (PCI) in 2000 was $13,078. For comparison, in 1990,
Hollister PCI was $11,983 (in real terms), which is about 8 percent less than its 2000 level.
Hollister 2000 PCI was equal to 66 percent of the State average (=$19,936) and 76 percent of
the County average (=$17,267).
As mentioned in the chart, the BEA (Bureau of Economic Analysis, Department of Commerce)
and Census definitions of income differ. For example, according to the BEA, Taney PCI in 2000
was $23,078, which is $5,811 higher than its corresponding Census figure. The personal
income of an area is defined by the BEA “as the income received by, or on behalf of, all the
residents of the area. It consists of the income received by persons from all sources—that is,
from participation in production, from both government and business transfer payments, and
from government interest (which is treated like a transfer payment).” For comparison, the
definition of income used by the Census Bureau “reflects money income before taxes and does
not include the value of noncash benefits such as employer-provided health insurance, food
stamps, or medicaid.” Here, we use the Census figures for Hollister because PCI from other
data sources is not available on a place (i.e., city, town, village) level.
Figure 15 shows a projected increase of 1.6 percent in Hollister real per capita income for
baseline with and without congestion for the next ten years. Thus, Hollister per capita income
will continue to be below the expected per capita income for both the State of Missouri and
Taney County. As mentioned previously, all dollar figures are standardized to 2001 dollars to
discount any changes in income caused by inflation. We did not show the two scenarios on the
chart because the scenarios are not expected to increase the PCI level in Hollister.
The Community Policy Analysis Center 26Income measures are an important part of community’s profile. Changes in income can give
important indications about the well being of the community. The per capita income indicator is
often used to measure both local quality of life and productivity growth in a local economy. The
Advisory Panel selected the per capita income growth rates after considerable discussion: 1.00
percent for the first two years and 1.59 percent – for the remaining years of the projection.
Typically, real per capita income growth of one percent per year is considered desirable in most
areas. In the baseline period, real per capita income (i.e., per capita income adjusted for
inflation) grows at an annual average growth rate of 1.6 percent, exceeding the desirable one
percent figure. If the growth rate included inflation (i.e., if it were given in nominal terms), the
rate would be higher. For example, if inflation were measured at 2 percent per year, the
nominal per capita income growth would be 3.6 percent.
Figure 16. City of Hollister
Total Personal Income (in 2001 Dollars), 1990-2011
$90,000
Baseline With Congestion
$80,000
Scenario 1
Scenario 2
Total P ersonal Income ($1,000)
$70,000 Baseline Without Congestion
$60,000
$50,000
$40,000
$30,000
$20,000
$10,000
$
1990 1991 1992 1993 1994 1995 1996 1997 1998 1999 2000 2001 2002 2003 2004 2005 2006 2007 2008 2009 2010 2011
Year
Source: US Census Bureau
Analysis by CPAC
Figure 16 shows Hollister total personal income (TPI) in 2001 dollars, again in accordance with
Census definition of income. TPI serves as an indication of the size of the local economy, vs.
PCI is an indication of growing well-being of individuals. Hollister TPI 2000 increased by 61
percent over its 1990 level. In baseline with congestion, Hollister TPI is growing through the
projection period at an average rate of 3.1 percent annually. This growth is the result of the
growth in both population and real per capita income in the City. For the baseline without
congestion, Hollister TPI is growing at an average annual rate of 4.8 percent. In 2011, TPI in
scenario 2 is expected to exceed baseline with congestion by about $3,940 thousand, in
contrast to $8,475 thousand in scenario 1.
2001 City of Hollister Baseline and Scenarios 27Services in the City of Hollister are funded primarily through sales tax revenues, which comprised
over 46 percent of total City revenues (in year 2001). Because of their direct link to the city
financial statement, knowing the levels of total taxable retail sales and assessed property values
in the city can play an important role in the planning process.
Figure 17. City of Hollister
Assessed Property Values (in 2001 Dollars), 1987-2011
50,000,000
Baseline With Congestion
45,000,000
Scenario 1
Scenario 2
40,000,000
Baseline Without Congestion
Assessed Property Value
35,000,000
30,000,000
25,000,000
20,000,000
15,000,000
10,000,000
5,000,000
-
1987 1988 1989 1990 1991 1992 1993 1994 1995 1996 1997 1998 1999 2000 2001 2002 2003 2004 2005 2006 2007 2008 2009 2010 2011
Year
Note: Data up to 2002 is actual.
Source: Taney County Clerk and Missouri State Auditor's Office
Analysis by CPAC
Figure 17 represents the value of assessed real and personal property in the City. Note that
assessed property value for 2002 came from Taney County Clerk and is therefore, the actual
number expressed in 2001 dollars. Between 1993 and 1995, assessed property value in the
City increased by about 58 percent, reflecting the Branson boom. Note that property values for
1991 and 1992 were somewhat smaller (in real terms) than the corresponding 1987 value. If we
were to consider nominal terms, the assessed value in the City was still increasing during this
time period, but not enough to offset the inflation rate. The same is true for the years 2000 and
2001: in nominal terms, 2001 values were somewhat bigger than 2000 values, but 2000 values
expressed in 2001 dollars exceeded 2001 values. Between 1995 and 2002, property values
grew on average by almost 4 percent annually. For the baseline with congestion, assessed
property value is expected to increase by 3.7 percent annually between 2001 and 2011. The
increased valuation is projected as if the reassessment were to take place each year. Actual
assessed valuation will vary according to the assessment process. Property reassessment in
Hollister takes place every two years. For the baseline without congestion, Hollister assessed
property values are growing at an average annual rate of almost 4.8 percent. In 2011,
assessed property values in scenario 2 are expected to exceed baseline with congestion by
about $3,235 thousands, in contrast to $5,556 thousands in scenario 1.
The Community Policy Analysis Center 28Figure 18. City of Hollister
Taxable Retail Sales (in 2001 Dollars), 1990-2011
100,000,000
Baseline With Congestion
Scenario 1
90,000,000
Scenario 2
Baseline Without Congestion
80,000,000
70,000,000
Retail Sales
60,000,000
50,000,000
40,000,000
30,000,000
20,000,000
1990 1991 1992 1993 1994 1995 1996 1997 1998 1999 2000 2001 2002 2003 2004 2005 2006 2007 2008 2009 2010 2011
Year
Source: Missouri Department of Revenue
Analysis by CPAC
Figure 18 represents the actual and anticipated levels of taxable retail sales15 in the City of
Hollister, measured in 2001 dollars. As evident from the chart, retail sales are highly volatile
over time. Retail sales declined throughout Missouri during the economic recession in the early
1990s. This explains why Hollister 1990 and 1991 sales (in 2001 dollars) were virtually the
same. In general, the growth of retail sales in Missouri is highly correlated with growth in
personal income. However, this correlation is affected by the business cycle. During the 1992
recession, for example, Missouri retail sales declined faster than total personal income,
whereas, during economic upturns, retail sales have grown much faster than personal income.
This observation suggests that local governments have a challenge in balancing their budgets
during economic downturns. It also suggests that retail centers can take certain advantage of
these fluctuations during economic boom by expanding/diversifying their retail operations, but
will have to be wary of potential losses as the economy slows down.
An increase in retail sales between 1991 and 1994 reflects, among other things, Branson boom.
In fact, in 1994, City retail sales were approximately 70 percent higher than their 1991 level.
There was a 62 percent retail sales increase from 2000 to 2001. According to the Panel, the
high level of sales attained in 2001 can be attributed to Lowe’s coming into operation in
15
According to Missouri statute Chapter 144, RSMo 1986 and 1993 Supplement, sales taxes in Missouri
must be paid on the gross receipts of tangible personal property, admission to entertainment and athletic
events, utilities, restaurant meals, hotel accommodations, and rental of tangible personal property. There
are three major categories exempt from paying or charging sales taxes. First, non-profit or governmental
organizations do not pay any sales tax on items that are otherwise considered taxable. Second,
businesses that purchase retail items for further resale are also exempt from paying sales tax. Finally,
sales tax may not be charged on selected services and commodities, such as medical services, vehicle
repair, and household maintenance and repair.
2001 City of Hollister Baseline and Scenarios 29You can also read