2 degrees of separation - Transition risk for oil and gas in a low carbon world - arbon Tracker
←
→
Page content transcription
If your browser does not render page correctly, please read the page content below

arbon Tracker
          Initiative

2 degrees of separation

  Transition risk for oil and gas
          in a low carbon world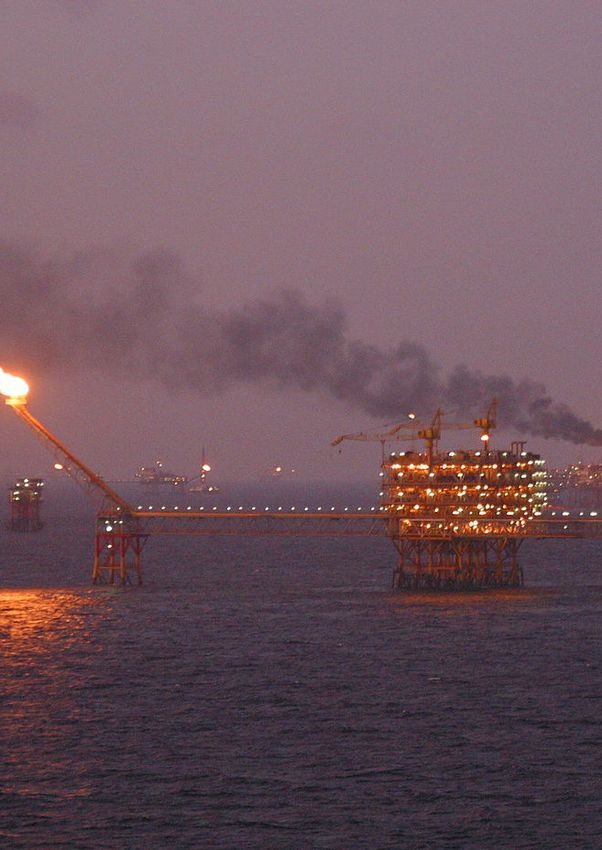
Acknowledgements

This report was authored by James Leaton, Research Director, and Andrew Grant,
Senior Analyst, of Carbon Tracker. We are grateful for the contributions of our
partners:

•    Martin Skancke, Chair, PRI, Board member, Storebrand and Member, TCFD
•    Pelle Pedersen, PKA
•    Charlotta Dawidowski Sydstrand, AP7
•    Mickaël Hellier, Fonds de réserve pour les retraites (FRR)
•    Pieter van Stijn, PGGM
•    Meryam Omi, Legal & General Investment Management

Thanks are also due to our colleagues for reviews and comments:

PRI: Fiona Reynolds, Nathan Fabian, Paul Chandler, Valeria Piani, Olivia Watson,
Carol Jeppesen, Ben Pincombe.

Carbon Tracker: Mark Fulton, Sam Catalano, Stefano Ambrogi

We are grateful for the support of the KR Foundation in producing this analysis.

Designed and typeset by Margherita Gagliardi, Carbon Tracker

Cover Photo: by Surajseo, via Wikimedia Commons
Contents

     Executive Summary                        5

1.   Introduction                             12

2.   Scenario analysis – degrees of warming   15

3.   Carbon supply cost curves                19

4.   2D capex pathway
                                              23
5.   Company and project exposure
                                              26
6.   NPV sensitivity
                                              32

Executive Summary

Carbon budget alignment:                              Excess capex
company by company

                                                      The analysis shows that:
This new analysis provides a way of
understanding whether the supply options              •   US$2.3trn – around one third – of
of the largest publicly traded oil and gas                potential capex to 2025 should not be
producers are aligned with demand levels                  deployed in a 2D scenario compared
consistent with a 2 degree Celsius (2D)                   to business as usual expectations.
carbon budget. By allocating the carbon               •   Company level exposure varies
budget to potential oil and gas projects,                 from under 10% to over 60% when
through applying the economic logic of a                  considering the largest 69 publicly
carbon supply cost curve, it is possible to               traded companies.
identify which companies have the highest             •   Around two thirds of the potential oil
exposure to potential capital expenditure                 and gas production which is surplus
(capex) to 2025. This report provides a                   to requirements in a 2D scenario is
snapshot of the potentially unneeded capex                controlled by the private sector.
spend for 69 global oil and gas companies
– highlighting for the first time, the wide-
ranging degree of exposure amongst
companies in the sector.

Projected capex under 2D scenario

                                               Year

Source: Rystad Energy, CTI analysis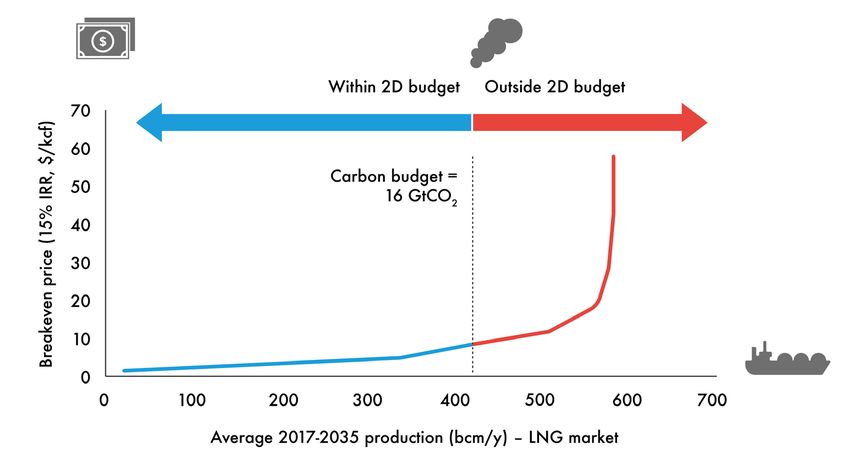
On the rebound?                            Identifying the potential winners
                                           and losers

Capital expenditure has dropped
in recent years as a response to the       This analysis focuses on the metric:
lower oil price. In order to align with    “percentage of potential capex outside
a 2D scenario, the level of capital        2D budget”. This can effectively give
deployment should not rebound from         investors a sense of what proportion of
2016 levels across the industry as         the company’s investment plans may
a whole. Under a business as usual         fail to deliver an acceptable return in
scenario, with rising prices, investment   the scenario of a world limited to 2°C
ramps up again. This would create          global warming outcome (i.e. which
financial exposure to projects not         project capex is within budget and
consistent with peaking emissions in the   which is “unneeded”). This can be
near future.                               interpreted in different ways according
                                           to investment strategies and policies.
2D scenario                                In terms of risk management, some
                                           investors may prefer a degree of
                                           optionality – but the higher the level
This analysis utilises the oil and gas     of unneeded capex, the more growth
demand levels indicated by the             strategies would have to be tempered.
International Energy Agency’s (IEA)        For investors seeking to align with
World Energy Outlook 2016 450              a 2D scenario, it is clear that some
scenario as a proxy for a 2D scenario.     companies are better positioned than
For the period 2017-2035, this equates     others.
to a total carbon budget for oil and gas
of 320Gt of CO2, split 59% for oil and
41% for gas. This is at the higher end
of the range of carbon budgets that
could be applied, as it only provides
a 50% probability of a 2D outcome. If
one were to try and align with limiting
global warming to below 2D, or apply
a higher likelihood of the outcome
then this would provide an even tighter
constraint on future oil and gas supply
and demand.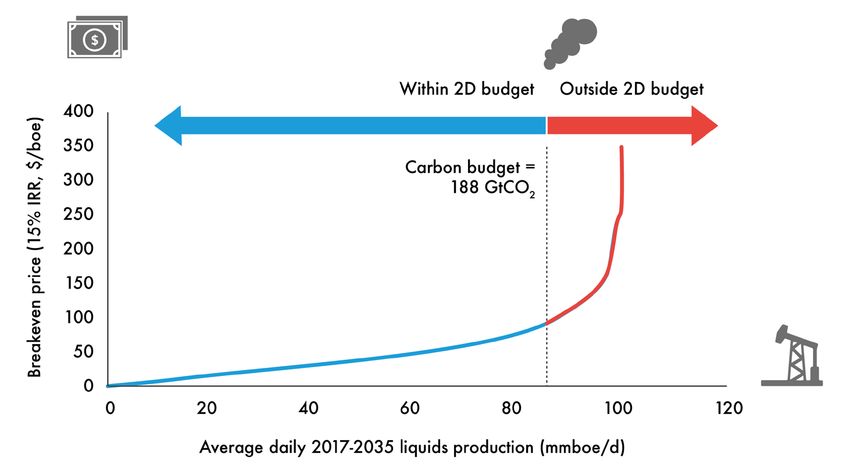
Table 1: Companies’ potential upstream capex outside the 2D budget

 Company                       Country of      % of upstream     2017-     Potential
                               headquarters    capex outside     2035      CO2
                                               2D budget         carbon    outside
                                                                 budget    2D
                                               (% band)                    carbon
                                                                 (GtCO2)   budget

                                                                           (GtCO2)

 Southwestern Energy           United States      60% - 70%      1.0       0.6

 Apache                        United States      60% - 70%      1.1       1.0

 Cabot Oil and Gas             United States      50% - 60%      0.6       0.4

 Energen                       United States      50% - 60%      0.2       0.1

 Murphy Oil                    United States      50% - 60%      0.4       0.3

 Concho Resources              United States      50% - 60%      0.4       0.3

 Imperial Oil (Public traded   Canada             50% - 60%      0.4       0.2
 part)
 Vermilion Energy              Canada             50% - 60%      0.1       0.1

 Oil Search                    Papua New          50% - 60%      0.2       0.1
                               Guinea
 Encana                        Canada             50% - 60%      1.0       0.6

 Chesapeake                    United States      40% - 50%      1.8       1.2

 Inpex                         Japan              40% - 50%      1.4       0.3

 ExxonMobil                    United States      40% - 50%      8.6       3.1

 Husky Energy                  Canada             40% - 50%      0.9       0.3

 Woodside                      Australia          40% - 50%      0.7       0.3

 Suncor Energy                 Canada             40% - 50%      2.3       0.4

 EQT Corporation               United States      30% - 40%      1.2       0.4

 Devon Energy                  United States      30% - 40%      1.6       0.5

 Chevron                       United States      30% - 40%      6.4       2.0

 Eni                           Italy              30% - 40%      4.6       1.1

 Shell                         Netherlands        30% - 40%      9.9       2.7

June 2017                                                                              7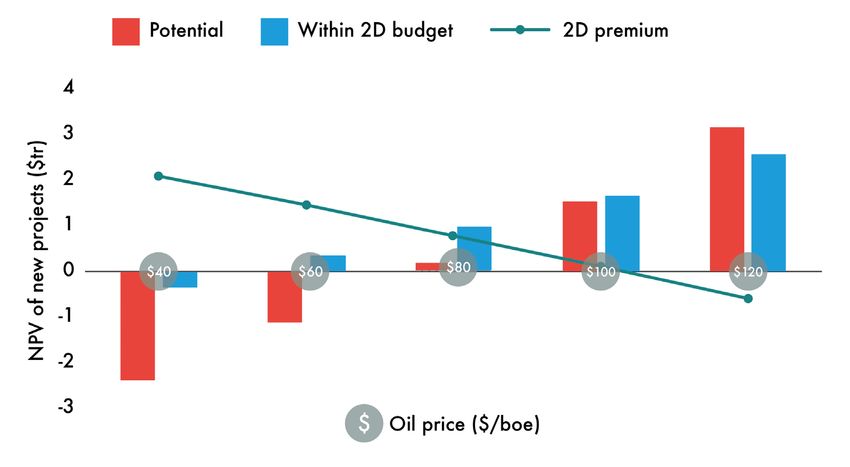
Company                      Country of       % of upstream   2017-         Potential
                                 headquarters     capex outside   2035          CO2
                                                  2D budget       carbon        outside
                                                                  budget        2D
                                                  (% band)                      carbon
                                                                  (GtCO2)       budget

                                                                                (GtCO2)

    Galp Energia SA              Portugal            30% - 40%    0.3           0.1

    Canadian Natural Resources   Canada              30% - 40%    2.0           0.5

    Noble Energy                 United States       30% - 40%    1.3           0.6

    Repsol                       Spain               30% - 40%    1.8           0.3

    Newfield Exploration         United States       30% - 40%    0.4           0.2

    Total                        France              30% - 40%    6.3           1.2

    Crescent Point Energy        Canada              30% - 40%    0.2           0.1

    Hess                         United States       30% - 40%    0.8           0.2

    Origin Energy                Australia           30% - 40%    0.3           0.1

    Rosneft                      Russia              30% - 40%    9.5           1.3

    Continental Resources        United States       20% - 30%    0.7           0.3

    Anadarko                     United States       20% - 30%    2.5           0.6

    Cimarex Energy               United States       20% - 30%    0.7           0.1

    Occidental Petroleum         United States       20% - 30%    1.6           0.5

    BP                           United Kingdom      20% - 30%    6.5           1.5

    Lukoil                       Russia              20% - 30%    5.0           0.5

    PetroChina                   China               20% - 30%    9.6           0.7

    ConocoPhillips               United States       20% - 30%    3.8           0.8

    EOG Resources                United States       20% - 30%    2.3           0.6

    CNOOC                        China               20% - 30%    2.9           0.5

    Gazprom                      Russia              20% - 30%    17.8          2.0

    Santos                       Australia           20% - 30%    0.4           0.1

    Statoil                      Norway              20% - 30%    4.3           0.6

    Rice Energy                  United States       20% - 30%    0.7           0.1

    RSP Permian                  United States       10% - 20%    0.4           0.1

8                                                                        2 degrees of separation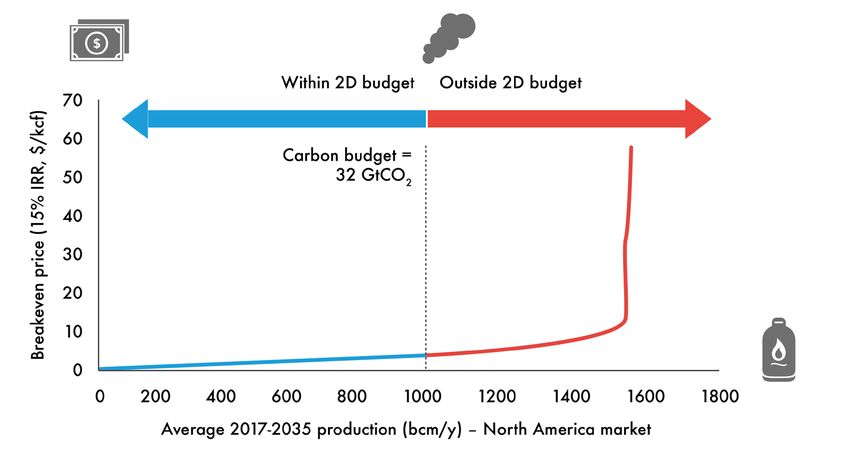
Company                          Country of       % of upstream   2017-     Potential
                                  headquarters     capex outside   2035      CO2
                                                   2D budget       carbon    outside
                                                                   budget    2D
                                                   (% band)                  carbon
                                                                   (GtCO2)   budget

                                                                             (GtCO2)

 Marathon Oil                     United States       10% - 20%    1.1       0.2

 OMV                              Austria             10% - 20%    0.5       0.1

 QEP Resources                    United States       10% - 20%    0.4       0.1

 Cenovus Energy                   Canada              10% - 20%    0.9       0.1

 Tullow Oil                       United Kingdom      10% - 20%    0.3       0.0

 Parsley Energy                   United States       10% - 20%    0.2       0.0

 Ecopetrol                        Colombia            10% - 20%    0.8       0.1

 Lundin Petroleum                 Sweden              10% - 20%    0.3       0.0

 Sinopec                          China               10% - 20%    2.3       0.2

 Pioneer Natural Resources        United States       0% - 10%     1.8       0.2

 Peyto                            Canada              0% - 10%     0.3       0.1

 Petrobras                        Brazil              0% - 10%     5.9       0.4

 Surgutneftegas                   Russia              0% - 10%     2.0       0.0

 Tatneft                          Russia              0% - 10%     1.1       0.0

 Range Resources                  United States       0% - 10%     2.0       0.0

 Saudi Aramco                     Saudi Arabia        0% - 10%     30.2      0.4

 Novatek                          Russia              0% - 10%     2.8       0.1

 Arc Resources                    Canada              0% - 10%     0.5       0.0

 Gulfport Energy                  United States       0% - 10%     0.8       0.0

 Tourmaline Oil                   Canada              0% - 10%     1.0       0.0

 Diamondback Energy               United States       0% - 10%     0.4       0.0

 Antero Resources                 United States       0% - 10%     1.3       0.0

 Seven Generations Energy         Canada              0% - 10%     0.7       0.0

Source: Rystad Energy, CTI analysis

June 2017                                                                                9
A moving feast Private sector supply more
exposed
This analysis provides a snapshot
of the industry at the start of 2017 Around two thirds of the potential oil
using relative project economics to and gas production which is surplus
determine which projects are included to requirements in a 2D scenario
in different scenarios. There has is controlled by the private sector,
been significant movement in terms demonstrating how the risk is skewed
of both the overall cost curve, and towards listed companies rather than
the relative positions in the 18 months national oil companies. The significance
since the last Carbon Tracker review of the large companies and the
of the global oil and gas sector. This products they produce is also evident
reflects overall downward pressure on from the analysis. The carbon budget
costs in response to the oil price, as that the production of an oil major will
well as shifts by certain regions. The use up to 2035 is equivalent to the
changing dynamics between OPEC recommended carbon budget for the
producers and the US shale industry whole of the UK for a similar period.
have provided a novel backdrop to this
picture. Increased standardisation and
efficiency of US shale operations have Increased transparency required
seen major cost declines, and resource
expectations have been upgraded.
The fall in oil price has also hit some Oil and gas companies have options
hydrocarbon exporting nations hard, in terms of which new projects they
affecting foreign exchanges rates. plan to develop in the future. At
This demonstrates why it is important present there is little transparency
for companies to provide regular of these strategies, making it difficult
information on how their strategy is for investors to understand and test
adapting to the changing context, as the degree of alignment with a 2D
well as aligning with a 2D scenario. scenario. Companies may have already
decided to put a number of high cost
projects on hold, but more can be done
to tell this story to their shareholders.
10 2 degrees of separationExxonMobil shareholders signal Taskforce on Climate-related
demand for scenario analysis Financial Disclosures (TCFD)
provides reference point
The energy transition is upon us,
and across the financial system from The Financial Stability Board’s (FSB)
pension funds to regulators, increasing TCFD recommendations recognise
scrutiny of the alignment of carbon the value of 2D scenario analyses,
intensive companies with a low carbon and particularly highlight disclosure
future is evident. The May 2017 of 2D reference scenario tests as one
shareholder resolution at ExxonMobil of the key ways to improve and help
calling for management to produce a standardise company reporting around
report detailing the implications of a future climate risks. While such tests are
2D scenario for the company received increasingly common amongst larger
62% support. This, along with similar oil and gas companies, this research
results at other oil and gas companies’ also proves that it is possible even
AGMs, signals that the majority of for small organisations to produce an
investors in the world’s biggest fossil analysis of relative positioning under a
fuel producers see value in having this 2D reference scenario. With a number
information. of investment institutions and companies
already committed to following the final
recommendations, the impetus for those
left to follow suit is clear.
Photo:
June Oil
2017rig offshore Vungtau, via Wikimedia Commons 111. Introduction The speed and scale of the energy This research has been developed transition is becoming more obvious in response to investor demand for every day, causing more investors understanding company level exposure to accept the need to improve their to the energy transition. Many large strategies to be well positioned as pension funds, insurance companies structural changes in the energy and asset managers are looking at and related sectors occur. Whilst climate risk with greater scrutiny, which full transformation may take time, is reflected the interest seen by both the unanticipated changes in the supply- UN-supported Principles for Responsible demand relationship can have material Investment (PRI) from its signatories and impacts in the short term. The markets Carbon Tracker from the investors it are showing that even relatively small works with. shifts in market share, (e.g. US coal power generation), or market size, (e.g. global oil oversupply), can have material impacts on financial performance. 12 Photo: New York City’s financial district, by Benoît Prieur, via Wikimedia Commons
Climate change momentum has led
to a number of investor-led initiatives,    “The robustness of a
including:                                  firm’s strategy and
                                            targets could be further
•     Carbon Asset Risk and Aiming for      illuminated through scenario
      A resolutions;                        analysis. For investors to price
•     the Montréal Carbon Pledge;           financial risks and opportunities
•     the Portfolio Decarbonisation         correctly, they need to weigh
      Coalition;                            firms’ strategies against plausible
•     the Transition Pathways Initiative.   public policy developments,
                                            technological advances, and
The range of approaches reflects            evolving physical risks.”
the different investment strategies
and prevailing investment cultures on       Mark Carney, Governor of the Bank of
different continents.                       England, September 2016.

The focus on transition risk has been
crystallised by the FSB TCFD. The           The recommendations of the taskforce
taskforce has outlined how scenario         will start to feed through to company
analysis is a useful tool for regulators,   disclosures, with several companies
financial institutions and non-financial    already committing to implementing
companies to understand energy              them going forward. This analysis
transition risk, and the increasing         demonstrates how feasible it is to apply
expectations around disclosure of this      this kind of simple scenario analysis to
analysis.                                   produce decision useful information on
                                            the oil and gas sector, and reflects the
                                            kind of disclosure starting to be seen
                                            from leading companies.

                                            In response to these developments,
                                            this new analysis has been developed
                                            to provide indicators of company
                                            exposure to the low-carbon transition.
                                            The approach of building up
                                            understanding of asset level data and
                                            integrating the relative economics
                                            of production options provides
                                            analysis which reflects how energy
                                            markets work, going beyond blanket
                                            approaches to allocating the carbon
                                            budget across an entire sector.

June 2017                                                                            13
The numbers – focus on future Oil is treated as a single global market
production options as there is sufficient trading to justify
that; gas is split up into global liquefied
natural gas (LNG), Europe and North
Since demonstrating the vast overhang America, on top of other domestic
of coal, oil and gas in the ground markets. A single industry database
compared to a carbon budget to (Rystad Energy UCube) is used to
limit global warming to two degrees, provide the relative costs of production.
Carbon Tracker has developed forward- Any company may debate the precise
looking indicators to understand the levels of a specific project, but costs are
implications for individual companies. not generally available otherwise and
One of the most frequent reactions would not necessarily be on a consistent
from investors is to ask who the winners objective basis. Supply costs change
and losers are under such a scenario. over time and the analysis would have
Whilst simple reserve and resources to be updated to understand how the
numbers across all fossil fuels answered positioning of a company’s portfolio of
the macro question of whether there projects is changing going forward.
was exposure to unburnable carbon, a
more sophisticated approach looking The costs of any particular project
at production profiles is required to may change due to a range of factors,
differentiate at a company level. including efforts to reduce cost by the
operator through improved design,
Carbon supply cost curves or the level of activity in the sector
inflating or deflating contractor and
equipment costs. Particular regions
In order to try and allocate the carbon or technologies may also progress
budget at a company level, Carbon relative to others. For example, the
Tracker developed the carbon supply standardisation of drilling technology
cost curve approach. First this requires has contributed towards reduced
splitting up the fossil fuels as each costs, especially in US shale, largely
has its own regional markets, primary in response to the lower oil price seen
uses, and differing greenhouse gas in recent years. For economies heavily
intensities. Not to mention that the reliant on hydrocarbon industries,
financial position of coal, oil and gas (e.g. Venezuela, Russia), the change
producers is clearly not the same. For in oil price has also impacted currency
each main market for each fuel, all the valuations, which has affected the
potential supply options are lined up position on the cost curve when
in cost order and a demand intersect converted to US$. The exposure of
consistent with the scenario being companies to excess capex in a 2D
analysed is applied. The economic logic scenario will also change as they
applied is that the most competitive sell and acquire interests in projects,
supply sources will be produced to meet undertake M&A activity at the
demand, based on the relative costs of corporate level, and explore for new
the projects. The full methodology is discoveries.
explained in an accompanying paper.1
1. Available at http://2degreeseparation.com
14 2 degrees of separation2. Scenario analysis – degrees of warming 2D reference scenario The International Energy Agency’s (IEA) 450 scenario has been used as the 2D demand scenario, as detailed in the World Energy Outlook 2016 (WEO)2. The 450 scenario is consistent with a 50% chance of delivering a 2°C global warming outcome, which is then worked back to estimate a demand scenario with this result3. From a climate perspective, this is not great odds of achieving this outcome, therefore the scenario should be viewed at the generous end in terms of the levels of fossil fuel demand it accommodates. Demand is taken from the latest IEA scenarios on a fuel-by-fuel basis, and by region. The 450 scenario is then compared to a business as usual scenario, which reflects identified base case potential supply in the database used. At a macro level, this is slightly higher than the IEA New Policies Scenario (NPS). As indicated by the TCFD, applying a consistent comparable 2D scenario enables investors to understand the relative exposure of companies within a portfolio. This does not prevent companies or other stakeholders from providing analysis of other scenarios they believe are more likely or more desirable. Paris-related scenarios The UNFCCC Conference of the Parties (COP) in Paris at the end of 2015 brought a focus on a range of outcomes either side of the 2D scenario, including the Nationally Determined Contributions (NDCs). These plans, which focus on commitments by individual countries for 2020-30, are currently not sufficient to achieve the 2D scenario, but could be ratcheted up in review phases. The NPS is the IEA’s modelling outcome of where the world is currently headed, and takes into account the NDCs. The IEA NPS results in a carbon budget which is equivalent to a 50% likelihood of limiting anthropogenic warming to around 2.7°C. It is worth remembering that the IEA scenarios are updated each year and the latest NPS would not present much of a test compared to current industry plans where they already largely reflect the current policy environment. Trying to identify the gap between industry plans and NPS is of limited value. 2. IEA World Energy Outlook, published November 2016. See http://www.worldenergyoutlook.org/ publications/weo-2016/ 3. The Task Force on Climate-Related Financial Disclosures included a brief summary of key assumptions in the 450 scenario, alongside other scenarios, in its recent technical supplement “The Use of Scenario Analysis in Disclosure of Climate-Related Risks and Opportunities”. See https://www.fsb-tcfd.org/wp-content/ uploads/2016/11/TCFD-Technical-Supplement-A4-14-Dec-2016.pdf p18-20 June 2017 15
Many investors are also aware of the wording from the UNFCCC Paris COP
regarding limiting anthropogenic warming to “well below 2°C”, and pursuing efforts
to “limit the temperature increase to 1.5°C”. These kinds of scenarios would present
a very strict carbon budget requiring instant and drastic action to curtail emissions
and keep fossil fuels in the ground. The IEA and IRENA highlighted some of the
challenges to achieving an outcome below two degrees of warming in a recent
analysis.4 There are limited details on the implications of a 1.5°C scenario for fossil
fuel demand, therefore it is not currently possible to analyse in the same way as the
IEA 450 scenario. The latest IEA Energy Technology Perspectives 2017 has produced
a scenario which delivers a 50% probability of 1.75 degrees of warming which
could be used as the basis for future analysis.

Scenarios are often misrepresented. Ultimately they are one version of the future,
not a prediction or forecast. Use of a particular scenario does not mean that an
organisation thinks it is the most likely or that it agrees with all of the underlying
assumptions. Practically speaking, to conduct this analysis, there are very few
publicly available scenarios that provide the detail on fossil fuel demand necessary
to model the supply requirements. The IEA scenario provides a feasible reference
point which is accepted by the industry. The most advanced companies already
produce a range of scenarios to inform their thinking, and the reference scenario is
not intended to limit or discourage companies going beyond it.

The carbon budget

In order to allocate the carbon budget from a given scenario to the company level,
it is necessary to apply a timeframe. Oil and gas carbon budgets are derived from
the 2016 IEA 450 scenario for the period 2017-2035. This is then correlated with
the equivalent amount of oil and gas production over this period and the amount
of capex that would be required through 2025 to deliver this supply. Considering
production and it’s timing, rather than just reserves data, is essential to calculating
the potential impact on revenues if investors wish to integrate this thinking into Net
Present Value (NPV) sensitivity tests, as demonstrated later in this report.

The oil and gas carbon budget to 2035 for CO2 emissions based on the IEA 450
scenario is 320 GtCO2 split 59% for oil and 41% for gas. This amount of production
is then compared to the business as usual scenario from the industry database to
understand how much potential production and capital expenditure is excess to
requirements in this scenario. It should be noted that not all of the surplus projects
will have been granted a final investment decision or are certain to go ahead at this
stage. In fact, this is the benefit of this scenario analysis – there is still time to review
these decisions and for shareholders to engage on the capital expenditure plans of
the company. For those companies that have already decided to align with a lower
demand outlook, they can confirm that they have taken those options off the table.
At present there is relatively little information about the status of different projects
available for investors.
4. IEA & IRENA, “Perspectives for the Energy Transition”, March 2017
Available at http://www.irena.org/DocumentDownloads/Publications/Perspectives_for_the_Energy_
Transition_2017.pdf

16                                                                                2 degrees of separation
The overhang of potential emissions from business-as-usual oil and gas use which
exceeds the IEA 450 carbon budget to 2035 is as follows:

                                     Within budget        Potential outside   Total
                                     (GtCO2)              budget (GtCO2)      (GtCO2)

             Oil                     188                  32                  220

             Gas                     132                  29                  160

             Total                   320                  61                  380

            Note: totals may not add up due to rounding
            Source: Rystad Energy, CTI analysis

This means that under the business as usual scenario the oil and gas industry would
produce enough oil and gas to result in 380 GtCO2 by 2035.

2D pathway for oil and gas production

The chart below gives an indication of how the total volumes of oil and gas
consistent with the 2D scenario might be produced over the period to 2035 based
on the base case timings of the projects within the 2D budget in our data. The annual
production level of oil and gas combined is fairly consistent with today’s levels, but
with an increasing share of gas over time. This is obviously a significant deviation
from the continued growth expected in industry business-as-usual scenarios. However
in the IEA 450 scenario oil and gas consumption does not disappear overnight as
further supply is needed to meet demand. If a stricter budget were applied, then
obviously less new production would be needed. The scenario sees a shift in the oil/
gas mix from a 60:40 split to a more even distribution by the end of the period. This
equates to a fall in oil production and growth in gas production.

June 2017                                                                               17
Figure 1: Potential production pathway
Year
Source: Rystad Energy, CTI analysis
This production profile is indicative, being based on the aggregate production
required to meet demand in the IEA 450 Scenario over the period 2017-2035,
rather than the actual pathways for oil & gas demand in the scenario. The base case
timings of the projects within the 2D budget are used to calculate the chart, hence it
will not match fossil fuel supply in the 450 Scenario on a year by year basis.
18 2 degrees of separation3. Carbon supply cost curves To supply these levels of oil and gas, the most economic projects are selected – i.e. those on the left-hand side of the cost curve ordered by breakeven price. This leaves the highest cost options as those that would not need to proceed under a 2D scenario, assuming economic logic plays out. The breakeven price is the oil or gas price required to give a NPV of zero for each asset using a given discount rate or internal rate of return (IRR). In this case, we have used an IRR of 15%, illustrative of the minimum target return we see as being satisfactory for sanction given risks such as cost overruns, etc. Global oil production is plotted on a single supply curve. Natural gas supply is split into regional markets – Europe, North America and global LNG. This means that the approach attempts to more closely replicate the regional allocation of the carbon budget, which will give a different result to combining all gas globally on the same cost curve. Domestic gas markets are assumed unchanged in a 2D scenario and account for 75 GtCO2. Oil carbon supply cost curve Source: Rystad Energy, CTI analysis As a global market, the oil supply cost curve incorporates a wide range of different types of resource with different supply costs and different CO2 intensities. The high- cost projects are also typically the highest carbon, for example new oil sands or some deepwater projects. June 2017 19
LNG carbon supply cost curve

Source: Rystad Energy, CTI analysis

Tight LNG markets and high pricing post-Fukushima encouraged over-investment
in LNG liquefaction capacity, resulting in sharply lower prices for seaborne gas.
Despite growth in demand, the market is generally expected to be oversupplied until
the early to mid-2020s, and this overhang can be seen in the unneeded portion of
supply. The weakness seen in gas prices has not incentivised further investment in
new capacity, and has already resulted in some existing assets taking impairments.
As well as typically being higher cost than other sources of gas, LNG is higher
carbon due to the greater energy required to liquefy and transport it.

20                                                                 2 degrees of separation
North American gas carbon supply cost curve

Source: Rystad Energy, CTI analysis

Increased production of North American gas has resulted in low prices and a
favourable competitive position against coal, driving increased power sector use and
lowering CO2 emissions. Lower levels of activity have reduced sub-contracting and
supply chain costs, which will rise again if drilling ramps up materially strengthening
the position of service providers. The efficiency gains and standardisation of drilling
techniques provide a more permanent element to reduction in costs. These effects
combine to move the whole cost curve down over the last couple of years. However,
the resulting resource upgrades mean that there is also a significant proportion that
is outside the 2D budget, even though supply costs are relatively low through much
of the curve.

June 2017                                                                            21
European gas supply cost curve

Source: Rystad Energy, CTI analysis

Gas for the European market is mostly needed despite weak energy demand –
UK North Sea production has peaked, Norway is unlikely to have much scope to
expand production significantly, and geological concerns have led to the imposition
of increasingly strict quotas on production from the giant Groningen field in the
Netherlands. Shale production remains something of an unknown, but the US’s
success is unlikely to be repeated given more challenging sub-surface conditions and
a range of social and environmental concerns, amongst other factors.

22                                                                  2 degrees of separation
4. 2D capex pathway

Having calculated the oil and gas production associated with a 2D scenario, we can
then identify the level of capital expenditure required, and the delta to business-as-
usual, (BAU). The drop in the oil price since 2014 has curtailed capex spending from
the boom times when oil prices sat above US$100/bbl. The 2D pathway would see
spending need to be kept down around the current level, rather than rebounding to
previous levels.

It is worth noting that capex is always required just to maintain current levels of
production due to the naturally declining production rates of oil and gas wells – the
exception being some oil sands projects which have a more consistent production
level due to the different production techniques used. As cheaper options are
used up new projects being brought on will typically be higher cost, meaning that
the investment per barrel of new production keeps increasing in the long term.
Underneath, longer term trends are also the cyclical movements relating to cost
deflation/inflation which are caused by the prevailing level of investment activity and
degree of price pressure. The recent lower oil price levels have driven a round of
cost-cutting and reduced demand and prices for oil and gas service industries.

Figure 2: Potential capex pathway

                                          Year

Source: Rystad Energy, CTI analysis

June 2017                                                                             23
Capex
For capex, the analysis considers the related investment out to 2025 that
corresponds with the level of production in the scenario.
Oil
Looking across the whole of the oil sector, including both listed and unlisted
companies, 33% of business-as-usual oil capex does not need to be spent in the
2D scenario. There is obviously a range of percentages in terms of company level
exposure – with some companies having capex plans entirely within the 2D budget
and others being largely not needed in a 2D scenario.
Capex ($tr) Oil
Within 2D budget $3.2
Not needed $1.6
Total $4.8
Source: Rystad Energy, CTI analysis
Gas
In total, 31% of business-as-usual gas capex is not needed in the 2D scenario –
similar to the overall oil level. Domestic gas markets are assumed to continue to
supply to meet demand. For the regional markets, 60% LNG, 60% North America,
and 37% European capex is surplus to requirements to 2025 in a 2D scenario. This
challenges the growth plans of operators in these markets.
North
Capex ($tr) LNG Europe Other Total
America
Within 2D budget $0.2 $0.2 $0.2 $1.0 $1.6
Not needed $0.2 $0.4 $0.1 $0.0 $0.7
Total $0.4 $0.6 $0.4 $1.0 $2.4
Note: totals may not add up due to rounding
Source: Rystad Energy, CTI analysis
24 2 degrees of separationExposure across different types of company
The table below indicates that around 60% of the potential capex and production
that is not consistent with a 2D scenario is associated with companies in the private
sector. The quarter of production that has state ownership also includes INOCs
(International National Oil Companies – NOCs that have greater geographic reach)
– many of which have partial listings, eg Statoil, Petrobras. Therefore there is still
some capital markets exposure to these projects, even if the potential for influence is
diminished. This shows that whilst NOCs have a big role in oil and gas production,
they are less at risk under a lower demand scenario.
2017-2035 production 2017-2025 capex
(mmboe/d) ($tr)
Needed Not needed Needed Not needed
NOC 55 4 1.2 0.3
INOC 25 3 0.9 0.3
Major 21 6 0.7 0.4
Integrated 11 2 0.4 0.1
E&P Company 8 4 0.4 0.3
Independent 18 5 0.7 0.3
Exploration Company 1 1 0.1 0.1
Industrial 3 1 0.1 0.1
Investor 1 0 0.0 0.0
Operating Company 0 0 0.0 0.0
Unknown 0 0 0.0 0.0
Unspecific (Other/Open/ 5 3 0.3 0.4
Relinquished)
Total 147 28 4.9 2.3
NOC+INOC 79 6 2.1 0.6
Private sector 64 19 2.4 1.4
NOC+INOC % of total 54% 23% 44% 24%
Private sector % of total 43% 68% 50% 59%
Source: Rystad Energy, CTI analysis
Note – unknown and unspecific not allocated to either NOC+INOCs or private sector
June 2017 255. Company and
project exposure
Exposure to capex outside the 2D budget varies widely throughout the curve.
Companies that have a lower percentage of unneeded capex can be seen as more
aligned with a 2D budget; companies with a greater percentage of unneeded capex
warrant further attention from investors. Further disclosure could be requested to
explain how the company is attempting to be more “future proof” by expressly
cancelling or selling high-cost projects, or reconsidering its business model entirely.
For a sample universe of companies5, the percentage of total potential capex that
is outside the 2D budget is shown below. Percentage of upstream capex has been
arranged into bands, with companies with more than a third of capex outside of 2D
having higher than average exposure.
Company Country of % of upstream 2017- Potential
headquarters capex outside 2035 CO2
2D budget carbon outside
budget 2D
(% band) carbon
(GtCO2) budget
(GtCO2)
Southwestern Energy United States 60% - 70% 1.0 0.6
Apache United States 60% - 70% 1.1 1.0
Cabot Oil and Gas United States 50% - 60% 0.6 0.4
Energen United States 50% - 60% 0.2 0.1
Murphy Oil United States 50% - 60% 0.4 0.3
Concho Resources United States 50% - 60% 0.4 0.3
Imperial Oil (Public traded Canada 50% - 60% 0.4 0.2
part)
Vermilion Energy Canada 50% - 60% 0.1 0.1
Oil Search Papua New 50% - 60% 0.2 0.1
Guinea
Encana Canada 50% - 60% 1.0 0.6
Chesapeake United States 40% - 50% 1.8 1.2
5. Those companies in the S&P Global Oil Index that are categorised as either “integrated oil & gas” or “oil
& gas exploration and production” plus Saudi Aramco
26 2 degrees of separationCompany Country of % of upstream 2017- Potential
headquarters capex outside 2035 CO2
2D budget carbon outside
budget 2D
(% band) carbon
(GtCO2) budget
(GtCO2)
Inpex Japan 40% - 50% 1.4 0.3
ExxonMobil United States 40% - 50% 8.6 3.1
Husky Energy Canada 40% - 50% 0.9 0.3
Woodside Australia 40% - 50% 0.7 0.3
Suncor Energy Canada 40% - 50% 2.3 0.4
EQT Corporation United States 30% - 40% 1.2 0.4
Devon Energy United States 30% - 40% 1.6 0.5
Chevron United States 30% - 40% 6.4 2.0
Eni Italy 30% - 40% 4.6 1.1
Shell Netherlands 30% - 40% 9.9 2.7
Galp Energia SA Portugal 30% - 40% 0.3 0.1
Canadian Natural Resources Canada 30% - 40% 2.0 0.5
(CNRL)
Noble Energy United States 30% - 40% 1.3 0.6
Repsol Spain 30% - 40% 1.8 0.3
Newfield Exploration United States 30% - 40% 0.4 0.2
Total France 30% - 40% 6.3 1.2
Crescent Point Energy Canada 30% - 40% 0.2 0.1
Hess United States 30% - 40% 0.8 0.2
Origin Energy Australia 30% - 40% 0.3 0.1
Rosneft Russia 30% - 40% 9.5 1.3
Continental Resources United States 20% - 30% 0.7 0.3
Anadarko United States 20% - 30% 2.5 0.6
Cimarex Energy United States 20% - 30% 0.7 0.1
Occidental Petroleum United States 20% - 30% 1.6 0.5
BP United Kingdom 20% - 30% 6.5 1.5
June 2017 27Company Country of % of upstream 2017- Potential
headquarters capex outside 2035 CO2
2D budget carbon outside
budget 2D
(% band) carbon
(GtCO2) budget
(GtCO2)
Lukoil Russia 20% - 30% 5.0 0.5
PetroChina China 20% - 30% 9.6 0.7
ConocoPhillips United States 20% - 30% 3.8 0.8
EOG Resources United States 20% - 30% 2.3 0.6
CNOOC China 20% - 30% 2.9 0.5
Gazprom Russia 20% - 30% 17.8 2.0
Santos Australia 20% - 30% 0.4 0.1
Statoil Norway 20% - 30% 4.3 0.6
Rice Energy United States 20% - 30% 0.7 0.1
RSP Permian United States 10% - 20% 0.4 0.1
Marathon Oil United States 10% - 20% 1.1 0.2
OMV Austria 10% - 20% 0.5 0.1
QEP Resources United States 10% - 20% 0.4 0.1
Cenovus Energy Canada 10% - 20% 0.9 0.1
Tullow Oil United Kingdom 10% - 20% 0.3 0.0
Parsley Energy United States 10% - 20% 0.2 0.0
Ecopetrol Colombia 10% - 20% 0.8 0.1
Lundin Petroleum Sweden 10% - 20% 0.3 0.0
Sinopec China 10% - 20% 2.3 0.2
Pioneer Natural Resources United States 0% - 10% 1.8 0.2
Peyto Canada 0% - 10% 0.3 0.1
Petrobras Brazil 0% - 10% 5.9 0.4
28 2 degrees of separationCompany Country of % of upstream 2017- Potential
headquarters capex outside 2035 CO2
2D budget carbon outside
budget 2D
(% band) carbon
(GtCO2) budget
(GtCO2)
Surgutneftegas Russia 0% - 10% 2.0 0.0
Tatneft Russia 0% - 10% 1.1 0.0
Range Resources United States 0% - 10% 2.0 0.0
Saudi Aramco Saudi Arabia 0% - 10% 30.2 0.4
Novatek Russia 0% - 10% 2.8 0.1
Arc Resources Canada 0% - 10% 0.5 0.0
Gulfport Energy United States 0% - 10% 0.8 0.0
Tourmaline Oil Canada 0% - 10% 1.0 0.0
Diamondback Energy United States 0% - 10% 0.4 0.0
Antero Resources United States 0% - 10% 1.3 0.0
Seven Generations Energy Canada 0% - 10% 0.7 0.0
Source: Rystad Energy, CTI analysis
It is clear that some companies would have to forego the majority of their options
in a 2D future, significantly impacting growth plans. Other companies are already
highly resilient to this scenario, including Saudi Aramco for example. Oil sands
operators generally do not perform well, which reflects the ongoing challenges to
expanding production with both carbon limits and export infrastructure constraints.
Shale operators are spread along the cost curve, with some positions performing
better than others.
Optionality & flexibility
Discussions with oil companies indicate that there is a desire to retain a certain
amount of optionality to allow flexibility depending on which future emerges,
responding to possible changes in oil price. In other words, to retain some higher-
cost projects as future development possibilities without committing if not warranted
in the price environment at the time. This is understandable, but will only deliver a
2D aligned scenario if all companies choose not to exercise this optionality. Different
types of project also offer greater flexibility. For example, US shale producers
June 2017 29have relatively short cycle options which offer greater ability to reduce investment and lower production quickly. Conversely, major projects with high initial capital investment and long payback periods such as greenfield oil sands projects or LNG plants are more difficult to wind down and expose developers to longer periods of risk. However, such optionality is not entirely cost free – for example, companies may have to pay fees to acquire acreage even if it is not developed, or licence terms may commit them to an exploration programme. Furthermore, companies that are encouraged by higher oil prices to press ahead with such projects run the risk of being caught out by prices deteriorating after they have committed material capital, like some of those sanctioned prior to 2014’s downturn. Company carbon budgets equivalent to the UK It is also worth noting how significant the production of the oil majors and NOCs are in terms of the remaining carbon budget. As context, the UK-estimated carbon budget for the period 2018-32 is 6.26 GtCO2 according to the UK Climate Change Committee. This means that a single major company is producing enough oil and gas to use up the UK’s entire carbon budget for the period. This demonstrates the importance of investors tackling climate change by ensuring major oil companies are aligning with climate objectives. High cost projects – examples of projects outside the 2D budget The largest projects that are outside the 2D budget can be put forward as examples of high cost options that should not be pursued in a demand-constrained world. In this exercise, high risk projects are listed in order of capex, giving an indication of the possible financial risk of developing them. The list is limited to projects which are “new”, meaning either at the discovery stage or not yet discovered (i.e. excluding projects which are already in production or under development). Undeveloped projects have lower sunk costs, and are thus easier to cancel than projects which have already received significant capital, and would therefore require the company to write that expenditure off. Companies may have already decided to defer or cancel some of these projects, and revisit a final investment decision in the future. This is where companies can provide transparency about which projects they see are part of their future strategy, or how they think they are aligned or not with a 2D scenario. This list highlights projects that the cost curve data indicates are not consistent with a 2D scenario – the companies are best placed to indicate where in their project pipeline a project sits. Whilst a certain degree of optionality around the marginal production point is sensible, the highest cost projects are clearly those that are most at risk in a 2D world (and indeed are highest risk and lowest return in any demand scenario). 30 2 degrees of separation
For example, the five oil projects with the highest capex not needed outside the 2D
budget are shown in the table below.

 Project            Kashagan,          Junin-6, VE       Lulu, NS         Bonga           Bonga, NG
                    KZ                                                    Southwest-
                                                                          Aparo, NG
 Asset              Kashagan           Junin-6 (Phase    Lulu, NS         Bonga           Bonga North,
                    (Phase 2), KZ      2), VE                             Southwest, NG   NG

 Companies          Total, Eni,        PDVSA,            Saudi Aramco,    Eni, Chevron,   Eni, Shell,
                    KazMunaiGaz        Rosneft,          Kuwait           Total, Shell,   ExxonMobil,
                    (parent), Shell,   Gazprom,          Petroleum Corp   Lukoil,         Total
                    CNPC (parent),     Gazprom Neft      (KPC)            ExxonMobil
                    Samruk             (Public traded
                    Kazyna,            part)
                    ExxonMobil,
                    Inpex
 Life cycle         Discovery          Discovery         Discovery        Discovery       Discovery
 stage

 Category           Conventional       Extra heavy oil   Conventional     Deep water      Deep water
                    (land/shelf)                         (land/shelf)

 2017-2025          33.5               17.9              10.2             9.6             9.2
 potential
 capex
 Breakeven          110-120            90-100            150+             100-110         90-100
 band (15%
 IRR)
 2017-2035          0.5                0.2               0.1              0.1             0.1
 carbon
 emissions

Source: Rystad Energy, CTI analysis

At the global level, some of the largest projects outside the 2D budget will be in the
hands of state-owned companies, making them less transparent and moving the risks
to taxpayers rather than private investors.

June 2017                                                                                                31
6. NPV sensitivity A common method of valuing oil and gas projects is net present value (NPV), the sum of future free cash flows using a given discount rate (here 10%). The NPVs of a company’s 2D-compliant portfolio and its BAU portfolio can be compared to give an insight into the cost structures of the two and their relative values. As the key driver of NPV is the oil price, the values of the two portfolios can be sensitised to different oil prices, and hence relative leverage to the oil price (and hence relative volatility) can be determined. This concept was explored in Carbon Tracker’s Sense & Sensitivity report6. As most producing projects are within the 2D budget, the 2D premium (the greater value of the 2D portfolio than the BAU portfolio) particularly comes out in relation to new projects, which are the focus on this indicator. The chart shows how the 2D premium across the global oil and gas industry would be around US$1.4trn if prices average around US$60/bbl going forward at a 10% discount rate. The 2D future can therefore be positive in value terms for the oil and gas industry overall as long as it aligns with it and does not bet on high demand and prices. Figure 3: NPV sensitivity to oil price Source: Rystad Energy, CTI analysis 6. Available at http://www.carbontracker.org/report/fossil-fuels-stress-test-paris-agreement-managed-decline/ 32 2 degrees of separation
As the 2D portfolio constitutes the lower-cost portion of the BAU portfolio that fits
within the 2D budget, it is lower cost on average. Accordingly, it has higher margins,
and outperforms the BAU portfolio at lower oil prices.

Oil prices need to not only rise, but also be sustained at higher levels. For example
high cost projects that were sanctioned based on the 3 years or so of US$100+/bbl
prices pre-mid 2014 will have lost value for shareholders since. Some impairments
have already been taken as a result of price cuts. In order for the high cost non-2D
compliant oil projects to be worth developing (in aggregate), oil prices will need to
average above US$100/bbl. Above this point, the oil price becomes so high that it
is worth doing the additional high-cost projects – although this implies that global
climate targets will be missed, assuming all else remains the same. (Other factors
such as political risk will impact the actual oil price, but this is designed as a simple
exercise to indicate relative price sensitivity of two production scenarios.) At lower oil
prices, sticking to the smaller 2D compliant subset delivers significantly more value
(or loses less) than going ahead with more expensive options.

It can also be noted that, due to the higher cost structure of the BAU portfolio, it is
more geared to the oil price – that is, its value changes more for a given change in
the oil price than the 2D portfolio. This implies higher volatility and higher risk, and
accordingly investors calculating the NPV of the BAU portfolio should use a higher
discount rate, which would reduce its value further compared to the 2D portfolio.
This is outside of the scope of this exercise, but is noted for interest.

A further point that is worth considering on the topic of NPV is the concept of
reinvestment risk. As noted, the NPV of a project is the sum of future discounted cash
flows. However, in order for that value to be realised as a shareholder, the free cash
flows must be distributed to investors via dividends. To the extent that any of these
cash flows are not distributed, but are subsequently invested in future projects, this
value is then transferred into the future (assuming that the company invests at its
cost of capital) when that new project starts producing. In the case of conventional
projects, this may be another ten years or more, when there will be even greater
uncertainties relating to competing technologies and environmental regulations,
and a greater difference between the 2D and BAU demand pathways. Therefore,
even the value realised from the 2D portfolio is reliant on the company’s subsequent
capital allocation decisions.

This is an example of how analysts could test the financial implications of a 2D
scenario aligned strategy and integrate this kind of scenario analysis into their
thinking.

June 2017                                                                                  33
Disclaimer

Carbon Tracker is a non-profit company set up to produce new thinking on climate
risk. The organisation is funded by a range of European and American foundations.
Carbon Tracker is not an investment adviser, and makes no representation
regarding the advisability of investing in any particular company or investment
fund or other vehicle. A decision to invest in any such investment fund or other
entity should not be made in reliance on any of the statements set forth in this
publication. While the organisations have obtained information believed to be
reliable, they shall not be liable for any claims or losses of any nature in connection
with information contained in this document, including but not limited to, lost
profits or punitive or consequential damages. The information used to compile this
report has been collected from a number of sources in the public domain and from
Carbon Tracker licensors. Some of its content may be proprietary and belong to
Carbon Tracker or its licensors. The information contained in this research report
does not constitute an offer to sell securities or the solicitation of an offer to buy,
or recommendation for investment in, any securities within any jurisdiction. The
information is not intended as financial advice. This research report provides
general information only. The information and opinions constitute a judgment as at
the date indicated and are subject to change without notice. The information may
therefore not be accurate or current. The information and opinions contained in
this report have been compiled or arrived at from sources believed to be reliable
and in good faith, but no representation or warranty, express or implied, is made
by Carbon Tracker as to their accuracy, completeness or correctness and Carbon
Tracker does also not warrant that the information is up-to-date.
To know more please visit: 2degreeseparation.com

www.unpri.org
www.carbontracker.org

@PRI_News
@CarbonBubble
You can also read


