Earnings Release Fourth Quarter of 2020 - Vivara RI
←
→
Page content transcription
If your browser does not render page correctly, please read the page content below

Earnings Release Fourth Quarter of 2020

SUMMARY

 EARNINGS RELEASE | 4Q20 ............................................................................                    3
     Highlights in the Period..…...........................................................................               3
     Financial Highlights …..................................................................................             3
     Revenue .......................................................................................................      4
     Gross Profit and Gross Margin ....................................................................                   7
     Operating Expenses ….................................................................................                7
     Adjusted EBITDA and Adjusted EBITDA Margin .........................................                                 8
     Net Income and Net Margin ……..................................................................                       8
     Debt …………...............................................................................................             9
     Investments | Capex ....................................................................................             9
     Cash Generation ..........................................................................................          10
     Expansion......................................................................................................     10

 ANNUAL BALANCE SHEET | 2020                                                                                             11

     Message from Management ........................................................................                    14
     Covid-19 Impacts and Measures .................................................................                     16
     Comments On Financial Performance ........................................................                          17
     People ..........................................................................................................   20
     Future Vision – ESG ..........................................................................                      21
     Capital Markets ………………………………………………………………….                                                                          22
     Corporate Governance …............................................................................                  23
     Outlook …………………………………………………………………………...                                                                             24

 APPENDICES
   Statement of Income ………….....................................................................                         25
   Balance Sheet ……......................................................................................                26
   Cash Flow …………………...........................................................................                          27
   Disclaimer .....................................................................................................      28

                                           2 | VIVARA 4Q20 | EARNINGS RELEASE
São Paulo, March 17, 2021 – Vivara Participações S.A. (B3: VIVA3), Brazil’s largest
 jewelry chain, announces today its results for the 4th quarter of 2020 and fiscal year 2020.

 HIGHLIGHTS IN THE PERIOD

      Record quarterly sales: R$596.5 million, up 14.4% on 4Q19.

      Expansion of 11.3% in same-store sales (SSS).

      Robust growth of 159.0% in Digital Sales, in comparison with
      4Q19, accounting for 18.1% of revenue in this quarter.

      Consolidation of Joias em Ação Project, which accounted for
      31.6% of digital sales, in 4Q20.

      Healthy inventory mix and effective pricing policy protected
      Gross Margin levels, which reached 69.0% in the quarter.

      Adjusted EBITDA(1) of R$137.4 million, +15.6% higher in the
      4Q20, in comparison with the 4Q19, with margin of 29.8%.

      Strong cash generation in the quarter, increasing                                                                             R$63.3
      million.

 FINANCIAL HIGHLIGHTS
Main Key Ratios (R$, 000)                                                                         4Q20                 4Q19                  ∆%                   2020            2019             ∆%
Gross Revenue (net of return)                                                                       596,554              521,572                14.4%         1,338,142 1,489,872                    -10.2%
Net Revenue                                                                                         461,037              407,279                13.2%         1,047,547 1,171,360                    -10.6%
Gross Profit                                                                                        318,203              294,866                 7.9%           717,483 797,745                      -10.1%
 Gross Margin (%)                                                                                    69.0%                72.4%            -338 bps               68.5%           68.1%            39 bps
EBITDA                                                                                              145,831              122,025              19.5%              263,351         408,570            -35.5%
   Ebitda Margin (%)                                                                                 31.6%                30.0%             167 bps               25.1%           34.9%          -974 bps
                         (1)
Adjusted EBITDA                                                                                     137,369              118,834               15.6%             216,319         272,134            -20.5%
   Adjusted Ebitda Margin (%)                                                                        29.8%                29.2%               62 bps              20.7%           23.2%          -258 bps
Net Income                                                                                           93,182               92,653                0.6%             146,672         318,251            -53.9%
   Net Margin (%)                                                                                     20.2%               22.7%            -254 bps               14.0%           27.2% -1317 bps
Adjusted Net Income(3)                                                                                93,182             107,515              -13.3%             146,672         216,989    -32.4%
   Adjusted Net Margin (*) (%)                                                                        20.2%               26.4%            -619 bps               14.0%           18.5% -452 bps
    (2)
SSS (physical stores + e-commerce)                                                                    11.3%                7.4%                   na              -12.2%             8.6%             na
Operational Cash Generation(4)                                                                        63,308            (35,786)               276.9%            239,553           (3,112)        7798.6%

 (1) EBITDA (Earnings Before Interest, Taxes, Depreciation and Amortization) is a non-accounting measurement disclosed by the Company in compliance with CVM Instruction 527/12. Based on the
 above calculation, an adjustment is made to eliminate non-recurring effects on income, when applicable, as well as the recognition of lease expenses related to the fixed installment of store rents, which,
 since the adoption of CPC 06 / IFRS 16, ceased to be recorded as “rent expenses” in the Income Statement and are recognized as “Lease of Right-of-Use Assets” in the Statement of Cash Flow. As
 such, these adjustments generate Adjusted EBITDA.
 (2) Same-Store Sales (SSS) considers gross revenue, net of returns, at stores in operation for 12 months, as well as revenues from e-commerce.
 (3) Net Income adjusted by non-recurring effects related to the recognition of amounts from the favorable outcome of the lawsuit to exclude ICMS tax from the PIS/Cofins calculation base in 9M19, as
 per the reconciliation shown on page 8.
 (4) Managerial, non-accounting measurement prepared by the Company that does not fall under the scope of the independent audit.

                                                                     3 | VIVARA 4Q20 | EARNINGS RELEASE
GROSS REVENUE (Net of Returns)
    Gross revenue, net of returns, grew 14.4% in the quarter, reflecting the gradual recovery of sales at
    physical stores combined with the maturation of digital initiatives, which boosted digital sales. The sales
    strategy for 4Q20 was structured to reduce dependence on customer traffic during the weeks of Black
    Friday and Christmas. Measures included extending the Black Friday period to 12 days, with reinforced
    and already integrated inventories, through the implementation of the Order Management System, in 50
    key markets of the operation. For the Christmas season, we intensified the launch of collections and
    strengthened digital marketing campaigns to dilute sales flows over the month. Same Store Sales (SSS)
    growth in the period was 11.3%. Net Revenue came to R$461.0 million, up 13.2% on 4Q19, and
    R$1,047.6 million in 2020, down 10.6%.

Revenue per chanel (R$, 000)                                  4Q20      4Q19      ∆%          2020        2019      ∆%
Gross Revenue (net of return)                                 596,554 521,572      14.4%    1,338,142   1,489,872   -10.2%
 Physical Stores                                              484,154 473,914       2.2%    1,016,119   1,360,642   -25.3%
 E-commerce                                                   108,220    41,785   159.0%      309,398     106,246   191.2%
 Others                                                         4,179     5,872   -28.8%       12,625      22,985   -45.1%
Deductions                                                  (135,517) (114,293)    18.6%    (290,595)   (318,512)    -8.8%
Net Revenue                                                   461,037 407,279      13.2%    1,047,547   1,171,360   -10.6%
SSS (physical stores + e-commerce)                             11.3%       7.4%      na       -12.2%        8.6%       na

    4Q20 sales accounted for 44.6% of annual revenue, while 4Q19 sales represented 35.0% in 2019. In
    terms of monthly performance, sales in November grew 23.7%, representing strong acceleration from the
    same month of the prior year. In December, we observed an increase in restrictions on business activity
    and the paring back of measures to flexibilize business activity in certain markets, which led sales in the
    month to decelerate in relation to October and November. This slowdown in sales is also partially due to
    the anticipation of Christmas purchases, given the sales strategy focusing on diluting the dependence on
    customer traffic adopted by the Company. Nevertheless, in 4Q20, we set a new record for sales in a
    single quarter.

    Sales growth in the quarter was leveraged by the higher volume of products sold, mainly in the Life and
    Accessories categories. In the consolidated, 91.4% of sales growth in the quarter came from volume and
    8.6% from price.

    The Company's sales mix remained relatively stable between periods, with the Life category expanding
    its share by 120 bps, Jewelry expanding 50 bps. and Watches contracting 120 bps, which benefitted
    sales profitability.

SALES BY CATEGORY

                            2.8%      0.2%                                   3.1%    0.3%
                                                                   15.6%
                14.4%

                                                    50.4%
                                4Q20                                              4Q19                  49.9%

               32.2%                                                31.0%

                            Jewelry          Life       Watches          Acessory          Services

                                       4 | VIVARA 4Q20 | EARNINGS RELEASE
GROSS REVENUE (Net of Returns) (continued)
SALES AT PHYSICAL STORES
 In 4Q20, we observed consistent strong acceleration in sales at physical stores, with the channel
 registering its best performance in November, with an increase of 7.9% and SSS growth of 3.1%. In
 December, with the expansion of restrictions in certain key markets, the pace of recovery at physical
 stores slowed, mainly in the South and Southeast regions.

 In 4Q20, revenue from physical stores advanced 2.2%, representing 81.2% of total revenue. In 4Q19,
 physical stores accounted for 90.9% of total revenue. SSS growth considering only physical stores
 decreased by 2.0%.

           Quarterly performance of stores                                         Sales by State(*)
 90.3%                             76.0%           81.2%                             4Q20 vs. 4Q19
                  35.0%

                                                   +2.2%

                   -83.2%           -16.5%

   -5.3%

                                                                                                                        87%
                                                                                                                        100%
                                                                                                                        111%
     1T              2T               3T             4T                                                                 120%
                                                                                                                        143%
           2019   2020            % Stores / 2020 Total Revenue
                          Growth. vs 2019                                   *Sales by state in 4Q20 compared to 4Q19

 Note also that this result is in line with the Company's expectations for the period and excludes sales
 under the Joias em Ação Project, which are registered under digital sales. In 4Q20, the project's direct-
 selling amounted to R$34.2 million. For illustrative purposes only, if this effect were considered, sales at
 physical stores would have grown by 9.4%.

                                                                      Sales Mix of Physical Stores
                                                                              2.7%
                                                                   14.4%

                                                                                                     52.5%
                                                                                 4Q20

                                                                  30.4%                                      Jewelry
                                                                                                             Life
                                                                               2.8%                          Watches
                                                                    14.4%                                    Acessory

                                                                                                    52.3%
                                                                                 4Q19

                                                                    30.5%

                                       5 | VIVARA 4Q20 | EARNINGS RELEASE
GROSS REVENUE (Net of Returns) (continued)
DIGITAL SALES
 In 4Q20, the great highlight remained digital sales, which delivered revenue growth of 159.0% to R$108.2
 million, representing 18.1% of total sales. The channel's performance was mainly due to the maturation of
 the omnichannel initiatives implemented over the year. The level of digital sales remained stable at
 between 15% and 20% of total sales as from September, even with the resumption of operations at
 physical stores.

      E-commerce Growth
                                                             63.9%
                           8.4%                                                       22.9%                          18.1%

                          20.5%                             387.0%                    182.3%                        182.3%
                                                                                       1.8%
                                                             16.8%
                                                                                                                     31.6%

                         100.0%                                                       98.2%
                                                             83.2%
                                                                                                                     68.4%

                            1Q                                2Q                           3Q                          4Q

                Online sales growth (2020vs2019)                   % Share Joias em Ação        % Share Total Revenue        Growth. vs 2019

 In 4Q20, the Joias em Ação Project represented 31.6% of digital sales and once again proved an
 important tool for balancing the channel's sales mix, which historically has had a higher share of Watches
 and Life products, which have lower average tickets than Jewelry products.

                          Digital Sales Mix(*)                                       Joias em Ação Sales Mix 4Q20
                                  3.7%
                    14.3%
                                                         41.4%

                                      4Q20
             40.5%                                                                                   9.0%

                                 3.7%                                                      22.3%
                                                                                                              31.6%
                                                                                                            Over digital
                                                     28.0%                                                    sales          68.7%
             29.2%

                                      4Q19

                                    39.1%

          Jewelry              Life            Watches     Acessory                        Jewelry     Life      Watches     Acessory
 (*) Includes sales of Joias em Ação Project

                                                         6 | VIVARA 4Q20 | EARNINGS RELEASE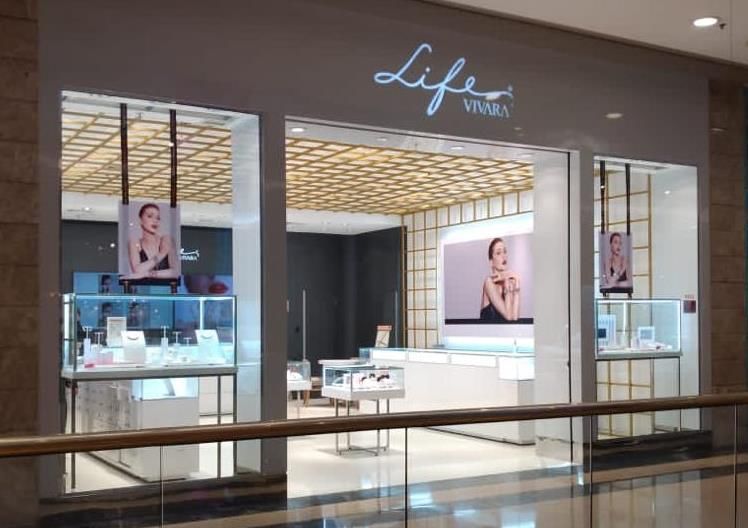
GROSS PROFIT AND GROSS MARGIN
Gross Profit (R$, 000) and Gross Margin (%)                    4Q20       4Q19        Δ%            2020      2019        Δ%
Net Revenue                                                    461,037    407,279      13.2%      1,047,547 1,171,360     -10.6%
 Total costs                                                  (142,834) (112,413)       27.1%     (330,064)   (373,615)    -11.7%
   Acquisition of input, raw materials and products           (134,402) (102,080)       31.7%     (304,502)   (348,621)    -12.7%
   % Net Revenue                                               -29.2%      -25.1%    -409 bps       -29.1%      -29.8%     69 bps
   Factory Expenses                                            (8,432)    (10,332)      -18.4%     (25,562)    (24,994)       2.3%
   % Net Revenue                                                -1.8%       -2.5%      71 bps        -2.4%       -2.1%    -31 bps
      Personal                                                 (6,517)     (6,014)        8.4%     (20,286)    (20,675)      -1.9%
      % Net Revenue                                             -1.4%       -1.5%        6 bps       -1.9%       -1.8%    -17 bps
      Factory expenses                                         (1,154)     (2,869)      -59.8%      (2,751)     (2,869)      -4.1%
      % Net Revenue                                             -0.3%       -0.7%      45 bps        -0.3%       -0.2%     -2 bps
      Depreciation                                                (761)    (1,449)      -47.5%      (2,524)     (1,449)     74.2%
      % Net Revenue                                              -0.2%       -0.4%     19 bps         -0.2%       -0.1%   -12 bps
Gross profit                                                   318,203    294,866    7.9%          717,483     797,745     -10.1%
 Gross margin %                                                 69.0%      72.4% -338 bps           68.5%       68.1%     39 bps

    Gross Margin in the period was 69.0%, which is in line with
    healthy profitability levels, even considering the more intense
    and promotional Black Friday and the recurring increases in raw
    material costs.

    The healthy inventory mix in all categories, combined with the
    right pricing policy, supported this profitability, demonstrating
    once again the Company's capacity to manage costs.

 OPERATING EXPENSES
Operating Expenses (R$, 000)                                     4Q20      4Q19          ∆%         2020         2019    ∆%
Operating Expenses                                             (168,957) (173,539)        -2.6%   (463,223)   (498,066)    -7.0%
 Operating Expenses/Net Revenue (%)                              -36.6%    -42.6%      596 bps      -44.2%      -42.5% -170 bps
Selling Expenses                                               (121,992) (116,314)         4.9%   (331,679)   (360,069)    -7.9%
 Selling Expenses/Net Revenue (%)                                -26.5%    -28.6%      210 bps      -31.7%       -30.7% -92 bps
General and Administrative Expenses                             (46,966) (57,225)        -17.9%   (131,544)   (137,997)    -4.7%
 General and Administrative Expenses/Net Revenue (%)             -10.2%    -14.1%      386 bps      -12.6%       -11.8% -78 bps
Other Operating Expenses                                         (4,175)     (755)      -453.1%       6,567     107,442   93.9%
Total Operating Expenses                                       (173,132) (174,294)        -0.7%   (456,656)   (390,624)   16.9%

    In 4Q20, Operating Expenses (SG&A) decreased 2.6%, mainly due to (i) lower personnel expenses; and
    (ii) discounts on rental expenses. Note that, in 4Q19, the Company registered R$14.9 million in non-
    recurring expenses related to the IPO project. On a comparable basis, Operating Expenses would have
    increased 6.5%, reflecting the natural effect from the resumption of operations, with operational
    deleveraging of 2.4 p.p., which benefited from the cost cutting and budget control measures adopted by
    the Company as from the onset of the pandemic.

    Selling Expenses increased 4.9% in the quarter, mainly due to (i) the resumption of operations at stores
    and the lower volume of benefits related to adherence to Federal Law 14,020/2020, (ii) the higher
    expenses with freight and taxes due to the growing share of digital sales, and (iii) the higher Marketing
    Expenses with the growing investment in digital marketing. The aforementioned increases were offset by
    the decrease in Rental and Condominium Expenses, due to the discounts obtained, as well as the
    reduction in Outsourced Services, reflecting the budget adjustments adopted during the year.

    General and Administrative Expenses decreased 17.9%, due to the recognition of non-recurring items of
    R$14.9 million related to the IPO expenses in 4Q19. On a comparable basis, General and Administrative
    Expenses increased 10.9%, explained mainly by the increase in Outsourced Services related to projects
    supporting the long-term strategy.

    Other Operating Expenses (Income) declined R$4.2 million in the quarter, mainly due to the additional
    provisions made.

                                               7 | VIVARA 4Q20 | EARNINGS RELEASE
ADJUSTED EBITDA AND ADJUSTED EBITDA MARGIN
EBITDA Reconciliation (R$, 000)                                                                  4Q20            4Q19              ∆%                 2020            2019             ∆%
Net Income                                                                                        93,182          92,649             0.6%            146,672         318,251           -53.9%
(+) Income and Social Contribution Taxes                                                          28,848           8,506           239.2%             16,865          40,914           -58.8%
(+) Financial Result                                                                               8,921           6,417            39.0%             41,542           2,461          1588.2%
(+) Depreciation and Amortization                                                                 14,880          14,449             3.0%             58,273          46,944            24.1%
Total EBITDA                                                                                     145,831         122,021            19.5%            263,351         408,570           -35.5%
                            (4)
(-) Rental expense (IFRS16)                                                                       (8,462)       (18,053)            53.1%            (47,032)        (47,640)     1.3%
(+) Non-recurring effect                                                                                -         14,862                na                  -        (88,796)        na
Adjusted EBITDA                                                                                  137,369        118,830             15.6%            216,319         272,134    -20.5%
Adjusted EBITDA Margin (%)                                                                         29.8%          29.2%            62 bps              20.7%           23.2% -258 bps
 (4) The fixed portion of rent expenses, shown here, is booked in the Statement of Cash Flows as "Lease of Right-of-Use Assets," due to the adoption of IFRS 16. More detailed information on the
 accounting standard is available in Note 4 to the Financial Statements of the Company.

      As consequence of strong sales pace, accurate
      inventory mix, right pricing strategy and strong budget
      control, the Company recorded Adjusted EBITDA of
      R$137.4 million, up 15.6% from the previous year, with
      margin expanding 62 bps. to 29.8%.

      Adjusted EBITDA also benefited from negotiations that
      significantly reduced the fixed rent base of the contracts
      in effect.

      Adjusted EBITDA in 4Q20 was Vivara's best result ever
      in a single quarter.

NET INCOME AND NET MARGIN
Reconciliation of Adjusted Net Income (R$, 000)                                             4Q20            4Q19              ∆%                    2020       2019                  ∆%
Net Income                                                                                   93,182          92,649               0.6%               146,672 318,251                   -53.9%
Net Margin (%)                                                                               20.2%           22.7%                 na                 14.0%     27.2%              -1317 bps
Non-recurring effect                                                                              -          14,862                  na                    - (101,262)                      na
Adjusted Net Income                                                                          93,182         107,511             -13.3%               146,672 216,989                   -32.4%
Adjusted Net Margin (%)                                                                      20.2%           26.4%           -619 bps                 14.0%     18.5%               -452 bps

                                                                                                      •     The Company registered Net Income of
                                                                                                            R$93.2 million in 4Q20, 0.6% higher over
                                                                                                            the same period last year, explained by the
                                                                                                            operational performance, which offset the
                                                                                                            lower inflation adjustment and deferred
                                                                                                            taxes.

                                                                                                      •     We present Adjusted Net Income for 4Q19
                                                                                                            and 2019 excluding the non-recurring
                                                                                                            effect from IPO expenses of R$14.9 million
                                                                                                            that were recognized in 4Q19, as well as
                                                                                                            the amount related to the favorable
                                                                                                            outcome of the lawsuit to exclude ICMS
                                                                                                            from the PIS/Cofins base of R$116.1
                                                                                                            million that was recognized in 2Q19.

                                                                 8 | VIVARA 4Q20 | EARNINGS RELEASE
DEBT
Net Debt (R$, 000)                                                         2020      9M20               ∆%       2019              ∆%
Gross Debt                                                                 390,321 330,019               18.3% 270,354              44.4%
 Short Term                                                                277,821 275,019                1.0% 190,934              45.5%
 Long Term                                                                 112,500    55,000            104.5%    79,420            41.7%
Cash and cash equivalents and Securities                                   701,921 612,245               14.6% 435,844              61.0%
Net Debt                                                                 (311,600) (282,226)            -10.4% (165,490)           100.0%
Adjusted EBITDA LTM (last twelve months)                                   216,319 197,779                9.4% 272,134            -100.0%
Net Debt/Adjusted Ebitda                                                -    1.4x -    1.4x               na -     0.6x              na

                                                         In 4Q20, the Company's leverage ratio was -1.4, reflecting
                                                         the operating cash generation and financial discipline that
                                                         supported cash preservation in the period.

                                                         The increase in short-term gross debt is a one-time effect
                                                         and aligned with the strategy to lengthen the Company's
                                                         maturity debt profile.

 CAPEX
Investments (R$, 000)                                               4Q20         4Q19      ∆%              2020        2019        ∆%
Total Capex                                                           6,969       21,110   -67.0%          44,712      46,500        -3.8%
  New Stores                                                          3,633        6,971   -47.9%          24,815      16,516        50.2%
  Reforms and Maintenance                                             1,659        8,242   -79.9%           8,357      14,597       -42.7%
  Factory                                                             1,271        2,287   -44.4%           3,490       6,633       -47.4%
  Systems/IT                                                            406        3,378   -88.0%           8,032       8,139        -1.3%
  Others                                                                  -          233 -100.0%                17         614      -97.2%
CAPEX/Net Revenue (%)                                                 1.5%         5.2% -367 bps             4.3%        4.0%      30 bps

    Capital expenditures came to R$7.0 million in the quarter, down 67.0% from the same period last year,
    mainly due to (i) the revision of the expansion plan for 2020, which reduced the allocation of investments to
    new stores and to renovations at existing stores; (ii) the reduction in systems and IT investments, which
    were concentrated up to September, as part of the strategy to reinforce the technological structure ahead of
    the sales season.

    In 4Q20, the Company inaugurated 5 new operations (2 Vivara stores, 2 Life stores and 1 kiosk) and closed
    1 Vivara store at Guarulhos Airport, ending the period with 267 points of sale (208 Vivara stores, 13 Life
    stores and 46 kiosks).

      New Life store at Anália Franco Mall (SP)                               New Vivara store at Iguatemi Faria Lima Mall (SP)
      Inaugurated in December                                                 Reinaugurated in November

                                                  9 | VIVARA 4Q20 | EARNINGS RELEASE
Cash Fl ow ( R$, 000) 4Q 20 4Q 19 ∆ % 2020 2019 ∆ %
Net Incom e 93, 182 92, 648 0. 6% 146, 672 318, 251 - 53. 9%
(+/ -) In com e an d Social Con t r ibut ion Taxes/ O t her s 29, 737 ( 15, 337) 293. 9% 42, 585 ( 148, 543) 128. 7%
Adj ust ed Net Incom e 122, 919 77, 311 59. 0% 189, 257 169, 708 11. 5%
Wor ki ng Capi t al ( 59, 314) ( 113, 097) - 47. 6% 50, 593 ( 172, 820) 129. 3%
Tr ade r eceiv ables ( 183, 810) ( 239, 521) - 23. 3% 15, 705 ( 212, 308) 107. 4%
Inv en t or ies 101 18, 251 - 99. 4% ( 18, 593) 1, 654 - 1224. 4%
Tr ade payables 44, 159 6, 259 605. 5% 16, 777 ( 9, 782) 271. 5%
Recov er able t ax es 9, 223 ( 812) 1235. 3% 38, 305 ( 12, 226) 413. 3%
Tax es payable 67, 989 44, 465 52. 9% 19, 353 14, 170 36. 6%
Oth er asset s an d liabilit ies 3, 023 58, 262 - 94. 8% ( 20, 953) 45, 672 - 145. 9%
Cash f r om M anagem ent O per at i ng Act ivities 63, 605 ( 35, 786) 277. 7% 239, 850 ( 3, 112) 7808. 1%
Capex ( 6, 969) ( 21, 110) - 67. 0% ( 44, 712) ( 46, 500) - 3. 8%
Fr eee Cash G ener at i on ( 5) 56, 635 ( 56, 896) 199. 5% 195, 139 ( 49, 611) 493. 3%
CASH GENERATION
Cash Flow (R$, 000) 4Q20 4Q19 ∆% 2020 2019 ∆%
Net Income 93,182 92,648 0.6% 146,672 318,251 -53.9%
(+/-) Income and Social Contribution Taxes/Others 29,914 (15,337) 295.0% 42,761 (148,543) 128.8%
Adjusted Net Income 123,096 77,311 59.2% 189,433 169,708 11.6%
Working Capital (59,788) (113,097) -47.1% 50,120 (172,820) 129.0%
Trade receivables (183,810) (239,521) -23.3% 15,705 (212,308) 107.4%
Inventories 101 18,251 -99.4% (18,593) 1,654 -1224.4%
Trade payables 44,159 6,259 605.5% 16,777 (9,782) 271.5%
Recoverable taxes 9,223 (812) 1235.3% 38,305 (12,226) 413.3%
Taxes payable 67,989 44,465 52.9% 19,353 14,170 36.6%
Other assets and liabilities 2,550 58,262 -95.6% (21,426) 45,672 -146.9%
Cash from Management Operating Activities 63,308 (35,786) 276.9% 239,553 (3,112) 7798.6%
Capex (6,969) (21,110) -67.0% (44,712) (46,500) -3.8%
Freee Cash Generation (5) 56,339 (56,896) 199.0% 194,842 (49,611) 492.7%
(5) This is a non-accounting managerial measurement prepared by the Company that does not fall under the scope of the independent audit.
Vivara generated free cash of R$56.4 million in 4Q20, up R$113.2 million from 4Q19, mainly due to the
lower use of working capital and the reduction in investments compared to 4Q19.
Apart from the adjustments to income tax (IR) and social contribution (CSLL) and other non-cash items,
we adjusted Net Income to rent payments in the amount of R$5,.2 million in 4Q20 and R$18.1 million in
4Q19, which, after the adoption of IFRS 16, are being booked as “Leasing Amortization of Right of Use”
in the cash flow statement under Financing Activities.
EXPANSION
EXPANSION 4Q20
263 2 2 1 267
-1
3Q20 New Stores New Stores New Conversions/ 4Q20
Vivara Life Kiosks Closures
EXPANSION
253 259 259 263 267
50 45 45 46
56 13
8 9 11 Distribution by region
6
Southeast 53%
South 16%
North 5%
191 201 205 207 208
Northeast 18%
Midwest 11%
4Q19 1Q20 2Q20 3Q20 4Q20
Vivara Life Kioks
10 | VIVARA 4Q20 | EARNINGS RELEASEAnnual Report
20202020, Year of Overcoming Challenges
+191.2% (vs 2019)
Record of
Digital Sales
We reached R$309.4 million in digital
sales, reflecting the maturation of the
omnichannel initiatives and the
advances in digital projects.
R$596.6 million
Record-breaking Revenue
In a single quarter
In 4Q20, after the most critical moment of the
pandemic and with our operations gradually
normalizing, we set a record-breaking for
sales in a single quarter.
68.5%
Profitability Expansion
Strong cost management and right pricing
policy supported expansion of 40 bps. in
Gross Margin for the year, despite the
scenario of sharp increases in raw
materialprices.
12 | VIVARA | ANNUAL BALANCE SHEET2020, Year of Transformation
R$1.0 million
Donation to Brazil Foundation
We assumed our role as a reference in the
industry and worked to combat the pandemic.
We allocated R$1.0 million to the Luz
Alliance fund created by Gisele Bündchen,
our brand ambassador, in partnership with the
Brazil Foundation, to support communities
vulnerable to the crisis.
10,000 kits
Actions to deal with
the pandemic
Since the pandemic first emerged, we have been
providing assistance and strengthening the pay-
it-forward movement. We distributed 10,000
personal hygiene kits, in partnership with the
Brazilian Red Cross, to communities to help stop
the spread of Covid-19 in areas marked by social
vulnerability.
41%
of New Customers in
Active Customer Base
The expansion in digital presence, higher
marketing investments and good inventory NPS 90
mix were essential aspects for reaching the
important milestone of new customers Excellence in
added this year. Customer Service
Our misson to fascinate customer is
reflected in the NPS (Net Promoted
Score) reached in the year.
13 | VIVARA | ANNUAL BALANCE SHEETMessage from Management
2020, From Uncertainties to Transformations
The year 2020 was an emblematic one and Amidst so many uncertainties, we were able to
will be remembered by Vivara as a year of deliver a year of transformation. The pandemic
uncertainties and transformations. Over our 60 forced us to rethink our processes and see
years of history, 2020 has been perhaps the new possibilities. The result we are delivering
most challenging year we have ever faced. today exceeded all our initial expectations. We
The fast spread of the pandemic and the low delivered various new records that only a
visibility of the outlook and duration were restless and committed team could deliver.
factors that differentiated this crisis from
previous ones. We set a sales record for a single quarter, a
digital sales record for the year and a daily
Unlike other turbulent periods, we were taken sales record - all in an atypical, uncertain and
by surprise. There were no evident signs of a unknown scenario. We transformed our
recession. There was no indication inherent to business without abandoning the solid
the business, nothing. In a matter of days, the foundation that has brought us here.
pandemic was upon us, forcing each of us to
take rapid, but conscientious and responsible, The Vivara brand ends 2020 even stronger, as
decisions. a reference in online searches and a brand
that is a destination for those seeking the best
Like other turbulent periods, we knew from the gift to mark special moments. We adapted our
beginning that a recovery would come. During communication to clear changes in consumer
the year, we saw our operations gradually behavior during the period of physical
return to normal levels with each passing distancing. We adopted a more emotional
month. The recovery was faster than we first approach in our campaigns, seeking new ways
imagined, but we know that we still have a to interact with our customers. We talked
long way to go. about purpose, well-being and connecting with
loved ones, all in a very subtle, meaning-
Still in March, immediately after the temporary focused approach, which is exactly what
closing of our operations, we formed a Crisis jewelry represents. We made important
Committee and started a routine of constant advances in using data to communicate,
interactions to find solutions for protecting the making our customer database an
health and safety of our stakeholders, from important tool for maximizing sales.
employees, customers and partners to
suppliers and shareholders. Our high-performance sales team made the
difference and accomplished with excellence
Working with the Crisis Committee, we the mission of fascinating customers. They
structured nine work groups: Cash, Stores, E- focused on delivering results, even during the
commerce, Industry and direct suppliers, most critical moments of store closures,
indirect suppliers, People, Communication, supported by the Joias em Ação Project, our
Expansion and Priority on IT Projects. These direct-sales initiative.
multidisciplinary fronts guided all decisions
taken collectively.
Our teams worked tirelessly, while our
corporate values were strengthened and
functioned as a strong foundation for
overcoming the challenges with deliveries
always surpassing expectations.
13 | VIVARA | ANNUAL BALANCE SHEETMessage from Management
The vertical business model enabled us to For 2021, we will resume our accelerated
protect our margins and to work with the organic expansion, with plans to add between
optimal product mix for the moment. We 40 and 50 new Vivara and Life stores. We
expanded the insourcing of production for the have a major ongoing project to strengthen the
Life category, rapidly adjusted inventories and Life brand that includes new initiatives to
expanded coverage of the online channel to optimize operations, a more focused training
ensure an effective product mix in all program and a new product and marketing
categories. strategy to leverage the Life segment in a
structured way. Further the omnichannel
Inevitably, the year's results were affected by strategy, which ended 2020 even stronger and
store closures, but showed gradual with even greater strategic relevance for 2021.
improvement over the months. We ended
2020 with revenue down 10.2%, but with We continue to closely follow developments in
growth of 14.4% in the fourth quarter, even the pandemic and remain diligent in
with the restrictions on customer traffic at responding proactively. The Company has
stores and the reduced business hours. Digital been continuously adopting various measures
sales growth accelerated over the year to end to protect the health of employees, suppliers
the period up 191.2% on 2019. Adjusted and partners, as well as the health of our
EBITDA was R$216.3 million, with margin of business. Most importantly, we are better
20.7%, supported by higher gross margins and prepared and stronger than when all this
rigid cost controls. started. We have solid financial position and
high level of liquidity as well as material
Given the uncertainty at the start of the resources for seizing any consolidation
pandemic, we revised our expansion plan for opportunities to reinforce our leadership in the
the year, reducing the planned number of store market.
inaugurations from 50 to 21. By year-end, we
had delivered 28 new operations, which In February 2021, we announced the election
reinforces our commitment to expanding our of Paulo Kruglensky, as Company’s new Chief
presence in Brazil's leading malls via organic Executive Officer, in succession to Marcio
growth of the Vivara and Life channels. Kaufman, who will now dedicate himself
exclusively to the Board of Directors.
We thank our shareholders, employees,
suppliers and customers for the trust they
place in our Company.
Marcio Kaufman Paulo Kruglesnky
Former-CEO and Director CEO
15 | VIVARA | ANNUAL BALANCE SHEETCovid-19 Impacts and Measures
FLEXIBILITY AND DILIGENCE IN DECISION-MAKING
▪ Resumption of plant
▪ Adjustment of Corporate Structure
operations
▪ Adherence to Federal Law 14,020/2020
▪ Resumption of Expansion
▪ Negotiations with suppliers
Plan
▪ Coordinating actions with other retailers
▪ 186 stores reopened
▪ Pilot initiatives to maximize revenue
▪ 510.5% growth in digital sales
▪ Gradual reopening of stores - 9 stores
March May
• Migration to home office April • Rollout of sales initiatives June
• Temporary closure of stores • Donation of R$1.0 million
• Temporary shutdown of plant to Brazil Foundation
• Creation of Crisis Committees • 26 stores reopened
CLEARER SIGNS OF RECOVERY
▪ Best monthly performance of the
year
▪ Physical stores deliver positive SSS
growth (+3.1%)
▪ Conclusion of integrating 50 markets
▪ 214 stores reopened under OMS project
▪ Joias em Ação accounts ▪ Virtual Sales Convention with over
for 29.4% of digital sales 2,000 people connecting
▪ Digital sales record for single day
July November
September December
▪ 100% of store network
▪ End of benefits under Law
reopened
14,020/2020
▪ Joias em Ação accounts
▪ Reinforcement of marketing
for 45.6% of digital sales
campaigns for the launch of
▪ Gradual return to on-site
new jewelry and Life
activities for office
collections
workers
▪ Expansion of lock-down
measures in some markets
Joias em Ação Project: Direct-selling project that gives the sales team remote access to the
customer's purchase history and enables a more proactive approach via telephone and/or
WhatsApp. The project gained new functionalities over the months and now allows both proactive
service for frequent customers and receptive service for customers requiring assistance online.
Today, we have over 1,600 active sellers who replicate the humanized customer service of
assisted sales for the digital channel as well.
Inventory integration: With the implementation of the Order Management System (OMS), we
integrated the inventory of 50 point of sales, which allows us to offer more convenient and faster
shipping for digital sales.
Digital and data-driven marketing: We improved the way we use the purchase history of
customers to fine-tune our communication by clustering customers and mapping the purchase
journey.
16 | VIVARA | ANNUAL BALANCE SHEETComments on Financial Performance
REVENUE
Gross revenue, net of returns, contracted 5.5%
8.6%
2.8%
10.2% in 2020, reflecting the store
closures during the year in response to -12.2%
the Covid-19 pandemic. Revenue 1,489,872
1,356,972 1,338,142
gradually recovered with each passing 1,242,676
month, with the last quarter of the year
registering growth of 14.4%.
The highlight of the year was the
acceleration in digital sales, which
reached R$309.4 million, advancing
191.2% on the previous year to account
for 18.1% of total revenue. On a same-
store basis, revenue growth in the year 2017 2018 2019 2020
contracted by 12.2%. Gross Revenue (net of return) SSS (physical stores + e-commerce)
The 191.2% growth in digital sales in 2020 was supported by the omnichannel initiatives, especially the
Joias em Ação, direct-selling project created in April after the store closures, which accounted for 25.5%
of sales in the digital channel and gained relevance with each passing month.
Net revenue was R$1,047.6 million, down 10.6% from 2019.
GROSS PROFIT AND GROSS MARGIN
767,514 797,745
Gross Profit in 2020 was R$717.5 million, 88%
727,483
down 10.1% on the prior year, with Gross 662,193 746,048
Margin expanding 40 bps to 68.5%. 81%
Gross Margin is the year was in line with
the Company's healthy profitability levels,
even with the intensification of actions for 70.4%
74%
Black Friday and the continuous 68.1% 68.5%
66.4%
increases in input costs 67%
The healthy inventory mix in all
categories, combined with the right 60%
pricing policy, supported this profitability, 2017 2018 2019 2020
demonstrating once again the Company's Gross Profit Non-recurring effect
capacity to manage costs. Gross Margin Adjusted Gross Margin
17 | VIVARA | ANNUAL BALANCE SHEETOPERATING EXPENSES
Operating Expenses (R$, 000) 2020 2019 ∆%
Operating Expenses (463,223) (498,066) -7.0%
Operating Expenses/Net Revenue (%) -44.2% -42.5% -170 bps
Selling Expenses (331,679) (360,069) -7.9%
Selling Expenses/Net Revenue (%) -31.7% -30.7% -92 bps
General and Administrative Expenses (131,544) (137,997) -4.7%
General and Administrative Expenses/Net Revenue (%) -12.6% -11.8% -78 bps
Other Operating Expenses 6,567 107,442 93.9%
Total Operating Expenses (456,656) (390,624) 16.9%
In 2020, Operating Expenses (SG&A, excluding depreciation) fell 7.0% on the prior year, considering the
recognition of the non-recurring IPO expenses of R$14.9 million in 2019. On a comparable basis,
Operating Expenses in 2020 decreased 4.1% compared to 2019.
Selling Expenses fell 7.9% in the quarter, mainly due to: (i) the adoption of measures under Federal Law
14,020/2020, which allowed for suspending employment contracts with store employees while stores
remained closed and for cutting work hours after they reopened, with effects gradually declining until
November 2020; (ii) the discounts obtained in store rents; and (iii) the reduction in Outsourced Services,
reflecting the budget adjustments during the year. On the other hand, we registered higher expenses with
Freight and Taxes due to the growing importance of digital sales, as well as with Marketing, given the
higher investments in digital marketing.
General and Administrative Expenses fell 4.7%, explained by the non-recurring expenses of R$14.9
million recognized in 2019. On a comparable basis, G&A expenses increased 6.8%, mainly due to: (i) the
higher expenses with Outsourced Services, due to the hiring of consulting firms to support the Company's
strategy. Personnel Expenses benefited from the adoption of Federal Law 14,020/2020, which partially
neutralized the expenses with expanding the administrative team to reinforce strategic areas and the
corporate governance structure.
Other net operating income (expenses) in 2020 was R$6.6 million, compared to R$107.4 million in 2019,
due to the recognition of PIS and COFINS tax credits related to the authorization of the credit filed with
the Federal Revenue Service in May 2019, with the principal corresponding to R$103.7 million.
ADJUSTED EBITDA
272,134
Adjusted EBITDA reached R$216.4 245,786
220,362 216,319
million, down 20.5% from the previous
year, reflecting the store closures, mainly
in the second and third quarters. This
impact was, partially, offset by the strict 23.2%
22.1% 23.2% 20.7%
budget control and the protection of
Gross Margin.
Accordingly, Adjusted EBITDA margin
stood at 20.7%. 2017 2018 2019 2020
Adjusted EBITDA Adjusted EBITDA Margin (%)
18 | VIVARA | ANNUAL BALANCE SHEETFINANCE INCOME (COSTS)
The Net Financial Result in 2020 was an expense of R$41.5 million, compared to an expense of R$2.5
million in 2019, reflecting the decline in financial income generated by the inflation adjustment of tax
credits from double taxation of ICMS on the PIS/COFINS calculation base.
INCOME TAX AND SOCIAL CONTRIBUTION
In 2020, Income Tax and Social Contribution was R$-16.9 million, compared to R$-40.9 million in 2019.
The effective rate of 10.3% in 2020 benefited from the declaration of Interest on Equity of R$25.0 million,
as well as from the decrease in deferred taxes.
NET INCOME
Reconciliation of Adjusted Net Income (R$, 000) 2020 2019 ∆%
Net Income 146,672 318,251 -53.9%
Net Margin (%) 14.0% 27.2% -1317 bps
Non-recurring effect - (101,262) na
Adjusted Net Income 146,672 216,989 -32.4%
Adjusted Net Margin (%) 14.0% 18.5% -452 bps
(1) Adjusted Net Income is a non-accounting measurement that does not fall under the scope of the audit. The measure is used
by the Company to improve the comparability of the periods analyzed. To calculate it, the Company excludes the non-
recurring effects from the ICMS lawsuit on the PIS/Cofins base and the non-recurring expenses with the IPO.
The result for the fiscal year was affected by store closures, but reflected the gradual recovery, especially
after August. The continuous efforts to control costs and the omnichannel initiatives proved critical for
neutralizing these impacts.
Accordingly, the Company registered Net Income of R$146.7 million in 2020, down 32.4% from the
previous year. On a comparable basis, we excluded from the 2019 result the non-recurring effects related
to the IPO expenses in 4Q19, as well as the favorable outcome of the lawsuit to exclude ICMS from the
PIS/Cofins tax base, both net of taxes, whose combined effects of R$101.3 million were recognized in
2Q19, which would have resulted in net income contraction of 32.4%.
19 | VIVARA | ANNUAL BALANCE SHEETPEOPLE
People
Vivara's purpose is “To make each story unique Our Employees
and special”, and that includes the stories of the
people who every day help to ensure our
continued success. Profile by Gender
With the Covid-19 pandemic, caring for our teams
became the first priority in our decision flow. In Women Men
March 2020, we closed all physical stores, even in
malls that maintained normal operations, to
safeguard the health of our employees. Our
administrative team started working from home,
the plant was temporarily closed, and the logistics
team kept the face-to face work, following strict
protocols of safety and hygiene. We were the first 88% 12%
retailer in Brazil to conclude negotiations with
trade unions to draw on the benefits under Federal of management positions
Law 14,020/2020, which allowed us to reduce 88%
held by women
working hours and suspend employment
contracts, to protect job positions during the critical
times Age Bracket
In 2020, we spared no effort to bring our team 5.7%
closer together, despite the physical distance. To 42.6%
maintain transparency and constant dialogue, we
conducted 68 virtual lectures, sent over 230
internal communications and notices (23 per
month on average) and carried out innumerous
endomarketing actions.
51.6%
We did not suspend our training programs, which
were conducted virtually and dynamically via
Webinars and livestreams. Our training platform
Until 30 31 to 50 +50
registered 3,220 active users, with 68 hours of
training per employee and 167 items of content.
By region
535
385
251
1.694
North
North East
Midwest 355
At our traditional Annual Sales Convention, we South
connected over 2,000 people through a two-day Southeast
event to commemorate the results delivered to
date and prepare for year-end.
20 | VIVARA | ANNUAL BALANCE SHEETVision of the Future – ESG
Since our company's founding, in 1962, responsibility and integrity have been non-negotiable attributes
of our operations. We have written this long story together with our supply chain, employees, clients
and partners seeking always to maintain seriousness and transparency in all relations.
To focus our efforts, in 2020, we created the Sustainability area and started structuring our
sustainability strategy and building our ESG agenda.
FOR VIVARA, SUSTAINABILITY IS:
Creating value and setting an example for future generations based
on integrity and trust in relationships, caring for people and
protecting the environment in our daily activities and decisions.
We launched an effort to audit all direct suppliers as the first step in reaching our goal of
auditing 100% of suppliers. For 2021, we are structuring a program that will focus on
OUR
developing our production chain and on continually advancing the implementation of
2020
PLANET
best social and environmental practices.
We published our Suppliers Code of Conduct and shared it with our production chain,
supported by declarations of awareness of and compliance with our principles.
We structured a Crisis Committee to ensure agile decisions in combating Covid-19,
whose goals include disseminating best practices throughout our operations and
ensuring the health and safety of our stakeholders.
Moreover, with the pandemic and the spread of Covid-19 cases nationwide, we
OUR
donated R$1.0 million to the Luz Alliance Fund created by Gisele Bündchen, our brand
2020
COMMUNITY
v
ambassador, in partnership with the Brazil Foundation, which is a pioneering
philanthropic organization in country. The projects benefited by the fund distributed
food staple baskets, hygiene kits and meals to vulnerable communities.
We distributed 10,000 personal hygiene kits, in partnership with the Brazilian Red
Cross, to communities to help stop the spread of Covid-19 in areas marked by social
vulnerability.
To accelerate the Sustainability agenda and instill the topics in our various teams, we
incorporated Sustainability goals into our strategic targets, which linked the results of
projects to the bonuses paid to the managers and executives of the various areas. We
had very satisfactory results, reaching 82% of the deliveries proposed for the year.
We dedicated ourselves to sustainability issues and became signatories to the United OUR
2020
Nations Global Compact and the UN Women's Empowerment Principles. We are the COMMITMENT
only Brazilian jewelry company that is a member of the Responsible Jewellery Council,
a global organization that disseminates best sustainable practices among companies in
the sector.
We approved the Internal Money Laundering and Combating Terrorism Policy to
establish guidelines and comply with current rules and regulations related to preventing
and combating crimes of money laundering and financing of terrorism.
21 | VIVARA | ANNUAL BALANCE SHEETCapital Markets
In 2020, Vivara completed one year as a listed company, with its shares traded on the B3 – Brasil, Bolsa,
Balcão, under the ticker VIVA3. In the year, despite the Covid-19 pandemic and its impacts on the capital
markets, VIVA3 shares appreciated 1.3% (adjusted by corporate events), while the Ibovespa gained
0.4%, reaching market capitalization of R$6.9 billion, as of December 30. Average daily financial trading
volume in the shares was R$38.01 million in 2020.
Vivara was included in five more indexes in 2020, bringing to eight the total of stock indexes on the B3 of
which it is a component, namely: Brazil Broad-Based Index (IbrA), Consumption Index (ICON), Corporate
Governance Trade Index (IGCT), Special Corporate Governance Index (IGCX), Corporate Governance
Index - Novo Mercado (IGNM), Industrial Index (INDX), Special Tag-along Index (ITAG)and Small Caps
Index (SMLL).
The number of shareholders increased 56.8%, from 31,300 in December 2019 to 55,800 in 2020,
represented mainly by individuals.
120
110 1.3%
100 0.4%
90
80
70
60
50
40
30
20
jan-20 fev-20 mar-20 abr-20 mai-20 jun-20 jul-20 ago-20 set-20 out-20 nov-20 dez-20
VIVA3 IBOV
In December 2020, the Board of Directors of Vivara approved the remuneration of shareholders in the
amount of R$25.0 million.
22 | VIVARA | ANNUAL BALANCE SHEETCorporate Governance
Vivara's shares, which trade under the ticker VIVA3, are listed on the Novo Mercado, the listing segment
of the B3 - Brasil, Bolsa, Balcão with the highest level of corporate governance.
The Board of Directors is composed of 5 members, of whom 80% are independent. The composition of
the board took into consideration the diversity of backgrounds and complementary expertise to ensure the
body has the competencies required to execute the strategic plan for the coming years.
In November 2020, the Board of Directors appointed Sylvia de Souza Leão Wanderley as Vice-Chair,
which increased to 40% the representation of women on its board.
The Company also has two supporting and monitoring committees: Audit, Risk and Finance Committee
and People, Culture and Governance Committee. The main function of the committees is to provide the
Board of Directors with supporting material and opinion required for the decision-making process and
assist the Board of Executive Officers on the policies approved by the Board of Directors. Operational
activities are conducted by the Statutory Board of Executive Officers, as per the guidelines set by the
Board of Directors and with the support from Management Committees in taking decisions.
23 | VIVARA | ANNUAL BALANCE SHEETOutlook
2021 also started with challenges related to the pandemic, with an increase in isolation measures and
the closing of stores in relevants markets for our operation. Currently, we have 175 points of sale
closed, operating only with drive-thru and delivery formats, when allowed. E-commerce continues to
contribute, in part, to offset the effect of stores closures, growing over 200%, compared to last year.
January and February we registered growth of revenues and positive SSS, considering stores and
digital sales, comparing to the same months of 2020. The factory, located in Manaus, is operating at full
capacity to ensure a good inventory mix for resuming operations. The short-term uncertainties do not
change Company's future vision. We remain confident in Vivara's ability to consolidate its leadership
position in the market, through the recurring gain of market share.
Production cost management – The Company remains focused on initiatives to neutralize, even if
partially, the effects from the increases in gold and silver, which intensified since the start of 2020. As
such, as already announced during the reporting of results over 2020, the Company is maintaining its
strategy of gradually passing through price increases and developing products that combine
commercial appeal and profitability.
Expansion plan – After revising the 2020 expansion plan in view of uncertainties caused by the
pandemic, the Company is resuming its plans to accelerate growth in 2021 and planning to open
around 40 to 50 Vivara and Life stores. For the long-term strategy, the Company remains committed to
expanding its presence in leading shopping malls across Brazil via organic growth of its channels.
Change in Board of Executive Officers – On February 4, the Board of Directors approved the
election of Paulo Kruglensky as the Company's new CEO, in view of the resignation tendered by Márcio
Monteiro Kaufman. Márcio Monteiro Kaufman served as CEO of the Vivara Group for over 10 years
and now will continue his contributions to the Company's success as a member of the Board of
Directors. Paulo Kruglensky, who was elected Chief Executive Officer, is currently Vice President of
Operations of the Company, a position he will continue to hold together with his new role. He also is a
shareholder in the Company's controlling group and has vast knowledge of the business.
24 | VIVARA | ANNUAL BALANCE SHEETSTATEMENT OF INCOME
Financial Statements (R$ ,000) 4Q20 4Q19* ∆% 2020 2019* ∆%
Receita Bruta de Vendas de Mercadorias 680,172 600,758 13.2% 1,573,485 1,783,855 -11.8%
Receita Bruta de Serviços 1,197 1,696 -29.4%
*
3,904 6,761 -42.3%
Deduções da Receita Bruta (135,517) (114,293) 18.6% (290,595) (318,512) -8.8%
Trocas e devoluções (84,816) (80,882) 4.9% (239,247) (300,744) -20.4%
Net Revenue 461,037 407,279 13.2% 1,047,547 1,171,360 -10.6%
(-) Cost of Sold Goods (142,074) (110,964) 28.0% (327,540) (372,166) -12.0%
(-) Depreciation and Amortization (761) (1,449) na (2,524) (1,449) na
(=) Gross Profit 318,203 294,866 7.9% 717,483 797,745 -10.1%
(-) Operating Expenses (187,252) (187,294) 0.0% (512,405) (436,119) 17.5%
Sales (121,992) (116,314) 4.9% (331,679) (360,069) -7.9%
Personal (59,960) (56,183) 6.7% (158,850) (175,324) -9.4%
Rentals and common area maintenance fees (8,833) (12,521) -29.5% (35,268) (47,860) -26.3%
Lease discounts 3,008 - na 16,491 - na
Freight (8,294) (5,859) 41.6% (26,541) (20,613) 28.8%
Commission on credit cards (10,808) (8,448) 27.9% (22,155) (25,530) -13.2%
Outsourced services (2,655) (3,810) -30.3% (9,917) (11,711) -15.3%
Marketing/selling expenses (26,548) (22,863) 16.1% (63,629) (54,317) 17.1%
Other selling expenses (7,901) (6,630) 19.2% (31,810) (24,715) 28.7%
General and Administratives (46,966) (57,225) -17.9% (131,544) (137,997) -4.7%
Personal (16,917) (35,935) -52.9% (55,685) (72,376) -23.1%
Rentals and common area maintenance fees (224) 219 -202.2% (728) (390) 86.7%
Outsourced services (18,049) (11,238) 60.6% (49,241) (35,238) 39.7%
Other General and Administratives expenses (11,775) (10,271) 14.6% (25,890) (29,993) -13.7%
Depreciation and Amortization (14,119) (13,000) 8.6% (55,749) (45,495) 22.5%
Share of profit (loss) of subsidiaries - 0 -100.0% - (247) -100.0%
Other Operating Expenses (Revenues) (4,175) (755) 453.1% 6,567 107,690 -93.9%
(=) Profit (Losses) Before Financial Results 130,951 107,572 21.7% 205,079 361,626 -43.3%
(=) Financial Result (8,921) (6,417) 39.0% (41,542) (2,461) -1588.2%
Financial Income (Expenses), net 4,514 6,751 -33.1% 23,632 66,780 -64.6%
Finance costs, net (13,435) (13,168) 2.0% (65,174) (69,241) -5.9%
(=) Operating Income 122,030 101,155 20.6% 163,537 359,165 -54.5%
Income and Social Contribution Taxes (28,848) (8,506) 239.2% (16,865) (40,914) -58.8%
(=) Net Income 93,182 92,649 0.6% 146,672 318,251 -53.9%
*Vivara Participações S.A. was incorporated on May 23, 2019, therefore information related to 2019 refers to the combined information of the
subsidiaries Tellerina and Conipa.
25 | VIVARA | APPENDICESBALANCE SHEET
Balance Sheet (R$, 000) 2020 2019
CURRENT ASSETS
Cash and cash equivalents 477,319 435,844
Securities 59,725 -
Trade receivables 410,263 425,833
Due from related parties - -
Inventories 365,184 348,034
Recoverable taxes 101,034 95,247
Prepaid expenses and other receivables 3,262 7,669
Derivatives 11,767 6,796
Total current assets 1,428,554 1,319,425
NONCURRENT ASSETS
Securities 164,876 -
Escrow deposits 13,457 13,680
Deferred income tax and social contribution 67,831 54,200
Derivatives - 2,715
Recoverable taxes 116,090 168,344
Investments - -
Property, plant and equipment 340,907 311,620
Intangible assets 8,981 9,546
Total noncurrent assets 712,142 560,104
TOTAL ASSETS 2,140,697 1,879,529
CIRCULANTE
Trade payables 53,198 36,421
Borrowings and financing 277,821 190,934
Due to related parties - 88
Payroll and related taxes 49,922 65,175
Taxes payable 92,177 86,778
Taxes in installments 327 457
Leases payable 10,367 14,856
Leasing liabilities 39,955 24,119
Juros sobre capital próprio a pagar 22,353 8,124
Dividends payable 12,482 -
Other payables 30,441 31,862
Total current liabilities 589,043 458,813
NONCURRENT LIABILITIES
Labor and social security obligations 6,954 9,193
Borrowings and financing 112,500 79,420
Taxes in installments 815 1,865
Provision for civil, labor and tax risks 24,636 15,234
Leasing liabilities 235,273 225,281
Total noncurrent liabilities 380,178 330,992
EQUITY
Capital 1,105,381 1,052,340
Legal reserve 119,136 37,384
Earnings reserves 0 -
Retained earnings (accumulated losses) (53,041) -
Total equity 1,171,476 1,089,724
TOTAL LIABILITIES AND EQUITY 2,140,697 1,879,529
26 | VIVARA | APPENDICESCASH FLOW
Cash Flow (R$ ,000) 4Q20 4Q19* ∆% 2020 2019* ∆%
Net Income 93,182 92,648 0.6% 146,672 *
318,251 -53.9%
Adjust of Net Income 45,049 28,478 58.2% 99,621 (34,520) 388.6%
Adjusted profit for the year 138,231 121,126 14.1% 246,294 283,730 -13.2%
Increase (decrease) in operating assets and liabilities:
Trade receivables (183,810) (239,521) 23.3% 15,705 (212,308) 107.4%
Inventories 101 18,251 -99.4% (18,593) 1,654 -1224.4%
Trade payables 44,159 6,259 605.5% 16,777 (9,782) 271.5%
Recoverable taxes 9,223 (812) 1235.3% 38,305 (12,226) 413.3%
Taxes payable 67,989 44,465 52.9% 19,353 14,170 36.6%
Other assets and liabilities 2,550 58,262 - -95.6% (21,426)- 45,672- - -146.9%
Cash provided by operating activities 78,443 8,029 877.0% 296,413 110,910 167.3%
Income tax and social contribution paid (7,950) (22,627) 64.9% (17,077) (48,823) 65.0%
Paid interest on borrowing and financing (1,731) (3,135) 44.8% (9,241) (17,560) 47.4%
Interest paid on leasing liabilities (1,454) -- na (18,002)- -- na
Net cash provided by operating activities 67,308 (17,733) 479.6% 252,093 44,528 466.1%
Property, plant and equipment (7,067) (20,295) 65.2% (40,782) (29,309) -39.1%
Intangible assets 97 (815) 111.9% (3,929) (5,582) 29.6%
Others (131,771) 11,161 na- (224,601)- 2,461- - na
Cash Flow from Investments (138,740) (9,949) -1294.5% (269,313) (32,430) -730.5%
Interest on capital / Dividends paid (35,563) -- (35,563) --
Borrowings and financings 68,900 (8,094) 951.2% 85,185 49,447 72.3%
Righ-of-use leases (4,001) (18,053) 77.8% (12,540) (47,640) 73.7%
Others - 401,970
3,630,176 na
-100.0% 21,612- 337,158- - -93.6%
Cash flow from financing activities 29,336 375,823 -92.2% 58,695 338,966 -82.7%
INCREASE (DECREASE) IN CASH AND CASH EQUIV. (42,095) 348,141 -112.1% 41,475 351,064 - -88.2%
Opening balance of cash and cash equivalents 519,414 87,704 492.2% 435,844 84,781 414.1%
Closing balance of cash and cash equivalents 477,319 435,844 9.5% 477,319 435,844 9.5%
*Vivara Participações S.A. was incorporated on May 23, 2019, therefore information related to 2019 refers to the combined information of the
subsidiaries Tellerina and Conipa.
27 | VIVARA | APPENDICESNON-ACCOUNTING MEASURES
Adjusted EBITDA and Adjusted EBITDA Margin - Earnings Before Interest, Taxes, Depreciation and
Amortization (EBITDA) is a non-accounting measurement disclosed by the Company in compliance with
CVM Instruction 527/12. The above calculation is adjusted to eliminate non-recurring effects from the
result and, to improve comparison, the effects from the adoption of CPC 06/IFRS 16, which came into
effect on January 1, 2019, are also excluded, with such adjustments resulting in Adjusted EBITDA. Non-
recurring effects are characterized by one-time effects on the Company's result. Since these amounts are
not a recurring portion of the result, the Company opts to make the adjustment so that Adjusted EBITDA
considers only recurring numbers. The Company uses Adjusted EBITDA as a measure of performance
for managerial purposes and for comparisons with peers.
Net Debt - The Net Debt shown here is the result of the sum of short- and long-term loans in Current
Liabilities and Non-Current Liabilities of the Company, subtracted from the sum of Cash and Cash
Equivalents and Securities under the Current Assets and Non-Current Assets of the Company.
The Company believes that the Net Debt/Adjusted EBITDA ratio helps in assessing its leverage and
liquidity. LTM Adjusted EBITDA is the sum of EBITDA in the Last Twelve Months and is also an
alternative to operational cash generation.
Adjusted EBITDA, Net Debt, Net Debt/LTM Adjusted EBITDA and Operational Cash Generation
presented in this release are not profitability measures as per the accounting practices adopted in Brazil
and do not represent the cash flow during the periods and, hence, should not be considered alternative
measures to results or cash flows
Operating Cash Generation shown here is a managerial measurement, resulting from the cash flow
from operating activities presented in the Statement of Cash Flow (adjusted by “Lease of Right-of-Use
Assets,” which, after the adoption of CPC 06 / IFRS 16, is booked in the Statement of Cash Flow under
financing activities.
28 | VIVARA | APPENDICESYou can also read