Enviva Partners, LP Business Overview - (NYSE: EVA)

Page created by Benjamin Schultz
 
CONTINUE READING
Enviva Partners, LP Business Overview - (NYSE: EVA)
Enviva Partners, LP          (NYSE: EVA)
Business Overview
Last Updated: May 10, 2021
Enviva Partners, LP Business Overview - (NYSE: EVA)
FORWARD-LOOKING AND CAUTIONARY STATEMENTS

Forward-looking statements

This presentation contains “forward-looking statements” within the meaning of the securities laws. All statements, other than statements of historical fact, included in this presentation that
address activities, events or developments that Enviva Partners, LP (NYSE: EVA) (“Enviva,” the “Partnership,” “we,” or “us”) expects, believes or anticipates will or may occur in the future
are forward-looking statements. The words “believe,” “expect,” “may,” “estimates,” “will,” “anticipate,” “plan,” “intend,” “foresee,” “should,” “would,” “could,” or other similar expressions are
intended to identify forward-looking statements, which are generally not historical in nature. However, the absence of these words does not mean that the statements are not forward-
looking.

These statements are based on certain assumptions made by Enviva based on management’s expectations and perception of historical trends, current conditions, anticipated future
developments, and other factors believed to be appropriate. Although Enviva believes that these assumptions were reasonable when made, because assumptions are inherently subject
to significant uncertainties and contingencies that are difficult or impossible to predict and are beyond its control, Enviva cannot give assurance that it will achieve or accomplish these
expectations, beliefs, or intentions. A number of the assumptions on which these forward-looking statements are based are subject to risks and uncertainties, many of which are beyond
the control of Enviva, and may cause actual results to differ materially from those implied or expressed by the forward-looking statements. These risks and uncertainties include the
factors discussed or referenced in our filings with the Securities and Exchange Commission (the “SEC”), including the Annual Report on Form 10-K and the Quarterly Report on Form 10-
Q most recently filed with the SEC, including those risks relating to financial performance and results, economic conditions and resulting capital restraints, availability of sufficient capital
to execute Enviva’s business plan, the ability of Enviva to complete acquisitions and realize the anticipated benefits of such acquisitions, impact of compliance with legislation and
regulations, the continued impact of COVID-19, and other important factors that could cause actual results to differ materially from those projected. When considering the forward-looking
statements, you should keep in mind the risk factors and other cautionary statements in such filings.

You are cautioned not to place undue reliance on forward-looking statements, which speak only as of the date on which such statement is made, and Enviva undertakes no obligation to
correct or update any forward-looking statement, whether as a result of new information, future events or otherwise, except as required by applicable law. All forward-looking statements
attributable to Enviva are qualified in their entirety by this cautionary statement.

Industry and market data

This presentation has been prepared by Enviva and includes market data and other statistical information from third-party sources, including independent industry publications,
government publications or other published independent sources. Although Enviva believes these third-party sources are reliable as of their respective dates, Enviva has not
independently verified the accuracy or completeness of this information. Some data is also based on Enviva’s good faith estimates, which are derived from its review of internal sources
as well as the third-party sources described above.

                                                                                                                                                                                           2
Enviva Partners, LP Business Overview - (NYSE: EVA)
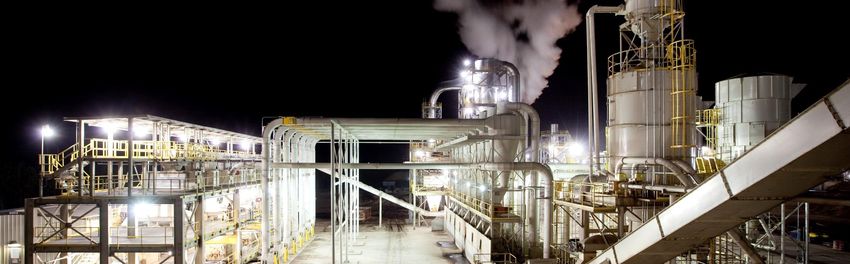
ENVIVA: HIGH GROWTH AND DURABLE LONG-TERM CASH FLOWS

                                                                                                                    1
                                  ~5.4 Million MTPY                                                                                                                                         Fully Contracted
                   World’s largest utility-grade wood pellet producer                                                                                                             $14.5 Billion / 12.8 years at the Partnership3
                            Committed to net zero by 20302                                                                                                                          $20 Billion / 14.2 years enterprise-wide4

                                                                                                                                   5
Distribution per Unit of $3.17+                                                                                                                               Conservative Financial Policy
           23 consecutive distribution increases6                                                                                                                 50/50 equity/debt structure, 3.5 – 4.0x Leverage Ratio,
     12% CAGR7 and 26% annualized total return7 since IPO                                                                                                         and 1.20x forward-looking annual distribution coverage8

             Robust Long-Term Demand                                                                                                                                                         3+ Million MTPY
Driven by global commitment to phase out coal, limit the impact                                                                                          Visible drop-down pipeline supported by well capitalized Sponsor
   of climate change, and achieve net zero GHG emissions

1) The Partnership’s expected production capacity includes nameplate capacity of approximately 600,000 metric tons per year (“MTPY”) for the wood pellet production plant in Greenwood, South Carolina (the “Greenwood plant”) after completion of the expansion project, and excludes expansion
projects underway at the Sampson, Hamlet, and Cottondale plants (the “Multi-Plant Expansions”); 2) On February 17, 2021, the Partnership and Enviva Holdings, LP (our “sponsor”) announced our goal of achieving net zero greenhouse gas (“GHG”) emissions in our operations by 2030; 3) As
of April 1, 2021, excluding volumes under the contracts between long-term off-take customers and our sponsor; 4) As of April 1, 2021, including all volumes under the contracts between long-term off-take customers and the Partnership and our sponsor; 5) As of April 28, 2021, the Partnership
expects to distribute at least $3.17 per common unit for full-year 2021, before considering the benefit of any acquisitions or drop-down transactions; 6) As announced on April 28, 2021, the board of directors of our general partner (the “Board”) declared a distribution of $0.785 per common unit
for the first quarter of 2021; 7) 2015 - 2021 Compound Average Growth Rate (“CAGR”) utilizes $1.65 minimum quarterly distribution per unit for 2015 and $3.17 distribution per unit for 2021. The annualized total return for the Partnership’s common units since the Partnership’s IPO is per
Bloomberg data, as of April 30, 2021; 8) The Partnership targets a 50/50 equity/debt capital structure for drop-downs, acquisitions, and major expansions, a total ratio of net debt to adjusted EBITDA (the “Leverage Ratio”) of 3.5 - 4 times, and a distribution coverage ratio of 1.20 times, on a
forward-looking annual basis. The Partnership’s Leverage Ratio is calculated pursuant to the Partnership’s credit agreement and may reflect the pro forma impact of drop-downs, acquisitions, and major expansions
                                                                                                                                                                                                                                                                                            3
Enviva Partners, LP Business Overview - (NYSE: EVA)
EVA TOTAL RETURN1

450                                                                                                                                                                                                                                336%      0.85

400                                                                                                                                                                                                                                          0.80

350                                                                                                                                                                                                                                          0.75

300                                                                                                                                                                                                                                          0.70

250                                                                                                                                                                                                                                          0.65
                                                                                                                                                                                                                                   127%

200
                                                                                                                                                                                                                                   101%
                                                                                                                                                                                                                                             0.60         Since IPO in
150                                                                                                                                                                                                                                          0.55        2015, EVA has
100
                                                                                                                                                                                                                                  (27%)
                                                                                                                                                                                                                                             0.50         outperformed
50                                                                                                                                                                                                                                           0.45
                                                                                                                                                                                                                                                          the S&P 500
  -                                                                                                                                                                                                                                          0.40
                                                                                                                                                                                                                                                            by 209%2
                                            Quarterly Distribution Per Unit                        EVA               Alerian MLP Index                     MSCI USA IMI ESG                      S&P 500

      1)   As of April 30, 2021. Based on Bloomberg’s total return data, which assumes reinvestment of distributions/dividends. Normalized for comparison purposes;
      2)   2015 - 2021 CAGR utilizes $1.65 minimum quarterly distribution per unit for 2015 and $3.17 distribution per unit for 2021;
      3)   First distribution per unit represents the prorated amount of the Enviva Partners, LP minimum quarterly distribution of $0.4125 per unit, based on the 58 days during the period commencing (and including) May 4, 2015, the date on which the Enviva Partners, LP’s initial
           public offering closed, and ending June 30, 2015, the last day of the second quarter. Actual declared quarterly cash distribution was $0.2630 per common and subordinated unit for the second quarter of 2015;
      4)   MSCI USA IMI ESG Index is a capitalization-weighted index comprised of US-based companies that outperform sector peers on ESG evaluation metrics                                                                                                                               4
Enviva Partners, LP Business Overview - (NYSE: EVA)
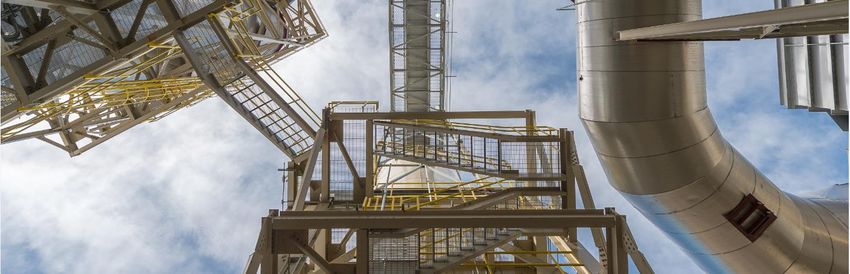
ENVIVA: FIGHTING CLIMATE CHANGE, DISPLACING COAL,1 GROWING MORE TREES2

                              Coal Consumption                                                                                  Wood Pellet                                                                           Strong Forest Inventory Growth
                          Declined by More than Half3                                                                  Consumption More Than Doubled4                                                                  in Enviva’s Sourcing Regions5
                                                                                                                                                                                                              2,500
                  120
                                                                                                                  12                                                                                          2,450

                                                                                                                                                                                                              2,400
                  100
                                                                                                                  10                                                                                          2,350

                  80                                                                                                                                                                                          2,300
                                                                                                                  8

                                                                                                                                                                                                 Million MT
                                                                                                     Million MT
     Million MT

                                                                                                                                                                                                              2,250
                  60
                                                                                                                  6                                                                                           2,200

                                                                                                                                                                                                              2,150
                  40
                                                                                                                  4
                                                                                                                                                                                                              2,100

                                                                                                                                                                                                              2,050
                  20                                                                                              2
                                                                                                                                                                                                              2,000

                   0                                                                                              0                                                                                           1,950
                        2012   2013      2014   2015   2016   2017    2018     2019                                     2012 2013 2014 2015 2016 2017 2018 2019                                                        2012 2013 2014 2015 2016 2017 2018 2019
                               Belgium      Denmark      Netherlands         UK

                  Through Q1-2021, Wood Pellets Supplied by the Partnership and our Sponsor have Effectively Displaced 21 Million MT6 of Coal
 With Existing Contracts Running Through 2045, the Partnership and our Sponsor are on Track to Displace Another 90 Million MT of Coal
 1) Increasing the share of biomass on the global grid system is critical to the global energy transition. International Renewable Energy Agency’s “World Energy Transitions Outlook: 1.5○C Pathway (Preview)” report calls for the share of modern biomass for energy generation
 to increase from 3% in 2018 to 18% in 2050, and the share of coal for energy generation to decrease from 11% to 2% over the same period; 2) Landowners in the US South respond to strong markets for forest products by making investments in their forests and there is a
 clear positive relationship between rates of forest harvest and forest acreage, growth, and inventory. Based on FIA data for the US South covering the 70-year period since 1953, Forest2Market concluded that “Increased demand for wood … encouraged landowners to invest
 in productivity improvements that dramatically increased the amount of wood fiber, and therefore the amount of carbon, contained in the South’s forests.” Source: Forest2Market report, “Historical Perspective on the Relationship between Demand and Forest Productivity in
 the US South”, July 2017; 3) Eurostat. Inland coal consumption in key European countries that Enviva serves; 4) Industrial wood pellet demand for Belgium, Denmark, Netherlands and U nited Kingdom. Hawkins Wright: The Outlook for Wood Pellets – Demand, Supply,
 Costs and Prices; 4th quarter 2020; 5) USDA Forest Service, Forest Inventory and Analysis Program. Enviva’s primary sourcing regions consist of the Chesapeake (NC, VA); Wilmington (NC, SC, GA); and Gulf (AL, FL, GA, MS) regions; 6) Metric Tons                                5
Enviva Partners, LP Business Overview - (NYSE: EVA)
SUBSTANTIAL GHG EMISSIONS REDUCTIONS AND LOWEST-COST, DROP-IN RENEWABLE FUEL

   Wood Pellets Provide the Low-Cost, Drop-In Replacement for Coal                                                                                                                 Total System Cost of Electricity in Germany (€ / MWh)3

                                                  Wood Pellet vs. Coal Attributes
                                                                                                                                                                                                                                                                         Solar
                                                                  Wood Pellets¹                                       Southern PRB Coal²
                                                                                                                                                                                                                                                 Onshore Wind
Heat Content (BTU/lb)                                                   8,000                                                   8,600
                                                                                                                                                                                                                                          Biomass
Moisture                                                              4 – 10%                                                26 – 30%                                                                                                    Conversion

Ash                                                                    0 – 2%                                               4.6 – 5.7%                                                                                             CCGT

Sulfur                                                               0 – 0.15%                                                 < 1.0%                                                                                       Biomass Conversion
                                                                                                                                                                                                                                with CHP

                                                                                                                                                                             0€                            50 €                          100 €                          150 €
                              Lifecycle GHG Emissions Reduction vs. Fossil Fuels5

                                                                                                                                                                               Levelized Cost of Electricity in Japan in 2020 (US$ / MWh)4
                               GHG Emissions Reduction                                                   GHG Emissions Reduction
                               in Electricity Generation                                                   in CHP6 Applications
                 1.0                                                                                                                                                                                                                                                     Solar
                 0.8
    kgCO2e/kWh

                                                                                                                                                                                                                                                      Wind
                 0.6                                       87%                                                                         94%
                                                                                                                                                                                                                                                 Dedicated Biomass
                 0.4
                                                                     71%
                 0.2                                                                                                                             82%                                                                                CCGT

                 0.0                                                                                                                                                                                                              Biomass
                                                                                                                                                                                                                                  Co-Firing

                                                                                                                                                                              $0                  $50                $100                 $150                 $200                  $250

1) Enviva estimates; 2) Source: Union Pacific; 3) Aurora Energy Research – Biomass conversions & the system cost of renewables (November 2016). Total System Cost of Electricity (TSCE) is the per-megawatt hour cost of building and operating a generating plant over an
assumed financial life including intermittency, security of supply, balancing, grid expansion, and heat adjustment (applicable for CHP only). Data is for Germany and may not be representative of all the markets in which we or our customers operate. CHP is Combined Heat &
Power. Expansion costs are related to the electricity grid only. New build CCGT could require gas grid expansions, the cost of which is not included here; 4) IHS Markit: Levelized Cost of Power Generation in Japan, May 8, 2017. Costs are presented in real terms, as of 2020.
In contrast to TSCE, Levelized Cost of Electricity (LCOE) does not include the intermittency costs associated with wind and solar power. LCOE for Dedicated Biomass assumes biomass wood-burning power plants with 112 MW of capacity and 40% efficiency; 5) Boundless
Impact Investing: “Life-cycle assessment of U.S. biomass supply and the role of biomass electricity for meeting UK emission objectives”; 6) Combined Heat and Power                                                                                                                  6
Enviva Partners, LP Business Overview - (NYSE: EVA)
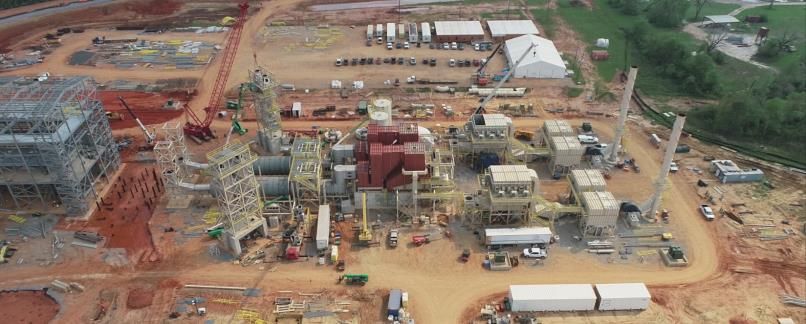
GLOBAL COMMITMENT TO FIGHT CLIMATE CHANGE DRIVES MARKET GROWTH
                               → EU Commission’s taxonomy recognizes bioenergy used for power and heat as making a substantial contribution to climate mitigation, alongside solar and wind
                               → All 27 EU member states agreed to raising EU’s 2030 GHG emission reduction target from 40% to 55%1, as compared to 1990 levels, and RED II2 calls for renewables to account for at
                                 least 32% of EU’s gross consumption by 2030
         EU                    → European Climate Law sets legally binding target of net zero by 20503
                               → The International Renewable Energy Agency specifies that biomass in energy generation needs to increase from 3% in 2018 to 18% in 2050 in order to reach net zero in 20504

                               → Legally binding goal to phase out coal from power generation by 2030 and commitment to a 49% reduction in GHG emissions by 2030, surpassing existing EU target5
                               → One of the first EU countries to announce plans to eliminate natural gas from its energy mix
NETHERLANDS                    → Long tradition of supporting renewable energy, including biomass, which is its largest source of renewable energy, via the SDE, SDE+, and SDE++ programs

                              → Largest user of coal in the EU with more than 170 million metric tons consumed in 20196; recently passed the Coal Exit Law7 mandating complete phase-out of coal-fired power
                                generation by 2038, shutting down or converting 43.9 GWs of coal capacity to alternative fuels, and targets phase-out of 9.5 GWs8 of nuclear generation by 2022
  GERMANY                     → Regulations for long-term financial support for electricity and heat conversions from fossil fuels to biomass expected to be announced mid-year 2021

                              → Long-time leader in renewable energy targeting 15% of energy supply to come from bioenergy by 2050 and recently raised its commitment to cut GHG emissions to at least 68% by
                                2030, as compared to 1990 levels9
                              → Strong commitment to bioenergy as a source of heat and power and support of Bioenergy with Carbon Capture and Storage (BECCS) as a key negative carbon-emissions solution
         UK                   → New Industrial Decarbonization Strategy outlines framework for industries to switch from fossil fuels to low-carbon alternatives such as biomass

                              → METI10 targets ~6 - 7.5 GWs of biomass generation by 2030, equivalent to ~15 - 20 million MTPY of demand11; 20-year FiT12 support with requirement to use biomass for another 20
                                years
                              → METI is working to revise its Strategic Energy Plan by mid-2021, which is expected to increase the share of renewable power in the 2030 energy mix to 45%, from the 22% - 24% under
      JAPAN                     the current plan13
                              → Prime Minister Yoshihide Suga pledged that the country would be net zero by 2050; METI targets 50% - 60% of the nation’s power supply to be renewable by 205014
                              → Taiwan is currently one of the largest coal consumers in Asia, and the government is actively pursuing decarbonization of its energy supply chain
                              → Our sponsor recently hired a development team to support business and policy progress, and to assist major utilities and power generators with evaluating and effecting profitable
     TAIWAN                     conversions of assets from coal-to-biomass-fired generation

                              → President Biden committed to achieve a 50% - 52% reduction in GHG emissions by 203015
                              → New target contemplates expanding carbon capture in industrial processes for cleaner steel and cement and enhancing carbon sinks like our forests
          US
 1) The European Commission sets out goals for Europe’s economy and society to become climate-neutral by 2050 in the European Green Deal; 2) Renewable Energy Directive II; 3) The European Climate Law aims to write into law the goals set out in the European Green
 Deal; 4) International Renewable Energy Agency’s “World Energy Transitions Outlook: 1.5○C Pathway (Preview)”, March 2021; 5) The Government of the Netherlands commits to climate goals in the Climate Act (May 28, 2019); 6) Source: Enerdata: coal and lignite domestic
 consumption. Germany consumed 171 million tons of coal and lignite in 2019; 7) On July 3, 2020, Germany’s Bundestag passed the Coal Exit Law 19/20730; 8) Gigawatts; 9) UK’s Climate Change Act 10) Ministry of Economy, Trade and Industry; 11) Estimated demand for        7
 biomass of 15 to 20 million MTPY is based on Enviva’s estimates assuming power plant efficiencies similar to existing European customers. Actual biomass consumption at Japanese power plants may vary; 12) Feed-in-Tariff; 13) Japan’s Strategic Energy Plan outlines the
 direction of Japan's energy policy governed by the Basic Act on Energy Policy; 14) Japan’s Green Growth Strategy; 15) Announced on April 22, 2021 as part of the Leaders Summit on Climate
Enviva Partners, LP Business Overview - (NYSE: EVA)
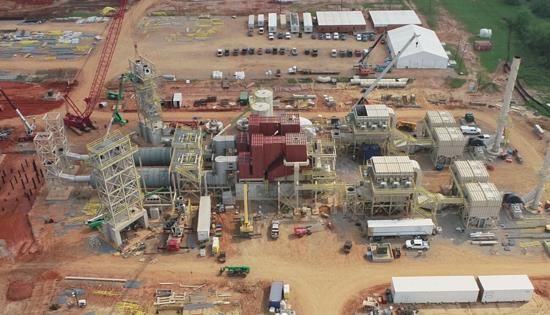
STRATEGICALLY LOCATED PRODUCTION1 AND TERMINAL ASSETS
                                                                                                                                                                                               THE CHESAPEAKE CLUSTER
                                                                                                                                                                                       Port of Chesapeake, VA          Southampton, VA            Southampton: 760,000 MTPY2
                                                                                                                                                                                                                                                  Northampton: 750,000 MTPY2
           Port of Mobile, AL                Amory, MS
                                                                                                                                                                                                                                                  Ahoskie: 410,000 MTPY
                                                                                                                                                                                                                                                  Port of Chesapeake: 2.5 million MTPY
                                                                                                                                          Port of Chesapeake, VA                                                                                  throughput capacity
                                                                                                      Southampton, VA
                                                                                                                                                                                          Northampton, NC                 Ahoskie, NC
                                                                                                   Northampton, NC
                                                                                                                                      Ahoskie, NC
      Amory: 115,000 MTPY
      Port of Mobile: Flex barge storage
      with 45,000+ metric tons of capacity                                                  Hamlet, NC                           Sampson, NC

                                                                                                                                    Port of Wilmington, NC

                                                                                  Greenwood, SC

                                                                                                                                                                                                         THE WILMINGTON CLUSTER
                                                                                                                                                                     Port of Wilmington, NC             Hamlet, NC                 Sampson, NC                Greenwood, SC
                                                    Amory, MS
                                                                                                               Port of Savannah, GA
                                                                                  Waycross, GA

                                                                                  Cottondale, FL                                                                                                                                                       Greenwood: 500,000 MTPY3
                                                                                                                                                                                                                                                       Hamlet: 600,000 MTPY
                                                                                                                                                                                                                                                       Sampson: 600,000 MTPY
                                                                                                                                                         THE SAVANNAH CLUSTER
                                           Port of Mobile, AL                                                                                                                                                                                          Port of Wilmington: 3 million
                                                                                                                                                 Port of Savannah, GA            Waycross, GA                                                          MTPY throughput capacity

                                     Cottondale, FL          Port of Panama City, FL

                                                                                                                                                                                                                                             Plants
                                                                                                                                               Waycross: 800,000 MTPY
                                                                                                                                                                                                                                             Terminals
                                                                                                                                               Port of Savannah: ~1.5 million MTPY of
                                                                                                                                               throughput capacity
                              Cottondale: 780,000 MTPY
                              Port of Panama City: Warehouse storage
                              with 32,000 metric tons of capacity

 1)   Volumes related to plants represent production capacity at each facility;
 2)   Includes increased production capacity pursuant to the ongoing expansion projects (the “Mid-Atlantic Expansions”) at the wood pellet production plants in Northampton, North Carolina (the “Northampton plant”) and Southampton, Virginia (the “Southampton plant”).
      The Partnership continues to expect each plant to reach its expanded nameplate production capacity of 750,000 MTPY and 760,000 MTPY, respectively, by the end of 2021;
                                                                                                                                                                                                                                                                              8
 3)   The project to expand the Greenwood plant’s production capacity to 600,000 MTPY is expected to be completed by year-end 2021
Enviva Partners, LP Business Overview - (NYSE: EVA)
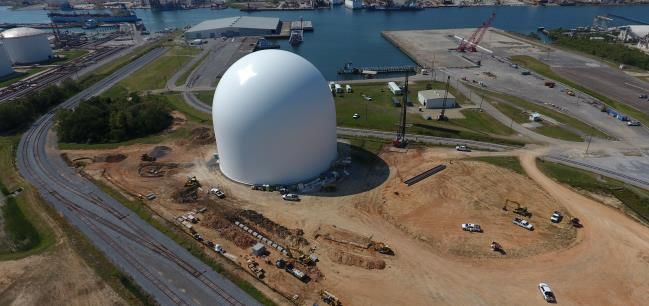
UNPARALLELED GLOBAL SCALE PROVIDES DURABLE COMPETITIVE ADVANTAGES

                                                                                                              ▪ A “build and copy” approach allows for highly-efficient, large-scale production facilities
   Enviva is the world’s largest supplier
                                                                                                                and creates operating leverage
  of utility-grade wood pellets in a highly
                                                                                                              ▪ Multi-plant profile and global scale translate into superior reliability and opportunities for
   fragmented industry with numerous                                                                            optimization
        small, single-plant operators                                                                         ▪ Access to robust fiber baskets allows for reliable raw material supply and a flat marginal
                                                                                                                cost curve for incremental production

                                                                                                                                                                                                                                                                              # of
Production Capacity (Thousand MTPY)                                                      0       500      1,000 1,500 2,000 2,500 3,000 3,500 4,000 4,500 5,000 5,500 6,000 6,500 7,000 7,500 8,000 8,500 Plants1                                                                         Region

            INDEPENDENT                                              Enviva                                                                                                                                                                                                   12           U.S.
            GLOBAL ENTERPRISE
            SUPPLIERS                                              Graanul Invest                                                                                                                                                                                             12      Baltics/U.S.

            VERTICALLY-INTEGRATED                                              Drax3                                                                                                                                                                                          17     Canada/U.S.
            ENERGY GENERATOR

                                                                      An Viet Phat                                                                                                                                                                                             2          Vietnam

                                                                              FRAM                                                                                                                                                                                             4           U.S.

            SMALL & REGIONAL                                     Highland Pellets                                                                                                                                                                                              3           U.S.
            SUPPLIERS                                                                                                                          As the world’s largest supplier of utility-
                                                                                                                                                                                                                                                                               3     South Korea
                                                                        SY Energy                                                            grade wood pellets, Enviva is frequently the
                                                                                                                                               sole-source supplier for our customers
                                                               Pacific BioEnergy                                                                                                                                                                                               3          Canada

                                                                                                                                                                                                                                                              2022

    1) Enviva’s total production capacity and number of plants are based on nameplate capacities of our existing operating plants, the Greenwood plant after completion of the expansion project, a wood pellet production plant in Lucedale, Mississippi (the “Lucedale plant”), which
    is currently under construction by our sponsor, a wood pellet production plant in Epes, Alabama (the “Epes plant”), which is currently under development by our sponsor, the Multi-Plant Expansions, and embedded expansion options at the Lucedale and Epes plants. Also
    included in the number of plants is a site in Bond, Mississippi (the “Bond Plant”), which our sponsor controls and which is currently in the early stages of the development process. We expect to have the opportunity to acquire assets or completed development projects from
    our sponsor in the future. Production capacity and number of plants for other pellet producers are based on Hawkins Wright: The Outlook for Wood Pellets – Demand, Supply, Costs and Prices; first quarter 2021; 2) Includes the Bond Plant. We expect to have the opportunity         9
    to acquire assets or completed development projects from our sponsor in the future; 3) On April 13, 2021, Drax Group plc (“Drax”) through its wholly-owned subsidiary, Drax Canadian Holdings Inc., acquired all of the issued and outstanding common shares of Pinnacle
    Renewable Energy Inc. (“Pinnacle”)
Enviva Partners, LP Business Overview - (NYSE: EVA)
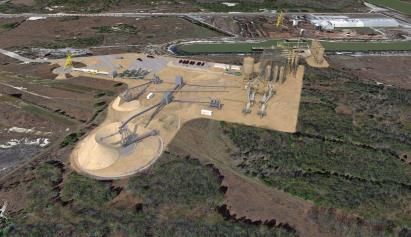
COMMITMENT TO NET ZERO IN OUR OPERATIONS BY 2030

                                                                                   6%
                        direct emissions from assets owned                                                                Transparency and Reporting
      Scope 1           and controlled by Enviva
                                                                                                                 • Track and report annually on all emissions

                                                                                                                 • Commit to disclose climate-relevant data
                        indirect emissions from heat, steam                        Our 2019
      Scope 2                                                          41%        Emissions          53%           and risks through CDP (formerly the Carbon
                        or electricity purchased by Enviva                                                         Disclosure Project) by the end of 2022

                        indirect emissions in Enviva’s
      Scope 3           upstream or downstream value chain

                   For Scope 1 Emissions                                 For Scope 2 Emissions                                For Scope 3 Emissions

     • Immediately work to minimize the emissions          • Source 100% of energy for our operations from      • Proactively engage with partners and other key
       from fossil fuels used directly in our operations     renewable sources by 2030, with interim target       stakeholders to adopt clean-energy solutions,
                                                             of at least 50% by 2025                              including trucking, rail, and shipping logistics
     • Offset 100% of our residual emissions through
       investments in projects that result in real,        • Maximize use of on-site renewable energy           • Take steps to accelerate and advocate for the
       additional, and third-party verified net-carbon       generation at our facilities, as well as develop     development of new solutions and to work
       reductions                                            new off-site renewable energy resources              with stakeholders to bring those solutions to
                                                             physically located in our operating regions          market
     • Focus on forest offsets in partnership with           where possible
       Finite Carbon and others

            The Partnership and Our Sponsor Commit to the Goal and Plan to Become Net Zero in Our Operations by 2030

                                                                                                                                                                     10
KEY BASIS DIFFERENTIAL & STABLE COSTS DRIVEN BY ROBUST NATURAL RESOURCE GROWTH

                                            Raw Material (Wood Chip) Price US$ / Dry Ton1                                                                                                                       Global Wood Fiber
                                                                                          $156
                                                                                                                                                                                                                Supply Advantages
                                                                               $141
                                                                                                Latvia                                                                      $141
                                                                                                                                                                                                                 Exist in the U.S.
                                                                   Germany
                                                                                                                                                                                 Japan
                                                                                                                                                                                                                    Southeast
           $62

                                                                                                                                                                                                         ▪ For every ton of wood harvested from
                                                                                                                                                                                                           the working forests of the U.S.
                Southern US                                                                                                                                                                                Southeast, ~1.7 tons grow back each
                                                                                                                                                                                                           year2
                                                                                                                                                                                                         ▪ Only ~2.5% of the forest area is
                                                                                                                                                                                                           harvested each year in the U.S.
                                      $148                                                                                                                                                                 Southeast, of which less than 3% is
                                                                                                                                                                                                           used to produce wood pellets3
                                              Brazil                                                                                                                                                     ▪ Over 100,000 private landowners in
                                                                                                                                                                                                           the U.S. Southeast, with only a few
                                                                                                                                                                                                           buyers (like Enviva) of low-grade fiber
                                                                                                                                                                                                         ▪ Long-term, stable cost given abundant
                                                                                                                                                                                                           supply and few buyers for low-grade
                                                                                                                                                                                                           fiber

      1)   All data except data for Brazil are from RISI World Timber Price Quarterly – Preliminary data for the fourth quarter of 2020 updated on January 25, 2021. The wood chip price for Latvia is based on CIF Sweden. Data for Brazil is from Forest2Market -
           the cost of delivered wood chips in Brazil is approximately US$41-$43 per green metric ton. The primary in-country market for these chips is the food production and crop industries, which use chips for heat and drying purposes. However, the average
           minimum FOB price in Brazil is around US$148 per dry metric ton due to the logistical and administrative costs related to exporting these chips;
      2)
      3)
           FIA UDSA Forest Service Forest Inventory and Analysis Database;
           Forest2Market: “Historical Perspective on the Relationship between Demand and Forest Productivity in the US South,” 2017
                                                                                                                                                                                                                                                                      11
U.S SOUTHEAST | NEGATIVE DEPLETION RESOURCE DRIVES STABLE COSTS
                     Fragmented, Natural Resource Supply Base                                                                                                                                                        Net Fiber Growth After All Uses2
                                                                                                                                                                                                                                                                                    CHESAPEAKE SOURCING
                                                                                                                                                                                                                                                                              1,030       REGION

                                                                                                                                                                                                                                                        Million MT of Wood
                                                                                                                                                                                                                                                                               980

                                                                                                                                                                                                                                                              Inventory
                                                                                                                                                                               GULF SOURCING                                                                                   930
                                                                                                                                                                        740       REGION             9%                                                                        880
                                                                                                                                                                                                                                                                                                      20%

                                                                                                                                                   Million MT of Wood
                                                                                                                                                                        720

                                                                                                                                                         Inventory
                                                                                                                                                                                                                                                                               830
                                                                                                                                                                        700                                                                                                       2012 2013 2014 2015 2016 2017 2018 2019

                                                                                                                                                                        680
                                                                                                                                                                                                                                                                                    WILMINGTON SOURCING
                                                                                                                                                                        660
                                                                                                                                                                                                10%                                                                           740          REGION
                                                 Northampton

                                                                                                                                                                                                                                                         Million MT of Wood
                                                                                                                                                                           2012 2013 2014 2015 2016 2017 2018 2019
                                                                                                                                                                                                                                                                              700

                                                                                                                                                                                                                                                               Inventory
                                                                                                                                                                                                                                                                              660

                                                                                                                                                                                                                                                                              620
                                                                                                                                                                                                                                                                                                    15%
                                                                                                                                                                                                                                                                                                     15%
                                                                                                                                                                                                                                           $148                               580
                                                                                                                                                                                                                                                                                 2012 2013 2014 2015 2016 2017 2018 2019
                                     75 mi.

                                                                                                                                                 $50                                                    Long-term, Stable Delivered Cost of Fiber3
                                                                                                                                                                                                                              US$ / green ton
                                                                                                                                                 $40
                         Hardwood Roundwood                    Pine Roundwood                   Open / Farmland
                                                                                                                                                 $30

                                                                                                                                                 $20
       ▪ 100,000+ private landowners                                      ▪ ~1.3 million tons annual facility
                                                                            demand                                                               $10
       ▪ Only a few buyers of low-grade fiber,
                                                                                                                                                                                                                         North Carolina Pulpwood
         which only cost-effectively travels                              ▪ ~13.7 million tons net annual fiber                                    $0
         ~75 miles                                                          excess1                                                                                     '00 '01 '02 '03 '04 '05 '06 '07 '08 '09 '10 '11 '12 '13 '14 '15 '16 '17 '18 '19 '20 '21

       For Every Ton of Wood Harvested from the Working Forests of the U.S. Southeast, Approximately 1.7 Tons Grow Back Each Year4
     Only ~2.5% of the Forest Area is Harvested Each Year in the U.S. Southeast, of Which Less Than 3% is Used to Produce Wood Pellets5
1) FIA Data (EVALIDator; 2019): In the last year where state forest inventory data is available, total wood fiber within the fiber sourcing area for the Partnership’s Northampton plant grew by approximately 30.4 million tons and total harvest removals were approximately
16.7 million tons, resulting in 13.7 million tons of excess fiber; 2) FIA Data; 3) Timber Mart South – North Carolina Q1 2021; 4) Source: FIA UDSA Forest Service Forest Inventory and Analysis Database; 5) Source: Forest2Market: “Historical Perspective on the
Relationship between Demand and Forest Productivity in the US South,” 2017
                                                                                                                                                                                                                                                                                                                12
ENVIVA’S ACTIVITIES SUSTAIN THRIVING, HEALTHY FORESTS

      Sponsor’s Track & Trace® Program, a first-of-its-kind system, is an important element of our responsible wood
               supply program and provides unprecedented transparency into our procurement activities

                                                                                                                                                                                Our Wood Came from These Sources:2
       Between 2010, when Enviva opened its first U.S. plant, and
                                                                                                                                                                             25%                                                                   35%
      2019, forest inventory in our supply base increased by more                                                                                                       Mixed pine &                                                       Pine forests with
                                                                                                                                                                      hardwood forests                                                   hardwood understory3
                       than 400 million metric tons
      Forest data analytics demonstrate increased harvests and
      healthy markets increase growth in forest acreage, timber
LONG-TERM, TAKE-OR-PAY OFF-TAKE CONTRACTS DELIVER STABLE CASH FLOWS                                                                                                $20 0

                                Typical Contract Provisions1                                                                                                      Illustrative Passthroughs and Escalators2
                                                                              Major utilities and investment
  Counterparty                                                                                                                                                     $16 0

                                                                               grade-rated trading houses
                                                                                                                                                     Fixed, back-to-
                                                                                                                                                     back shipping                              Shipping
  Term                                                                                   Up to 20 years                                              component with
                                                                                                                                                     bunker fuel
                                                                                                                                                     passthrough
                                                                                                                                                                                               Bunker Fuel
  Take-or-Pay                                                                                     Yes                                                              $12 0

                                                                                                                                                                                                                          1

  Termination Make-Whole                                                                          Yes

                                          Margin Protection1                                                                                                                                                                  Price escalators
                                                                                                                                                                    $80

                                                                                                                                                                                                                              protect against
  Price escalators                                                                                Yes                                                                                          Base Price                     erosion of
                                                                                                                                                                                                                              underlying cost
  Fiber / diesel passthroughs                                                      Yes, in some contracts                                                                                                                     position and provide
                                                                                                                                                                                                                              opportunity for
                                                                             Fixed with matching long-term                                                                                                                    margin expansion
  Shipping costs
                                                                                   shipping contracts                                                               $40

  Bunker fuel passthrough                                                                         Yes                                                      Can include
                                                                                                                                                       stumpage, diesel or
                                                                             Provisions designed to protect                                             other adjustments
  Changes in Law / Government Regulations                                       against changes in law /
                                                                                government regulations                                                               $0
                                                                                                                                                                                                 Other
                                                                                                                                                                                                   Traditional Pulpwood

                                Production Capacity Matched with Robust Long-Term Contracts with High-Credit Counterparties
         1)   Note: off-take contract terms are examples of various provisions within our portfolio of contracts. No single contract in our portfolio contains every provision listed above;
         2)   Not representative of all contracts with regard to stumpage and diesel passthroughs
                                                                                                                                                                                                                                           14
INCREASINGLY DIVERSE CUSTOMER BASE FURTHER ENHANCES STABILITY

              2020 Off-Take Contract Mix1                                                                                      2025 Off-Take Contract Mix3

                                                                                                                   Other Creditworthy Japanese
                                                                                                                   Customers
                                                                                                                                                                                Drax
                                                                                                                                                                                                                               ~50% from Japanese
                                                                                                             Toyota Tsusho
                      Other                                                                                                                                                                                                    customers with largest
                                                                                                              Suzukawa
                                                                                                                                                                                                                               customer representing
                                                                                                           Sumitomo
                                                                                                           Forestry                                                                                                           ~15% of the contract mix
                                                                           Drax                                                                                                                        Lynemouth                     by 20253
     Orsted

                                                                                                       Sumitomo

             Lynemouth
                                                                                                                  Ichihara
                                                                                                                                                                                                 MGT                            $14.5 Billion / 12.8 years
                                                       Engie
                                                                                                                                                                                                                                          at the Partnership2
                                                                                                                        Marubeni
                                                                                                                                                                               Orsted
                                                                                                                                                                       Engie
                                                                                                                                             Mitsubishi                                                                           $20 Billion / 14.2 years
                                                                                                                                                                                                                                             enterprise-wide3
                         ~4.3 million MTPY                                                                                              ~7.1 million MTPY3

1)   Represents the Partnership’s sales in 2020;
2)   As of April 1, 2021, excluding volumes under the contracts between long-term off-take customers and our sponsor;
3)   As of April 1, 2021, including all volumes under the contracts between long-term off-take customers and the Partnership and our sponsor. Although the Partnership expects to have the opportunity to acquire these contracts from our sponsor, there can be no guarantee
                                                                                                                                                                                                                                                                                15
     that we will acquire these, or any, contracts from our sponsor
THREE PILLARS OF GROWTH

              Organic Growth within the                                                                            Accretive Drop-Downs                                                                           Third-Party Acquisition
                    Partnership                                                                                     from Our Sponsor4                                                                                  Opportunities

  ▪    Pricing increases and escalators under existing                                          ▪       Five drop-downs since IPO, including 2.3 million                                         ▪      Proven, successful, and selective acquirer
             Organic
       contracted         Growth within
                   position                                                                             MTPY of production capacity and 3.0 million
                        the Partnership                                                                 MTPY of terminaling capacity                                                             ▪      Acquisitions must compare favorably to sponsor
  ▪    Construction of 400,000 MTPY aggregate                                                                                                                                                           development pipeline and drop-down economics
       production capacity expansion completed at
                                                                                                ▪       Construction of the fully contracted Lucedale
       Northampton and Southampton plants
                                                                                                        plant and the Pascagoula terminal                                                        ▪      Target opportunities must be core to the
          ▪      ~$130 million investment and ~$28-$32                                                                                                                                                  business and bring new customer set, strategic
                 million in expected incremental adjusted                                       ▪       Development of the fully contracted wood pellet                                                 capability and / or geographic diversification
                 EBITDA annually1,3                                                                     production plant in Epes, Alabama
                                                                                                                                                                                                 ▪      The Partnership acquired the Cottondale plant in
  ▪    On track to expand Greenwood to 600,000
                                                                                                ▪       Announced development of a site in Bond,                                                        January 2015 and the Waycross plant in July
       MTPY production capacity by year-end 2021                                                                                                                                                        2020
                                                                                                        Mississippi for a potential new plant
  ▪    Expansion projects underway at the Sampson,
       Hamlet, and Cottondale plants                                                            ▪       Evaluation of additional sites for pellet production                                     ▪      Our sponsor acquired the Greenwood plant in
                                                                                                        plants and deep-water marine export terminals                                                   2018. The Partnership acquired the Greenwood
          ▪      ~$50 million expected investment and ~$20
                                                                                                        across the U.S. Southeast to serve the balance of                                               plant from our sponsor in 2020
                 million in expected incremental run rate
                 adjusted EBITDA annually2,3
                                                                                                        the $5.5 billion in current long-term contracted
                                                                                                        demand at our sponsor, which is complemented
  ▪    Anticipated annual organic growth driven by                                                      by material contract volumes under negotiation
       contract price escalations, cost reductions and                                                  with utilities and power generators in current and
       productivity improvements                                                                        evolving markets around the globe

  1)   The estimated incremental adjusted EBITDA that can be expected from the expansions is based on an internal financial analysis of the anticipated benefit from the incremental production capacity at the Northampton and Southampton production plants;
  2)   The estimated incremental adjusted EBITDA that can be expected from the expansions is based on an internal financial analysis of the anticipated benefit from the incremental production capacity and cost savings at our wood pellet production plants in Sampson, NC
       (the “Sampson plant”), Hamlet, NC (the “Hamlet plant”), and Cottondale, FL (the “Cottondale plant”), subject to receiving the necessary permits. The Partnership expects to complete the expansion projects by the end of 2022;
  3)   For an explanation of why we are unable to reconcile the estimated adjusted EBITDA for the Mid-Atlantic Expansions and the Multi-Plant Expansions to the most directly comparable GAAP financial measures, see Appendix;
  4)   Although we expect to have the opportunity to acquire assets or completed development projects and associated contracts from our sponsor in the future, we cannot assure you that our sponsor will be successful in completing their development projects or that we
       will successfully negotiate an agreement with our sponsor to acquire such assets, projects, or associated contracts                                                                                                                                                      16
3+ MILLION MTPY FULLY FINANCED “BUILD AND COPY” SPONSOR DEVELOPMENT PIPELINE
           LUCEDALE, MS                                           EPES, AL

                                                                                                                                                                                                                                 Plants in the Partnership
                                                                                                                                                                                                                                 Plants under construction / development
                                                                                                                                                                                                                                 Plant sites under control
                                                                                                                                                                                                                                 Plant sites under assessment1
                                                                                                                                                                                                                                 Terminals owned or leased by the Partnership
                                                                                                                                                                                                                                 Terminals under construction

  ▪   “Build and copy” production                 ▪   “Build and copy” production
      plant under construction for                    plant under development2
      completion mid-year 20212                                                                                                                                                                                              PORT OF PASCAGOULA, MS
                                                  ▪   Purchased the project site and
  ▪   Located in robust fiber basket                  commenced certain pre-
      region                                          construction activities
  ▪   ~50 miles to Port of Pascagoula             ▪   Finished product to be delivered
                                                      to Port of Pascagoula by barge

                                                                                                                                                                                                                            ▪   “Build and copy” deep-water
                                                                                                                                                                                                                                marine terminal under construction
                                                                                                                                                                                                                                for completion mid-year 20212
               BOND, MS
                                                                                                                                                                                                                            ▪                          20%
                                                                                                                                                                                                                                3+ million MTPY nameplate
                                              ▪    Continued development of a site in Bond,                                                                                                                                     throughput capacity
                                                   MS for a potential new plant2                                                                                                                                            ▪   Multi-modal access by rail, truck,
                                              ▪    Expected to be designed to produce                                                                                                                                           and barge
                                                   between 750k and more than 1 million MTPY                                                                                                                                ▪   Deep berth capable of supporting
                                                                                                                                                                                                                                Panamax vessels
                                              ▪    Production to be delivered to Port of                                                                                                                                                                      15%
                                                                                                                                                                                                                                                               15%
                                                   Pascagoula on a cost-efficient basis

        The Sponsor’s Existing Contracts and Sales Pipeline Support Several Production Plants Around the Pascagoula Terminal
          1)   Assets under assessment are shown at approximate locations;
          2)   Although we expect to have the opportunity to acquire assets or completed development projects and associated contracts from our sponsor in the future, we cannot give assurance that our sponsor will be successful in completing their development
               projects or that we will successfully negotiate an agreement with our sponsor to acquire such assets, projects, or associated contracts
                                                                                                                                                                                                                                                                      17
SPONSOR PROJECTS NEARING COMPLETION

                                                                                                                                                                                            LUCEDALE PLANT1                                                                    Development
                                                                                                                                                                                                                                                                                  Stage
                                                                                                                                                         ▪       Fully contracted, 750k MTPY nameplate production capacity plant
                                                                                                                                                                 located in Lucedale, Mississippi
                                                                                                                                                         ▪       Designed and permitted for a future 300k MTPY expansion2                                                       Development
                                                                                                                                                         ▪       Design based on Cottondale and Hamlet plants
                                                                                                                                                         ▪
MULTI-PLANT EXPANSIONS UPDATE

                                                                                                                                                             Highly-Accretive Growth Projects
                    Expected Adjusted                                                                                                                                   Underway
2.5x                EBITDA1 Project
                    Investment Multiple                                                                                                                  ▪ Expected investment of $50                  million to:
                                                                                                                                                                    1.       De-bottleneck manufacturing processes
                                                                              Hamlet                                Sampson                                         2.       Eliminate certain costs
                                                                                                                                                                    3.       Increase production capacity
                                                                                                                                                                    4.       Reduce GHG emissions

                                                                                                                                                         ▪        Expected annual adjusted EBITDA
                                                                                                                                                                  contribution projected to be $20 million1
                                                                                                                                                                  upon completion and ramp-up of projects
                                                                    Cottondale
                                                                                                                                                         ▪        Projects expected to be completed by the end
                                                                                                                                                                  of 2022
Multi-plant expansions commenced at 3 plants,                                                                                                            ▪        Projects forecasted to be financed with 50%
Hamlet, Sampson, and Cottondale. Project
completions are subject to receiving necessary
                                                                                                                                                                  equity and 50% debt
permits.

1) For an explanation of why we are unable to reconcile the estimated adjusted EBITDA for the Multi-Plant Expansions to the most directly comparable GAAP financial measures, see Appendix                           19
VISIBLE GROWTH

                                                                                                               Illustrative Adjusted EBITDA Growth1
                                                                                                                                                                                         Existing plant
                                                                                                                                                                                   infrastructure includes
                                                                                                                                                                                     an option to expand
                                                                                                                                                                                       initial production
                                                                                                                                                                                    capacity to more than                                           ~$25 - $35
                                                                                                                                                                                        1 million MTPY
                                                                                                                                                                                                                                                      Pascagoula
                                          Existing Assets and Contract Portfolio                                                                                                                                       ~$25 - $50                    Cluster Plant 45

                                             Expected to Generate Additional                                                                                                               ~$10 - $15+                   Bond Plant5
                                             $45 - $50 Million of Incremental                                                                                                            ~$25 - $35+
                                         Adjusted EBITDA above 2021 Guidance3,4
                                                                                                                                                                                             Epes Plant5                 Sponsor Contract Pipeline
                                                                                                                                                             ~$25 - $35+                 (fully contracted at         Underwrites Additional Production
                                                                                                                                ~$10 - $15+                  Lucedale Plant5                 750k MTPY)                            Plants
                                                                                                                                   Pascagoula               (fully contracted)
                                                                                                        ~$20
                                                                                                                                    Terminal5
                                                                                                      Multi-Plant
                                                                       ~$56 - $60                    Expansions3
                                         ~$28 - $32                                               (fully contracted)                  Completion of Construction
                                                                                                                                        Expected By Mid-2021
                                           Mid-Atlantic             Run-Rate Adjusted
                                           Expansions3            EBITDA Contribution
          ~$230 - $2502                 (fully contracted)        from Greenwood and
                                                                         Waycross4
                                                                     (fully contracted)

           2021 Guidance

                          Targeting Annual Organic Growth in Underlying Base Business in Addition to Drop-Down Acquisitions and Plant Expansions

 1) This chart is for illustrative purposes and consists of estimates based on numerous assumptions made by us that are inherently uncertain and are subject to significant risks and uncertainties, which are difficult to predict and many of which are beyond our control. There
 can be no assurance that any of the estimates may prove to be correct. Actual results may differ materially; 2) As of April 28, 2021, the Partnership expects full-year 2021 net income to be in the range of $42.3 million to $62.3 million and adjusted EBITDA to be in the
 range of $230.0 million to $250.0 million. The guidance amounts do not include the impact of any additional acquisitions by the Partnership from our sponsor or third parties; 3) The estimated incremental adjusted EBITDA that can be expected from the Mid-Atlantic
 Expansions and the Multi-Plant Expansions is based on an internal financial analysis of the anticipated benefit from the incremental production capacity and cost savings at these production plants. For an explanation of why we are unable to reconcile the estimated adjusted
 EBITDA for the Mid-Atlantic Expansions and the Multi-Plant Expansions to the most directly comparable GAAP financial measures, see Appendix; 4) The estimated range of incremental adjusted EBITDA for Greenwood and Waycross plants is $56-$60 million in 2024 after
 the completion of the Greenwood expansion and the delivery of full volumes under the 1.4 million MTPY of contracts assigned. Refer to Appendix for additional details; 5) The estimated incremental adjusted EBITDA from a drop-down of a wood pellet production plant or a
 marine terminal represents the run-rate adjusted EBITDA that can be expected from such a facility, based on estimated production or terminaling capacity of such a facility upon achieving full run-rate and our sponsor’s existing contracts that may be associated with such a
 facility. Refer to Appendix for additional details. The sequence of the drop-down transactions is for illustrative purposes only and subject to change. Although we expect to have the opportunity to acquire assets or completed development projects, including the Lucedale
 plant, the Epes plant, and the Pascagoula terminal, from our sponsor in the future, we cannot assure you that our sponsor will be successful in completing their development projects or that we will successfully negotiate an agreement with our sponsor to acquire such           20
 assets or projects
HIGH-CALIBER LEADERSHIP

                                    Majority Independent Board with Significant Industry Experience
             Executive Officers                                                                           Directors
                                                                                                        Ralph Alexander
                 John Keppler                                                                               Director
                Chairman & CEO                         BTG Pactual       Williams
                                                                                                  John C. Bumgarner, Jr.
                                                                                                  Director (Independent)
                    Shai Even
                   EVP & CFO                                                                           Jim H. Derryberry
                                                                                                           Director

               Yana Kravtsova                                     EPA                                 Gerrity Lansing
                                                                        Goldman Sachs
       EVP, Comm., Public & Environ. Affairs                                                      Director (Independent)

                                                                                                      Pierre F. Lapeyre, Jr.
                                                                                                             Director
                    Nic Lane
               EVP, Human Capital                       Buckeye                     Alon
                                                                                                      David M. Leuschen
                                                                                                           Director

                  Thomas Meth                                                                        William K. Reilly
              EVP, Sales & Marketing                     CenterPoint      BP                      Director (Independent)

                                                                                                     Jeffrey W. Ubben
                   Bill Schmidt                                                                   Director (Independent)
              EVP, Corp. Dev. & GC
                                                                                                     Gary L. Whitlock
                                                                                                  Director (Independent)
                   Royal Smith                                    GM       Google                     Janet S. Wong
                 EVP, Operations
                                                                                                  Director (Independent)

                                                                                                                               21
Night Shift at Enviva Pellets Northampton

                                            Additional Information
CAPITALIZATION AND FINANCIAL PRIORITIES

                                                                                                             Financial Priorities

                                                                                                             ▪ Distribution Coverage Ratio: Targeting 1.2x on
                                                                                                               a forward-looking annual basis
                                                                                                             ▪ Leverage Ratio2: Targeting between 3.5x –
                                                                                                               4.0x
                                                                                                             ▪ Growth Financing: Expecting to finance growth
                                                                                                               initiatives and acquisitions with 50% equity and
                                                                                                               50% debt
  Notable Recent Financing Activities
                                                                                                             ▪ Distribution Growth: Committed to sustainably
  ▪       Amended revolving credit facility:                                                                   growing the distribution
          → Increased size by 50% to $525 million from $350 million
          → Extended maturity to April 2026 from October 2023
          → Reduced cost of borrowing by 25 basis points

 1) Based on market value as of 3/31/2021; (2) As calculated under the revolving credit facility agreement
                                                                                                                                                                  23
FAVORABLE CONTRACT STRUCTURE RESULTS IN DURABLE MARGINS
       $225

              Illustrative ($ per metric ton)                                                                                            7   ◼   Long-term contracts with diversified customer base
                                                                                                                                             ◼   Fixed-price (with escalators), take-or-pay off-take contracts
                                                                                                                         7
$200   $200

                                                                                                                                         6
                                                                                                                             ~$45 / MT       ◼   Fixed-price, USD / ton denominated shipping contracts matched to
                                                                                                                               Adj.              length of off-take contracts
                                                                                                                              Gross          ◼   Bunker fuel costs passed through to customers
       $175

                                                                                                                              Margin1        ◼   Shipping costs range from ~$20 / MT (Europe) to ~$35 / MT (Japan)
                                                                                                          6
                                                                                                                                         5   ◼   Vertically integrated business model provides substantial operating
       $150
                                                                                                              Shipping                           leverage as business grows

                                                                                              5                                          4   ◼   Fixed USD / ton transportation costs from plants to port terminals by
                                                                                                  Ports                                          truck / rail / barge
       $125
                                                                              4
                                                                                  Logistics                                              3   ◼   “Build and copy” approach to allow for certainty of uptime and
                                                        3
                                                                                                                                                 economy of scale
       $100

                                                                                                                                             ◼   Includes labor, consumables, repairs and maintenance, and energy
                                                                                                                         Total Costs             costs
                                                            Production
                                      Total Raw                                                                           of Goods           ◼   Given fixed asset base, productivity improvements drive substantial
        $75
                                      Materials                                                                              Sold                margin expansion opportunities
                                       in COGS
                                                                                                                                         2   ◼   ~2:1 green ton to pellet ton conversion (green wood is, on average,
                                                                                                                                                 composed of approximately 50% water, which varies seasonally. As
                                                                                                                                                 such, on average, EVA acquires approximately two green tons to
        $50

                      2               Cut, Skid,
                                        Haul                                                                                                     convert one pellet ton post the drying process)

        $25

               Cut, Skid,                                                                                                                1   ◼   Majority of delivered price of fiber is comprised of labor, equipment
                                  1                                                                                                              and hauling costs
                 Haul
                                      Stumpage                                                                                               ◼   Fiber (“stumpage”) cost is ~10% of sales price, driven by strong fiber
               Stumpage                                                                                                                          basket in the Southeast U.S.
         $0

                          1)   Adj. Gross Margin per Metric Ton defined in Appendix

                                                                                                                                                                                                                 24
NO MATERIAL IMPACT FROM COVID-191 PANDEMIC
◼ Number one priority is to ensure the health and well-being of our employees and the communities in which we operate

◼ Enhanced plans, procedures, and measures are in place to mitigate the risk of exposure and to make our work environment as safe as
  possible for continued operations

◼ We operate a portfolio of nine geographically dispersed wood pellet production plants

◼ Our business supplies essential fuel to our customers under long-term, take-or-pay off-take contracts that our customers use for baseload heat
  and power generation

◼ Most of our current deliveries are to Europe, where they fuel grid-critical baseload for dispatchable generation facilities that provide power and
  heat required by their local communities. There are few substitutes or alternatives to the fuel we supply our customers

◼ In the U.S., government-issued guidance identifies biomass as one of the industries essential to the continued critical infrastructure viability,
  and this guidance has been followed by states where our plants and terminals are located, meaning our operations remain largely unaffected
  by the governmental actions taken in response to COVID-19

◼ Although EVA’s operational and financial results have not been materially impacted by the COVID-19 pandemic, the full implications of the
  novel coronavirus are not yet known
  — Plants, ports, and supply chains both domestically and internationally continue to operate uninterrupted on 24x7 basis
  — Each of our customers is in compliance with their agreements with us, including payment terms

◼ If needed, we have contingency and business continuity plans in place that we believe would mitigate the impact of potential business
  disruptions

         1)   ”COVID-19” refers to the outbreak of a novel strain of coronavirus
                                                                                                                                               25
2021 GUIDANCE

                                  The Partnership Expects to Distribute at Least $3.17 Per Common Unit for Full-Year 20211

                        Targeted Distribution Coverage Ratio is at Least 1.20 Times, on a Forward-Looking Annual Basis2

 1)   As of April 28, 2021, the Partnership reaffirmed its full-year 2021 net income to be in the range of $42.3 million to $62.3 million, adjusted EBITDA to be in the range of $230.0 million to $250.0 million, and distributable cash flow to be in the range of $160.0 million to
      $180.0 million, prior to any distributions attributable to incentive distribution rights. The Partnership expects to distribute at least $3.17 per common unit for full-year 2021, before considering the benefit of any acquisitions or drop-down transactions, and to target a
      distribution coverage ratio of 1.20 times on a forward-looking annual basis. The guidance amounts provided above do not include the impact of any additional acquisitions by the Partnership from our sponsor or third parties;
 2)   Additional details are available as part of our earnings release as of April 28, 2021
                                                                                                                                                                                                                                                                                         26
FINANCIAL RESULTS

                                                                                 23 Consecutive Distribution Increases Since the IPO3

1)   See Appendix for Adjusted EBITDA, Adjusted Gross Margin per Metric Ton and Distributable Cash Flow reconciliations;
2)   Prior to any distributions attributable to incentive distribution rights;
3)   As of April 27, 2021, the Board declared a distribution of $0.785 per common unit for the first quarter of 2021
                                                                                                                                        27
Appendix
NON-GAAP FINANCIAL MEASURES
 This presentation contains certain financial measures that are not presented in accordance with accounting principles generally accepted in the United States
 (“GAAP”). Although they should not be considered alternatives to the GAAP presentation of the financial results of the Partnership, management views such non-
 GAAP measures as important to reflect the Partnership’s actual performance during the periods presented.

 Non-GAAP Financial Measures
 In addition to presenting our financial results in accordance with GAAP, we use adjusted gross margin, adjusted gross margin per metric ton, adjusted EBITDA,
 and distributable cash flow to measure our financial performance.

 Adjusted Gross Margin and Adjusted Gross Margin per Metric Ton
 We define adjusted gross margin as gross margin excluding loss on disposal of assets, depreciation and amortization, changes in unrealized derivative
 instruments related to hedged items included in gross margin, non-cash unit compensation expenses, and acquisition and integration costs and other, adjusting
 for the effect of Commercial Services, and including MSA Fee Waivers. We define adjusted gross margin per metric ton as adjusted gross margin per metric ton
 of wood pellets sold. We believe adjusted gross margin and adjusted gross margin per metric ton are meaningful measures because they compare our revenue-
 generating activities to our operating costs for a view of profitability and performance on a total-dollar and a per-metric ton basis. Adjusted gross margin and
 adjusted gross margin per metric ton will primarily be affected by our ability to meet targeted production volumes and to control direct and indirect costs
 associated with procurement and delivery of wood fiber to our wood pellet production plants and our production and distribution of wood pellets.

 Adjusted EBITDA
 We define adjusted EBITDA as net income excluding depreciation and amortization, interest expense, income tax expense (benefit), early retirement of debt
 obligations, non-cash unit compensation expense, loss on disposal of assets, changes in unrealized derivative instruments related to hedged items included in
 gross margin and other income and expense, and acquisition and integration costs and other, adjusting for the effect of Commercial Services, and including MSA
 Fee Waivers. Adjusted EBITDA is a supplemental measure used by our management and other users of our financial statements, such as investors, commercial
 banks and research analysts, to assess the financial performance of our assets without regard to financing methods or capital structure.

                                                                                                                                                               29
NON-GAAP FINANCIAL MEASURES (CONT.)

 Distributable Cash Flow
 We define distributable cash flow as adjusted EBITDA less maintenance capital expenditures, cash income tax expenses, and interest expense net of amortization
 of debt issuance costs, debt premium, original issue discounts, and the impact from incremental borrowings related to the Chesapeake Incident and Hurricane
 Events. We use distributable cash flow as a performance metric to compare our cash-generating performance from period to period and to compare the cash-
 generating performance for specific periods to the cash distributions (if any) that are expected to be paid to our unitholders. We do not rely on distributable cash
 flow as a liquidity measure.

 Limitations of Non-GAAP Financial Measures
 Adjusted net income, adjusted gross margin, adjusted gross margin per metric ton, adjusted EBITDA, and distributable cash flow are not financial measures
 presented in accordance with GAAP. We believe that the presentation of these non-GAAP financial measures provides useful information to investors in assessing
 our financial condition and results of operations. Our non-GAAP financial measures should not be considered as alternatives to the most directly comparable
 GAAP financial measures. Each of these non-GAAP financial measures has important limitations as an analytical tool because they exclude some, but not all,
 items that affect the most directly comparable GAAP financial measures. You should not consider adjusted net income, adjusted gross margin, adjusted gross
 margin per metric ton, adjusted EBITDA, or distributable cash flow in isolation or as substitutes for analysis of our results as reported under GAAP.

 Our definitions of these non-GAAP financial measures may not be comparable to similarly titled measures of other companies, thereby diminishing their utility.

 The estimated incremental adjusted EBITDA that can be expected from the Mid-Atlantic and Multi-Plant Expansions is based on an internal financial analysis of
 the anticipated benefit from the incremental production capacity and cost savings at the Northampton, Southampton, Sampson, Hamlet, and Cottondale plants and
 is based on numerous assumptions that are subject to significant risks and uncertainties. Those assumptions are inherently uncertain and subject to significant
 business, economic, financial, regulatory, and competitive risks and uncertainties that could cause actual results and amounts to differ materially from such
 estimate. A reconciliation of the estimated incremental adjusted EBITDA expected to be generated by the Mid-Atlantic and Multi-Plant Expansions to the closest
 GAAP financial measure, net income, is not provided because net income expected to be generated by the expansions is not available without unreasonable
 effort, in part because the amount of estimated incremental interest expense related to the financing of the expansions and depreciation is not available at this
 time.

                                                                                                                                                                    30
NON-GAAP FINANCIAL MEASURES RECONCILIATION
  The following table provides a reconciliation of distributable cash flow and adjusted EBITDA to net income (loss):
              See Note 1 of our financial statements, Description of Business and Basis of Presentation, to our Annual Report on the 10-K and slide 29 through 30 for basis of presentation.

                                                                                                                                                                                               31
NON-GAAP FINANCIAL MEASURES RECONCILIATION (CONT.)
  The following table provides a reconciliation of gross margin to adjusted gross margin per metric ton:
                See Note 1 of our financial statements, Description of Business and Basis of Presentation, to our Annual Report on the 10-K and slide 29 through 30 for basis of presentation.

                                                                                                                                                                                                 32
2021 GUIDANCE

1)   Includes primarily expected $19.0 million of MSA Fee Waivers associated with the acquisition of Enviva Pellets Greenwood, LLC

                                                                                                                                     33
2021 AND 2024 GUIDANCE FOR THE GREENWOOD AND WAYCROSS ACQUISITIONS
     The following table provides a reconciliation of the estimated adjusted EBITDA to the estimated net income associated with the Greenwood and Waycross
     Acquisitions2 for the twelve months ending December 31, 2021 and 2024 (in millions):

1)     Includes expected $19.0 million of MSA Fee Waivers associated with the Partnership’s acquisition (the “Greenwood Acquisition”) of the Greenwood plant;
2)     The Greenwood Acquisition, which closed on July 1, 2020, and the Georgia Biomass Acquisition, which closed on July 31, 2020, are collectively referred to as “the Acquisitions”
                                                                                                                                                                                         34
Contact:
Kate Walsh
Vice President, Investor Relations
ir@envivapartners.com
You can also read