ECONOMIC RECOVERY AFTER DISASTER STRIKES - A REPORT FOR SUNCORP - Suncorp ...
←
→
Page content transcription
If your browser does not render page correctly, please read the page content below
ECONOMIC RECOVERY
AFTER DISASTER STRIKES
A REPORT FOR SUNCORP
© SGS Economics and Planning Pty Ltd 2019

This report has been prepared for Suncorp. SGS Economics and Planning
has taken all due care in the preparation of this report. However, SGS and its
associated consultants are not liable to any person or entity for any damage or
loss that has occurred, or may occur, in relation to that person or entity taking
or not taking action in respect of any representation, statement, opinion or
advice referred to herein.

SGS Economics and Planning Pty Ltd
ACN 007 437 729
www.sgsep.com.au
Offices in Canberra, Hobart, Melbourne, Sydney
EXECUTIVE SUMMARY

This report considers the role of insurance in restoring         In 2017, the immediate economic impact of Cyclone              For the following year, as the Suncorp payouts and
local economic activity and reducing the long-term               Debbie across all of Queensland and northern New               recovery activity continue to flow through the local
impact of natural disasters. The analysis looks at the           South Wales before insurance payments was estimated            economy, an additional $47 million or 0.3 per cent will
experience of three recent natural disasters: Cyclone            to be a $7.1 billion decline, or a 2.2 per cent reduction in   be added to GDP. The improved economic performance
Debbie, Tathra's bushfires and Hobart’s floods. All              GDP. In Airlie Beach and surrounding areas in the              will continue to at least 2020, with the economy being
three disasters had a devastating effect on local                Whitsundays, the immediate impact on local GDP was as          $36 million better off because of Suncorp claims and
communities and economic activity, but we find that              much as a 64.2 per cent decline.                               recovery activity.
insurance payouts alleviate the economic impacts.
                                                                 The claims and recovery activity from Suncorp insurance        We find that insurance plays a significant role in
Previous studies estimated the permanent impact of               over 2017-18 boosted the local economies impacted by           mitigating adverse outcomes and helping to restore
disasters without considering the economic impact of             the cyclone and offset the immediate decline in GDP            normal economic activities following disasters
insurance payouts made to those affected. This report            (compared to a scenario of no insurance payouts). In the       regardless of their size. This is particularly the case in
models the economic experience of three typical                  first year following Cyclone Debbie, the economic boost        regional areas which have a high reliance on capital
Australian regional and urban centres in the aftermath           from insurance activity was estimated to be $2.7 billion       intensive sectors like resources, agriculture, and
of natural disasters. We find that without insurance it is       (or an 0.8 per cent boost to GDP). In the following year,      tourism. The value of insurance is clear for areas that
possible that a regional town may never fully recover            an additional $1.9 billion was added to GDP. The               have limited employment opportunities, or a narrower
from a disaster as damage can lead to a permanently              cumulative economic impact over five years is estimated        economic base compared to urban areas that can
impaired economic capacity.                                      to be $6.3 billion offsetting almost all the immediate         absorb the economic losses of a disaster more easily.
                                                                 impact of the disaster.
Small towns are the backbone of regional Australia with                                                                         With large parts of Australia at growing risk from
one in ten Australians living in towns with populations of       The Tathra bushfires on the New South Wales south              tropical cyclones, bushfires, storms and floods, the
less than 10,000 people. In the 2016 census there were           coast hurt the local economy by an estimated $207              importance of insurance is only increasing. Natural
about 1,700 such towns in Australia. These towns often           million, or a 33.7 per cent decline in local GDP and hit       disasters are a traumatic experience for all those
have limited options when disaster strikes and benefit           the town's main industry tourism. In this case, Suncorp        involved, however with insurance the impact of
more from the economic stimulus of insurance than                insurance payouts boosted the economy by $4 million or         disasters doesn't have to be permanent.
urban centres.                                                   1 per cent to local GDP.

Insurance payouts help to stabilise the local economy            Following Hobart's floods, the claims and recovery
and offset the initial impact to the economy following           activity payouts by Suncorp boosted the GDP of Hobart
the disaster. Over time, the economic stimulus from              by over $94 million or 0.5 per cent in 2018.
claims payouts and recovery activity encourages a faster
return to normal economic activity.

ECONOMIC RECOVERY AFTER DISASTER STRIKES: A REPORT FOR SUNCORP
                                                                                                                                                                                        i
GLOSSARY

 TERM                                        DEFINITION                                                                                                         ABBREVIATION
 Australian Statistical Geography
                                             The Australian Statistical Geography Standard is the Australian Bureau of Statistics' geographical framework.      ASGS
 Standard

 Bureau of Meteorology                       The Bureau of Meteorology is Australia's national weather, climate and water agency                                BOM

 CBD                                         Central Business District                                                                                          CBD

 Gross Domestic Product                      Is the measure of income generated by an economy.                                                                  GDP

 Natural Disaster Relief and Recovery        Through the NDRRA, the Australian Government provides financial assistance directly to the states to assist them
                                                                                                                                                                NDRRA
 Arrangements                                with costs associated with certain disaster relief and recovery assistance measures

 Statistical Areas                           Statistical Areas (1,2,3 or 4) are geographic units defined by the Australian Bureau of Statistics.                SA

 Suncorp                                     Refers to all brands including: AAMI, GIO, Suncorp Insurance, Vero, APIA, Shannons, CIL and Bingle                 ..

 UTAS                                        University of Tasmania                                                                                             UTAS

SUNCORP BRANDS

ECONOMIC RECOVERY AFTER DISASTER STRIKES: A REPORT FOR SUNCORP
                                                                                                                                                                               ii
Contents

EXECUTIVE SUMMARY                           i

GLOSSARY                                    ii

INTRODUCTION                                2

ECONOMIC MODELLING                          5

DISASTER CASE STUDIES                       9

3.1   Cyclone Debbie (March – April 2017)   11
3.2   Tathra bushfires (March 2018)         20
3.3   Hobart floods (May 2018)              23

CONCLUSION                                  27

APPENDIX                                    28
List of Figures
FIGURE 1: SCALE OF DISASTER BASED ON NUMBER OF CLAIMS                  2
FIGURE 2: ECONOMIC MODELLING OVERVIEW                                  5
FIGURE 3: PHASES OF RECOVERY FOLLOWING A DISASTER                      9
FIGURE 4: PATH OF CYCLONE DEBBIE                                       12
FIGURE 5: GROSS DOMESTIC PRODUCT SA3 IMPACT OF CYCLONE DEBBIE          14
FIGURE 6: TOP 15 SA3 – PERCENTAGE IMPACT OF CYCLONE DEBBIE ON GDP      15
FIGURE 7: SUNCORP CLAIMS & RECOVERY ACTIVITY – CYCLONE DEBBIE          16
FIGURE 8: SUNCORP CLAIMS & RECOVERY ACTIVITY – CYCLONE DEBBIE          16
FIGURE 9: CLAIMS & RECOVERY ACTIVITY BY BRAND – CYCLONE DEBBIE         17
FIGURE 10: ECONOMIC BENEFIT OF SUNCORP INSURANCE – CYCLONE DEBBIE      17
FIGURE 11: THE GAP – ENOGGERA SA3 GDP ($ MILLION)                      18
FIGURE 12: MACKAY SA3 GDP ($ MILLION)                                  18
FIGURE 13: WHITSUNDAY SA3 GDP ($ MILLION)                              19
FIGURE 14: TATHRA SA2 GDP ($ MILLION)                                  22
FIGURE 15: SUNCORP CLAIMS & RECOVERY ACTIVITY – HOBART FLOODS          24
FIGURE 16: ADDITIONAL ECONOMIC BENEFIT FROM SUNCORP INSURANCE          24
FIGURE 17: OVERVIEW OF MODELLING FRAMEWORK                             29

List of Tables
TABLE 1: DISASTER ECONOMIC MULTIPLIERS                                 6
TABLE 2: REGIONAL ECONOMIC MULTIPLIERS FOR EACH SUNCORP PAYMENT TYPE   7
TABLE 3: TROPICAL CYCLONE CATEGORY AND LIKELY IMPACT                   11
TABLE 4: 2017 CYCLONE DEBBIE IMPACT – TOP 20 SA3                       30
Introduction

                                                                    Natural disasters, such as
                                                                  bushfires, floods and tropical
                                                                 cyclones are an enduring part of
                                                                    the Australian experience.
ECONOMIC RECOVERY AFTER DISASTER STRIKES: A REPORT FOR SUNCORP
                                                                                                    1
01       INTRODUCTION

Household and business insurance provides local                  Suncorp is one of Australia’s largest insurance companies, with over 8 million customers across Australia. Several
communities with the resilience to deal with natural             insurance brands are owned by Suncorp, including AAMI, GIO, Suncorp Insurance, Vero, APIA, Shannons, CIL and
disasters. This is especially important in areas of high         Bingle.
economic activity or low socioeconomic status that are
exposed to a high level of risks from natural hazards.           To consider the economic benefit that Suncorp’s insurance played over 2017-2018, three disaster events were
                                                                 selected, and analysis conducted with Suncorp data:
Natural disasters, such as bushfires, floods and tropical
cyclones are an enduring part of the Australian                  — Cyclone Debbie: March-April 2017
experience. They are a traumatic event for the                   — Tathra bushfires: March 2018
community involved and impact on the local economy by            — Hobart floods: May 2018
destroying and damaging homes, business premises and
economic and social infrastructure.
                                                                 FIGURE 1: SCALE OF DISASTER BASED ON NUMBER OF CLAIMS
In addition to the loss of physical capital, natural disasters
disrupt the normal economic production which takes
place within a region. Retail businesses are closed,
workers can’t get to the office, crops are destroyed, and
factories sit idle without raw material. Depending on the
scale of the natural disaster, people may choose to leave
a region rather than rebuild. This loss of population then                       Cyclone Debbie                                    Hobart Floods
impacts on the productive capacity of the economy.                               ~20,000 claims                                    ~2,000 claims

Due to the increasing prevalence and severity of natural
disasters, there is a growing risk of Australia’s economic                                                                                                         Tathra Bushfires
performance being undermined. Household and business                                                                                                                 ~200 claims
insurance (along with mitigation strategies) provide
communities with the resilience to deal with natural
disasters. This is especially important in areas of high         Source: Suncorp Insurance

economic activity or low socioeconomic status that are
exposed to a high level of risk from natural hazards.

ECONOMIC RECOVERY AFTER DISASTER STRIKES: A REPORT FOR SUNCORP
                                                                                                                                                                                      2
These three events were selected as they are a
magnitude of 10 different in the size of claims numbers.
Based off Suncorp data, Cyclone Debbie was
approximately a 20,000 claim event, Hobart’s floods
were around 2,000, whilst Tathra’s bushfires were
around 200 claims. Considered together, they provide a
useful comparison of the economic impact of disasters
based on size, urban versus rural, and densely versus
sparsely populated areas.

The approach used has created a Gross Domestic
Product (GDP) figure for the regions impacted by these
disasters without insurance. Based on insurance claims
data from Suncorp, the economic impact was estimated.
Two scenarios, one with the stimulus of insurance claims
and recovery activity flowing through the economy and
the second with no stimulus, allows the impact of
insurance to be isolated.

Analysis was conducted at the Statistical Area 3
(SA3) level. Statistical Areas are geographic units
defined by the Australian Bureau of Statistics (ABS). SA3s
are the third smallest Statistical Area and represent
regions of between approximately 30,000 and 130,000
people. Analysis at the SA3 level is particularly insightful
for Cyclone Debbie, which impacted large parts of
Queensland and northern New South Wales.

It is important to note that many of the communities
impacted by these disasters are still recovering.
Depending on the severity of the disaster and damage
experienced by the community recovery activity can take
years.

ECONOMIC RECOVERY AFTER DISASTER STRIKES: A REPORT FOR SUNCORP
                                                                 3
Economic Modelling

                                                                 Economic losses relate to the loss
                                                                 of economic production because of
                                                                         natural disasters.
ECONOMIC RECOVERY AFTER DISASTER STRIKES: A REPORT FOR SUNCORP
                                                                                                      4
02 ECONOMIC MODELLING
Economic modelling has been used to estimate the size The first input is insurance claims and recovery activity data from Suncorp1. This is provided for each disaster Case
of the economic impact of the natural disasters and the Study and broken down into the following categories:
economic benefit of insurance provided by Suncorp.
— Home Insurance (split into buildings, home contents and management costs)
It is important to understand the difference between — Motor Vehicle Insurance
insurance losses and economic loss. Insurance losses — Commercial Insurance (split into motor vehicle, buildings and commercial insurance).
related to natural disasters capture the losses accruing to
insured assets (e.g. homes, motor vehicles and business FIGURE 2: ECONOMIC MODELLLING OVERVIEW LEGEND
premises). Suncorp Data
Insurance ICA Data
Economic losses relate to the loss of economic Claims and
SGS Data
production because of natural disasters. For example, Recovery
Assistance by External Data
businesses forced to close will miss out on daily takings, Total Insurance
Type Output
workers can’t reach their workplace, and factories are Claims &
idle without raw materials. Depending on the scale of Recovery
the natural disaster, people may choose to leave a region Activity from
Disaster
rather than rebuild. This loss of population then impacts Market Share
Data Timing of
the economy in the longer term. payouts Impact of
Disaster
This section briefly outlines the economic modelling Insurance
used to estimate the size of the economic impact of the Council of Disaster Impact
natural disasters and the economic benefit of insurance Australia Total Economic
Multipliers Regional GDP
Benchmarks Impact of
provided by Suncorp. It should be noted that other
Disaster
intangible economic benefits such as improved mental
health outcomes, reduced alcohol and drug use and Economic
Self-insured Multipliers
changes to school academic outcomes are not included adjustment Economic
in the economic modelling for this report. benefit of
Suncorp
Insurance
Source: SGS Economics & Planning
1
This includes AAMI, GIO, Suncorp Insurance, VERO, APIA, Shannons, CIL and Bingle brands
ECONOMIC RECOVERY AFTER DISASTER STRIKES: A REPORT FOR SUNCORP
5Previous research undertaken by the Bureau of The economic stimulus from Suncorp’s insurance
Infrastructure, Transport and Regional Economics and claims and recovery activity categories (buildings,
Deloitte Access Economics has examined the relationship home contents, motor vehicle and management costs)
between insurance payouts and the loss of economic are allocated to different expenditure categories with
production. This research produced disaster multipliers different economic multipliers that vary by region (as
which can be used to convert insurance payouts to shown in Table 2).
economic loss.
These reflect supply chains within each region and how
For example, if insured losses of a flood were estimated much expenditure is lost from the local area. Cities
at $1 million and the estimated multiplier is 10 then total have higher multipliers than regional areas because
Estimates of total insurance payout for claims and economic cost would be estimated at $10 million. they capture more stimulus. Motor vehicles have
recovery assistance figures for an event are based off multipliers below one because cars are imported from
Suncorp and market share data combined with TABLE 1: DISASTER ECONOMIC MULTIPERS overseas and therefore have a reduced impact on an
benchmark data from the Insurance Council of Australia MULTIPLIER LOWER UPPER economy.
DISASTER TYPE
(ICA) for total insurance payouts, up to August 2018.
USED BOUND BOUND
The data was provided at the post code level and was Hobart Flood 10 10 21.7
then aggregated to the Statistical Area 3 level. The date Tathra Bushfire 5.3 3 5.3
at which the insurance is paid has also been provided for Cyclone Debbie 7.5, 8.5, 9.5* 5 9.5
each disaster. *A few multipliers were used due to the scale of Cyclone Debbie across
multiple areas of Queensland. See Table 2 for more detail.
Suncorp’s insurance claims and recovery data for the Source: SGS Economics & Planning and Deloitte Access Economics
three events was collected and analysed up to August
2018 for all Suncorp brands (AAMI, GIO, Suncorp Table 1 presents the multiplier used for each of the Case
Insurance, VERO, APIA, Shannons, CIL and Bingle). Study disasters. Also presented is the upper and lower
bounds used by the previous research. In the case of
An adjustment is then made to account for households the Cyclone Debbie, three different disaster multipliers
and businesses who are self-insured. There is a lack of have been used. This is done to reflect the different
data on the level of self-insurance. After conversations strength (in terms of winds and rain) of Cyclone Debbie
with the ICA, SGS assumed that there is a 10 per cent of as it moved across Queensland and northern New South
households and businesses are self-insured. Wales.
ECONOMIC RECOVERY AFTER DISASTER STRIKES: A REPORT FOR SUNCORP
6TABLE 2: REGIONAL ECONOMIC MULTIPLIERS FOR EACH SUNCORP PAYMENT TYPE
MANAGEMENT
REGION BUILDING CONTENT MOTOR VEHICLES
COSTS
Greater Sydney 1.34 1.15 1.33 0.75
Rest of NSW 1.20 1.06 1.17 0.54
Greater Brisbane 1.29 1.07 1.27 0.72
Rest of Qld 1.18 1.01 1.15 0.56
Greater Hobart 1.09 1.10 1.05 0.59
Rest of Tas. 1.09 1.10 1.05 0.59
Source: SGS Economics & Planning
Two Gross Domestic Product (GDP) scenarios
were generated, one with the stimulus of Suncorp
insurance claims and recovery activity flowing
through the economy and the second with no
Stimulus. This method isolates the impact of
Suncorp on the economy.
Given each disaster occurred roughly in the middle
of the year, the financial year estimates of GDP
were converted to calendar year estimates. This
allowed a better assessment of the economic
impact to be made, rather than presenting an
impact for one or two months at the end of the
financial year.
Detail on the GDP method used is provided in the
appendix.
ECONOMIC RECOVERY AFTER DISASTER STRIKES: A REPORT FOR SUNCORP
7Disaster Case Studies
A community’s recovery pathway
following a natural disaster
depends on the scale of the natural
disaster, the resilience of the
community and the speed of the
recovery process.
ECONOMIC RECOVERY AFTER DISASTER STRIKES: A REPORT FOR SUNCORP
803 DISASTER CASE STUDIES
How communities respond to disaster events depends FIGURE 3: PHASES OF RECOVERY FOLLOWING A DISASTER
on the nature of the disaster and characteristics
of the region. Three case studies, Cyclone Debbie,
Tathra’s bushfires and Hobart’s floods are examined Emergency Restoration
to understand the disaster response process.
Emergency Making built
response Environment safe
Natural disasters are a traumatic experience for the Demolition and Reconstruction
clearance of rubble
affected community. A community’s recovery pathway New buildings and infrastructure
following a natural disaster depends on the scale of the
Understanding Improvement
natural disaster, the resilience of the community and the current state
Making city a better place
speed of the recovery process. State of land,
infrastructure and
buildings
Following a natural disaster, there are four main stages of
recovery: Insurance settlements
— Emergency – takes place immediately after the
LEVEL OF ACTIVITY
disaster.
— Restoration – work begins on the restoration of
basic services and rubble and debris is cleared,
buildings and the built environment are made safe.
Assessments are made of the damage and insurance
claims are lodged. DISASTER
— Reconstruction – management of insurance claims EVENT
and associated reconstruction begins. This is the final
stage of recovery. Completion of search & Restoration of major Return to pre-disaster
— Improvement – this is the stage where mitigation rescue operation urban services levels of activity
projects to prevent a repeat of the event occur. This
is a longer-term stage which is not considered in our
economic modelling. Source: SGS Economics & Planning based on Kates (2006)
ECONOMIC RECOVERY AFTER DISASTER STRIKES: A REPORT FOR SUNCORP
9Suncorp has refined and developed its claims response
with each disaster. Following an event, dedicated
Suncorp teams are established and sent to the impacted
area to meet customers, assess claims, work with local
authorities and engage local services to rectify the
customer’s situation as early as possible.
Reconstruction is the phase when many buildings have
been repaired / rebuilt and infrastructure repaired. The
reconstruction stage lasts longer than the emergency
response and restoration stages and can take years 2.
Insurance is an important component in natural disaster
recovery. Natural disasters can destroy the productive
capacity of economies and slow economic recoveries.
They can drive residents and businesses to leave
impacted regions. A successful recovery is measured by
the ability of communities to rapidly regain what they
have lost and catch up to where they could have
progressed to.
Insurance payouts for claims and recovery activity
provide an economic stimulus that speeds up the rate of
recovery for regional economies and limits further losses
of economic activity.
2
R. W. Kates, C. E. Colten, S. Laska, S. P. Leatherman, Reconstruction of New Orleans after Hurricane Katrina: A research perspective (2006) http://www.pnas.org/content/103/40/14653
ECONOMIC RECOVERY AFTER DISASTER STRIKES: A REPORT FOR SUNCORP
103.1 CYCLONE DEBBIE (MARCH – APRIL TABLE 3: TROPICAL CYCLONE CATEGORY AND LIKELY IMPACT
2017)
CYCLONE CATEGORY WIND STRENGTH LIKELY IMPACT
OVERVIEW
Negligible house damage. Damage to some crops, trees and
Category 1 90- 124 km/h.
caravans. Water craft may drag moorings
Cyclone Debbie, a category four cyclone, was one
of the strongest tropical cyclones to hit Queensland Minor house damage. Significant damage to signs, trees and
in recent years. Debbie made landfall near Airlie Category 2 125- 164 km/h. caravans. Heavy damage to some crops. Risk of power failure.
Beach at 12.40pm on 28 March 2017. Several days Small water craft may break mooring
of extreme weather followed, impacting across the Some roof and structural damage. Some caravans destroyed.
Category 3 165 – 224 km/h.
State.3 As Cyclone Debbie weakened to a tropical Power failures likely.
low, it continued to have damaging effects as it Significant roofing loss and structural damage. Many caravans
moved south into New South Wales. Category 4 225- 279 km/h. destroyed and blown away. Dangerous airborne debris.
Widespread power failures
The impacts from Cyclone Debbie included extreme Category 5 280 km/h plus Extremely dangerous with widespread destruction.
rainfall, winds, and flooding. Off-shore wind gusts
Source: BOM
peaked at 263 kilometres per hour as the category
4 cyclone approached the coast. Once it reached
the coast at Airlie Beach, Cyclone Debbie was
downgraded to category 3 and quickly lost wind
strength, and spared many areas from the most
destructive winds.
Despite the change from a cyclone to a tropical low,
the rain associated with Cyclone Debbie was the
highest rainfall for March ever recorded in many
locations across Queensland.
Record flooding occurred on the Logan and Albert
River, and many others across the State. The Tweed
River in New South Wales also saw record flooding,
with flash flooding occurring from the Mackay
catchment down to northern New South Wales.
Over 350 Flood Watches and Warnings were issued
during the event.4
3
ABC News, 2017, ‘Cyclone Debbie’s eye reaches coast; BOM downgrades system to category three,’ 28 March 2017, http://www.abc.net.au/news/2017-03-28/bom-warning-cyclone-debbie-hours-from-hitting-north-queensland/8391174
4
Bureau of Meteorology, 2018, ‘Tropical Cyclone Debbie Technical Report,’ February 2018, http://www.bom.gov.au/cyclone/history/database/Tropical-Cyclone-Debbie-Technical-Report-Final.pdf
ECONOMIC RECOVERY AFTER DISASTER STRIKES: A REPORT FOR SUNCORP
11FIGURE 4: PATH OF CYCLONE DEBBIE
It is estimated that Debbie was the most dangerous cyclone since Cyclone
Yasi in 2011, and the most expensive storm in Queensland’s history. The
State and Commonwealth governments were projected to spend at least
Mar 24
1 Mar 25
$2 billion repairing public infrastructure. 5 The damage to agricultural crops
2 was estimated to have been at least $1 billion. Losses from coal exports
Mar 25
2 Mar 26 were also estimated to be in the range of $1.5 billion. 6 Impacts were felt
Mar 26
Ayr 2 in the closure of airports, railways and sea ports, along with significant
Bowen 3 Mar 27 damage to road networks across Queensland.
Prosperpine 4
4 Mar 27
Collinsville 3 Mar 28
Queensland’s tourism sector also felt the effects, with the cyclone
2 Mar 28 significantly damaging many resort islands and key tourist destinations.
Mar 29 Moranbah These included the Hamilton and Daydream Islands in the Whitsundays,
L and the town of Proserpine, in addition to Airlie Beach where it first made
landfall. Bowen and the inland town of Collinsville were also severely
Mar 29
Emerald impacted. The impact on the tourism sector has been estimated at
Gladstone between $120 and $180 million. 7
L
Mar 29 Damage was done to more than 2,300 residential properties, and around
Taroom 1,000 were declared uninhabitable as a result.8 At least six lives were lost
in the cyclone and its aftermath in Queensland and New South Wales. A
Roma Miles Gympie number of these deaths were the result of severe flooding. The immediate
aftermath saw significant power outages across the State, impacting
St George L
63,000 properties.
Goondiwindi Ipswich Mar 30 Mar 31 Mar 31
L
Murwillumbah L In the first month after the disaster there were more than 100,000
Apr 1 requests for assistance, and $25 million in recovery grants issued.
Queensland Government funding in response to the disaster included $10
million in assistance for primary producers, small businesses and not-for-
profit organisations.9 The Commonwealth Government offered $29 million
in assistance after the cyclone, through the Natural Disaster Relief and
Port Macquarie Recovery Arrangements.10 Despite reimbursements and funding from the
Commonwealth, the net cost to the Queensland Government is estimated
Source: Bureau of Meteorology to have been $500 million. 11
5
Ludlow, 2017, ‘Federal taxpayers to pick up tab for Queensland cyclone,’ Australian Financial Review, 24 April 2017, https://www.afr.com/news/politics/federal-taxpayers-to-pick-up-tab-for-queensland-cyclone-20170423-gvqymk
6
Queensland Government, 2017, ‘The Cyclone Debbie Review,’ Inspector-General Emergency Management, Report 1: 2017-18, https://www.igem.qld.gov.au/reports-and-publications/Documents/Cyclone%20Debbie%20Review%20Rpt1-17-18_PUBLIC_WEB.pdf
7
Tapim, 2017, ‘Cyclone Debbie likely to cost Queensland budget $1.5 billion,’ ABC News, 24 April 2017, http://www.abc.net.au/news/2017-04-24/cyclone-debbie-cost-repair-bill-curits-pitt-state-budget/8466192
8
See Queensland Government, 2017.
9
Queensland Government, 2017, ‘Cyclone Debbie recovery assistance tops $10 million,’ 23 August 2017, http://statements.qld.gov.au/Statement/2017/8/23/cyclone-debbie-recovery-assistance-tops-10-million
10
Tapim & Aguis, 2017, ‘Cyclone Debbie: Federal Government offers $29m, not $110m in recovery payments,’ ABC News, 15 July 2018, http://www.abc.net.au/news/2017-07-15/cyclone-debbie-queensland-federal-government-disaster-payments/8711310
11
See Tapim, 2017.
ECONOMIC RECOVERY AFTER DISASTER STRIKES: A REPORT FOR SUNCORP
12As well as the immediate impact and aftermath in the Cyclone Debbie also had significant impacts on the
days following the cyclone, there were further ongoing environment. This included damage to the corals of the
impacts in many areas. A year on from the disaster, many Great Barrier Reef. In some parts of the reef, 95 per cent
families and businesses were still recovering. Damage of the coral was destroyed in the wild weather.17
to roads has impacted on worker commutes. Some
businesses have been out of action for significant periods
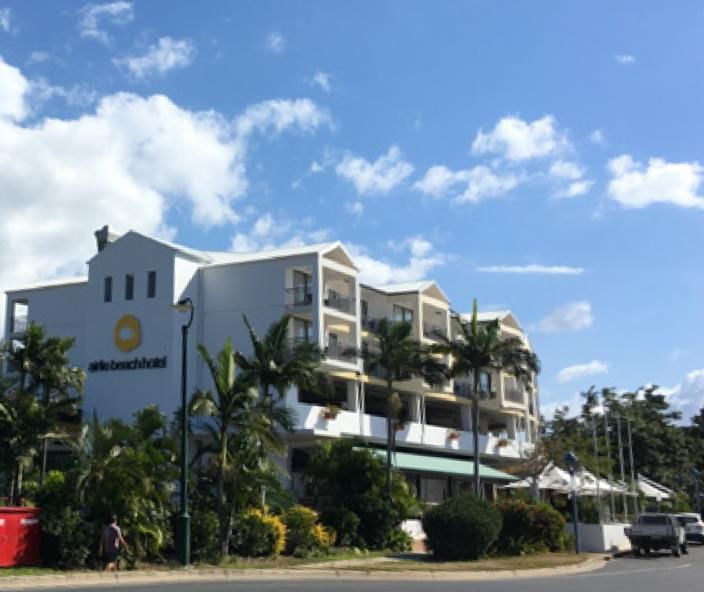
to allow for repairs and upgrades.12 CUSTOMER CASE STUDY: AIRLIE BEACH HOTEL
There was significant damage to Queensland industries, Positioned overlooking the idyllic Whitsundays,
particularly those in agriculture. Around $270 million the iconic Airlie Beach Hotel (ABH) felt the full
in damage was done to crops, with the damage to force of Cyclone Debbie on 28 March 2018. The
Queensland’s sugar industry alone estimated at around ABH’s accommodation, bars and retail businesses
$150 million.13 were forced to close following damaging winds
and relentless rains. Restoring the ABH to working
Many vegetable growers also felt significant economic order included significant remedial renovations
losses from the loss of crops which were damaged or throughout the premises to meet new building
destroyed in the cyclone, with some losing more than codes and repair storm damage.
half of the crops that were planted.14
Ongoing business interruption payments, a policy
This loss of production compounded economic losses benefit provided by VERO, helped meet the ABH’s
from pre-cyclone low prices for produce. A mild winter liabilities, such as the wages of full-time staff and
and early spring, in addition to extra crops that had been loss of revenue from businesses closed for repair.
planted to cover supply shortfalls, led to overproduction
of vegetables just before Cyclone Debbie. Following Economic recovery is slow, with tourist numbers
Cyclone Debbie, when prices spiked, many growers yet to return to pre-cyclone levels, though
were not able to take advantage of this due to damaged likely to be boosted by the commencement of
stock.15 the Whitsunday Regional Council’s $6.4 million
revitalisation of the Airlie Beach foreshore and
Direct economic losses from the disaster have been repairs to the cyclone damaged Whitsundays
estimated to be at least $3.5 billion.16 Airport.
12
Meixner, Webster, Riga & Major, 2018, ‘Cyclone Debbie one year on: ‘We’ve lost everything but we’re alive,’ ABC News, 28 March 2018, http://www.abc.net.au/news/2018-03-28/one-year-anniversary-cyclone-debbie-category-four-damage/9561974
13
Robertson, 2017, ‘Cyclone Debbie: Queensland reels at the scale of destruction,’ The Guardian, 1 April 2017, https://www.theguardian.com/australia-news/2017/mar/31/cyclone-debbie-queensland-reels-scale-destruction
14
Wilson, 2017, ‘Cyclone Debbie: Falling vegetable prices cause more pain for affected growers,’ Landline, 26 August 2017, http://www.abc.net.au/news/2017-08-26/why-cyclone-debbie-had-a-lasting-impact-on-vegetable-prices/8838086
15
Reynolds, 2017, ‘Dark reason for cheap tomatoes: Cyclone Debbie’s final insult,’ 29 September 2017, https://www.news.com.au/finance/economy/australian-economy/dark-reason-for-cheap-tomatoes-cyclone-debbies-final-insult/news-story/905cea3fdfec05cc34d84ecc011fad98
16
See Bureau of Meteorology, 2018.
17
McLeish, 2018, ‘Great Barrier Reef photos show ‘striking’ damage to coral after Cyclone Debbie,’ ABC News, 13 July 2017, http://www.abc.net.au/news/2017-07-13/comparison-photos-striking-damage-great-barrier-reef-cyclone-qld/8702192
ECONOMIC RECOVERY AFTER DISASTER STRIKES: A REPORT FOR SUNCORP
13RESULTS FIGURE 5: GROSS DOMESTIC PRODUCT SA3 IMPACT OF CYCLONE DEBBIE ($ MILLION)
In 2017, the economic impact of Cyclone Debbie
was estimated to be a $7 billion reduction in GDP.
This represents a 2.2 per cent decrease in GDP of
the areas impacted by Cyclone Debbie. This is the
result of disruption of normal economic
production, loss of crops and delayed mineral
exports, transfer of household and business
expenditure from other uses to disaster recovery
and the loss of economic infrastructure.
Figure 5 presents the reduction in GDP for each
Statistical Area 3 (SA3) impacted by Cyclone
Debbie. The largest impacts were where Cyclone
Debbie crossed the north Queensland coast.
Communities around the Whitsunday SA3
(Hamilton and Daydream Islands, Proserpine and
Airlie Beach) where it first made landfall and
Mackay SA3 saw their 2017 GDP reduced by 64.2
per cent and 28.4 per cent respectively. The Gold
Coast Hinterland felt a significant impact on GDP
of around 36.2 per cent due to heavy rains18 and
flash flooding from the cyclone19.
18
In excess of 300 millimetres on the 31st of March 2007
19
At this point Cyclone Debbie had been downgraded to a tropical depression
Source: SGS Economics & Planning
ECONOMIC RECOVERY AFTER DISASTER STRIKES: A REPORT FOR SUNCORP
14Figure 6 presents the 15 SA3s which experienced the largest impact on their 2017 GDP from Cyclone Debbie. Table 4 in the appendix provides the data for Figure 6. Suncorp
played a substantial role in assisting the process of economic recovery in the aftermath of Cyclone Debbie.
FIGURE 6: TOP 15 SA3 – PERCENTAGE IMPACT OF CYCLONE DEBBIE ON GDP
Nambour
The Gap - Enoggera
Caboolture Hinterland
Browns Plains
Ormeau- Oxenford
Richmond Valley- Coastal
Beaudesert
Jimboomba
Richmond Valley - Hinterland
Bowen Basin- North
Tweed Valley
Mudgeeraba- Tallebudgera
Mackay
Gold Coast- Hinterland
Whitsunday
0% 10% 20% 30% 40% 50% 60% 70%
Percentage Impact on Gross Domestic Product
Source: SGS Economics & Planning
ECONOMIC RECOVERY AFTER DISASTER STRIKES: A REPORT FOR SUNCORP
15FIGURE 7: SUNCORP CLAIMS & RECOVERY ACTIVITY – CYCLONE DEBBIE Figure 7 shows the spatial distribution of Suncorp’s insurance claims and recovery
activity following the disaster. In total, Suncorp paid over $543 million in insurance
claims, with household insurance claims accounting for almost three quarters of the
total ($402.1 million), and commercial claims amounting to $140.7 million (see Figure
8).
FIGURE 8: SUNCORP CLAIMS & RECOVERY ACTIVITY – CYCLONE DEBBIE
350
300
250
200
$ Million
150
100
50
0
Buildings Home contents Management Car Insurance Commercial Commercial Mainframe
costs Total Payouts Insurance Motor Property
Home Insurance Motor Commercial Insurance
Insurance
Source: Suncorp
Figure 9 presents the breakdown by the major Suncorp brands. Vero and Suncorp
Insurance accounted for over ¾ of total payouts. The majority of Vero’s payouts were
commercial related, while Suncorp Insurance policies were more focused on home and
content.
Claims and recovery activity accelerated the repair and reconstruction of damaged
buildings and infrastructure, allowing the economy to recover faster to pre-cyclone
levels.
Source: SGS Economics & Planning
ECONOMIC RECOVERY AFTER DISASTER STRIKES: A REPORT FOR SUNCORP
16FIGURE 9: CLAIMS & RECOVERY ACTIVITY BY BRAND – During 2017, Suncorp claims and recovery activity
CYCLONE DEBBIE boosted the economy (compared to a scenario of no
250
insurance payouts) of the areas impacted by Cyclone
Debbie by over $2.7 billion (0.8 per cent). In the
following year, as the stimulus of the payouts continue
200
to flow through local economies, an additional $1.9
billion will be added to Gross Domestic Product (0.6 per
150 cent). This improved economic performance is expected
($ Million)
to continue to at least 2021, with the economy being
100
$172 million higher because of Suncorp claims and
recovery activity. The cumulative economic impact over
5 years is estimated to be $6.1 billion
50
There is a significant range in the spatial distribution of
0 the economic stimulus of insurance payouts compared
Vero Suncorp AAMI APIA GIO Other
to the no insurance payout scenario, as the scale of the
Buildings Home contents Management costs Car insurance Commercial Insurance
disasters and the characteristics of the regions vary.
Source: Suncorp
FIGURE 10: ECONOMIC BENEFIT OF SUNCORP In most locations, the economy would have quickly
INSURANCE – CYCLONE DEBBIE returned to the long-term trend. Figure 11 presents the
with and without Suncorp insurance Gross Domestic
GDP Impact $ Million GDP Percentage Impact
Product scenarios for The Gap – Enoggera SA3. The
3,500 1.0%
area received around $4.4 million (86 per cent was for
0.9%
3,000 Commercial Insurance) because of Cyclone Debbie. The
0.8%
gap between the two lines represents the economic
2,500 0.7% benefit of Suncorp insurance.
GDP Percentage Impact
GDP Impact ($ Million)
0.6%
2,000
0.5% In the absence of insurance, The Gap – Enoggera SA3’s
1,500
0.4%
Gross Domestic Product would have returned to trend
0.3%
within four years. However, the insurance payouts
1,000
meant its economy did not suffer several years of sub-
0.2%
500
trend growth.
0.1%
0 0.0%
2017 2018 2019 2020 2021
Source: SGS Economics & Planning
ECONOMIC RECOVERY AFTER DISASTER STRIKES: A REPORT FOR SUNCORP
17FIGURE 11: THE GAP – ENOGGERA SA3 GDP ($ MILLION) Regional communities more severely impacted by Cyclone Debbie would have a different recovery profile.
With Suncorp Insurance Without Suncorp Insurance
For example, Mackay SA3 (as shown in Figure 12) would have experienced a much greater drop in economic
2,550 activity without Suncorp insurance. And even by 2020, the economy would not have been fully recovered.
2,500
The impact is even more pronounced in locations where key economic assets were destroyed by the
2,450
disaster. The Whitsunday SA3, which includes the holiday destinations of Hamilton and Daydream Islands,
2,400 Proserpine and Airlie Beach, was one of the hardest-hit regions. Much of its tourism infrastructure, on which
its economy relies, was destroyed. As of October 2018, Suncorp’s claims and recovery activity has injected
GDP ($ Millions)
2,350
more than $285 million, more than half of the total Cyclone Debbie payouts, to residents and businesses in
2,300
the Whitsunday SA3.
2,250
2,200
2,150
2,100
2016 2017 2018 2019 2020 2021
Source: SGS Economics & Planning
FIGURE 12: MACKAY SA3 GDP ($ MILLION)
With Suncorp Insurance Without Suncorp Insurance
7,500
7,000
6,500
6,000
GDP ($ Millions)
5,500
5,000
4,500
4,000
3,500
2016 2017 2018 2019 2020 2021
Source: SGS Economics & Planning
ECONOMIC RECOVERY AFTER DISASTER STRIKES: A REPORT FOR SUNCORP
18FIGURE 13: WHITSUNDAY SA3 GDP ($ MILLION)
With Suncorp Insurance Without Suncorp Insurance
1,400
1,200
1,000
800
GDP ($ Millions)
600
500
400
200
0
2016 2017 2018 2019 2020 2021
Source: SGS Economics & Planning
In the absence of Suncorp insurance payouts, the Whitsunday
SA3 would have suffered a permanent loss in Gross Domestic
Product of 23 per cent.
This is often the case for regional areas which have a narrower
economic base (often dominated by capital intensive sectors
like resources and agriculture) and more limited employment
opportunities compared to larger urban areas. As such, Suncorp
insurance plays a more significant role in mitigating adverse
outcomes and helping to restore normal economic activities.
ECONOMIC RECOVERY AFTER DISASTER STRIKES: A REPORT FOR SUNCORP
193.2 TATHRA BUSHFIRES (MARCH 2018) An inquiry in the fires later determined that the blaze
was made up of five separate fires, all of which were
OVERVIEW extremely fast moving and fierce. The pace and spread
of the fires was exacerbated by hot and dry winds.23 This
One in 10 Australians live in towns with populations of left little time for residents to react and take
less than 10,000 people. 20 At the time of the 2016 census precautions, with many forced to shelter on beaches as
there were just over 1,700 small towns, which form part the fires approached.
of the regional heart of Australia. Their economic growth
and social progress can have implications for Australia's The fires burned more than 1,250 hectares. No lives
overall competitiveness and standard of living. were lost, however 65 homes were destroyed, along
with 35 caravans and cabins.24 In addition to the direct
The New South Wales south coast town of Tathra is a impacts, the fires generated power outages and caused
typical small town with a population of around 1,000. many schools to be closed temporarily.
The Tathra bushfires broke out at around midday on
Sunday, 18 March 2018. At the same time, many other Preliminary investigations suggested that failures in
bushfires were burning across New South Wales, and the power lines or other electrical infrastructure were
fire danger rating on that day was one of the highest on the likely cause of the fires.25
record for the area.21
The fires have also generated flow-on impacts for
The fires began at the small locality of Reedy Swamp, residents. Many were displaced and required scarce
near Tarraganda, before spreading quickly towards temporary accommodation, potentially for periods of up
Tathra. At the time of the outbreak, the local to 18 months. Issues also arose from the need to
temperature was around 37 degrees celsius. The fires remove asbestos, which was present in many of the
were upgraded to emergency status around 3.40pm that dwellings and structures destroyed or effected by the
afternoon.22 fires.26
20
ABS, Reflecting Australia- Stories from the Census, 2016, Small Towns http://www.abs.gov.au/ausstats/abs@.nsf/Lookup/by%20Subject/2071.0~2016~Main%20Features~Small%20Towns~113
21
Department of Justice, 2018, ‘Bega Valley Fire Independent Review,’ Office of Emergency Management, June 2018, https://www.emergency.nsw.gov.au/Documents/publications/Bega-Valley-Fire-Independent-Review.PDF
22
Stuart, 2018, ‘Bushfire in Tathra took hold in 90 minutes, say RFS and terrified residents,’ ABC News, 19 March 2018, http://www.abc.net.au/news/2018-03-19/bushfire-in-tathra-timeline/9562916
23
See Department of Justice, 2018.
24
Knaus, 2018, ‘Tathra bushfire: class action considered against government-owned utility,’ The Guardian, 23 March 2018, https://www.theguardian.com/australia-news/2018/mar/23/tathra-bushfire-class-action-considered-against-government-
owned-utility
25
Knaus, 2018, ‘Tathra bushfire: NSW Rural Fire Service says power lines likely cause,’ The Guardian, 22 March 2018, https://www.theguardian.com/australia-news/2018/mar/22/tathra-bushfire-nsw-rural-fire-service-says-power-lines-likely-cause
26
See Knaus, 2018.
ECONOMIC RECOVERY AFTER DISASTER STRIKES: A REPORT FOR SUNCORP
20The fires were declared a disaster by the Australian Fortunately, many homes were saved, and no lives were
Government on 29 March, allowing for federal recovery lost in the blaze. The experience of the emergency CUSTOMER CASE STUDY: TATHRA BUSHFIRES
assistance to be provided.27 The New South Wales services, both professional and voluntary, has been
Government and Bega Valley Shire Council also provided reviewed following the Tathra fires. It's now likely that Suncorp’s specialist home assessors, client
financial and other assistance. The New South Wales improvements and investment in NSW emergency managers and major loss building partners
Government initiated a $10 million clean-up package to services' communications, technology and public operated out of the Bega Recovery centre
assist in the removal of asbestos contaminated material, warning systems will also be a result of the fires. 32 following the Tathra bushfires in March 2018. GIO
dangerous debris including destroyed homes and trees, customer, Jennifer*, lost her Tathra house which
and concrete slabs.28 It also agreed to fund the expansion she used as a holiday rental and investment.
of the Council’s tip to allow for the disposal of hazardous
waste safely. Bega Valley Shire has also provided The house was assessed as a total loss and a
additional support through the Tathra and District Fire cash settlement for sum insured was arranged.
Recovery and Resilience Grants program, with $50,000 The cash settlement discharged the mortgage on
available to community groups.29 the property and she is now in discussion with
neighbours regarding plans for a rebuild or sale to
To reduce the potential impact on tourist numbers - an an investor.
important component of the local economy - a tourism
support package of $100,000 was also provided by the For the moment, many Tathra blocks remain bare
NSW Government to go towards marketing and and former long-term residents have moved from
publicity programs for the area while it is recovering.30 the town which has not recovered to pre-bushfire
Many accommodation businesses reported losing levels.
bookings in the aftermath of the fires, though the
economic impact has been somewhat offset by new *Names have been changed. (Photo credit:
bookings and day trippers from nearby areas.31 Suncorp supplied)
27
Australian Government, 2018, ‘Tathra bushfires declared a disaster,’ 3 April 2018, https://www.acnc.gov.au/ACNC/Comms/LN/LN_20180403.aspx
28
NSW Government, 2018, ‘Bushfire clean-up assistance for Tathra residents,’ 26 March 2018, https://www.nsw.gov.au/news-and-events/news/bushfire-clean-up-assistance-for-tathra-residents/
29
Bega Valley Shire Council, 2018, ‘Recovery and Resilience Grants,’ https://www.begavalley.nsw.gov.au/cp_themes/default/page.asp?p=DOC-DWB-60-54-35
30
Destination NSW, 2018, ‘Tourism support package announced for Tathra,’ 26 March 2018, https://www.destinationnsw.com.au/news-and-media/media-releases/tourism-support-package-announced-for-tathra
31
Thomas, 2018, ‘Tathra welcomes tourist over busy Easter holiday as town rebounds from devastating bushfire,’ ABC News, 2 April 2018, http://www.abc.net.au/news/2018-04-02/tourists-return-to-tathra-to-help-town-after-bushfire/9610242
32
Griffiths, 2018, ‘Tathra bushfires: Inquiry finds ‘palpable animosity’ between NSW firefighting agencies,’ ABC News, 7 July 2018, http://www.abc.net.au/news/2018-07-07/tathra-bush-fire-report-finds-communication-problems/9953118
ECONOMIC RECOVERY AFTER DISASTER STRIKES: A REPORT FOR SUNCORP
21RESULTS
In 2018, the economic impact of the Tathra bushfire was estimated to
be a $207 million reduction in GDP. This represents a 33.7 per cent
decrease in GDP of the area impacted by the bushfire. Figure 14
presents the GDP of the Tathra Statistical Area 233 under a business as
usual scenario and with the impact of the bushfire.
FIGURE 14: TATHRA SA2 GDP ($ MILLION)
With Suncorp Insurance Without Suncorp Insurance
700
600
500
GDP ($ Millions)
400
300
200
100
0
2016 2017 2018 2019 2020 2021
Source: SGS Economics & Planning
As of August 2018, Suncorp had paid out $6.9 million in claims
related to the Tathra bushfire. Household insurance claims
account for 98.3 per cent ($6.8 million) of total claims.
These insurance payouts for claims and recovery activity have helped to
add $4 million during 2018 to the local economy of Tathra and helped to
reduce the economic impact of the bushfires.
33
Given the size of the SA3 in which Tathra is located, the economic analysis was conducted at the smaller SA2 level.
ECONOMIC RECOVERY AFTER DISASTER STRIKES: A REPORT FOR SUNCORP
223.3 HOBART FLOODS (MAY 2018) The floods damaged UTAS’ $5 million high performance The Insurance Council of Australia (ICA) declared the
computing cluster, that was part of a purpose-built floods a catastrophe, with more than 1,000 claims
OVERVIEW research data centre.38 The University’s Law Library was lodged in the first 24 hours of the disaster. The ICA later
also particularly affected by inundation.39 reported that $45 million worth of insurance claims had
The Hobart floods that occurred on Friday, 11 May 2018, been lodged in the month after the floods, including a
were generated by an intense low-pressure system, The floods generated significant power outages, with record number of claims with the Royal Automobile Club
which later caused cold snaps and snowfall in NSW. This over 12,000 homes and businesses across Tasmania left of Tasmania (RACT).43
weather system generated a combination of heavy rain, without power, with some areas such as Sandy Bay
wind and thunderstorms.34 particularly affected. Across the area, 19 schools were The floods had further impact beyond damage to
closed in the aftermath of the floods. The Royal Hobart property, as many businesses were forced to remain
Hobart’s CBD was hit particularly hard by record rainfall, Hospital was also damaged by leaks and flooding, and closed, leaving their employees without work and
recording over 100 millimetres in a single day. This was impacted the number of available beds.40 income.44
the first time this had happened in May and doubled the
previous record.35 Nearby areas surrounding the city, The floods were declared a natural disaster on 14 RESULTS
such as Mount Wellington, Leslie Vale and Grove May, triggering the provision of federal funding and grant
received over 200 millimetres.36 assistance under the National Disaster Relief In 2018, the economic impact of the Hobart floods
and Recovery Arrangements. This includes grants for was estimated to be a $908 million reduction in local
The flooding caused roads to turn into rivers and swept temporary living expenses, replacement of essential GDP. This represented a 7.5 per cent decrease in GDP for
away cars in Central Hobart, Sandy Bay, South Hobart, household items, and repair and restoration grants of up the areas impacted by the flooding.
Lenah Valley and Kingston.37 Hundreds of calls were to $9,200.41
made to emergency services. As a result of the Hobart floods, Suncorp paid out $8.9
In addition to damage from inundation on homes and million in insurance claims and recovery activity (up to
The University of Tasmania (UTAS) campus was businesses in the core of Hobart, the floods caused August 2018). Household insurance claims account for
significantly inundated, forcing the evacuation of serious damage to roads and walking trails around almost 90 per cent ($7.9 million), and commercial claims
students and the campus to be closed for a period. Mount Wellington.42 amounted to $1.4 million.
34
AAP, 2018, ‘Flash flooding hits Hobart after torrential rain, snow falls in NSW,’ The Guardian, 11 May 2018, https://www.theguardian.com/australia-news/2018/may/11/flash-flooding-hits-hobart-after-torrential-rain
35
ABC News, 2018, ‘Hobart weather: Record rain, flash flooding inundate CBD and parts of southern Tasmania,’ 11 May 2018, http://www.abc.net.au/news/2018-05-11/hobart-weather-flash-flooding-record-rainfall/9750032
36
The New Daily, 2018, ‘’Flood catastrophe’: Record rainfall leaves Hobart with $5m damages bill,’ 12 May 2018, https://thenewdaily.com.au/news/state/tas/2018/05/12/hobart-flood-catastrophe/
37
Maloney & Bailey, 2018, ‘2018 Hobart floods: a short summary of events,’ The Examiner, 11 May 2018, https://www.examiner.com.au/story/5395787/flood-grinds-hobart-to-a-halt/?cs=87
38
Crozier, 2018, ‘University of Tasmania loses $5m HPC cluster to floods,’ 17 May 2018, https://www.itnews.com.au/news/university-of-tasmania-loses-5m-hpc-cluster-to-floods-491134
39
Whiting, 2018, ‘Schools, University of Tasmania reopen after record flood as clean-up continues,’ ABC News, 14 May 2018, http://www.abc.net.au/news/2018-05-13/university-of-tasmania-to-reopen-after-flood-damage/9756404
40
See Maloney & Bailey, 2018.
41
Carlyon, 2018, ‘Hobart floods declared a natural disaster as Lord Mayor puts damage cost in ‘tens of millions,’ ABC News, 14 May 2018, http://www.abc.net.au/news/2018-05-14/hobart-floods-declared-natural-disaster/9759794
42
See Carlyon, 2018.
43
Blackwood, 2018, ‘Hobart flooding declared ‘catastrophe’ as wild Tasmanian storm eases and tracks north,’ ABC News, 11 May 2018, http://www.abc.net.au/news/2018-05-11/tasmanian-hobart-flood-and-storm-damage-declared-a-catastrophe/9752564
44
Shine, 2018, ‘Hobart flood victims’ lives remain disrupted as they wait for answers, repairs and assistance,’ ABC News, 6 June 2018, http://www.abc.net.au/news/2018-06-06/hobart-flood-clean-up-continues-residents-wait-for-repairs/9837794; Glumac, 2018, ‘Hobart flooding
clean-up continues with the damage bill running into millions,’ ABC News, 12 May 2018, http://www.abc.net.au/news/2018-05-12/hobart-flooding-clean-up-worst-storm-in-decades/9753434
45
See Shine, 2018.
ECONOMIC RECOVERY AFTER DISASTER STRIKES: A REPORT FOR SUNCORP
23During 2018, the payouts for claims and recovery activity by Suncorp will have boosted the economy (compared to a scenario of no insurance payouts) of Hobart by over $94
million (0.5 per cent). In the following year, as the stimulus of insurance payouts continues to flow through the local economies an additional $47 million will be added to GDP
(0.3 per cent). The improved economic performance will continue to at least 2020, with the economy being $36 million higher because of Suncorp payouts.
FIGURE 15: SUNCORP CLAIMS & RECOVERY ACTIVITY – HOBART FLOODS FIGURE 16: ADDITIONAL ECONOMIC BENEFIT FROM SUNCORP INSURANCE
4.0 GDP Impact $ Million GDP Percentage Impact
100 0.60%
3.5
90
3.0 0.50%
80
2.5
70
0.40%
$ Million
GDP Impact ($ Million)
GDP Percentage Impact
2.0 60
1.5 50 0.30%
1.0 40
0.20%
30
0.5
20
0.0 0.10%
Buildings Home contents Management Car Insurance Commercial Commercial Mainframe
10
costs Total Payouts Insurance Motor Property
Home Insurance Motor Commercial Insurance 0 0.0%
Insurance
2018 2019 2020 2021
Source: Suncorp Source: SGS Economics and Planning
ECONOMIC RECOVERY AFTER DISASTER STRIKES: A REPORT FOR SUNCORP
24CUSTOMER CASE STUDY: HOBART
FLOODS
APIA customer, self-funded retiree and
Hobart resident, Harry*, had his
basement storage area inundated with
water and mud during Hobart’s floods on
11 May 2018. Suncorp’s repair partners
rendered Harry’s house safe and began
work on repairs immediately. Harry was
provided with paid accommodation
nearby for the duration of the repair
work to his house.
Engaging a local workforce, Suncorp
managed the process of mud and debris
removal from Harry’s basement and
itemised the contents that were unable
to saved. With the underfloor areas
dried, work then began to restore his
flooring and damaged timber. As
a retiree, Harry was grateful for the
accommodation and peace of mind that
repairs were being rendered on his
house. Insurance supported Harry to
return to his pre-flood situation, as well
as the means to look after himself during
the repairs process.
*Names have been changed. (Photo
credit: Suncorp supplied)
ECONOMIC RECOVERY AFTER DISASTER STRIKES: A REPORT FOR SUNCORP
25Conclusion
Some natural disasters can
wreck a local economy and cause
a significant, and permanent
reduction in the community’s ability
to generate income.
ECONOMIC RECOVERY AFTER DISASTER STRIKES: A REPORT FOR SUNCORP
2604 CONCLUSION
In the first 12 months following Cyclone Debbie, As was the case with the Whitsundays, without
Tathra’s bushfires and Hobart’s floods the estimated insurance, it is possible that a town's economy may
economic boost from Suncorp’s claims and recovery never fully recover from a natural disaster, since damage
activity following was $2.8 billion (0.8 per cent of GDP). leads in some cases to a permanently impaired
productive capacity. These towns often have limited
Between 2016-2018 there were over 120 natural options when disaster strikes and benefit more from the
disasters in Australia.45 These disasters impacted urban economic stimulus of insurance than urban centres,
and regional centres alike and are a traumatic such as Hobart.
experience for everyone involved. Homes are damaged
and destroyed, business premises and important Insurance plays a significant role in mitigating adverse
infrastructure are impacted. Normal economic outcomes and helping to restore normal economic
production is disrupted as workers can’t get to work, activities following disasters. The value of insurance is
or factories sit idle without raw material. clear for areas that have limited employment
opportunities, or a narrower economic base compared
This report has considered three disasters and the role to urban areas that can absorb the economic losses of a
that insurance had to mitigate the adverse economic disaster more easily.
impact. We modelled how income from insurance
claims and recovery activity helped to bring stability to With large parts of Australia at growing risk from
an economy following the initial shock from the tropical cyclones, bushfires, storms and floods, the
disaster, and the economic stimulus from claims importance of insurance is only increasing. The role of
payouts promoted a more rapid return to normal insurance is especially vital in regional Australia, where
economic activity. there is a combination of increased risk of natural
disasters and communities with a narrower economic
Small towns are the backbone of regional Australia base. After disaster strikes, insurance means that the
with one in ten Australians living in towns with economic impacts are not permanent.
populations of less than 10,000 people. There are
around 1,700 such towns in Australia.
45
As of October 2018, there were 36 disasters in 2018, 43 disasters in 2017, and 45 disasters in 2016. See https://www.disasterassist.gov.au/
ECONOMIC RECOVERY AFTER DISASTER STRIKES: A REPORT FOR SUNCORP
27You can also read


