The Effects of the Economic Adjustment Programmes for Greece: A Quasi-Experimental Approach
←
→
Page content transcription
If your browser does not render page correctly, please read the page content below
sustainability

Article
The Effects of the Economic Adjustment Programmes for
Greece: A Quasi-Experimental Approach
Julio Revuelta

                                          Department of Economics, University of Cantabria, 39005 Santander, Spain; julio.revuelta@unican.es

                                          Abstract: Three Economic Adjustment Programmes (EAPs) were implemented in Greece, between
                                          2010 and 2015, without achieving the proposed economic objectives. This article analyses the impact
                                          of the EAPs in Greece using the synthetic control method (SCM) and has three main contributions.
                                          First, it identifies a long-term negative impact worth 35.3 per cent of the Greek GDP per capita caused
                                          by the application of the EAPs. Second, it finds that three-quarters of the estimated negative and
                                          unsustainable impact accumulated over the 2010–2012 period. Third, it identifies a regressive effect
                                          of the EAPs on income distribution, the Greek population with lower incomes experienced a greater
                                          negative effect caused by the adjustment programmes. These results underscore the need to review
                                          and correct the conditional financial assistance framework currently in force in the European Union.

                                          Keywords: conditionality; debt crisis; economic adjustment programme; financial assistance; Euro-
                                          zone; Greece


                                   1. Introduction

Citation: Revuelta, J. The Effects of
                                                Managing the Great Recession has been one of the biggest challenges in the history of
the Economic Adjustment
                                          the European Union (EU) [1,2]. After an initial response involving expansionary policies,
Programmes for Greece: A                  the Eurozone economies failed to return to the desired stable growth pattern and moved to
Quasi-Experimental Approach.              progressively adopt fiscal consolidation measures [3,4]. In the second quarter of 2011, the
Sustainability 2021, 13, 4970.            growth to which the Eurozone had returned after the 2008–2009 recession started to decline
https://doi.org/10.3390/su13094970        resulting in a new recession in 2012. The main factors that led to this economic contraction
                                          include financial imbalances due to the high degree of indebtedness of the economic agents,
Academic Editor: Mihaela Onofrei          the risk of financial contagion, macroeconomic divergences in the Eurozone, the decrease
                                          in fiscal space, the rigidity of the monetary union, and the absence of economic policy
Received: 18 March 2021                   tools to compensate for this rigidity [5,6]. Furthermore, the economic problems had an
Accepted: 22 April 2021                   asymmetrical impact on the countries in the European Monetary Union (EMU). The case of
Published: 28 April 2021                  Greece stood out due to the severity of its economic and financial situation [7].
                                                Over a decade after the beginning of the crisis, at the end of 2019 (before COVID-19
Publisher’s Note: MDPI stays neutral      impact), Greece had lost more than 22% of its gross domestic product (GDP) and maintained
with regard to jurisdictional claims in   an unemployment rate of about 17%. Meanwhile, in the Eurozone, after overcoming the
published maps and institutional affil-   impact of the crisis, the GDP was 9% higher than it was before the Great Recession and the
iations.
                                          unemployment rate was below 8%. Given the relevance of the economic and political crisis
                                          in Greece, as well as its duration and intensity, it is essential to heighten the knowledge
                                          regarding the real impact of the public policies employed. With this objective, this study
                                          empirically identifies the productive and distributional effects caused by the Economic
Copyright: © 2021 by the author.          Adjustment Programmes (EAPs) which conditioned financial assistance to Greece.
Licensee MDPI, Basel, Switzerland.              The literature provides a great deal of knowledge with respect to the reasons, strategies,
This article is an open access article    and determinants that led to the decision of negotiating and approving the financial
distributed under the terms and           assistance plans and their conditionality [8–10]. However, much less is known about the
conditions of the Creative Commons
                                          causal effects of these plans on the economy. This article makes three contributions to the
Attribution (CC BY) license (https://
                                          literature. First, it empirically identifies the productive impact that the EAPs had on Greece.
creativecommons.org/licenses/by/
                                          It identifies a long-term negative impact of 35.3% on the Greek GDP per capita. Second, the
4.0/).

Sustainability 2021, 13, 4970. https://doi.org/10.3390/su13094970                                      https://www.mdpi.com/journal/sustainability
Sustainability 2021, 13, 4970                                                                                          2 of 15

                                results provided by this article contribute to understanding the chronological dynamics
                                of the impacts caused by the programmes. Most of the unsustainable negative impact
                                was accumulated between 2010 and 2012. Third, it identifies a regressive effect caused by
                                policies stemming from the application of the EAPs.
                                     The rest of this article is structured as follows. The second section presents the
                                development of the crisis to contextualise the characterisation of the EAPs and the financial
                                assistance for Greece. The third section lays out the methodological details of the synthetic
                                control method (SCM), as well as the data used. The fourth section shows the results
                                obtained in the productive and distributional dimensions. Finally, the last section provides
                                the conclusions and some public policy implications of this study.

                                2. Crisis and Financial Assistance for Greece
                                      Since the creation of the Eurozone, its members have accumulated asymmetrical
                                imbalances [11–13]. The Greek economy, which has been a member of the EMU since 2001,
                                experienced high growth, but also accumulated large imbalances. Between 2001 and 2007,
                                Greece increased its GDP by 27% (Eurostat is the source for the data shown in this section),
                                twice as much as the European average. However, the composition of the Greek productive
                                structure conditioned its dependence on financing from abroad and on its growing current
                                account deficit. The current account balance went from −6.9% of GDP in 2001 to −14% in
                                2007. Likewise, the labour costs and productivity showed imbalances. Compensation per
                                employee increased 45% since the introduction of the Euro until 2007, tripling the growth
                                of productivity per worker. The fiscal component was also imbalanced. Between 2001 and
                                2007, the Greek public deficit was between 5.5% and 8.8% of GDP per year, and public debt
                                was always above 100% of GDP.
                                      These vulnerabilities proved critical during the Great Recession. The restriction
                                in financial flow kept the Greek banking system under a great deal of pressure. The
                                contraction in aggregate demand took the country into recession in the third quarter of
                                2008. In the EU, the initial response to the recession consisted of expansionary policies
                                and bank bailouts. These measures seemed to improve the situation in the Eurozone
                                by mid-2009, but the imbalances had not been corrected and there were no common
                                economic policy tools to compensate for them. As such, given the absence of autonomy to
                                devalue their currency, in the event that the economic situation worsens, countries with
                                competitive vulnerability and dependence on external financing were bound to face an
                                internal devaluation process [14,15]. This was the case in Greece.
                                      After the October 2009 elections, the new Greek government of George Papandreou
                                (Panhellenic Socialist Movement, PASOK) recognised that the figures on public finances
                                were much worse than those presented by the previous government [16]. That year, the
                                Greek GDP decreased by 4.3%; public deficit increased to an unsustainable 15.1%, and
                                public debt rose to 126.6% of GDP. The economic crisis had turned into a sovereign debt
                                crisis. The possibility of financial assistance to Greece was conditioned by its serious
                                economic and financial situation, the lack of confidence in the political and economic
                                management of the country, the existing tensions in other European countries, and the risk
                                of contagion within the Eurozone itself [8,17,18].
                                      The challenge for the European governments was to stabilise the economic situation
                                by avoiding the non-payment of public debt, the bankruptcy of the banking system, and
                                the collapse of the Euro [19]. All of these in a context of asymmetrical interdependence.
                                The political and economic differences of the countries in the EU became apparent during
                                the discussion and management of the crisis. The governments of countries with the best
                                competitive positions and with less problems in their public accounts, led by the German
                                position, aspired to limit moral hazard on a European scale and to keep the support of
                                their national electorate, which were unfavourable to concessions to debtor countries.
                                They argued that financial assistance should be granted in the form of loans subject to
                                strict conditionality based on fiscal consolidation measures, internal devaluation, and
                                structural reforms. Meanwhile, countries with the worst competitive position and serious
Sustainability 2021, 13, 4970 3 of 15
problems in their public finances, an example of which was Greece, insisted that access
to financial flow that would reduce the pressure of financing costs was necessary. This
would make it easier to sustain public finances and the banking system, creating a base
for economic recovery and the payment of debts. Thus, they opposed programmes with
harsh adjustments and internal devaluation, given the depressive effect these would have
on their damaged economies and the unpopularity of these reforms for their electorate [20].
The plan that finally prevailed was the financial assistance subject to strict conditionality,
which was more in line with the position advocated by governments of creditor countries
and the previous experience of the International Monetary Fund (IMF) [9,21,22].
2.1. The First EAP for Greece
Between December 2009 and January 2010, the main rating agencies downgraded the
credit rating of Greece, and interests on Greek bonds increased significantly. The Greek
government announced austerity and fiscal consolidation measures [19]. However, these
did not have enough credibility, and the cost of financing the Greek debt continued to
increase. The annual interest on the long-term public debt went from 4.6% in October 2009
to 7.8% in April 2010. Given their inability to meet financing needs (in 2010, Greece needed
to finance €60.8 billion to cover costs relating to debt maturity and to pay salaries and
pensions [10]), in April 2010, the Greek government requested financial assistance from
the European Commission (EC), the European Central Bank (ECB), and the IMF [23]. The
negotiations of the assistance programme yielded a result that was more in line with the
position of governments advocating for financial assistance subject to strict conditionality.
On 2 May 2010, the Eurogroup approved the EAP for Greece for the 2010–2013 period.
Loans worth €110 billion were provided to Greece. Of this total, €80 billion were bilateral
loans from members of the Eurozone, grouped by the EC through the Greek Loan Facility
(GLF), while €30 billion came from the IMF. The overall objective of the programme was
to permanently restore the credibility of Greece for investors [23]. In the short term, the
programme objectives were to restore confidence and to maintain the financial stability
through fiscal consolidation and liquidity and stability policies for the banking system. In
the medium term, the objectives set out to improve competitiveness and realise a structural
change towards an export-led growth model.
Disbursement of this financing, which started on 18 May 2010, was to be completed in
tranches, subject to the Greek government fulfilling the conditionality of the memorandum
of understanding (MoU). The monitoring and evaluation of compliance with conditionality
was to be carried out by the triad of institutions known as ‘Troika’, which is composed of
the EC, ECB, and the IMF [23]. This conditionality included fiscal adjustments until 2014,
worth 14.5% of the Greek GDP. This aimed at transforming the primary balance deficit of
8.6% of GDP in 2009 into a primary surplus of 5.9% by 2014 and at reducing public debt
starting in 2013, when it would reach a maximum of 149.6% of GDP.
The main fiscal measures included salary cuts for public employees; reduction in
the number of public employees; cuts in pensions; reduction of investments and public
consumption; reorganisation and reduction of local administration; increase in value added
tax (VAT); increase in specific fuel, tobacco, and alcohol taxes; special levy on corporate
profits; increased taxes on real estate; and the fight against tax fraud. Structural measures
were also included to modernise and reform the pension and health system, as well
as the tax administration; to strengthen liquidity lines for the banking system and the
reform of the banking supervision system; to create the Financial Stability Fund with a
capital of €10 billion in order to reinforce bank capitalisation; to increase flexibility of the
labour market; to liberalise the transportation, gas, and electricity sectors; to eliminate
administrative requirements and barriers for companies in order to promote competition;
and to implement a privatisation plan for public assets [23].
The Greek crisis intensified in 2010, with a 5.5% drop in their GDP, and increased social
unrest due to the austerity measures included in the EAP. Meanwhile, in the Eurozone
the GDP was growing above 2%, although not all countries shared this recovery. InSustainability 2021, 13, 4970 4 of 15
Ireland, the serious problems with the banking system and their bailout led the Irish
government to sign an EAP in December 2010 [24]. During 2011, the economic situation of
the Eurozone started to deteriorate reaching a new recession in 2012. The pressure on the
most vulnerable economies was so intense that Portugal, in May 2011 [25], and Spain, in
July 2012 [26], also signed financial assistance programmes conditioned by adjustment and
fiscal consolidation policies.
2.2. The Second EAP for Greece
The most serious economic situation among the members of the EMU was experienced
once again by Greece. In 2011, the Greek GDP fell by 9.1%, public deficit reached 10.3%
of GDP, public debt rose to 172.1% of GDP, and the interest of the long-term public debt
exceeded 20% per annum in December. High unemployment, lack of liquidity in the
banking system, problems with the adoption of the first EAP measures, and the harshness
of its conditionality weakened internal demand in the Greek economy even further [27]. The
position of the Greek government had also become weaker, both internally and externally.
In November 2011, the failed referendum proposed by Papandreou regarding a second
EAP marked the end of his government. In its place, a temporary technocratic government
lead by Lucas Papademos was appointed to negotiate the conditions of the new programme
for financial assistance [28].
The second EAP was approved by the Eurogroup on 14 March 2012, without having
completed the previous programme. It was agreed that financing for Greece would be pro-
vided for four years through the amounts not yet disbursed from the previous programme
plus additional €130 billion. In total, with this second EAP, Greece was to receive €144.7
billion through the European Financial Stability Facility (EFSF) and €28 billion from the
IMF [29]. A decrease in interests from the previous programme, an extension of the period
for loan repayment and, for the first time, a significant voluntary cut in the debt by private
creditors were also included [29]. This was all subject to a conditionality that continued
and intensified the austerity approach adopted in the first plan.
Aside from continuing with measures from the previous EAP, financing through this
second programme was conditioned by an additional effort in the fiscal adjustment. The
objective was to achieve a primary surplus of 4.5% of GDP in 2014 and a public debt
of 120% of GDP by 2020. To fulfil this objective, the following measures were expected:
intensification of fiscal consolidation measures in terms of reducing public jobs and wages,
cuts in social spending and public investment, restructuring of the public sector and closure
of public entities, fight against tax evasion, and intensification of the privatisation process
by reinforcing the role of the Hellenic Republic Asset Development Fund (HRADF) to
obtain €50 billion. Likewise, they were looking to continue the internal devaluation process
through flexibilisation measures of the labour market and salary reductions, highlighting a
22% reduction in the general minimum wage, with an additional 10% cut for people under
25 years of age. For the banking system, reinforcing the recapitalisation and resolution
processes, which were estimated at €50 billion, was the priority. Furthermore, it was sought
to focus on decreasing the number of barriers for businesses, especially in the service sector,
and accelerating the liberalisation of sectors such as transportation and energy [29].
2.3. The Third EAP for Greece
In June 2012, after the second programme was launched, Antonis Samaras (New
Democracy, ND) was named as the new Greek Prime Minister. The harshness of the
conditionality and the crisis in the Eurozone, despite the expansionary monetary policies
adopted by the ECB [3], were damaging Greece’s internal and external demand, respectively.
The Greek GDP fell by 7.3% in 2012. The Greek economy had been experiencing a year-to-
year drop in GDP for the last six years, until in 2014 the country showed a slight economic
improvement with an annual increase of 0.7%. However, the accumulated dissatisfaction
was so great that the elections of January 2015 were won by the coalition lead by AlexisSustainability 2021, 13, 4970 5 of 15
Tsipras (Coalition of the Radical Left–Progressive Alliance, SYRIZA) [30]. The new Prime
Minister of Greece promised to end the austerity policies of both EAPs [10].
With this idea, the new government started negotiating a financial assistance pro-
gramme to replace the previous one [19]. By the end of 2014, the Greek debt was reaching
178.9% of GDP, with a public deficit of 3.6%. During the negotiations, the economic situ-
ation in Greece severely deteriorated. The annual interest rate on long-term public debt
doubled between September 2014 and March 2015, exceeding 10% from that month to
August. The Greek financial system was under severe liquidity strains, which peaked in
June and July 2015 with the controls of capital, closure of banks, restrictions on the cash
withdrawal to deal with capital flight, and the loss of liquidity from the ECB [17,28]. The
Greek people rejected the strict conditionality of financial assistance in the referendum
of 5 July 2015 proposed by Tsipras [31]. Nevertheless, strong economic and financial
pressure led the Greek government to accept a third EAP that maintained the principle of
conditionality of the previous two [7].
The Eurogroup approved the third EAP for Greece on 14 August 2015. This pro-
gramme facilitated financing for Greece for the next three years with a loan of €86 billion
through the European Stability Mechanism (ESM), subject to complying with a new set
of measures. An additional fiscal adjustment to reach a primary surplus of 3.5% of GDP
in 2018 was among the new conditions laid out in the MoU. This adjustment was based
mainly on increasing VAT collection by 1% of GDP, reforming income tax to make it more
progressive and improving its collection, eliminating tax deductions, modernising the tax
administration, reinforcing measures against tax evasion and fraud, reforming and de-
creasing spending on pensions and health, reducing military spending, and reforming the
social transfer system to save 0.5% of GDP by targeting the system on the most vulnerable
population and establishing a guaranteed minimum income. Other relevant conditional
measures, in this case directed towards the banking system, focused on the disposal of
up to €25 billion to recapitalise banks and fight against the problem of non-performing
loans. The flexibilisation of the labour market was also expanded. Other goals were to
modernise the educational system, remove administrative barriers, and liberalise the goods
and services markets, following recommendations from the Organisation for Economic
Cooperation and Development (OECD), with special emphasis on the energy sector. Re-
garding privatisations, an influx of €6.4 billion until 2017 was expected from the Asset
Development Plan of the HRADF and the creation of a new fund to obtain €50 billion from
the privatisation process [32].
After the third EAP, the new elections of September 2015 were won by Alexis Tsipras
(SYRIZA). By the end of 2015 the Greek GDP had decreased by 0.4%. The crisis extended
to 2016, when the GDP decreased by 0.2%. Nonetheless, starting in the third quarter
of 2016, the Greek economy went back to a growth pattern. However, this growth was
weak, without reaching 2% annually, and did not overcome the growth in the Eurozone
until 2019.
3. Materials and Methods
The SCM is especially suitable for estimating the impact of an intervention or treatment
that affects a unit or a small number of units, such as regions or countries, at an aggregate
level [33]. Recent examples where SCM was used for estimating the causal impact on issues
relating to European integration include Puzzello and Gomis-Porqueras [34] concerning the
Euro, Born et al. [35] on Brexit, and Campos, Coricelli, and Moretti [36] on the integration
of new members.
The SCM is used to identify the effect of an intervention or treatment by comparing,
over the post-intervention period, the outcome of the aggregate treated unit with the
outcome of the same unit had it not been subjected to the treatment. However, once the
intervention has been carried out, it is impossible to observe the outcome that the treated
unit would have had it not been subjected to it. As such, a counterfactual that is closest to
this situation is estimated to compare and identify the effect of the intervention [37]. ToSustainability 2021, 13, 4970 6 of 15
build the counterfactual, this quasi-experimental methodology selects a synthetic control
as a weighted combination from a donor pool of comparable units not subjected to the
intervention. This empirically driven selection is completed using a vector of characteristics
or outcome predictor variables over the pre-intervention period, which may include pre-
intervention observations from the outcome itself [38]. According to Abadie, Diamond and
Hainmueller [38], the difference between the preintervention characteristics of the treated
unit and the synthetic control is given by the vector X1 – X0 W, where X1 is the k x 1 vector
of k characteristics of the treated unit, X0 is the k × J vector of k characteristics of the J
control units, and W is a weight matrix. The SCM selects the synthetic control choosing W*
as the value of W that minimizes ∑km=1 vm (X1m − X0m W)2 during the pretreatment period,
where vm is a weight that reflects the relative importance assigned to the m-th variable.
The formation of the synthetic control is then optimised by minimising the prediction
error between the outcome of the treated unit and that of the counterfactual estimated in
the pre-intervention period. The SCM estimator of the causal effect of the intervention
or treatment, τ1t , is given by the comparison of postintervention outcomes between the
treated unit and the synthetic control, τ1t = Y1 – Y0 W* [33,37,38].
This study considers Greece as the treated unit. The treatment or intervention is
represented by the EAPs applied since 2010. Therefore, the start year of the intervention is
2010, when Greece signed the first MoU and started applying its measures. The considered
pre-intervention period is from 1990 until 2009. The considered post-intervention evalu-
ation period is from 2010 until 2017. The donor pool is composed of the 23 countries in
the EU for which EAPs were not applied (Cyprus, Ireland, Portugal, and Spain were all
excluded from the donor pool for having signed MoUs for EAPs between 2010 and 2013).
The outcome considered as an indicator of economic performance is the GDP per capita,
expressed in constant 2011 US$. For outcome predictors during the pre-intervention period,
the following indicators were used based on the literature [36,37,39]: gross fixed capital
formation as a percentage of GDP, annual rate of population growth, share of agriculture,
forestry and fishing in GDP, share of industry in GDP, mean years of schooling for the
population over 25 years, and the GDP per capita prior to the first EAP. All the predictor
variables were considered for the entirety pre-intervention period, except for the GDP per
capita. In this case, the values for a reduced pre-intervention period, 2000–2009, were taken
into account as predictors to avoid overfitting problems). The data for GDP per capita was
taken from the Penn World Table [40,41], while all the other predictor variables were taken
from the World Development Indicators [42], except the mean years of schooling which
was obtained from Jordá and Alonso [43].
The main advantages of using the SCM is that, considering the presence of unobserved
time-varying confounders, it avoids endogeneity bias due to omitted variables; it is suitable
to be applied in small samples of comparable aggregate units; it identifies the optimal
counterfactual in a way that is transparent and empirically driven; and it provides an
estimate that is more realistic than the usual linear regressions by not allowing extrapolation
in the weighting when forming the counterfactual [33,39,44].
However, for the use of SCM to provide an advantage over alternative methodologies
it must be ensured that: the donor pool is composed of units that have not been the object of
intervention, the outcome in the pre-intervention period is not affected by the intervention,
the intervention does not generate spillover effects on untreated units that compose the
donor pool, and the pre-intervention period is long enough as not to bias the estimate of
the counterfactual [33]. The following section discusses the results of the application of the
SCM, along with a series of robustness tests to confirm that these necessary conditions for
proper causal identification are being met.
4. Results
It is necessary to identify the optimal counterfactual to estimate the effect of the EAPs
in Greece. The composition (and weights) of the optimal counterfactual, Table 1 (synthetic
control weights have been optimised according to the methodology explained in the previ-Sustainability 2021, 13, 4970 7 of 15
ous section. Estimations carried out using synth_runner package for Stata [45]), considering
a donor pool of EU members (during the analysed period) that did not apply financial
assistance programmes conditions to adjustment measures: United Kingdom (0.242); Malta
(0.232); Croatia (0.222); France (0.178); Austria (0.077); Estonia (0.048); others (0.000).
Table 1. Composition of the synthetic control.
Country Synthetic Control Weight Country Synthetic Control Weight
Austria 0.077 Latvia 0.000
Belgium 0.000 Lithuania 0.000
Bulgaria 0.000 Luxembourg 0.000
Croatia 0.222 Malta 0.232
Czech Republic 0.000 Netherlands 0.000
Denmark 0.000 Poland 0.000
Estonia 0.048 Romania 0.000
Finland 0.000 Slovak Republic 0.000
France 0.178 Slovenia 0.000
Germany 0.000 Sweden 0.000
Hungary 0.000 United Kingdom 0.242
Italy 0.000
Once the optimal counterfactual, called Synthetic Greece, was identified, the growth
comparison of the GDP per capita of Greece and that of the counterfactual can be performed.
Figure 1 shows the series of GDP per capita between 1990 and 2017 for both cases. The
vertical line in 2009 marks the last year before the application of the intervention. The graph
shows a suitable adjustment of the GDP per capita series for Greece and Synthetic Greece
over the pre-intervention period. This indicates a proper identification of the counterfactual
through the predictors. Since 2010, once conditionality of the first EAP for Greece began
to be applied, the series diverged. Greece experienced a severe drop in GDP per capita
until 2013, when a small increase was maintained throughout 2017, except for the drop
stainability 2021, 13, 4970 in GDP per capita in 2016. In comparison, the Greek counterfactual 8 ofshowed
17 growth over
these years, which intensified from 2014.
35,000
30,000
GDPpc
25,00020,000
15,000
1990 2000 2010 2020
Greece Synthetic Greece
Figure 1. GDP per capita:
FigureGreece
1. GDPversus Synthetic
per capita: Greece.
Greece versus Synthetic Greece.
The causal effect of applying the EAP in Greece is estimated by calculating the dif-
ference between both series of GDP per capita, starting in 2010. The estimated impact,
Figure 2, is clearly negative for the entire post-intervention period. In 2017, the accumu-Sustainability 2021, 13, 4970 8 of 15
The causal effect of applying the EAP in Greece is estimated by calculating the dif-
ference between both series of GDP per capita, starting in 2010. The estimated impact,
Figure 2, is clearly negative for the entire post-intervention period. In 2017, the accumu-
lated estimated effect on the Greek GDP per capita was a decrease of 2011 US$ 9780.7. This
nability 2021, 13, 4970 9 of 17
represents 35.3% of the Greek GDP per capita in 2009, the year previous to the application
of the first EAP.
0 –2000
Effect - GDPpc
–6000 –4000
–8000
–10,000
1990 2000 2010 2020
Figure 2. Gap betweenFigure
Greece2.and
GapSynthetic
between Greece.
Greece and Synthetic Greece.
The impact of The
the policies
impact from the
of the EAPs has
policies fromnotthe
been homogeneous
EAPs has not beenoverhomogeneous
time. Most over time.
of the negativeMost of the
impact on negative
the Greekimpact
GDP peron the Greek
capita wasGDP per capitainwas
concentrated the concentrated
period 2010- in the period
2010–2012.
2012. Three quarters of theThree quarters
estimated lossof
ofthe
GDPestimated loss
per capita forofthe
GDP pereconomy
Greek capita forcaused
the Greek economy
caused
by the application ofby theEAPs
the application of the EAPs over
were accumulated were these
accumulated over Greece
three years. these three
per-years. Greece
performed slightly better than the counterfactual, in terms of
formed slightly better than the counterfactual, in terms of GDP per capita, over the two- GDP per capita, over the
two-year period of 2013–2014. However, when compared
year period of 2013–2014. However, when compared with the counterfactual, the applica- with the counterfactual, the
application
tion of the third of theinthird
EAP, starting 2015,EAP,
led starting
to a newindownward
2015, led totrend
a newof downward
the Greek econ-trend of the Greek
economy.
omy. This increased the This increased
negative effectthe
on negative
the Greekeffect
GDPon perthe Greek GDP per capita.
capita.
4.1. Robustness4.1. Robustness Tests
Tests
To test and
To test the reliability the reliability
robustnessand robustness
of the results, a of the of
series results, a series
placebo of placebo
tests were per- tests were
performed. These considered that the intervention in 2010 was applied
formed. These considered that the intervention in 2010 was applied to each country in the to each country in
the donor pool instead of Greece. The estimated impact for Greece clearly and significantly
donor pool instead of Greece. The estimated impact for Greece clearly and significantly
differed from the estimates of the placebo tests for the donor pool countries (see Figure 3).
differed from the estimates of the placebo tests for the donor pool countries (see Figure 3).
The p-values derived from the placebo tests (Abadie, Diamond, and Hainmueller [39] and
The p-values derived from the placebo tests (Abadie, Diamond, and Hainmueller [39] and
Galiani and Quistorff [45] provided detailed information on the estimation and interpreta-
Galiani and Quistorff [45] provided detailed information on the estimation and interpre-
tion of p-values in the SCM) are lower than 0.01 for all the estimated years. This confirms
tation of p-values in the SCM) are lower than 0.01 for all the estimated years. This confirms
that the estimated effect was caused by the intervention in Greece and not by a common
that the estimated effect was caused by the intervention in Greece and not by a common
shock effect in the EU due to the Great Recession and the debt crisis in the Eurozone.
shock effect in the EU due to the Great Recession and the debt crisis in the Eurozone.Sustainability 2021, 13, 4970 9 of 15
ainability 2021, 13, 4970 10 of 17
30,00020,000
Effects - GDPpc
10,000
0
–10,000
1990 2000 2010 2020
Greece Donors
Figure 3. Gap between
Figure Greece
3. Gap and Synthetic
between Greece
Greece and and placebo
Synthetic Greece gaps.
and placebo gaps.
Additionally,Additionally, a series of
a series of robustness robustness
tests were carriedtestsoutwere carriedthat
to ensure out the
to ensure
necessarythat the necessary
conditions,
conditions, explained explained
in the in the methodology
methodology section, for thesection,
properfor the proper
causal causal of
identification identification of
the EAP effectthe areEAP
met.effect are met.
The results fromThe results
these testsfrom these tests
are displayed inare
Figuredisplayed
4. First in(I),Figure
an 4. First (I),
in-time placeboan test
in-time
was placebo
performed testtowas
checkperformed
whether to thecheck
Greek whether
economy thewasGreekableeconomy
to an- was able to
anticipate
ticipate the effect of the the effect of the
intervention. intervention.
Therefore, this was Therefore,
considered this
towasstartconsidered
in 2005, fiveto start in 2005,
fivefirst
years before the yearsrealbefore the firstofreal
application theapplication
EAPs. It was of observed
the EAPs.that It was
the observed
effect of the that the effect of
the intervention
intervention could could not
not be anticipated be anticipated
given that it only given
appearedthatfrom
it only 2010appeared
(likewise, fromin- 2010 (likewise,
time placebo in-time placebo tests
tests considering that considering
the intervention thatstarted
the intervention
in 2006–2009 started
were in 2006–2009
carried out. were carried
out.
In all cases, the In all
effect fromcases, the effect from
the intervention the intervention
appeared starting inappeared
2010). Second starting in ver-
(II), to 2010). Second (II),
to verifyeffect
ify that the estimated that the wasestimated
not caused effect was
by the not imbalances
fiscal caused by the fiscal imbalances
of Greece prior to theof Greece prior
intervention, to thenew
three intervention, three new
predictor variables werepredictor
included: variables
generalwere included:
government debt,general
gen- government
eral governmentdebt,final
general government
consumption final consumption
expenditure, and public expenditure,
balance, all and public balance,
variables were all variables
measured as were measured
a percentage as a percentage
of GDP. The result of GDP.aThe
shows result
similar shows
pattern toathesimilar pattern
one that was to the one that
was initially
initially estimated, ruling outestimated,
that theruling out that the
fiscal situation fiscal situation
of Greece prior to of 2010Greece
couldprior
be the to 2010 could be
the causeeffect.
cause of the identified of theThird
identified effect.
(III), to ensureThird
that(III),
theretowere
ensure that therewith
no problems wereover-no problems with
overfitting,
fitting, the use of previous theobservations
use of previous of GDP observations
per capitaofasGDP per capita
predictor variableas predictor
was re- variable was
duced to the reduced to the period
period 2007–2009. The2007–2009.
obtained resultThe obtained
reproduced resultthereproduced
pattern of the the other
pattern of the other
robustness
robustness tests, ruling out tests, ruling out
problems with problems withFourth
overfitting. overfitting.
(IV), the Fourth (IV), the pre-intervention
pre-intervention
period was cut period
down, was cut down,the
considering considering
years fromthe 2000years fromOnce
to 2009. 2000 again,
to 2009. theOnce again, the dynamics
dynamics
from
from the initial thewere
result initialreproduced;
result weredespitereproduced; despite it,byascutting
it, as expected, expected, down by the
cutting
pre- down the pre-
intervention
intervention period to formperiod to formcontrol
the synthetic the synthetic
the precisioncontrol theSCM
of the precision of the
decreased and SCM decreased
and an of
an underestimation underestimation of the effect
the effect was produced. was
Fifth produced.
(V), to verify Fifth
that the (V),Stable
to verify
Unitthat the Stable
Treatment ValueUnit Assumption
Treatment Value (SUTVA)Assumption
was not(SUTVA)
violated was and not
thatviolated and that in
the intervention the intervention
Greece did not inproduce
Greece did not produce
spillover effects on spillover
untreated effects
unitson untreated
from the donor units
pool,from
the the
three donor pool, the
countries thatthree
had countries
the strongest thattrade
had the
andstrongest tradeinvestment
foreign direct and foreign(FDI) direct investment
relations with(FDI) relations
Greece (France,with Greece (France,
Germany, and Italy) Germany, and Italy)
were excluded fromwere theexcluded
donor pool. fromThe theresult
donorre- pool. The result
produced thereproduced the previously
previously estimated pattern,estimated
ruling out pattern,
problemsruling outthe
with problems
estimated with
re- the estimated
results due
sults due to spillover effectsto on
spillover
untreated effects
unitson untreated
from the donor units
pool.from the (VI),
Finally donor to pool.
ensureFinally (VI), to
that a purely ensure
European that a purely
donor pool European
does not bias donor pool does
the results, a newnotdonor
bias the pool results,
composed a new donor poolSustainability 2021, 13,
Sustainability 2021, 13, 4970
4970 10 of
11 of 17
15
of OECD countries
composed of OECD that havethat
countries not have
signednotMoUs
signedlinked
MoUsto adjustment
linked programmes
to adjustment to re-
programmes
ceive financial
to receive assistance
financial was considered.
assistance The obtained
was considered. estimates
The obtained follow the
estimates same
follow thepattern
same
of the previous
pattern ones. Asones.
of the previous such,As
based
such,onbased
the results
on thefrom
resultsallfrom
the robustness tests carried
all the robustness tests
out, the out,
carried reliability and robustness
the reliability of the results
and robustness of the obtained initiallyinitially
results obtained can be assured.
can be assured.
Figure
Figure 4.
4. Gap
Gap between
between Greece
Greece and
and Synthetic
Synthetic Greece:
Greece: robustness
robustness check.
check. I.I. In-time
In-time placebo;
placebo; II.
II. Including
Including general
general government
government
debt, general government final consumption expenditure, and public balance; III. Reducing period (2007–2009) of GDP
debt, general government final consumption expenditure, and public balance; III. Reducing period (2007–2009) of GDP per
per capita as predictor variable; IV. Pre-intervention period from 2000–2009; V. Excluding France, Germany and Italy from
capita as predictor variable; IV. Pre-intervention period from 2000–2009; V. Excluding France, Germany and Italy from de
de donor pool; VI. OECD countries in the donor pool.
donor pool; VI. OECD countries in the donor pool.
4.2. Distributional Effect
4.2. Distributional Effect
The previous results refer to the effect on production in per capita terms. However,
The previous results refer to the effect on production in per capita terms. However,
the impact of the policies is not distributed homogeneously throughout the population.
the impact of the policies is not distributed homogeneously throughout the population.
As such, once the existence of a highly significant impact of the EAPs on the Greek econ-
As such, once the existence of a highly significant impact of the EAPs on the Greek econ-
omy has been proven, it becomes just as relevant to know the way in which the impact is
omy has been proven, it becomes just as relevant to know the way in which the impact
distributed.
is distributed.
The
The national
nationalincome
incomedistribution
distributiondata provided
data by by
provided thethe
World Income
World Inequality
Income Da-
Inequality
tabase, developed by the United Nations University World Institute for Development
Database, developed by the United Nations University World Institute for Development Eco-Sustainability 2021, 13, 4970 11 of 15
Economics Research, allowed for calculating the GDP per capita for each quintile of the
population, sorted from the lowest to the highest income (from Q1 to Q5). To calculate this
value, the proportion of national income of each quintile was multiplied by the GDP of
the country and divided by the population that comprised each quintile (20% of the total
population). Similar to the way in which the impact on the GDP per capita of the Greek
economy was estimated, it is possible to estimate the distributional impact by applying the
SCM considering the GDP per capita of each quintile as an outcome for the distribution
analysis. Given data availability, in this case, the considered pre-intervention period was
1995–2009 and the donor pool included 16 EU countries (being Austria, Belgium, Czech
Republic, Denmark, Finland, France, Germany, Hungary, Italy, Luxembourg, Netherlands,
Poland, Romania, Slovak Republic, Sweden, and United Kingdom), in which no EAPs
were applied. Abiding by the characteristics laid out in the methodology section for the
post-intervention period and the predictor variables.
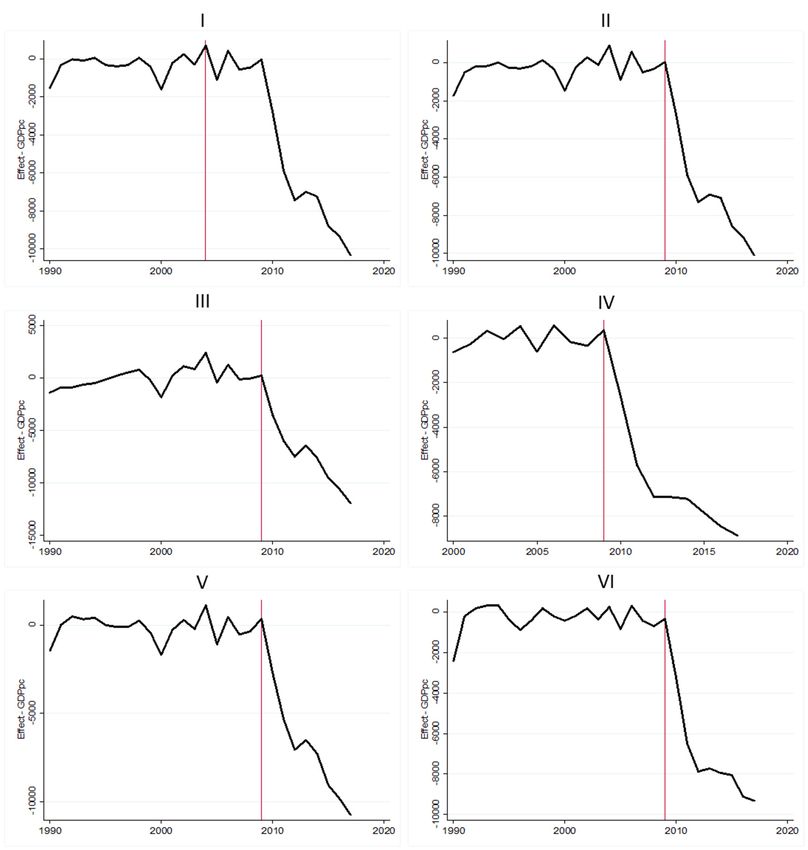
The results from the distributional impact analysis, Figure 5, show a regressive ef-
fect caused by the application of the EAPs. Even though all quintiles were negatively
affected by the program measures, the relative negative effect was more intense in the
population quintiles with lower incomes. For all quintiles, most of the negative impact
Sustainability 2021, 13, 4970 13 of 17
was accumulated between 2010 and 2012, after which the increase in negative impact
was lower.
Figure 5.
Figure 5. Relative effect per
Relative effect per income
income quintiles
quintiles (%
(% GDP
GDP per
per capita
capita of
of each
each quintile
quintile in
in 2009).
2009).
4.3. Discussion
The quintile of the Greek population with the lowest income (Q1) experienced a more
intense relativeinvestigations
Previous negative effecton due toissue
this the application
present two of limitations.
EAPs. Until First,
2017, they
it accumulated
used meth- a
loss of about 51.3% of its GDP per capita for the year prior to the application of
odologies based on assumptions that do not constitute the best possible strategy for causalthe first EAP.
The second lowest
identification. income
Second, theyquintile
excluded(Q2)relevant
experienced
EAP the greatest
aspects fromnegative relative
the analysis byimpact
exclu-
in 2010specific
sively and 2011. SinceThis
policies. 2012, after Q1
research surpassed
addresses it in
these terms ofby
problems negative
assessingrelative impact,
the impact of
this quintile remained the second most negatively affected. Specifically,
the EAPs on the Greek economy using the SCM. It is a quasi-experimental methodology the cumulative
estimated
that providesimpact for this quintile
an optimised in 2017with
counterfactual wasana empirical
45.9% decrease of its allows
base, which GDP per capita
analysing
the impact of the applied set of measures as a condition for receiving the financial assis-
tance. Therefore, the impact assessment considers the joint effect of fiscal measures, finan-
cial stability policies, structural changes, and other regulatory measures adopted as part
of the EAPs.
Among the authors who have analysed this issue, Gechert, Horn, and Paetz [46] con-Sustainability 2021, 13, 4970 12 of 15
in 2009. The intermediate or third quintile in terms of income (Q3) accumulated a 37%
decrease relative to its average 2009 income as a result of the EAPs. The second highest
income quintile (Q4) was the only one for which the observed negative impact was less
than that estimated for the whole of Greece. Until 2017, on average, an individual in this
quantile accumulated a loss caused by EAPs equivalent to 32.4% of its GDP per capita in
2009. Finally, the quintile of the population with the highest income (Q5) experienced a
negative impact slightly higher than the estimated for the country as a whole. By 2017,
it accumulated an estimated decrease of 36.2% in GDP per capita as a result of applying
the EAPs.
Considering the estimated effects on the quintiles, the EAPs had a regressive impact
on Greece. Most of the relative negative impacts were estimated on the quintiles of the
Greek population with the lowest income, with an especially intense negative impact on
the bottom 20%.
4.3. Discussion
Previous investigations on this issue present two limitations. First, they used method-
ologies based on assumptions that do not constitute the best possible strategy for causal
identification. Second, they excluded relevant EAP aspects from the analysis by exclusively
specific policies. This research addresses these problems by assessing the impact of the
EAPs on the Greek economy using the SCM. It is a quasi-experimental methodology that
provides an optimised counterfactual with an empirical base, which allows analysing the
impact of the applied set of measures as a condition for receiving the financial assistance.
Therefore, the impact assessment considers the joint effect of fiscal measures, financial
stability policies, structural changes, and other regulatory measures adopted as part of
the EAPs.
Among the authors who have analysed this issue, Gechert, Horn, and Paetz [46]
considered that the negative impact of the policies in the short- and long-term was consid-
erably underestimated. However, Górnicka et al. [47] estimated lower fiscal multipliers
for European economies, contradicting the negative effect found by Gechert, Horn, and
Paetz [46]. Meanwhile, Paulus, Figari, and Sutherland [48] estimated the negative effect
for Greece caused by fiscal austerity measures to be 2.68% on the aggregate demand. For
their part, Alesina, Favero, and Giavazzi [49] found a considerably more intense negative
effect on Greece. They estimated that between 2010 and 2014, the GDP decreased by about
4% to 7% yearly, due to fiscal measures applied as part of the first two EAPs. Comparing
with previous literature, the estimated negative effect caused by EAPs on the Greek GDP
per capita of 35.3% is considerably higher. Applying a quasi-experimental approach, the
negative effects of the austerity programs in Greece seems to be significantly higher and
unsustainable than the previous results.
In terms of distributional impact, Andriopoulou, Kanavitsa, and Tsakloglou [50] and
Kaplanoglou and Rapanos [51] analysed the increase of poverty and vulnerability caused
by austerity policies in Greece. The estimated regressive impact in this research shows a
complimentary result. Matsaganis and Leventi [52] found that the population with the
lowest income quintile in Greece experienced a decreased of 34% in their income. The
results obtained in this study are significantly higher in negative terms for the lowest
income quintile.
Important implications can be derived from this research. The results suggest the need
to review and improve the conditionality linked to financial assistance, to avoid an excess in
its application leading to a depressive vicious circle with regressive consequences in terms
of income distribution, appears to be clear. Conditionality with intense negative effects in
the short-term could result, as in the Greek case, in long-term negative effects that make it
impossible to achieve the stability and sustainable growth objectives of the programmes.
Meanwhile, to prevent further imbalances and not rely on asymmetric negotiations on
financial assistance and EAPs, the Eurozone should develop new institutional mechanismsSustainability 2021, 13, 4970 13 of 15
to mitigate the rigidities and asymmetries caused by the monetary union. The mechanisms
created so far do not seem sufficient to successfully respond to these needs.
However, some limitations of this research should be considered. First, the reliability of
the results depends on the quality of the donor pool. As the donor pool in the distributional
analysis is smaller, the reliability of the estimated distributional impact is lower than in the
estimated productive impact. Second, the proportion of national income for each quintile
was used to calculate the GDP distribution by quintile, allowing for calculating GDP per
capita for each quintile. It was used due to the unavailability of comparable data for the
donor pool in terms of GDP distribution. Although it could be the best methodological
option among those available, it should be considered that national income and GDP differ,
and the chosen assumption constitutes a limitation in the research. Third, the impact of
EAPs will be lasting in the long term and this could quantitatively and qualitatively alter
the productive and distributional impacts in the future. So, it will be necessary to evaluate
the effect of EAPs in the (very) long term.
5. Conclusions
During the debt crisis in 2010, those who defended the approach of financial assistance
to Greece subject to strict fiscal austerity and structural measures argued that it would
allow the country to access financial flows for a period long enough to avoid bankruptcy. It
would allow to put in place measures to return to fiscal sustainability, besides facilitating
the structural reform of the economy that, via an internal devaluation, would lead to an
improvement in competitiveness as well as to future sustainable growth driven by the
increase in the external demand [6,15].
At the same time, those who criticised the conditional approach linked to strict auster-
ity policies argued that the intensity required of Greece for fiscal and salary adjustments
would increase inequality and could have depressing effects by sinking domestic demand.
This would prevent Greece from achieving fiscal sustainability and economic growth,
thereby creating a vicious circle in the Greek economy [1,9,14].
This research has evaluated the causal productive and distributional effect of the EAPs
for Greece. It performed a quasi-experimental analysis by applying the SCM making three
contributions to the literature. First, it identifies the productive effect caused by EAPs
estimating a long-term negative impact on the Greek GDP per capita of 35.3%. This result
supports the arguments given by those who criticised the strict approach adopted in the
Greek case. Second, it provides empirical evidence regarding the chronological distribution
of the unsustainable impact by showing that around 75% of the negative effect occurred
between 2010 and 2012, with the application of the first EAP and the start of the second.
Over the course of 2013 and 2014, the Greek economy experienced a small improvement in
relation to the estimated counterfactual. However, it experienced a new loss with respect
to the counterfactual in 2015, coinciding with the third EAP. The third contribution is the
causal identification of a regressive distributional impact. The Greek population with lower
incomes suffered greater negative effect of the EAPs. Until 2017, due to the EAPs, the
quintile of the population with the lowest incomes had decreased their GDP per capita by
just over 50%. Over the same period of time, the impact experienced by the second quintile
with lower incomes was a decrease of 45.9% of their GDP per capita. The estimated relative
impacts for the other three quintiles were between 32.4% and 37% decrease in their GDP
per capita. Demonstrating the unfulfillment of the distributional objective that the effect of
the adjustment be distributed equally throughout the Greek society [23].
The evaluation of the causal effects derived from the applied EAPs in the EU is
essential to identify successes and failures. This would allow the consolidation of the
identified best practices in public policy and avoid the repeated application of failed
policies. A process to identify the best practices is desirable anytime, anywhere, but
it is even more pertinent in the EMU nowadays, where the economic crisis caused by
the coronavirus pandemic (COVID-19) has reopened the debate on financial assistance
and conditionality.Sustainability 2021, 13, 4970 14 of 15
Funding: This research has been carried out with the support of the Erasmus + Programme of the Eu-
ropean Union under Grant 620296-EPP-1-2020-1-ES-EPPJMO-MODULE. The European Commission
support for the production of this publication does not constitute an endorsement of the contents
which reflects the views only of the author, and the Commission cannot be held responsible for any
use which may be made of the information contained therein.
Institutional Review Board Statement: Not applicable.
Informed Consent Statement: Not applicable.
Data Availability Statement: Publicly available datasets were analysed in this study. These data
can be found here: Penn World Table 9.1, Groningen Growth and Development Center, avail-
able online: https://www.rug.nl/ggdc/productivity/pwt/ (accessed on 15 March 2021); World
Development Indicators, The World Bank, available online: https://datacatalog.worldbank.org/
dataset/world-development-indicators (accessed on 15 March 2021); Educational Attainment and
Inequality Data, Jordá and Alonso, available online: https://www.educationdata.unican.es/data-
and-documentation/ (accessed on 15 March 2021); World Income Inequality Database, UNU-WIDER,
available online: https://www.wider.unu.edu/project/wiid-%E2%80%93-world-income-inequality-
database (accessed on 15 March 2021).
Conflicts of Interest: The author declares no conflict of interests.
References
1. Lane, P.R. The European sovereign debt crisis. J. Econ. Perspect. 2012, 26, 49–67. [CrossRef]
2. Nedergaard, P.; Snaith, H. ‘As I Drifted on a River I Could Not Control’: The Unintended Ordoliberal Consequences of the
Eurozone Crisis. JCMS J. Common Mark. Stud. 2015, 53, 1094–1109. [CrossRef]
3. Mongelli, F.P.; Camba-Mendez, G. The Financial Crisis and Policy Responses in Europe (2007–2018). Comp. Econ. Stud. 2018, 60,
531–558. [CrossRef]
4. Socol, C.; Marinas, M.; Socol, A.G.; Armeanu, D. Fiscal adjustment programs versus socially sustainable competitiveness in EU
countries. Sustainability 2018, 10, 3390. [CrossRef]
5. Bieler, A.; Jordan, J.; Morton, A.D. EU aggregate demand as a way out of crisis? Engaging the post-keynesian critique. J. Common
Mark. Stud. 2019, 57, 805–822. [CrossRef]
6. Costa, L.; Martins, N.O.; De Oliveira, F.G. Portugal’s bailout and the crisis of the European Union from a capability perspective.
Camb. J. Econ. 2016, 40, 1479–1496. [CrossRef]
7. Featherstone, K. Conditionality, Democracy and Institutional Weakness: The Euro-crisis Trilemma. JCMS J. Common Mark. Stud.
2016, 54, 48–64. [CrossRef]
8. Armingeon, K.; Cranmer, S. Position-taking in the Euro crisis. J. Eur. Public Policy 2017, 25, 546–566. [CrossRef]
9. Greer, S. Structural adjustment comes to Europe: Lessons for the Eurozone from the conditionality debate. Glob. Soc. Policy 2014,
14, 51–71. [CrossRef]
10. Zahariadis, N. Bargaining power and negotiation strategy: Examining the Greek bailouts, 2010–2015. J. Eur. Public Policy 2016, 24,
675–694. [CrossRef]
11. Clifton, J.; Diaz-Fuentes, D.; Gómez, A.L. The crisis as opportunity? On the role of the Troika in constructing the European
consolidation state. Camb. J. Reg. Econ. Soc. 2018, 11, 587–608. [CrossRef]
12. Gräbner, C.; Heimberger, P.; Kapeller, J.; Schütz, B. Is the Eurozone disintegrating? Macroeconomic divergence, structural
polarisation, trade and fragility. Camb. J. Econ. 2020, 44, 647–669. [CrossRef]
13. Wyplosz, C. European Monetary Union: The dark sides of a major success. Econ. Policy 2006, 21, 208–261. [CrossRef]
14. Perez, S.A.; Matsaganis, M. Export or Perish: Can Internal Devaluation Create Enough Good Jobs in Southern Europe? South Eur.
Soc. Politi 2019, 24, 259–285. [CrossRef]
15. Rathgeb, P.; Tassinari, A. How the Eurozone disempowers trade unions: The political economy of competitive internal devaluation.
Socio Econ. Rev. 2020. [CrossRef]
16. Featherstone, K. The Greek sovereign debt crisis and EMU: A failing state in a skewed regime. J. Common Mark. Stud. 2011, 49,
193–217. [CrossRef]
17. Copelovitch, M.; Frieden, J.; Walter, S. The Political Economy of the Euro Crisis. Comp. Polit. Stud. 2016, 49, 811–840. [CrossRef]
18. Gocaj, L.; Meunier, S. Time Will Tell: The EFSF, the ESM, and the Euro Crisis. J. Eur. Integr. 2013, 35, 239–253. [CrossRef]
19. Lim, D.J.; Moutselos, M.; McKenna, M. Puzzled out? The unsurprising outcomes of the Greek bailout negotiations. J. Eur. Public
Policy 2018, 26, 325–343. [CrossRef]
20. Jacoby, W.; Hopkin, J. From lever to club? Conditionality in the European Union during the financial crisis. J. Eur. Public Policy
2019, 27, 1157–1177. [CrossRef]
21. Dreher, A. IMF conditionality: Theory and evidence. Public Choice 2019, 141, 233–267. [CrossRef]
22. Stone, R.W. The Scope of IMF Conditionality. Int. Organ. 2008, 62, 589–620. [CrossRef]You can also read