The Effects of Unsubstantiated Claims of Voter Fraud on Confidence in Elections
←
→
Page content transcription
If your browser does not render page correctly, please read the page content below

The Effects of Unsubstantiated Claims of Voter Fraud
               on Confidence in Elections†
   Nicolas Berlinski1 , Margaret Doyle1 , Andrew M. Guess2 , Gabrielle Levy1 ,
 Benjamin Lyons3 , Jacob M. Montgomery4 , Brendan Nyhan1 , and Jason Reifler5

                                1 Department of Government, Dartmouth College
                 2 Department of Politics and Woodrow Wilson School, Princeton University
                             3 Department  of Communication, University of Utah
                    4 Department of Political Science, Washington University in St. Louis
                                5 Department of Politics, University of Exeter

                                                    Abstract
       Political elites sometimes seek to delegitimize election results using unsubstantiated claims of
       fraud. For example, President Trump frequently made unsupported claims that voter fraud was
       widespread during the 2020 U.S. presidential election. We test whether such claims erode trust
       in the election system in the aftermath of the 2018 U.S. midterm elections — a time when
       many prominent Republican politicians also made unsubstantiated claims of voter fraud. Us-
       ing a nationwide YouGov survey experiment, we show that exposure to claims of voter fraud
       reduces confidence in American electoral integrity, though not support for democracy itself.
       The effects are concentrated among Republicans and Trump approvers. Worryingly, exposure
       to fact-checks does not measurably reduce the damage from these accusations. These results
       suggest that unsubstantiated claims of voter fraud undermine the public’s confidence in elec-
       tions, particularly when the claims are politically congenial, and that their effects cannot easily
       be mitigated by fact-checking.

   † We thank Democracy Fund and the European Research Council (ERC) under the European Union’s Horizon 2020
research and innovation programme (grant agreement No. 682758) for funding support. We are also grateful for funding
support from the Weidenbaum Center on the Economy, Government, and Public Policy at Washington University in
St. Louis. All conclusions and any errors are our own.
In recent elections, political elites across the world have made unsubstantiated claims of voter fraud
in order to cast doubt on unfavorable or potentially damaging electoral results. For instance, Jair
Bolsonaro, the president of Brazil, expressed fears of voter fraud during his presidential campaign
in 2018 to preemptively cast doubt on an unfavorable electoral outcome (Savarese 2018). Prabowo
Subianto, a presidential candidate who lost the 2019 Indonesian election, used this tactic even more
aggressively, claiming that he had been the victim of voter fraud and refusing to concede (Paddock
2019). In the U.S., Donald Trump tweeted more than 100 allegations of voter fraud in 2020 before
and immediately after the presidential election in which he was defeated (Volz and Glazer 2020).
   Unfounded allegations of voter fraud could be dangerous for democracy (e.g., Minnite 2010).
If electoral results are not respected and losers do not concede power, democracies cannot function
(Anderson et al. 2005). And even if losers step down, belief in widespread voter fraud threatens to
undermine public trust in elections, delegitimize election results, and promote violence or unrest.
   Previous research on electoral integrity has primarily focused on the effects of actual electoral
malfeasance on confidence in elections. It is less clear whether unfounded assertions of voter fraud
reduce public faith in free and fair elections, especially in consolidated democracies such as the
United States. Can elites delegitimize a democratic outcome in the minds of their supporters simply
by asserting that electoral irregularities took place?
   Concerns about the effect of unsupported voter fraud claims seem credible given the decline
in confidence in the election system over time (Sances and Stewart 2015) and the prevalence of
belief in conspiracy theories (Oliver and Wood 2014), including claims of widespread voter fraud
(Enders and Uscinski 2020). For instance, a pre-election poll in October 2020 found that nearly
half of Americans believe that thousands of illegal votes or more are cast in elections via each of
five forms of voter fraud (e.g., voting more than once), including 67–78% of people who approve
of President Trump’s performance in office (Bright Line Watch 2020).
   However, unsubstantiated claims of widespread voter fraud may still have little effect on the
public, especially if they are also exposed to contradictory information flows. Studies find, for
instance, that even presidents typically struggle to change public opinion despite extensive efforts to

                                                  1
do so (Edwards 2006; Franco, Grimmer and Lim N.d.). Most notably, recent studies of the 2016 U.S.
presidential election using panel designs provide mixed evidence on the effect of voter fraud claims.
Despite Donald Trump’s frequent (and unsubstantiated) claims of voter fraud before that election,
Trump voters’ confidence in elections did not change measurably in the pre-election period while
Democrats’ confidence in elections increased pre-election, possibly in response to Trump’s claims
(Sinclair, Smith and Tucker 2018). After the election, confidence in elections actually increased
and belief in illicit voting decreased among Trump supporters (a classic “winner effect”) while
confidence of Clinton’s voters remained unchanged (Levy 2020).
   In short, while politicians undoubtedly make unfounded claims of voter fraud, it is unknown
if such claims affect citizens’ faith in elections. Moreover, panel data do not allow researchers to
isolate the effects of exposure to unfounded allegations of voter fraud from other contemporaneous
events. In the pre-election period measured in Sinclair, Smith and Tucker (2018), exposure to this
rhetoric is confounded with exposure to other campaign-related information. Similarly, the post-
election changes in Levy (2020) likely reflect the effects of observing the election outcome as well
as news coverage and information about the result.
   Our study provides the first experimental evaluation of the effects of unfounded accusations of
voter fraud on citizens’ confidence in elections.1 We evaluate the effects of these claims in the
context of the aftermath of the 2018 U.S. midterm elections. Notably, we not only test the effects of
such accusations in isolation, but also their effects when paired with fact-checks from independent
experts. This design approach is critical for evaluating potential real-world responses by, e.g., social
media companies which seek to mitigate harm from voter fraud claims (Klar 2020).
   Our results show that exposure to unsubstantiated claims of voter fraud from prominent Repub-

   1   The work that is closest to our own is Albertson and Guiler (2020), who show that telling
respondents that “experts” believe that the 2016 election was vulnerable to manipulation and fraud
increased perceptions of fraud, lowered confidence in the electoral system, and reduced willingness
to accept the outcome. Our study differs in that the accusations we test come from political leaders,
a more common source in practice (experts believe voter fraud is exceptionally rare in the U.S.).

                                                   2
licans reduces confidence in elections, especially among Republicans and individuals who approve
of Donald Trump’s performance in office. Worryingly, exposure to fact-checks that show these
claims to be unfounded does not measurably reduce the damage from these accusations. The results
suggest that unsubstantiated claims of voter fraud undermine the public’s confidence in elections,
particularly when the claims are politically congenial, and that these effects cannot easily be ame-
liorated by fact-checks or counter-messaging. However, we find no evidence that exposure to these
claims reduces support for democracy itself.

Experimental design
We conducted our experiment among 4,280 respondents in the U.S. who were surveyed in De-
cember 2018/January 2019 by YouGov (see Online Appendix A for details on the demographic
characteristics of the sample and question wording). After a pre-treatment survey, respondents
were randomly assigned to view either a series of non-political tweets (placebo); four tweets alleg-
ing voter fraud (low dose); the four tweets alleging voter fraud from the low dose condition plus
four additional tweets alleging voter fraud (high dose); or the four tweets from the low dose con-
dition alleging voter fraud plus four fact-check tweets (low dose + fact-check). Respondents then
completed post-treatment survey questions measuring our outcome.
   Immediately after the election, several prominent Republicans, including Florida governor Rick
Scott, Senators Lindsey Graham and Marco Rubio, and Trump himself, made unfounded allegations
of voter fraud while counts were still ongoing (Lopez 2018). Tweets from these political elites and
fact-checks of the claims were used as the treatment stimuli (see Figure 1 for an example). This
design has high external validity, allowing us to show actual claims of voter fraud made by party
elites to respondents in the original format (i.e., social media) in which they were seen by voters.

                                                  3
Figure 1: Example stimulus tweet from the experiment

Hypotheses and research questions
We expect that exposure to unfounded voter fraud claims reduces confidence in elections. This
expectation leads to four preregistered hypotheses and two research questions.2
   Our first three hypotheses concern the effect of exposure to voter fraud allegations. We expect
that low (H1a) and high (H2a) doses of exposure to allegations of voter fraud will reduce confidence
in elections and that a high dose will have a stronger effect (H3a). We also expect the effects of
exposure to be greater when the claims are politically congenial (H1b–H3b) given the way pre-
existing attitudes affect the processing of new information (e.g., Kunda 1990; Taber and Lodge
2006), including on election/voter fraud (Edelson et al. 2017; Udani, Kimball and Fogarty 2018).
   Fact-checks can be effective in counteracting exposure to misinformation (Chan et al. 2017;
Fridkin, Kenney and Wintersieck 2015). Our fourth hypothesis therefore predicts that fact-checks
can reduce the effects of exposure to a low dose of voter fraud misinformation on perceived electoral
integrity (H4a). We also expect fact-checks will reduce the effects of voter fraud misinformation
more for audiences for whom the fraud messages are politically congenial (H4b).
   We also propose a research question, asking whether exposure to both a low dose of allegations
of voter fraud and fact-checks affects confidence in elections compared to the placebo condition
baseline per Thorson (2016) (RQ1a). We also examine whether this result differs when the claims

   2   We provide a “populated pre-analysis plan” (Duflo et al. 2020) and a link to the anonymized
preregistration in Online Appendix E).

                                                 4
Table 1: Measures of confidence in elections

          Question                                                        Mean      SD         Range
          Confidence all entitled allowed to vote                          2.58    1.00        [1, 4]
          Confidence own vote was counted†                                 3.18    0.88        [1, 4]
          Confidence officials manage counting votes                       2.57    0.92        [1,4]
          System works despite problems casting and counting votes         2.75    0.89        [1,4]
          Trust elections                                                  4.60    1.63        [1,7]
          Ballots secure from tampering                                    2.86    1.02        [1,4]
          Voting machines accurate                                         3.42    0.96        [1, 5]
          Composite measure§                                                 0       1     [−2.52, 1.99]

Complete question wordings for all items is provided in Appendix A. † indicates that the item was only asked of
respondents who indicated they voted. § indicates a composite measure of election confidence that was created using
confirmatory factor analysis (see Online Appendix B for estimation details).

are politically congenial (RQ1b).3 Finally, we examine whether these effects go beyond attitudes
towards electoral institutions and also affect support for democracy itself (RQ2).

Methods
To test our main hypotheses, we examine seven survey items that tap into different aspects of elec-
tion integrity (for example, “How confident are you that election officials managed the counting
of ballots fairly in the election this November?”). Descriptive statistics for all items are shown in
Table 1 and complete question wording is shown in Appendix A. On average, respondents indi-
cated modestly high levels of confidence in US electoral institutions and election integrity. Per our
preregistration, we also used exploratory factor analysis to show that these items scaled together
and created a standardized outcome measure of confidence in the electoral system. All seven items
loaded onto a single factor; the absolute value of the factor loadings was greater than 0.6 for all
cases and typically larger than 0.8. To identify the latent space, we set the variance of the latent
factor to one, allowing all treatment effects to be interpreted as sample standard deviations.
    We estimate linear regression models that include only main effects for experimental condi-

    3   These RQs compare the low dose + fact-check condition to the placebo condition while H4a
and H4b compare the low dose condition to the low dose + fact-check condition.

                                                        5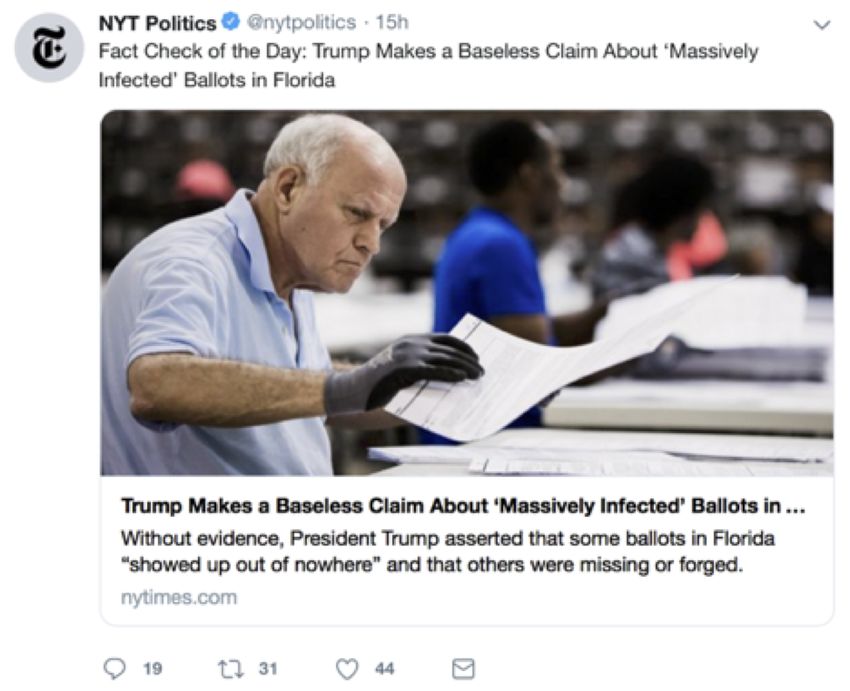
tions as well as models that interact treatment indicators with measures for whether voter fraud
misinformation was congenial for respondents. We used survey respondents’ party identifications
and attitudes toward President Trump to determine whether messages were congenial. In this sam-
ple, approximately 35.6% respondents identified as a Republican while 43% approved of President
Trump. For RQ2, we relied on a separate five-item battery measuring commitment to democratic
governance reported in Online Appendix A.

Results
We focus our presentation below on estimated treatment effects for our composite measure of elec-
tion confidence. However, we present treatment effects for each component outcome measure (ex-
ploratory) as well as the composite measure of election confidence (preregistered) Table 2. Figure
2 shows the effects for the composite measure. Since the composite measure is standardized, the
effects can be directly interpreted in terms of standard deviations (SDs).
   We find that exposure to the low dose condition significantly reduced confidence in elections
compared to the placebo condition (H1a: β = −0.147 SD, p < .005). This pattern also held in
the high-dose condition (H2a: β = −0.168 SD, p < .005). However, we fail to reject the null
hypothesis of no difference in effects (H3a); the effects of exposure to low versus high doses of
tweets alleging voter fraud are not measurably different. We emphasize that this result is calculated
as the difference in treatment effects between the low dose and high dose conditions and is reported
in the row in Table 2 labeled “Effect of higher dosage.”4
   A crucial question in this study is whether the effect of fact-check tweets can offset the effect of
the tweets alleging fraud. We find that exposure to fact-checks after a low dose of unfounded voter
fraud claims did not measurably increase election confidence relative to the low dose condition. As
a result, the negative effects of exposure remain relative to the placebo condition.

   4   Effects for individual outcome measures are generally but not uniformly consistent with these
patterns. Most notably, none of the treatments had an effect on beliefs that ballots are secure from
tampering, a claim that was not questioned in the stimuli shown to respondents.

                                                  6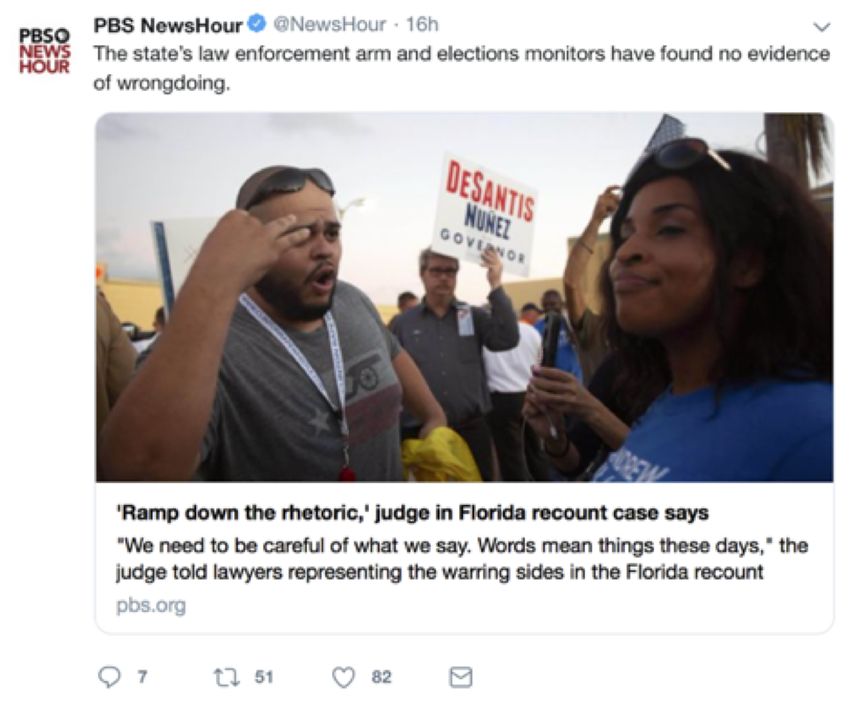
Table 2: Effect of exposure to voter fraud allegations on election confidence

                                       Confidence     Confidence         Confidence                                       Voting
                                        eligibles       officials         own vote     System      Trust in    Ballot    machines    Composite
                                        can vote     fairly manage        counted      works      elections   security   accurate     measure
 Low dose (H1a)                        -0.209***      -0.120***          -0.150***    -0.138***    -0.155*     -0.081      -0.038    -0.147***
                                         (0.043)        (0.042)            (0.039)      (0.038)    (0.069)     (0.044)    (0.040)      (0.042)
 High dose (H2a)                       -0.195***      -0.137***          -0.146***    -0.172***    -0.173*     -0.080     -0.095*    -0.168***
                                         (0.044)        (0.043)            (0.040)      (0.038)    (0.070)     (0.044)    (0.042)      (0.043)
 Low dose+fact-check tweets (RQ1a)      -0.088*        -0.122**            -0.059      -0.095*      -0.074     -0.062      -0.057      -0.092*
                                         (0.043)        (0.044)            (0.040)      (0.038)    (0.070)     (0.045)    (0.042)      (0.043)
 Constant                              2.706***       3.274***           2.656***     2.848***    4.704***    2.913***   3.469***     0.102***
                                         (0.031)        (0.029)            (0.028)      (0.026)    (0.048)     (0.031)    (0.029)      (0.030)
 Effect of higher dosage (H3a)
 High dose - Low dose                     0.015         -0.017             0.004       -0.038     -0.018       0.001      -0.057       -0.021
                                         (0.043)        (0.043)           (0.040)      (0.039)    (0.071)     (0.044)     (0.042)      (0.043)
 Effect of fact-check exposure (H4a)
 (Low dose + fact-check) - Low dose     0.121***        -0.001            0.090*        0.043      0.081       0.018      -0.200        0.055
                                         (0.043)        (0.044)           (0.040)      (0.038)    (0.071)     (0.044)     (0.041)      (0.043)
 N                                        4278           3283              4279         4279       4277        4273        4250         4283

* p < 0.05, ** p < 0.01, *** p < .005 (two-sided). OLS models with robust standard errors. The outcome variable is a composite measure of
election confidence created using confirmatory factor analysis (see Online Appendix B for estimation details).

     Specifically, we can reject the null hypothesis of no difference in election confidence between
participants exposed to the low dose + fact-check tweets versus those in the placebo condition
(RQ1a: β = −0.092 SD, p < 0.05). This effect is negative, indicating the fact-check tweets do
not eliminate the harmful effects of exposure to unfounded allegations of fraud on election confi-
dence. Substantively, the effect estimate is smaller than the effect for the low dose condition with
no fact-check tweets described above (H1a: β = −0.147 SD, p < .005) but the difference is not
reliably distinguishable from zero (H4a: βlow dose + fact check − βlow dose = 0.055 SD, p > .05).
     Next, we examined the effect of voter fraud messages on respondents for whom the content of
those messages (and the sources who endorse them) would be congenial — the Republican identi-
fiers and leaners whose party was seen as losing the 2018 midterm elections. We estimate how our
treatment effects vary by party and by approval of President Trump in Tables C1 and C2 in Online
Appendix C. The resulting marginal effect estimates are presented in Figure 3.5

     5   This analysis deviates from our preregistered analysis by examining Democrats and indepen-
dents separately. We discuss this in greater detail in Online Appendix C, which also contains the
preregistered specification in which they are analyzed together.

                                                                     7
We first analyze the results based on party identification. We find that the effects of exposure to
voter fraud misinformation vary significantly by party (H2b; p < .01), decreasing voter confidence
significantly only among Republicans. By contrast, the effect of the low dosage of four tweets of
voter fraud misinformation is not measurably different between Democrats and Republicans (H1b),
though the message’s marginal effect is significant for Republicans (p < .01) and not for Democrats.
Similarly, the effect of greater dosage of fraud allegations (i.e., high versus low dosage) does not
vary measurably by party (H3b).
   Results are similar when we consider attitudes towards President Trump as a moderator. The
effects of exposure to tweets varies significantly by approval in the high dose condition (p < .005),
significantly reducing election confidence only among respondents who approve of Trump. The
interaction is not significant for the low dose condition, though again the effect of the treatment is
only significant among Trump approvers. Further, there is insufficient evidence to conclude that the
additional effect of exposure to fact-check tweets (versus just the low dose of fraud tweets) varied
by Trump approval. However, the dosage effect (low versus high dosage) varied significantly by
approval (β = −0.191 SD, p < .05). Among disapprovers, additional dosage had no significant
effect, but it reduced election confidence significantly among approvers (β = −0.128 SD, p < .05).
   The size of the effects reported in Figure 3 are worth emphasizing. The high dose condition,
which exposed respondents to just eight tweets, reduced confidence in the electoral system by 0.27
standard deviations among Republicans and 0.34 standard deviations among Trump approvers.
Even if these treatment effects diminish over time, these results indicate that a sustained diet of
exposure to such unfounded accusations could substantially reduce faith in the electoral system.
   We also consider whether the effects of fact-check exposure vary between Democrats and Re-
publicans. We find the marginal effect of exposure to fact-checks (comparing the low dose + fact-
check condition to the low dose condition) does not vary significantly by party (H4b). As a result,
the negative effects of the low dose condition on trust and confidence in elections among Repub-
licans (β = −0.184 SD, p < .01) persist if they are also exposed to fact-checks in the low dose +
fact-check condition (β = −0.176 SD, p < .05). This pattern replicates when we instead disag-

                                                  8
Figure 2: Marginal effect of exposure to claims of voter fraud on confidence in elections

Difference in means (with 95% CIs) for composite measure of election confidence relative to the placebo condition.

gregate by Trump support. We find no measurable difference in the effects of the fact-checks by
Trump approval, but the low dose + fact-check reduces election confidence among Trump support-
ers (β = −0.190 SD, p < .005) despite the presence of corrective information, mirroring the effect
in the low dose condition (β = −0.211 SD, p < .005).6
    Finally, we explore whether these treatments affect broader attitudes toward democracy itself.
Table C4 in Online Appendix B shows that there were no significant effects of any conditions on
items related to: “Having a strong leader who does not have to bother with Congress and elections;”
“Having experts, not government, make decisions”, “Having army rule;” or, “Having a democratic
political system.” These null effects were mirrored in analyses of heterogeneous treatment effects
by party and Trump approval (available upon request).
    6   As preregistered, we include additional analyses of other possible moderators of the effects
of voter fraud message exposure in Online Appendix D (see Tables D3–D9). A fully populated
preregistration is reported in Online Appendix E (Duflo et al. 2020).

                                                         9
Figure 3: Effect of exposure to claims of voter fraud on election confidence by predispositions
(a) Party identification (b) Trump approval
Figure 3a shows the marginal effect by party of exposure to claims of voter fraud on election confidence (Table C1),
while Figure 3b shows the marginal effect by Trump approval (Table C2).
Conclusion
This study presents novel experimental evidence of the effect of unsubstantiated claims of voter
fraud on public confidence in elections. Using a large, nationally representative sample collected
after the 2018 US elections, we show that respondents exposed to either low or high doses of voter
fraud claims reported less confidence in elections than those in a placebo condition, though there
was no evidence that the treatments affected attitudes towards democracy more generally. These ef-
fects varied somewhat by party. Exposure significantly reduced confidence in elections only among
Republicans and Trump supporters, though these effects only differed measurably by party or Trump
approval in the high-dosage condition.
Worryingly, we found little evidence that fact-check tweets measurably reduced the effects of
exposure to unfounded voter fraud allegations. Adding corrections to the low dose condition did
not measurably reduce the effects of exposure. As a result, both Republicans and Trump approvers
reported significantly lower confidence in elections after exposure to a low dose of voter fraud
allegations even when those claims were countered by fact-checks (compared to those in a placebo
condition). These findings reinforce previous research on the potential lasting effects of exposure
to misinformation even after it is discredited (e.g., Thorson 2016). Our findings also contribute to
10the growing understanding of the seemingly powerful role of elites in promoting misinformation
(Weeks and Gil de Zúñiga 2019) and other potentially damaging outcomes such as conspiracy
beliefs (Enders and Smallpage 2019) and affective polarization (Iyengar et al. 2019).
Future work could address a number of limitations in our study and build on our findings in
several important ways. First, our treatment and dosage designs were solely based on social media
posts. Additional research could explore whether media reports or editorials echoing accusations
from political elites have greater effects (e.g., Coppock et al. 2018). Second, our study examines
messages that were congenial for Republicans. Though we sought to test the effects of fraud claims
from the sources who have most frequently made them, a future study should also test the conge-
niality hypotheses we develop using Democrats as well.
It is also important to consider the potential for expressive responding (Schaffner and Luks 2018)
(but see Berinsky 2018), which future work might rule out by soliciting higher stakes outcomes of
interest (e.g., willingness to pay additional taxes to improve election security). Future research
could also test the effects of allegations in a pre-election context and possibly examine effects on
turnout or participation intentions. Finally, the COVID-19 pandemic highlights the importance of
considering the effect of fraud allegations directed at mail voting and ballot counting, which may
be especially vulnerable to unfounded allegations.
Still, our study provides new insight into the effects of unsubstantiated claims of voter fraud.
We demonstrate that these allegations can undermine confidence in elections, particularly when
the claims are politically congenial, and may not be effectively mitigated by fact-checking. In this
way, the proliferation of unsubstantiated claims of voter fraud threatens to undermine confidence
in electoral integrity and contribute to the erosion of U.S. democracy.
References
Albertson, Bethany and Kimberly Guiler. 2020. “Conspiracy theories, election rigging, and support
for democratic norms.” Research & Politics 7(3):2053168020959859.
Anderson, C.J., A. Blais, S. Bowler, T. Donovan and O. Listhaug. 2005. Losers’ Consent: Elections
11and Democratic Legitimacy. Oxford University Press.
Berinsky, Adam J. 2018. “Telling the truth about believing the lies? Evidence for the limited
prevalence of expressive survey responding.” Journal of Politics 80(1):211–224.
Bright Line Watch. 2020. “American Democracy on the Eve of the 2020 Election.” Octo-
ber 26, 2020. Downloaded November 12, 2020 from http://brightlinewatch.org/
american-democracy-on-the-eve-of-the-2020-election/.
Chan, Man-pui Sally, Christopher R Jones, Kathleen Hall Jamieson and Dolores Albarracín. 2017.
“Debunking: A meta-analysis of the psychological efficacy of messages countering misinforma-
tion.” Psychological science 28(11):1531–1546.
Coppock, Alexander, Emily Ekins, David Kirby et al. 2018. “The long-lasting effects of newspaper
op-eds on public opinion.” Quarterly Journal of Political Science 13(1):59–87.
Duflo, Esther, Abhijit Banerjee, Amy Finkelstein, Lawrence F Katz, Benjamin A Olken and Anja
Sautmann. 2020. “In praise of moderation: Suggestions for the scope and use of pre-analysis
plans for RCTs in economics.” National Bureau of Economic Research working paper, April
2020.
Edelson, Jack, Alexander Alduncin, Christopher Krewson, James A Sieja and Joseph E Uscinski.
2017. “The effect of conspiratorial thinking and motivated reasoning on belief in election fraud.”
Political Research Quarterly 70(4):933–946.
Edwards, George C. 2006. On deaf ears: The limits of the bully pulpit. Yale University Press.
Enders, Adam M. and Joseph E. Uscinski. 2020. “Voters always imagine fraud. Politicians usu-
ally don’t go along with it.” Washington Post, November 12, 2020. Downloaded November 12,
2020 from https://www.washingtonpost.com/outlook/2020/11/12/fraud-
conspiracy-theories-election-public-opinion/.
12Enders, Adam M and Steven M Smallpage. 2019. “Informational Cues, Partisan-Motivated Rea-
soning, and the Manipulation of Conspiracy Beliefs.” Political Communication 36(1):83–102.
Franco, Annie, Justin Grimmer and Chloe Lim. N.d. “The Limited Effect of Presiden-
tial Public Appeal.” Downloaded May 15, 2020 from https://www.dropbox.com/s/
5ym94ggasbff260/public.pdf?dl=0.
Fridkin, Kim, Patrick J Kenney and Amanda Wintersieck. 2015. “Liar, liar, pants on fire: How
fact-checking influences citizens’ reactions to negative advertising.” Political Communication
32(1):127–151.
Iyengar, Shanto, Yphtach Lelkes, Matthew Levendusky, Neil Malhotra and Sean J Westwood. 2019.
“The origins and consequences of affective polarization in the United States.” Annual Review of
Political Science 22:129–146.
Klar, Rebecca. 2020. “Warning label added to Trump tweet over potential mail-in vot-
ing disinformation.” The Hill, September 17, 2020. Downloaded November 6, 2020
from https://thehill.com/policy/technology/516890-warning-label-
added-to-trump-tweet-over-potential-mail-in-voting.
Kunda, Ziva. 1990. “The case for motivated reasoning.” Psychological bulletin 108(3):480–498.
Levy, Morris. 2020. “Winning cures everything? Beliefs about voter fraud, voter confidence, and
the 2016 election.” Electoral Studies p. 102156.
Lopez, German. 2018. “The Florida voter fraud allegations, explained.” Vox, November 12,
2018. Downloaded February 16th, 2020 from https://www.vox.com/policy-and-
politics/2018/11/12/18084786/florida-midterm-elections-senate-
governor-results-fraud.
Minnite, Lorraine C. 2010. The myth of voter fraud. Cornell University Press.
13Oliver, J. Eric and Thomas J. Wood. 2014. “Conspiracy theories and the paranoid style(s) of mass
opinion.” American Journal of Political Science 58(4):952–966.
Paddock, Richard C. 2019. “Indonesia Court Rejects Presidential Candidate’s Vot-
ing Fraud Claims.” New York Times, June 27, 2019. Downloaded May 4, 2020 from
https://www.nytimes.com/2019/06/27/world/asia/indonesia-widodo-
prabowo-election-fraud.html.
Sances, Michael W. and Charles Stewart. 2015. “Partisanship and confidence in the vote count:
Evidence from U.S. national elections since 2000.” Electoral Studies 40:176–188.
Savarese, Mauricio. 2018. “Leading Brazil candidate says he fears electoral fraud.”
Associated Press. September 17, 2018. Downloaded February 16th, 2020 from
https://apnews.com/d75824e19eac49d9b6f2cfec8d9daf12/Leading-
Brazil-candidate-says-he-fears-electoral-fraud.
Schaffner, Brian F and Samantha Luks. 2018. “Misinformation or expressive responding? What an
inauguration crowd can tell us about the source of political misinformation in surveys.” Public
Opinion Quarterly 82(1):135–147.
Sinclair, Betsy, Steven S Smith and Patrick D Tucker. 2018. “‘It’s Largely a Rigged System’: Voter
Confidence and the Winner Effect in 2016.” Political Research Quarterly 71(4):854–868.
Taber, Charles S. and Milton Lodge. 2006. “Motivated Skepticism in the Evaluation of Political
Beliefs.” American Journal of Political Science 50(3):755–769.
Thorson, Emily. 2016. “Belief echoes: The persistent effects of corrected misinformation.” Political
Communication 33(3):460–480.
Udani, Adriano, David C Kimball and Brian Fogarty. 2018. “How local media coverage of voter
fraud influences partisan perceptions in the United States.” State Politics & Policy Quarterly
18(2):193–210.
14Volz, Dustin and Emily Glazer. 2020. “Trump Has Long Questioned Elections on Twitter,
But Never So Frequently.” Wall Street Journal, November 5, 2020. Downloaded November
6, 2020 from https://www.wsj.com/livecoverage/trump-biden-election-
day-2020/card/9nafaD3oPqqJRixleJD1.
Weeks, Brian E and Homero Gil de Zúñiga. 2019. “What’s next? Six observations for the future
of political misinformation research.” American Behavioral Scientist .
15Online Appendix A: Survey details
Survey details
Participants in the U.S. study were YouGov panel members who consented to participate in an online
study (YouGov determines the specific eligibility and exclusion criteria for their panel). Researchers
have no role in selecting the participants. This study was conducted among a representative sample
of the U.S. population by YouGov, which recruits a large panel of opt-in respondents and then
uses a weighting and matching algorithm to construct a final sample that mirrors the demographic
composition of the U.S. population. Our participants closely resemble the U.S. population in both
demographics and political attitudes and affiliations (see demographics reported in the Table A1).
The experimental results we present do not use survey weights per Franco et al. (2017) and Miratrix
et al. (2018).
The survey was a two-wave panel conducted from November 20–December 27, 2018 (Wave
1, N=4,907) and December 14, 2018–January 3, 2019 (Wave 2, N=4,283) as part of a larger study
reported in a different paper. The voter fraud experiment reported in the main text took place almost
exclusively in Wave 2, although we use a few background questions listed below from Wave 1.
We coded respondents’ Pulse data, categorizing mainstream news visit, fact-checking visit, and
fake news visits (see Appendix D) computed as a binary measure of exposure to the aforementioned
types of content, as well as a a count of total webpages visited from each category during the
7 days following Wave 1. Data was collected by YouGov via anonymized web traffic data from
respondents.
Figure A1: Experimental design and processTable A1: Characteristics of YouGov sample
Characteristic Sample Census Gallup
Education
Less than high school 4.2% 15.2% -
High school graduate 31.4% 27.3% -
Some college/less than four-year degree 32.5% 26.8% -
Bachelor’s degree 20.3% 19.6% -
Postgraduate degree 11.6% 11.0% -
Age
18–24 6.7% 13.1% -
25–44 34.4% 35.0% -
45–64 35.9% 34.7% -
65 and older 23.1% 17.2% -
Gender
Male 45.4% 48.4% -
Female 54.6% 51.6% -
Party
Democrats 36.8% - 34.0%
Republicans 26.2% - 25.0%
Independents 37.0% - 39.0%
Trump approval
Disapprove 43.1% - 37.0%
Approve 56.9% - 59.0%
Unweighted YouGov survey sample. Sources for population benchmarks: education (United States Census Bureau 2020), age and gender (Howden
and Meyer 2011), party (Gallup 2020a), and Trump approval (Gallup 2020b).Wave 1
Party ID questions
Generally speaking, do you usually think of yourself as a Republican, a Democrat, an Indepen-
dent,or something else? (Options: Republican, Democrat, Independent, Something else)
[if Democrat selected] Would you call yourself a strong Democrat or not a very strong Demo-
crat? (Options: Strong Democrat or Not very strong Democrat)
[if Republican selected] Would you call yourself a strong Republican or not a very strong Re-
publican? (Options: Strong Republican or Not very strong Republican)
Political interest
Some people seem to follow what’s going on in government and public affairs most of the time,
whether there’s an election going on or not. Others aren’t that interested. Would you say you follow
what’s going on in government and public affairs? (Options: Most of the time, Some of the time,
Only now and then, Hardly at all, Don’t know)
Political knowledge
Questions below used to create a scale measuring political knowledge that ranges from 0 (no ques-
tions correct) to 8 (all questions correct)
How many times can an individual be elected President of the United States under current laws?
(Options: Once, Twice, Four times, Unlimited number of terms, Don’t know)
How many U.S. Senators are there from each state? (Options: One, Two, Depends on which state,
Don’t know)
Who is currently the Prime Minister of the United Kingdom? (options: Richard Branson, Nick
Clegg, David Cameron, Theresa May, Margaret Thatcher, Don’t know)
For how many years is a member of the United States House of Representatives elected - that is,
how many years are there in one full term of office for a U.S. House member? (Options: Two years,
Four years, Six years, Eight years, For life, Don’t know)
Conspiracy predispositions - mean of four items:
Much of our lives are being controlled by plots hatched in secret places. (Options: Strongly agree
(5), Somewhat agree (4), Neither disagree nor disagree (3), Somewhat disagree (2), Strongly dis-
agree (1))
Even though we live in a democracy, a few people will always run things anyway. (Options: Strongly
agree (5), Somewhat agree (4), Neither disagree nor disagree (3), Somewhat disagree (2), Strongly
disagree (1))
The people who really ’run’ the country are not known to the voter. (Options: Strongly agree (5),
Somewhat agree (4), Neither disagree nor disagree (3), Somewhat disagree (2),Strongly disagree
(1))
Big events like wars, recessions, and the outcomes of elections are controlled by small groups of
people who are working in secret against the rest of us. (Options: Strongly agree (5), Somewhat
agree (4), Neither disagree nor disagree (3), Somewhat disagree (2), Strongly disagree (1))Trust in confidence in mass media in reporting news In general, how much trust and confidence do you have in the mass media – such as newspapers, TV and radio – when it comes to reporting the news fully, accurately and fairly? (Options: A great deal, A fair amount, Not very much, None at all) Other background variables In what year were you born? (open text response) What is your gender? (Options: Male, Female, Other) What racial or ethnic group best describes you? (Options: White, Black or African-American, His- panic or Latino, Asian or Asian-American, Native American, Middle Eastern, Mixed Race, Other) What is the highest level of education you have completed? (Options: Did not graduate from high school; High school graduate; Some college, but no degree (yet); 2-year college degree; 4-year college degree; Postgraduate degree (MA, MBA, MD, JD, PhD, etc.)) Who did you vote for in the election for President? (Options: Hillary Clinton, Donald Trump, Gary Johnson, Jill Stein, Evan McMullin, Other, Did not vote) Wave 2 In general, how much trust and confidence do you have in the mass media - such as newspapers, TV and radio - when it comes to reporting the news fully, accurately and fairly? (Options: A great deal, A fair amount, Not very much, None at all) In general, how much trust and confidence do you have in the information you see on Facebook when it comes to reporting the news fully, accurately, and fairly? (Options: A great deal, A fair amount, Not very much, None at all) We would like to get your feelings toward some groups, leaders, and institutions who are in the news these days using something we call the feeling thermometer. Ratings between 50 degrees and 100 degrees mean that you feel favorable and warm toward the group, leader, or institution. Ratings between 0 degrees and 50 degrees mean that you don’t feel favorable toward them and that you don’t care too much for them. You would rate them at the 50 degree mark if you don’t feel particularly warm or cold toward them. If we come to a group, leader, or institution whose name you don’t rec- ognize, you don’t need to rate them. (Respondents click on thermometer to give ratings for: White people, Hispanic or Latino people, Christians, Muslims)
Experimental manipulation:
Control - series of non-political, control tweets
Condition 1 - random subset of 4 of 8 election fraud/meddling tweets below in random order

Condition 2 - all 8 of the election meddling tweets below in random order

Condition 3 - random subset of 4 of 8 election fraud/meddling tweets below in random order and
all 4 of the no fraud/no meddling tweets (in random order)

Election fraud/meddling tweets:
No fraud/no meddling tweets:
Control tweets:
Attention check (varies by condition)

What news event was mentioned in the tweets you just read? [shown to respondents in treatment
conditions] (Options: The elections in November 2012, The elections in November 2016, The elec-
tions in November 2018, The elections in November 2020)

Which of these individuals was featured in the tweets you just read? [shown to respondents in
control condition] (Options: Travis Lett, Los Angeles chef; James Johnson, New York chef; Steve
Clifford, Chicago chef; John Wright, Miami chef)

Confidence measures:
How confident are you that everyone who was legally entitled to vote and sought to do so was able
to successfully cast a ballot in the election this November? (Options: Very confident, Somewhat
confident, Not too confident, Not at all confident)

[If they said they voted]1 How confident are you that your vote was accurately counted in the elec-
tion this November? (Options: Very confident, Somewhat confident, Not too confident, Not at all
confident)

How confident are you that election officials managed the counting of ballots fairly in the election
this November? (Options: Very confident, Somewhat confident, Not too confident, Not at all con-
   1 Only  respondents who indicated "I am sure I voted" in response to the following question (“In talking to people
about elections, we often find that a lot of people were not able to vote because they weren’t registered, they were sick,
or they just didn’t have time. Which of the following statements best describes you?”) were shown this question. All
other confidence measure items were asked to every respondent.
fident)

Do you agree or disagree with the following statement?
At the end of the day, in spite of all the problems casting and counting the votes, the system worked.
(Options: Strongly agree, Somewhat agree, Somewhat disagree, Strongly disagree)

To what extent do you trust elections in this country? Please respond on the scale below where 1
means “not at all” and 7 means “a lot.” (Options: 1 Not at all, 2, 3, 4, 5, 6, 7 A lot)

How secure are ballots from tampering in this country’s elections? (Options: Extremely secure,
Very secure, Moderately secure, Not too secure, Not at all secure)

How often are voting machines accurate in counting the votes? (Options: Extremely often, Very
often, Moderately often, Not too often, Not at all often)

Thermometer ratings
We would like to get your feelings toward some groups, leaders, and institutions who are in the
news these days using something we call the feeling thermometer. Ratings between 50 degrees and
100 degrees mean that you feel favorable and warm toward the group, leader, or institution. Ratings
between 0 degrees and 50 degrees mean that you don’t feel favorable toward them and that you don’t
care too much for them. You would rate them at the 50 degree mark if you don’t feel particularly
warm or cold toward them. If we come to a group, leader, or institution whose name you don’t
recognize, you don’t need to rate them. (Respondents click on thermometer to give ratings for:
Democratic Party, Republican Party, President Trump, The news media)

How important is it for you to live in a country that is governed democratically? Please respond
below on this scale where 1 means it is “not at all important” and 10 means “absolutely important.”
(Options: 1 Min, 2, 3, 4, 5, 6, 7, 8, 9, 10 Max)

Various types of political systems are described below. Please think about each choice in terms of
governing this country and indicate if you think it would be a very good, fairly good, fairly bad, or
very bad way of governing the United States.

Having a strong leader who does not have to bother with Congress and elections: (Options: Very
good, Fairly good, Fairly bad, Very bad)

Having experts, not government, make decisions according to what they think is best for the country:
(Options: Very good, Fairly good, Fairly bad, Very bad)
Having the army rule: (Options: Very good, Fairly good, Fairly bad, Very bad)
Having a democratic political system: (Options: Very good, Fairly good, Fairly bad, Very bad)
Online Appendix B
The survey instrument (See Appendix A) included twelve survey items measuring attitudes towards
the integrity of the elections. These measured perceptions of perceived electoral integrity includ-
ing ballot security, machine accuracy, and fairness. Following our preregistration we conducted
an exploratory factor analysis, which indicated three underlying dimensions. The results for this
analysis are shown in Table B1. We selected the seven items marked with a † in Table B1.

                   Table B1: Preregistered factor analysis of all measured outcomes

                                                                              Factor 1   Factor 2   Factor 3   Uniqueness
 Confidence entitled allowed to vote†                                          0.6103     -.0102     0.2473      0.5663
 Confidence own vote was counted†                                              0.6875    -0.1451    -0.1471      0.4847
 Confidence officials manage counting votes†                                   0.8193      .0791    -.06810      0.3178
 System works despite problems casting and counting votes†                     0.8221      .0280     -.0533      0.3205
 Trust in elections†                                                          -0.8265     -.0178     0.1088      0.3048
 Security of ballots from tampering†                                           0.8287      .0845     -.0760      0.3003
 Frequency voting machines accurate in counting votes†                         0.7604     -.0962     -.0910      0.4042
 Importance of living in democratically governed country                      -0.1218     0.1380     0.8431      0.2554
 Having a strong leader who doesn’t have to both with parliament/elections     .0296      0.8191     0.2352      0.2729
 Having experts, not government, make decisions                                -.0419     0.7572    -0.1416      0.4048
 Having the army rule                                                          .0551      0.8079     0.2133      0.2988
 Having a democratic political system                                          .0798     -0.1139    -0.8647      0.2330

Exploratory factor analysis of the outcome measures that we preregistered that we would consider to determine if they
scaled together after varimax rotation. Question wording for each item is presented in Online Appendix A. † indicates
items chosen for final measure.

   Based on these results, we fit a confirmatory factor analysis reported in Table B2. This model
was identified by setting the mean of the latent trait to zero and the variance to unity. All factor
loadings were large and significant, indicating an adequate fit.
Table B2: Structural equation model for latent election confidence measure
Coefficient Constant Variance
Confidence entitled allowed to vote 0.535 2.574 0.714
(0.012) (0.032) (0.013)
Confidence own vote was counted 0.639 3.523 0.592
(0.011) (0.047) (0.014)
Confidence officials manage counting votes 0.790 2.782 0.376
(0.007) (0.034) (0.011)
System works despite problems casting and counting votes 0.795 3.088 0.368
(0.007) (0.037) (0.011)
Trust in elections 0.798 2.819 0.363
(0.067) (0.034) (0.011)
Security of ballots from tampering 0.816 2.789 0.334
(0.006) (0.034) (0.010)
Frequency voting machines accurate in counting votes 0.725 3.568 0.474
(0.008) (0.042) (0.012)
All coefficients are statistically significant (p < .001). Structural equation model of the outcome measures that we
identified as scaling together in Table B1. Latent variable estimated using maximum likelihood with missing val-
ues. Question wording for each item is presented in Online Appendix A. N=4,280; χ 2 (d f = 14)=487.36, p < .001;
CFI=0.967; TLI=0.950; RMSEA = 0.089Online Appendix C: Full results for main text The model specification in Table C1 deviates from our preregistration. Our preregistered anal- ysis, which is reported in Table C3, pools Democrats and independents and analyzes them sep- arately from Republicans. However, independents reacted to the messages somewhat differently from Democrats. We therefore disaggregate Democrats and independents in our analysis and con- sider them separately from Republicans, who are the omitted category in our heterogeneous effects model (see Table C1). As described below, the analysis of how treatment effects vary by Trump approval is exploratory and was not preregistered. To mirror the party interaction model, we make Trump approvers the omitted category in that model (Table C2).
Table C1: Effect of exposure to voter fraud allegations on election confidence by party

                                                                                     Coefficient
                                                                                       (SE)
                                Low dose                                              -0.184**
                                                                                       (0.070)
                                High dose                                            -0.273***
                                                                                       (0.071)
                                Low dose + fact-check tweets                           -0.176*
                                                                                       (0.072)
                                Democrat                                             -0.287***
                                                                                       (0.065)
                                Independent                                          -0.450***
                                                                                       (0.088)
                                Low dose × Democrat                                      0.099
                                                                                       (0.092)
                                High dose × Democrat                                   0.252**
                                                                                       (0.095)
                                Low dose + fact-check × Democrat                       0.193*
                                                                                       (0.094)
                                Low dose × independent                                   0.008
                                                                                       (0.125)
                                High dose × independent                                 -0.010
                                                                                       (0.125)
                                Low dose + fact-check tweets × independent               0.027
                                                                                       (0.127)
                                Constant                                              0.309***
                                                                                       (0.049)
                                Effect of high dose (versus low dose)
                                Democrats                                              0.064
                                                                                      (0.062)
                                Republicans                                           -0.089
                                                                                      (0.071)
                                Difference (H3b)                                       0.153
                                                                                      (0.094)
                                Effects of low dose + fact-check (versus low dose)
                                Democrats                                              0.103
                                                                                      (0.060)
                                Republicans                                            0.008
                                                                                      (0.072)
                                Difference (H4b)                                       0.094
                                                                                      (0.094)
                                N                                                      4283

* p < 0.05, * p < 0.01, *** p < .005 (two-sided). OLS models with robust standard errors. Outcome variable is a
composite measure of election confidence that was created using confirmatory factor analysis (see Online Appendix B
for estimation details). Partisan leaners are treated as members of the party in question.
Table C2: Effect of exposure to voter fraud allegations on election confidence by Trump approval
Coefficient
(SE)
Low dose -0.211***
(0.064)
High dose -0.339***
(0.066)
Low dose + fact-check -0.190***
(0.066)
Disapprove of Trump -0.333***
(0.060)
Low dose × disapprove of Trump 0.114
(0.085)
High dose × disapprove of Trump 0.304***
(0.087)
Low dose + fact-check × disapprove of Trump 0.178*
(0.087)
Constant 0.288***
(0.046)
Effect of high dosage (versus low)
Disapprover 0.063
(0.057)
Approver -0.128*
(0.065)
Difference -0.191*
(0.087)
Effects of low dose + fact-check (versus low dose)
Disapprover 0.086
(0.057)
Approver 0.021
(0.065)
Difference 0.065
(0.087)
N 4281
* p < 0.05, ** p < 0.01, *** p < .005 (two-sided). OLS models with robust standard errors. Outcome variable is a
composite measure of election confidence that was created using confirmatory factor analysis (see Online Appendix B
for estimation details). Sample includes all respondents (i.e., the reference category for the Trump approval indicator
are respondents who do not approve).Table C3: Effect of exposure to voter fraud allegations on election confidence by party (Republicans
vs. Democrats/independents)
Coefficient
(SE)
Low dose -0.115*
(0.052)
High dose -0.106
(0.054)
Low dose + fact-check -0.035
(0.053)
Republican 0.330***
(0.062)
Low dose × Republican -0.069
(0.087)
High dose × Republican -0.167
(0.089)
Low dose + fact-check × Republican -0.141
(0.090)
Constant -0.020
(0.037)
N 4283
* p < 0.05, ** p < 0.01, *** p < .005 (two-sided). OLS models with robust standard errors. Outcome variable is a
composite measure of election confidence that was created using confirmatory factor analysis (see Online Appendix
B for estimation details). Sample includes all respondents (i.e., the reference category for the Republican indicator
includes both Democrats and independents). Partisan leaners are treated as members of the party in question. This
table is included in addition to Table C1 per the preregistration.
Table C4: Main treatment effects for support for democracy
Strong Experts make Army Democratic Importance of
leader decisions rule political system living in democracy
Low dose 0.005 0.017 -0.007 -0.025 -0.063
(0.044) (0.043) (0.037) (0.035) (0.083)
High dose -0.029 -0.027 -0.023 -0.038 -0.060
(0.044) (0.043) (0.037) (0.035) (0.085)
Low dose + fact-check tweets -0.086 -0.047 -0.067 -0.006 -0.053
(0.045) (0.043) (0.038) (0.035) (0.084)
Constant 3.182*** 2.741*** 3.450*** 3.413*** 8.743***
(0.031) (0.031) (0.027) (0.024) (0.059)
N 4240 4240 4229 4237 4264
4264
* p < 0.05, ** p < 0.01, *** p < .005 (two-sided). OLS models with robust standard errors.Online Appendix D: Tests for additional preregistered moderators
Table D1: Effect of exposure to voter fraud allegations on election confidence by feelings towards
Trump
Coefficient
(SE)
Low dose -0.095
(0.061)
High dose -0.029
(0.064)
Low dose + fact-check 0.033
(0.063)
Feelings towards Trump 0.003***
(0.001)
Low dose × feelings towards Trump -0.001
(0.001)
High dose × feelings towards Trump -0.003
(0.001)
Low dose + fact-check × feelings towards Trump -0.003
(0.001)
Constant -0.036
(0.044)
N 4131
* p < 0.05, ** p < 0.01, *** p < .005 (two-sided; p-values of treatment × moderator interaction terms are adjusted to
control the false discovery rate using the Benjamini and Hochberg 1995 procedure). OLS models with robust standard
errors. Outcome variable is a composite measure of election confidence that was created using confirmatory factor
analysis (see Online Appendix B for estimation details). Sample includes all respondents (i.e., the reference category
for the Republican indicator is Democrats and independents). Partisan leaners are treated as members of the party in
question.Table D2: Effect of exposure to voter fraud allegations on election confidence by feelings towards
Trump (tercile indicators)
Coefficient
(SE)
Low dose -0.091
(0.072)
High dose -0.039
(0.077)
Low dose + fact-check 0.005
(0.076)
Feels neutrally about Trump 2 0.316***
(0.071)
Feels warmly about Trump 0.310***
(0.077)
Low dose × feels neutrally -0.072
(0.102)
Low dose × feels warmly -0.069
(0.105)
High dose × feels neutrally -0.103
(0.105)
High dose × feels warmly -0.235
(0.109)
Low dose + fact-check × feels neutrally -0.066
(0.103)
Low dose + fact-check × feels warmly -0.182
(0.109)
Constant -0.094
(0.053)
N 4131
* p < 0.05, ** p < 0.01, *** p < .005 (two-sided; p-values of treatment × moderator interaction terms are adjusted to
control the false discovery rate using the Benjamini and Hochberg 1995 procedure). OLS models with robust standard
errors. Outcome variable is a composite measure of election confidence that was created using confirmatory factor
analysis (see Online Appendix B for estimation details). Sample includes all respondents (i.e., the reference category
for the Republican indicator is Democrats and independents). Partisan leaners are treated as members of the party in
question.We do not discuss the results in Tables D3 and D4 (below) in the main text because they appear to
be a spurious result of the correlation between media feelings and trust and identifying as or leaning
Republican (r = −.51 and r = −.42, respectively), which we find often moderates our experimental
treatment effects (see above and the main text).
Table D3: Effect of exposure to voter fraud allegations on election confidence by media feelings
Coefficient
(SE)
Low dose -0.271***
(0.080)
High dose -0.336***
(0.082)
Low dose + fact-check -0.189*
(0.083)
Media feelings 0.002*
(0.001)
Low dose × media feelings 0.003
(0.001)
High dose × media feelings 0.004
(0.001)
Low dose + fact-check × media feelings 0.002
(0.001)
Constant 0.015
(0.057)
N 4113
* p < 0.05, ** p < 0.01, *** p < .005 (two-sided; p-values of treatment × moderator interaction terms are adjusted to
control the false discovery rate using the Benjamini and Hochberg 1995 procedure). OLS models with robust standard
errors. Outcome variable is a composite measure of election confidence that was created using confirmatory factor
analysis (see Online Appendix B for estimation details). Media feelings measured using a 0–100 feeling thermometer.Table D4: Effect of exposure to voter fraud allegations on election confidence by media trust
Coefficient
(SE)
Low dose -0.339*
(0.136)
High dose -0.460***
(0.136)
Low dose + fact-check -0.259
(0.140)
Trust in mass media 0.215***
(0.036)
Low dose × trust in mass media 0.077
(0.050)
High dose × trust in mass media 0.118
(0.051)
Low dose + fact-check × trust in mass media 0.064
(0.051)
Constant -0.437***
(0.097)
N 4282
* p < 0.05, ** p < 0.01, *** p < .005 (two-sided; p-values of treatment × moderator interaction terms are adjusted to
control the false discovery rate using the Benjamini and Hochberg 1995 procedure). OLS models with robust standard
errors. Outcome variable is a composite measure of election confidence that was created using confirmatory factor
analysis (see Online Appendix B for estimation details). Media trust measured using a four-point scale.You can also read