Impact of Ramadan diurnal intermittent fasting on the metabolic syndrome components in healthy, non-athletic Muslim people aged over 15 years: a ...
←
→
Page content transcription
If your browser does not render page correctly, please read the page content below
Downloaded from https://www.cambridge.org/core. IP address: 46.4.80.155, on 13 Feb 2021 at 06:52:08, subject to the Cambridge Core terms of use, available at https://www.cambridge.org/core/terms. https://doi.org/10.1017/S000711451900254X
British Journal of Nutrition (2020), 123, 1–22                                                                        doi:10.1017/S000711451900254X
© The Authors 2019

Impact of Ramadan diurnal intermittent fasting on the metabolic syndrome
components in healthy, non-athletic Muslim people aged over 15 years:
a systematic review and meta-analysis

‘Mo’ez Al-Islam’ E. Faris1*, Haitham A. Jahrami2,3, Joud Alsibai1 and Asma A. Obaideen1,4
1
 Department of Clinical Nutrition and Dietetics, College of Health Sciences/Research Institute of Medical and Health Sciences
(RIMHS), University of Sharjah, Sharjah, United Arab Emirates
2
 Department of Rehabilitation Services, Periphery Hospitals, Ministry of Health, Manama, Bahrain
3
 Department of Psychiatry, College of Medicine and Medical Sciences, Arabian Gulf University, Manama, Bahrain
4
 Department of Clinical Nutrition, Faculty of Medicine and Health Sciences, University Putra Malaysia, 443400, Seri
Kembangan, Malaysia
(Submitted 15 April 2019 – Final revision received 23 August 2019 – Accepted 17 September 2019)

Abstract
Studies on the impact of Ramadan diurnal intermittent fasting (RDIF) on the metabolic syndrome (MetS) components among healthy
Muslims observing Ramadan month have yielded contradictory results. This comprehensive meta-analysis aimed to obtain a more stable
estimate of the effect size of fasting during Ramadan on the MetS components, examine variability among studies, assess the generalisability
of reported results and perform subgroup analyses for associated factors. We searched the CINAHL, Cochrane, EBSCOhost, Google Scholar,
ProQuest Medical, PubMed/MEDLINE, ScienceDirect, Scopus and Web of Science databases for relevant studies published from 1950 to
March 2019. The MetS components analysed were: waist circumference (WC), systolic blood pressure (SBP), fasting plasma/serum glucose
(FG), TAG, and HDL-cholesterol. We identified eighty-five studies (4326 participants in total) that were conducted in twenty-three countries
between 1982 and 2019. RDIF-induced effect sizes for the MetS components were: small reductions in WC (no. of studies K = 24, N 1557,
Hedges’ g = −0·312, 95 % CI −0·387, −0·236), SBP (K = 22, N 1172, Hedges’ g = −0·239, 95 % CI −0·372, −0·106), FG (K = 51, N 2318, Hedges’
g = −0·101, 95 % CI −0·260, 0·004) and TAG (K = 63, N 2862, Hedges’ g = −0·088, 95 % CI −0·171, −0·004) and a small increase in HDL-cho-
lesterol (K = 57, N 2771, Hedges’ g = 0·150, 95 % CI 0·064, 0·236). We concluded that among healthy people, RDIF shows small improvement
in the five MetS components: WC, SBP, TAG, FG and HDL.

Key words: Energetic restriction: Intermittent fasting: The metabolic syndrome: Meta-analysis: Ramadan: Systematic review:
Time-restricted feeding

The metabolic syndrome (MetS) is considered a multiplex                          food and drink from dawn to sunset. During Ramadan, the
risk factor for atherosclerotic CVD and type 2 diabetes(1).                      majority of Muslims throughout the world have two main meals,
Major drivers of MetS are insulin resistance, atherogenic                        one immediately after sunset (suhoor) and the other just before
dyslipidaemia, prothrombotic state, elevated glucose, elevated                   dawn (iftar). During the night hours from sunset to dawn,
blood pressure (BP), pro-inflammatory state and excess energy                    people are allowed to eat and drink freely but may not consume
intake and concomitant obesity(2). Mounting evidence suggests                    any food or drink after dawn(6). Ramadan diurnal intermittent
that lifestyle interventions (e.g. intermittent fasting and                      fasting (RDIF) represents a unique fasting pattern that involves
energetic restriction(3) or a weight reducing diet(4)) and lifestyle             consistent diurnal abstinence from food and drink, including
modifications (e.g. physical exercise(5)) can reverse metabolic                  water, for a fasting period of 12–18 h (depending on the
risk factors.                                                                    season) over 29–30 d. In the last two decades, several published
    Ramadan is the ninth month of the Islamic lunar calendar                     systematic reviews and meta-analyses(7–13) and original research
during which healthy adult Muslims refrain from consuming                        studies have investigated the impact of RDIF on various health

Abbreviations: BP, blood pressure; FG, fasting glucose; MetS, metabolic syndrome; RDIF, Ramadan diurnal intermittent fasting; SBP, systolic blood pressure;
 WC, waist circumference.
* Corresponding author: ‘Mo’ez Al-Islam’ E. Faris, fax þ97165057515, email mfaris@sharjah.ac.ae; moezfaris@hotmail.com
Downloaded from https://www.cambridge.org/core. IP address: 46.4.80.155, on 13 Feb 2021 at 06:52:08, subject to the Cambridge Core terms of use, available at https://www.cambridge.org/core/terms. https://doi.org/10.1017/S000711451900254X
2                                                          M. A.-I. E. Faris et al.

outcomes, including risk factors for the MetS, such as body               Inclusion criteria
weight, body fat, lipid profile and inflammatory and oxidative
                                                                          We included observational and interventional clinical studies
stress states. The ultimate complications of the MetS, such as
                                                                          that examined the impact of RDIF on the MetS components.
CVD, have also been well-investigated. However, no published
                                                                          The principal criteria for study inclusion and outcomes were
works have discussed or systematically analysed the MetS
                                                                          the MetS components as reported in the International
components as a cluster of factors involved in the etiopathogen-
                                                                          Diabetes Federation Consensus Worldwide Definition of the
esis of the syndrome.
                                                                          Metabolic Syndrome(14). Specific inclusion criteria for study
    This systematic review and meta-analysis aimed to system-
                                                                          selection were: (1) publication date between 1950 and March
atically summarise and analyse available scientific evidence
                                                                          2019; (2) original research articles published in the English
and clarify the results of published studies regarding the impact
                                                                          language; (3) studies that reported numerical values (e.g., arith-
of RDIF on the MetS components among non-diabetic, non-
                                                                          metic mean with/without standard deviation (SD)) for at least
athletic, healthy people aged 15 years and older, who observed
                                                                          one MetS component (WC, FG, TAG, HDL and systolic BP
Ramadan fasting. The MetS components investigated in this
                                                                          (SBP)); (4) studies that assessed the impact of RDIF on healthy
review were elevated waist circumference (WC), elevated
                                                                          people as the target population in prospective observational
TAG, reduced HDL-cholesterol, elevated fasting glucose (FG)
                                                                          studies or on healthy controls in case–control, semi-experimental
and elevated BP(14).
                                                                          and experimental/interventional studies. We focused on stud-
    The results of this analysis will expand knowledge regarding
                                                                          ies that examined the effect of RDIF on the MetS components;
the metabolic impacts of RDIF and help to contextualise
                                                                          therefore, we included studies that examined these compo-
existing knowledge by examining all similar studies. The
                                                                          nents at least twice: pre-fasting as the baseline (e.g. few days
analysis of all available valid evidence pertaining to the effect
                                                                          or 1–2 weeks before Ramadan month or the first few days of
of RDIF on metabolic outcomes will provide the best estimates
                                                                          Ramadan month), and post-fasting (at least 2 weeks into
of effect(15). This analysis also aimed to clarify the variability
                                                                          Ramadan month or after completion of Ramadan month). It
between different observational and clinical studies on this
                                                                          should be noted that Islamic laws pertaining to fasting specify
topic(16). In addition, subgroup analyses for specific MetS
                                                                          that premenopausal women are exempt from fasting during
components were performed to explore differences in
                                                                          menstruation days; therefore, these women are not expected
findings among countries. The findings of the present review
                                                                          to complete fasting for the whole month of Ramadan. A similar
will help to determine the generalisability of the results
                                                                          exemption applies to elderly people who may find it hard
of identified studies, direct future researchers towards
                                                                          to complete the whole Ramadan month and may miss some
knowledge gaps that need further examination using different
                                                                          fasting days.
research models (e.g. experimental interventional trials
                                                                              In all of the included studies, fasting glucose/lipid parameters
and animal models) and inform further subgroup analyses
                                                                          were obtained from venous blood sample collected after
(as appropriate).
                                                                          8–12 h of overnight fast, for the assay of all standard biochemical
                                                                          parameters included in glucoses/lipids profile. For the purpose
                                                                          of data analyses, all parameters were unified to mmol/l rounded
Materials and methods                                                     to two decimal places.
This meta-analysis used the Preferred Reporting Items for
Systematic Reviews and Meta-Analyses as a guideline for                   Exclusion criteria
reporting the findings(17).                                               Identified articles were assessed against specific exclusion
                                                                          criteria to eliminate potential methodological and quality
                                                                          issues: (1) studies that exclusively involved fasting children
Database searches
                                                                          and adolescents
Downloaded from https://www.cambridge.org/core. IP address: 46.4.80.155, on 13 Feb 2021 at 06:52:08, subject to the Cambridge Core terms of use, available at https://www.cambridge.org/core/terms. https://doi.org/10.1017/S000711451900254X
Ramadan fasting and the metabolic syndrome 3
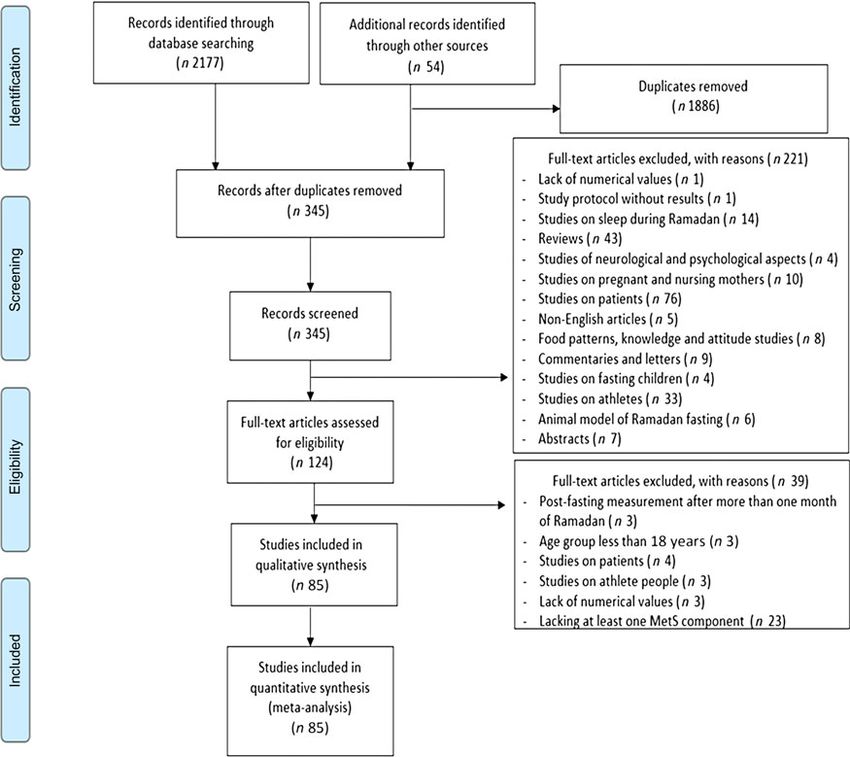
Fig. 1. Preferred Reporting Items for Systematic Reviews and Meta-Analyses flow chart for the selection of publications included in the systematic review and meta-
analysis. MetS, metabolic syndrome.
Main outcomes and measures Estimating fasting time length
The principal outcome of this review was to report the effect Ramadan month as presented in the lunar calendar was matched
of RDIF on effect size changes in the MetS components with the Gregorian calendar using a time and date website
(WC, FG, TAG, HDL and SBP). SBP was chosen as it is a (https://www.timeanddate.com/holidays/us/ramadan-begins).
major component of BP. Two authors (A. A. O. and M. E. F.) The daily length of fasting during Ramadan month was calcu-
independently screened the titles and abstracts of identified lated using the sunrise and sunset times reported for that month
studies to assess the studies for eligibility. The first step of for the city/country of each included study (https://www.
screening was examining all titles and abstracts to exclude timeanddate.com/sun/@8469718). Time points for Ramadan
irrelevant publications. Two authors (M. E. F. and J. A.) fasting are the call to prayer (Athan) for Fajr (abstinence or
performed this initial screening, which was validated by Imsak time, end of pre-fasting meal time or suhoor) and sunset
another author (A. A. O). Any conflicts in opinions regarding or Maghrib (breakfast or Iftar meal time) prayer times. The
study eligibility were resolved through dialogue with a fourth sunrise prayer time is declared by Fajr Athan to be about mean
author (H. A. J.) to reach consensus. To standardise data extrac- of 80 min before the real sunrise time, as recorded in the Islamic
tion, the review team systematically collected and coded data calendar for prayer times. Therefore, the actual length of fasting
for study characteristics (e.g. title, year, country, sample size time was calculated by adding 80 min to the time between
and participants’ characteristics such as age, sex or proportion the sunrise and sunset time points. Details of the pre-dawn
of males) and the main findings for the MetS components Fajr and sunset Maghrib prayer time points on the Islamic
before and after RDIF. calendar are available on the Islamic Finder website forDownloaded from https://www.cambridge.org/core. IP address: 46.4.80.155, on 13 Feb 2021 at 06:52:08, subject to the Cambridge Core terms of use, available at https://www.cambridge.org/core/terms. https://doi.org/10.1017/S000711451900254X
4 M. A.-I. E. Faris et al.
Sharjah city, United Arab Emirates (https://www.islamicfinder. method was used to confirm the findings(24). Finally, subgroup
org/world/united-arab-emirates/292672/sharjah-prayer-times/). analysis for each MetS component was performed to investigate
This showed that the length of fasting time for a specific differences among countries. We performed this analysis if three
day (time between the Fajr and Maghrib prayer times) was or more studies were available from any given country.
787 min (approximately 13 h), which was close to the length
of fasting time calculated using the solar calendar (sunrise and Critical appraisal of studies (quality assessment)
sunset time points).
Two reviewers (M. E. F. and A. A. O.) independently assessed the
methodological quality of studies using a standardised checklist
Data synthesis and statistical analyses consisting of six items in terms of sample size and sampling
technique, standardisation of data collection, appropriateness
Combined means were computed when studies included
of statistical analyses, quality of reporting results and generalis-
subgroups (e.g. normal body weight, overweight, obese), with
ability. The appraisal scores range between 0 and 6, with scores
different means and SD reported for each subgroup. P-values
of 0–2 corresponds to low quality, 3–4 medium quality and
for the combined subgroup means were calculated. All descrip-
5–6 high quality. Quality score was set for each study by consen-
tive and inferential tests were performed using Stata software
sus after discussion (see online Supplementary Material 2).
(Stata, M.P., 15.0.: StataCorp, 2017).
We performed a series of one-group (pre-post) meta-
analyses using a pre- and post-means model, sample size
Results
and P-values (paired groups). Hedges’ g was used to measure
the effect size. Hedges’ g is an important measure of corrected Eighty-five studies with a total of 4326 participants were included
effect size that is sensitive to even small samples (Table 1. Characteristics and major findings of the included studies on the impact of Ramadan diurnal intermittent fasting on the metabolic syndrome components in healthy people aged 15 years and above
Sample size Age (years) Before Ramadan† End of Ramadan† Results (after Total
Study, publication Examined Ramadan month quality
year Country n % Male Mean Range Study design markers Mean SD Mean SD compared with before) score
Fedail et al., 1982 (25)
Sudan 24 83·3 30 21–40 Prospective TAG 1·32 mmol/l 0·22 1·27 mmol/l 0·17 Non-significant 4
observational* decrease in TAG
Azizi & Rasouli, Iran 9 100 35 23–54 Prospective FG 82 mg/dl 4·4 84 mg/dl 5·2 No significant change 4
1987(26) observational* in FG
El Ati et al., 1995(27) Tunisia 16 0 25–39 Prospective TAG 0·68 mmol/l 0·05 0·66 mmol/l 0·07 No significant change 4
observational* FG 4·86 mmol/l 0·39 5·21 mmol/l 0·62 in TAG or FG
Adlouni et al., 1997(28) Morocco 32 100 25–50 Prospective HDL 0·91 mmol/l 0·21 1·04 mmol/l 0·08 Significant decrease in 4
observational* TAG 1 mmol/l 0·42 0·7 mmol/l 0·28 serum TAG and FG
FG 5·1 mmol/l 0·5 4·38 mmol/l 0·39 and a significant
increase in HDL
Bilto, 1998(29) Jordan 74 81 20–48 Prospective HDL 1·3 mmol/l 0·33 1·07 mmol/l 0·19 HDL decreased 4
observational* TAG 1·35 mmol/l 0·68 0·82 mmol/l 0·33 significantly
FG 5·4 mmol/l 2·21 4·73 mmol/l 0·5
Ramadan fasting and the metabolic syndrome
Maislos et al., 1998(30) Israel 22 64 24 20–45 Prospective HDL 0·91 mmol/l 0·28 1·13 mmol/l 0·27 Only HDL increased 4
observational* TAG 1·3 mmol/l 0·7 1·3 mmol/l 1·1 significantly
FG 4·27 mmol/l 0·66 4·44 mmol/l 0·33
Mahboob et al., Iran 35 100 25 19–33 Prospective HDL 49·53 mg/dl 7·48 51·35 mg/dl 11·71 No significant change 4
1999(31) observational* TAG 83·5 mg/dl 30·64 76·54 mg/dl 17·59 in HDL or TAG
Akanji et al., 2000(32) Kuwait 49 NR 47·6 10·8 Prospective HDL 1·16 mmol/l 0·32 1·13 mol/l 0·36 No significant change 2
observational* TAG 2·7 mmol/l 1·5 2·7 mmol/l 2·4 in HDL, TAG or FG
FG 5·59 mmol/l 1 5·9 mmol/l 1·2
Asgary et al., 2000(33) Iran 46 100 30–60 Cross-sectional TAG 209·8 mg/dl 71·65 193·00 mg/dl 57·15 TAG decreased 4
FG 92·57 mg/dl 33·73 90·22 mg/dl 22·09 significantly; FG
decreased, but was
not significant
Qujeq et al., 2002(34) Iran 83 69 34·25 21–55 Prospective HDL Male: 1·09 mmol/l 0·11 Male: 1·74 mmol/l 0·18 Statistically significant 4
(SD 9·8) observational* Female: 1·13 mmol/l 0·12 Female: 1·81 mmol/l 0·19 elevation in HDL
Ramadan, 2002(35) Kuwait 16 100 NR Prospective TAG 1·4 mmol/l 0·2 1·3 mmol/l 0·1 No significant changes 2
observational* FG 5 mmol/l 0·1 5·5 mmol/l 0·1 in TAG and FG
Afrasiabi et al., Iran 16 100 NR Prospective HDL 43·2 mg/dl 2·2 45 mg/dl 2·1 Significant reduction in 2
2003(36) observational* TAG 235·7 mg/dl 36·9 171·1 mg/dl 25·9 TAG
Fakhrzadeh et al., Iran 91 55 19·9 Prospective WC Male: 74·2 cm 10·4 Male: 75 cm 6 Significant reduction in 4
2003(37) (SD 1·8) observational* Female: 81·2 cm 2 Female: 78·1 cm 12·5 WC in women; FG
HDL Male: 39·9 mg/dl 7·1 Male: 48·3 mg/dl 7·2 decreased
Female: 48·1 mg/dl 10·2 Female: 62·9 mg/dl 18·3 significantly in both
TAG Male: 118·6 mg/dl 45·6 Male: 74·4 mg/dl 1 men and women;
Female: 130 mg/dl 85·1 Female: 105·2 mg/dl 64·7 Serum TAG
FG Male: 87·5 mg/dl 8·8 Male: 60·8 mg/dl 6·5 decreased and HDL
Female: 89·7 mg/dl 9·3 Female: 65·7 mg/dl 18·4 increased
SBP Male: 117·7 mg/dl 11·4 Male: 117·2 mg/dl 10·6 significantly
Female: 103·8 mg/dl 12·1 Female: 103·7 mg/dl 11·2
Kassab et al., 2003(38) Bahrain 44 0 18–45 Prospective WC Lean: 72·2 cm 1 Lean: 71·5 cm 1 No significant change 4
observational* Obese: 93·1 cm 2·7 Obese: 89·2 cm 2·5 in WC, TAG or FG
TAG Lean: 0·72 mmol/l 0·05 Lean: 0·77 mmol/l 0·03
Obese: 0·95 mmol/l 0·16 Obese: 1·04 mmol/l 0·21
FG Lean: 5·27 mmol/l 0·08 Lean: 5·06 mmol/l 0·15
Obese: 5·81 mmol/l 0·47 Obese: 5·84 mmol/l 0·61
Larijani et al., 2003(39) Iran 115 58 21·2 15–45 Prospective FG 88·4 mg/dl 9 62·9 mg/dl 7·7 Significant drop in FG 4
(SD 4·3) observational*
5
Downloaded from https://www.cambridge.org/core. IP address: 46.4.80.155, on 13 Feb 2021 at 06:52:08, subject to the Cambridge Core terms of use, available at https://www.cambridge.org/core/terms. https://doi.org/10.1017/S000711451900254X6
Table 1. Continued
Sample size Age (years) Before Ramadan† End of Ramadan† Results (after Total
Study, publication Examined Ramadan month quality
year Country n % Male Mean Range Study design markers Mean SD Mean SD compared with before) score
Kassab et al., 2004 (40)
Bahrain 46 0 22 18–45 Prospective WC 77·7 cm 1·6 75·8 cm 1·5 No significant change 4
(SD 2) observational* TAG 0·79 mmol/l 0·06 0·84 mmol/l 0·06 in WC, TAG or FG
FG 5·41 mmol/l 0·14 5·27 mmol/l 0·2
Rahman et al., Bangladesh 20 100 38·27 Prospective HDL 38·14 mg/dl 7·4 46·71 mg/dl 14·33 SBP and FG 4
2004(41) (SD 4·07) observational* TAG 146·66 mg/dl 72·78 131·04 mg/dl 41·47 significantly
FG 105·3 mg/dl 14·1 85·6 mg/dl 12·4 decreased; HDL
SBP 124·3 mmHg 13·9 111·8 mmHg 10·8 increased
significantly
Yucel et al., 2004(42) Turkey 38 55 32·5 20–45 Prospective WC 83·29 cm 13·21 83·44 cm 12·82 No significant change 4
(SD 12·5) in WC
Aksungar et al., Turkey 24 50 21–35 Prospective HDL Male: 49 mg/dl 15·25 Male: 56 mg/dl 16·31 HDL increased 4
2005(43) observational* Female: 57·4 mg/dl 13·63 Female: 66·5 mg/dl 11·79 significantly
TAG Male: 76·27 mg/dl 29·04 Male: 76·68 mg/dl 27·08
Female: 66·82 mg/dl 23·53 Female: 68·66 mg/dl 15·49
Saleh et al., 2005(44) Kuwait 60 68 24–56 Prospective WC Male: 94·68 cm 11·01 Male: 92 cm 10·7 WC significantly 4
observational* Female: 89·76 cm 17·52 Female: 87·18 cm 17·53 decreased in males
HDL Male: 1·02 mmol/l 0·33 Male: 1·04 mmol/l 0·37 and females
Female: 1·27 mmol/l 0·34 Female: 1·32 mmol/l 0·36
M. A.-I. E. Faris et al.
TAG Male: 1·33 mmol/l 0·6 Male: 1·54 mmol/l 1·19
Female: 1·38 mmol/l 0·96 Female: 1·19 mmol/l 0·8
FG Male: 5·55 mmol/l 0·58 Male: 5·55 mmol/l 0·55
Female: 5·4 mmol/l 0·89 Female: 5·2 mmol/l 0·54
Al-Numair, 2006(45) Saudi 45 100 30–45 Prospective HDL 1·79 mmol/l 0·23 1·82 mmol/l 0·25 Significant decrease in 4
Arabia observational* TAG 1·48 mmol/l 0·55 1·2 mmol/l 0·51 FG and TAG; No
FG 4·91 mmol/l 0·5 4·51 mmol/l 0·52 significant change in
serum HDL
Dewanti et al., Indonesia 37 100 39 17–62 Prospective SBP 134 mmHg 21 124 mmHg 17 SBP decreased 2
2006(46) (SD 10) observational* significantly
Farshidfar et al., Iran 21 NR NR Pre-experimental HDL 39·59 mg/dl 15·67 43·28 mg/dl 12·21 Significant decrease in 2
2006(47) TAG 65·37 mg/dl 36·76 68·34 mg/dl 19·85 FG and significant
FG 74·4 mg/dl 16·97 62·09 mg/dl 6·92 increase in HDL (on
day 28 of Ramadan)
Lamine et al., 2006(48) Tunisia 30 30 23·7 Prospective HDL 1·1 mmol/l 0·4 1·3 mmol/l 0·4 Significant increase in 4
(SD 2·2) observational* TAG 0·8 mmol/l 0·3 0·7 mmol/l 0·3 HDL
FG 5·4 mmol/l 0·6 6·3 mmol/l 0·6
Ziaee et al., 2006(49) Iran 81 51 22·7 20–35 Cohort HDL 40 mg/dl 9·9 36·4 mg/dl 8·4 FG and HDL 4
(SD 2·3) TAG 66·6 mg/dl 35·7 69·7 mg/dl 4 decreased
FG 76·6 mg/dl 7·5 69·2 mg/dl 5·7 significantly; No
significant change in
TAG
Aksungar et al., Turkey 40 50 20–39 Case–control HDL Male: 88·64 mg/dl 44·49 Male: 91·64 mg/dl 67·89 HDL levels significantly 4
2007(50) Female: 69·44 mg/dl 26·98 Female: 64·88 mg/dl 35·13 increased in females
TAG Male: 46·82 mg/dl 7·69 Male: 50·67 mg/dl 7·07
Female: 48·51 mg/dl 11·68 Female: 56·46 mg/dl 8·07
Furuncuoglu et al., Turkey 39 17·9 28 Prospective HDL 45·7 mg/dl 43·9 mg/dl TAG and FG 4
2007(51) (SD 8·18) observational* TAG 110 mg/dl 94 mg/dl decreased
FG 83·9 mg/dl 73·6 mg/dl significantly; HDL did
not change
Downloaded from https://www.cambridge.org/core. IP address: 46.4.80.155, on 13 Feb 2021 at 06:52:08, subject to the Cambridge Core terms of use, available at https://www.cambridge.org/core/terms. https://doi.org/10.1017/S000711451900254XTable 1. Continued
Sample size Age (years) Before Ramadan† End of Ramadan† Results (after Total
Study, publication Examined Ramadan month quality
year Country n % Male Mean Range Study design markers Mean SD Mean SD compared with before) score
(52)
Mansi, 2007 Jordan 70 NR 21 Cohort HDL 36·13 mg/dl 6·42 48·86 mg/dl 12·34 SBP significantly 2
(SD 1·6) TAG 148·54 mg/dl 54·72 139·36 mg/dl 52·29 decreased; HDL
FG 94·32 mg/dl 6·23 85·84 mg/dl 6·43 significantly
SBP 126·32 mmHg 17·46 112·4 mmHg 15 increased
Mansi & Amneh, Jordan 42 100 21·3 Prospective HDL 36·13 mg/dl 6·42 48·86 mg/dl 12·34 SBP significantly 4
2007(53) (SD 1·6) observational* TAG 148·54 mg/dl 54·72 139·36 mg/dl 52·29 decreased; HDL
FG 88·4 mg/dl 9 62·9 mg/dl 7·7 significantly
SBP 126·32 mmHg 17·46 112·41 mmHg 15 increased
Salehi & Neghab, Iran 28 100 23·4 20–26 Prospective TAG 195 mg/dl 31 197 mg/dl 19 Mean FG significantly 4
2007(54) observational* FG 81 mg/dl 23 69 mg/dl 8 decreased
Shariatpanahi et al., Iran 55 100 34·1 34–61 Prospective WC 94·81 cm 7·8 91·98 cm 7·7 HDL significantly 4
2008(55) (SD 8·9) observational* HDL 42·87 mg/dl 5·45 46·24 mg/dl 5·5 increased; FG, WC
TAG 210 mg/dl 139·6 232·78 mg/dl 108·87 and SBP
Ramadan fasting and the metabolic syndrome
FG 89·45 mg/dl 28·79 81·21 mg/dl 17·84 significantly
SBP 115 mmHg 13·57 108·93 mmHg 11·57 decreased
Ibrahim et al., 2008(56) UAE 14 64 25–58 Prospective TAG 116·9 mg/dl 35·4 87·5 mg/dl 23·4 FG and TAG 4
observational* FG 109·3 mg/dl 6·6 96·4 mg/dl 11·4 significantly
decreased
Al Hourani et al., Jordan 57 0 21·6 18–29 Prospective HDL 59·3 mg/dl 9·5 62·3 mg/dl 14·6 No significant change 4
2009(57) (SD 4·14) observational* TAG 88·3 mg/dl 62·5 65·4 mg/dl 20·8 in HDL or TAG
Lamri-Senhadji et al., Algeria 46 48 24 Prospective HDL Male: 1·7 g/l 0·26 Male: 2·22 g/l 0·3 HDL was 1·4-fold 4
2009(58) (SD 3) Female: 2 g/l 0·42 Female: 2·7 g/l 0·2 higher in males and
TAG Male: 0·72 g/l 0·36 Male: 0·69 g/l 0·36 females
Female: 0·67 g/l 0·26 Female: 0·93 g/l 0·5
Sülü et al., 2010 (59)
Turkey 45 51·1 28·7 21–25 Prospective HDL 45 mg/dl 11·2 49·0 mg/dl 10·9 Significant increase in 4
observational* TAG 142·9 mg/dl 61·1 105·8 mg/dl 57·1 FG and HDL;
FG 85·6 mg/dl 7·2 92·8 mg/dl 7·1 Significant decrease
in TAG
Norouzy et al., Iran 240 66 40 18–70 Prospective WC 92·07 cm 11·1 90·71 cm 10·94 Significant reduction in 4
2010(60) cohort WC
Barkia et al., 2011(61) Tunisia 25 76 42 22–55 Prospective HDL 1·0 mmol/l 0·2 1·0 mmol/l 0·3 No significant change 4
observational* TAG 1·1 mmol/l 0·5 1·1 mmol/l 0·3 in WC, TAG, HDL,
FG 4·7 mmol/l 0·8 4·9 mmol/l 0·9 SBP or FG
Mohammed, 2011(62) Iraq 56 100 48·4 Prospective HDL 0·8 mmol/l 0·2 0·9 mmol/l 0·7 Significant increase in 4
(SD 7·15) TAG 1·6 mmol/l 0·4 0·9 mmol/l 0·7 HDL and decrease
FG 5·3 mmol/l 0·15 4·2 mmol/l 0·3 in TAG
Ünalacak et al., Turkey 20 100 27·4 Cross-sectional HDL Obese: 43 mg/dl 10 Obese: 43 mg/dl 6 Significant decrease in 4
2011(63) (SD 5·2) Normal: 45 mg/dl 5 Normal: 45 mg/dl 4 FG in obese group;
TAG Obese: 151 mg/dl 41 Obese: 129 mg/dl 39 SBP and TAG
Normal: 120 mg/dl 59 Normal: 93 mg/dl 53 significantly reduced
FG Obese: 97·2 mg/dl 13·5 Obese: 93 mg/dl 7 in obese and non-
Normal: 90·5 mg/dl 6·6 Normal: 89·2 mg/dl 5 obese groups
SBP Obese: 120 mmHg 8 Obese: 114 mmHg 8
Normal: 118 mmHg 8 Normal: 112 mmHg 8
Faris et al., 2012 (18)
Jordan 50 42 32·7 18–51 Cross-sectional WC 83·62 cm 11·17 82·69 cm 10·34 SBP significantly 4
(SD 9·5) SBP 112·3 mmHg 10·01 104·4 mmHg 9·07 decreased
7
Downloaded from https://www.cambridge.org/core. IP address: 46.4.80.155, on 13 Feb 2021 at 06:52:08, subject to the Cambridge Core terms of use, available at https://www.cambridge.org/core/terms. https://doi.org/10.1017/S000711451900254X8
Table 1. Continued
Sample size Age (years) Before Ramadan† End of Ramadan† Results (after Total
Study, publication Examined Ramadan month quality
year Country n % Male Mean Range Study design markers Mean SD Mean SD compared with before) score
Shehab et al., 2012 (64)
UAE 60 65 43·2 Prospective WC Male: 96·9 cm 10·9 Male: 94·5 cm 11·1 Significant and 4
(SD 9·4) observational* beneficial change in
Female: 79·6 cm 14·9 Female: 77·2 cm 15·1 SBP, WC, TAG and
HDL Male: 0·8 mmol/l 0·2 Male: 0·8 mmol/l 0·3 HDL
Female: 0·9 mmol/l 0·4 Female: 0·9 mmol/l 0·4
TAG Male: 1·2 mmol/l 1 Male: 1·1 mmol/l 1
Female: 0·7 mmol/l 0·5 Female: 1·2 mmol/l 1·2
SBP Male: 124·1 mmHg 14·6 Male: 120·8 mmHg 13·8
Female: 12·3 Female: 113·5 mmHg 11·2
117·6 mmHg
Sayedda et al., India 20 100 24·65 19–32 Prospective WC 84·25 cm 5·44 82·15 cm 6·09 WC significantly 4
2013(65) (SD 4·4) observational* decreased
Agoumi et al., 2013 (66)
Spain 55 40 18–70 Cohort WC 101·63 cm 12·0 99·36 cm 11·24 WC decreased 4
Bahijri et al., 2013(67) Saudi 23 78 23·1 Prospective HDL 1·2 mmol/l 0·05 1·1 mmol/l 0·03 Statistically significant 4
Arabia (SD 1·2) observational* TAG 0·85 mmol/l 0·12 121 mmol/l 0·11 decrease in HDL
FG 5·33 mmol/l 0·07 5·62 mmol/l 0·11
Haouari-Oukerro Tunisia 38 100 20·8 18–23 Prospective HDL 1·16 mmol/l 0·05 1·39 mmol/l 0·08 Significant increase in 4
et al., 2013(68) (SD 1) observational* TAG 0·97 mmol/l 0·03 0·78 mmol/l 0·03 HDL; significant
M. A.-I. E. Faris et al.
FG 4·94 mmol/l 0·11 4·55 mmol/l 0·39 decrease in FG
Hosseini et al., Iran 11 0 20–45 Semi- FG 87·2 mg/dl 5·1 83·3 mg/dl 7·9 No significant change 4
2013(69) experimental in FG
Akrami et al., 2013(70) Iran 58 NR 20–40 Prospective HDL 52·1 mg/dl 4·64 50·85 mg/dl 5·96 Significant difference in 2
observational* TAG 151·55 mg/dl 94·6 125·6 mg/dl 64·8 FG and TAG levels
FG 122·25 mg/dl 55 110·75 mg/dl 40·04
Norouzy et al., Iran 240 66 40·1 18–70 Prospective WCTable 1. Continued
Sample size Age (years) Before Ramadan† End of Ramadan† Results (after Total
Study, publication Examined Ramadan month quality
year Country n % Male Mean Range Study design markers Mean SD Mean SD compared with before) score
Akaberi et al., 2014 (75)
Iran 43 51·2 20–40 Prospective HDL 33·10 mg/dl 6·53 42·49 mg/dl 8·44 HDL increased 4
observational TAG 113·33 mg/dl 49·74 111·87 mg/dl 59·55 significantly
Akhtaruzzaman et al., Bangladesh 28 0 25–80 Prospective HDL 38·75 mg/dl 1·01 41·14 mg/dl 1·02 HDL significantly 4
2014(76) observational* TAG 119·61 mg/dl 3·6 121·93 mg/dl 3·93 increased
AlNahari & Kouja, Saudi 26 100 NR Prospective HDL 1·1 mmol/l 0·04 1·12 mmol/l 0·03 Significant decrease in 2
2014(77) Arabia observational* TAG 1·12 mmol/l 0·08 1·37 mmol/l 0·08 FG; Significant
FG 5·57 mmol/l 0·07 5·23 mmol/l 0·15 increase in TAG
Celik et al., 2014(78) Turkey 42 100 35 Prospective WC 95·4 cm 11·9 94·3 cm 11·4 Significant reduction in 4
(SD 8·9) observational* HDL 1·09 mmol/l 0·19 1·1 mmol/l 0·19 WC and increase in
TAG 1·38 mmol/l 0·79 1·31 mmol/l 0·72 FG
FG 74·2 mg/dl 12·67 84·2 mg/dl 10·71
Feizollahzadeh et al., Iran 70 100 47·88 30–70 Prospective HDL 57·74 mg/dl 9·7 57·88 mg/dl 8·62 Significant increase in 4
2014(79) observational* TAG 139·85 mg/dl 89·31 165·14 mg/dl 84·96 FG and TAG
Ramadan fasting and the metabolic syndrome
FG 96·7 mg/dl 17·29 106·6 mg/dl 24·7
Hassan & Isawumi, Nigeria 60 60 42·3 Prospective WC 87·2 cm 12·387 81·78 cm 11·65 Significant decline in 4
2014(80) (SD 16·7) observational* WC
Ismail & Haron, Malaysia 31 NR NR Randomised trial HDL 1·07 mmol/l 0·204 1·17 mmol/l 0·28 TAG decreased 2
2014(81) TAG 1·34 mmol/l 0·9 1·04 mmol/l 0·45 significantly; HDL
increased
significantly
McNeil et al., 2014(82) Canada 20 NR 20–35 Prospective WC Normal weight: 6·3 Normal weight: 7·8 TAG increased 2
observational* 82·6 cm 83·3 cm significantly; FG
Obese: 113·3 cm 10·8 Obese: 111·9 cm 11·2 decreased
HDL Normal weight: 0·21 Normal weight: 0·21 significantly
1·19 mmol/l 1·17 mmol/l
Obese: 1·01 mmol/l 0·17 Obese: 1·10 mmol/l 0·17
TAG Normal weight: 0·46 Normal weight: 0·16
0·96 mmol/l 0·77 mmol/l
Obese: 1·65 mmol/l 1·10 Obese: 1·35 mmol/l 0·83
FG Normal weight: 0·3 Normal weight: 0·3
4·6 mmol/l 4·8 mmol/l
Obese: 5·0 mmol/l 0·7 Obese: 5·2 mmol/l 0·5
Salahuddin & Javed, India 30 NR 35–65 Case–control SBP 121 mmHg 2·1 121 mmHg 0·7 No significant change 2
2014(83) in SBP
Pathan & Patil, India 39 100 25–35 Prospective HDL 50·63 mg/dl 2·35 59·80 mg/dl 3·47 HDL significantly 4
2015(84) observational* TAG 89·00 mg/dl 17·43 82·00 mg/dl 15·9 increased; TAG
significantly
decreased
Ara et al., 2015(85) India 60 100 24–28 Prospective HDL 47·7 mg/dl 0·51 54·97 mg/dl 0·44 HDL significantly 4
observational increased
Hosseini & Hejazi, Iran 25 52 NR Quasi- HDL Male: 37·9 mg/dl 3·9 Male: 38·9 mg/dl 3·7 No significant change 2
2015(86) experimental Female: 41·58 mg/dl 6·08 Female: 37·45 mg/dl 4·39 in HDL, TAG or FG
TAG Male: 97·1 mg/dl 57·4 Male: 107·3 mg/dl 52·5
Female: 88·54 mg/dl 52·58 Female: 112·6 mg/dl 56·39
FG Male: 88·3 mg/dl 6·3 Male: 84·4 mg/dl 7·5
Female: 77·16 mg/dl 6·88 Female: 91·9 mg/dl 10·03
López-Bueno et al., Spain 62 0 33·6 18–61 Longitudinal WC 90·1 cm 12·42 89·4 cm 12·4 No significant changes 4
2015(87) (SD 12·7) in WC
9
Downloaded from https://www.cambridge.org/core. IP address: 46.4.80.155, on 13 Feb 2021 at 06:52:08, subject to the Cambridge Core terms of use, available at https://www.cambridge.org/core/terms. https://doi.org/10.1017/S000711451900254X10
Table 1. Continued
Sample size Age (years) Before Ramadan† End of Ramadan† Results (after Total
Study, publication Examined Ramadan month quality
year Country n % Male Mean Range Study design markers Mean SD Mean SD compared with before) score
Shahsavan et al., Iran 89 57 34·97 20–50 Prospective HDL 42·76 mg/dl 7·94 41·53 mg/dl 6·98 Substantial decline in 4
2015(88) observational* TAG 123·07 mg/dl 133·96 mg/dl HDL
SPB 116·4 mmHg 11 115·5 mmHg 10·1
Suriani et al., 2015(89) Malaysia 84 0 39·8 Prospective HDL 49·03 mg/dl 13·9 34·36 mg/dl 11·97 HDL, TAG and FG 4
(SD 10·3) observational* TAG 0·99 mmol/l 0·4 0·89 mmol/l 0·31 significantly reduced
FG 4·42 mmol/l 0·87 4·24 mmol/l 0·79
SBP 124·51 mmHg 18·14 123·27 mmHg 16·14
Babaei et al., 2016(90) Iran 36 100 39·11 Quasi- HDL 51·78 mg/dl 12·27 49·81 mg/dl 12·14 Significant reduction in 4
(SD 8·6) experimental TAG 162·72 mg/dl 94·23 144·22 mg/dl 67·06 mean FG and TAG
FG 75·78 mg/dl 8·46 80·06 mg/dl 9·26
BaHammam et al., Saudi 80 100 26·6 20–35 Prospective FG 5·7mmol/l 0·4 5·8 mmol/l 0·5 No significant changes 4
2016(91) Arabia (SD 4·9) observational* in FG
Esmaeilzadeh & Belgium 14 100 42·4 Prospective HDL 51·8 mg/dl 4·2 47·5 mg/dl 3·2 SBP decreased 4
Borne, 2016(92) (SD 1·5) case–control TAG 106·2 mg/dl 20 119·6 mg/dl 30·4 significantly; FG
FG 85·6 mg/dl 1·3 93·4 mg/dl 2·5 increased
SBP 117 mmHg 3 104·3 mmHg 2·8 significantly
Ganjali et al., 2016(93) Iran 45 58 37·6 25–58 Quasi- HDL Obese: 37·2 mg/dl 8·8 Obese: 41 mg/dl 6·1 FG significantly 4
(SD 6·9) experimental Normal: 39·1 mg/dl 8·7 Normal: 40·1 mg/dl 7·9 decreased in the
M. A.-I. E. Faris et al.
TAG Obese: 263 mg/dl 193·6 Obese: 255 mg/dl 177·4 normal weight group;
Normal: 190 mg/dl 131·2 Normal: 163 mg/dl 97 HDL significantly
FG Obese: 98·86 mg/dl 18·68 Obese: 93·68 mg/dl 11·66 increased in the
Normal: 94·6 mg/dl 11·17 Normal: 85·69 mg/dl 7·32 obese group
Sezen et al., 2016(94) Turkey 70 100 37 Prospective SBP 120·2 mmHg 11·6 121·2 mmHg 10·2 No significant changes 4
(SD 7) in SBP
Kiyani et al., 2017 (95)
Pakistan 80 62·5 20·5 18–24 Prospective HDL 1·2 mmol/l 0·3 1·1 mmol/l 0·3 Significant decline in 4
observational* TAG 1·4 mmol/l 0·5 1·2 mmol/l 0·5 FG and TAG;
FG 72·6 mg/dl 12·5 57·9 mg/dl 10·7 Significant reduction
in HDL
AbdulKareem et al., Iraq 12 25 37·5 24–57 Case–control HDL 49·58 mg/dl 2·96 53·25 mg/dl 2·496 Significant decrease in 4
2017(96) (SD 10·8) TAG 92 mg/dl 10·83 94·83 mg/dl 9·67 FG and significant
FG 86·25 mg/dl 4·06 63·17 mg/dl 2·51 increase in HDL and
TAG (healthy
subjects)
Alsubheen et al., Canada 9 100 32·2 Prospective SBP 120 mmHg 11 109 mmHg 12 Significant decrease in 4
2017(97) (SD 7·8) observational* SBP
Bakki et al., 2017(98) Nigeria 75 62·6 25 18–30 Cross-sectional HDL 1·4 mmol/l 0·3 1·3 mmol/l 0·2 No significant changes 4
(SD 2) TAG 1·2 mmol/l 0·4 1·2 mmol/l 0·3 in TAG Significant
FG 4·0 mmol/l 0·5 4·7 mmol/l 0·9 increase in HDL
Slight significant
increase in FG
Khan et al., 2017(99) Pakistan 35 51 21·66 21–23 Prospective WC 79·9 cm 10·18 79·74 cm 10·33 Mean HDL decreased 4
(SD 0·7) observational* HDL 55·88 mg/dl 13·73 49·82 mg/dl 10·09 significantly
TAG 87·76 mg/dl 37·87 79·82 mg/dl 34·54
FG 88·79 mg/dl 9·1 87·2 mg/dl 6·35
SBP 113·08 mmHg 10·52 113·56 mmHg 9·5
Malekmakan et al., Iran 93 52·7 37·2 25–57 Semi- WC 89·1 cm 11·1 87·5 cm 11·1 WC and SBP 4
2017(100) (SD 7·9) experimental SBP 101·7 mmHg 12·9 99·4 mmHg 12·7 significantly
study decreased
Downloaded from https://www.cambridge.org/core. IP address: 46.4.80.155, on 13 Feb 2021 at 06:52:08, subject to the Cambridge Core terms of use, available at https://www.cambridge.org/core/terms. https://doi.org/10.1017/S000711451900254XTable 1. Continued
Sample size Age (years) Before Ramadan† End of Ramadan† Results (after Total
Study, publication Examined Ramadan month quality
year Country n % Male Mean Range Study design markers Mean SD Mean SD compared with before) score
Norouzy et al., Iran 12 50 54·6 Prospective SBP 119·5 mmHg 6 117·6 mmHg 9 No significant 4
2017(101) (SD 4) observational difference in SBP
Ongsara et al., Thailand 65 32 20·82 19–24 Prospective WC Male: 79·83 cm 12·4 Male: 76·5 cm 10·84 No significant changes 4
2017(102) (SD 1·1) observational Female: 63·45 cm 6·66 Female: 65·44 cm 7 in WC, BP, TAG or
HDL Male: 1·26 mmol/l 0·24 Male: 1·42 mmol/l 0·3 HDL for either sex
Female: 1·47 mmol/l 0·33 Female: 1·51 mmol/l 0·35
TAG Male: 0·92 mmol/l 0·36 Male: 1·02 mmol/l 0·3
Female: 0·83 mmol/l 0·28 Female: 0·79 mmol/l 0·28
FG Male: 5·34 mmol/l 0·51 Male: 5·27 mmol/l 0·41
Ramadan fasting and the metabolic syndrome
Female: 4·83 mmol/l 0·38 Female: 4·9 mmol/l 0·41
SBP Male: 126·76 mmHg 15·38 Male: 126·95 mmHg 14·54
Female: 7·05 Female: 9·86
107·14 mmHg 107·36 mmHg
Mohammadzade Iran 30 100 29·44 20–35 Prospective WC 96·48 cm 11·38 95·31 cm 10·62 No significant change 4
et al., 2017(103) (SD 7·4) observational HDL 33·83 mg/dl 8·53 47·59 mg/dl 6·7 in SBP; significantly
TAG 152·55 mg/dl 64·35 123·83 mg/dl 53·44 decreased TAG and
FG 98·58 mg/dl 7·04 81 mg/dl 4·97 FG;·significantly
SBP 124·7 mmHg 4 121·6 mmHg 6 increased HDL
Abubakar et al., Pakistan 60 NR 34·3 Prospective HDL 1·08 mmol/l 0·35 1·11 mmol/l 0·39 No significant change 2
2018(104) (SD 8·6) observational* TAG 1·33 mmol/l 0·75 1·45 mmol/l 0·99 in TAG, HDL or FG
FG 5·58 mmol/l 1·17 5·61 mmol/l 0·97
Al-Barha & Aljaloud, Saudi 44 100 27·7 18–39 Quasi- WC 82·9 cm 10·9 81·8 cm 10·5 FG and SBP were 4
2018(105) Arabia (SD 5·8) experimental FG 74·60 mg/dl 81·52 mg/dl slightly but
before/after SBP 109·6 mmHg 9 111·8 mmHg 10·8 significantly elevated
study
Nachvak et al., Iran 152 100 39·35 21–63 Observational HDL 44·70 mg/dl 7·9 45·59 mg/dl 9 HDL levels increased 4
2018(19) (SD 11) TAG 151·44 mg/dl 85·2 140·44 mg/dl 75·2 significantly;
FG 80·17 mg/dl 19·3 72·06 mg/dl 8·4 significant decrease
in TAG and FG
Prasetya & Thailand 27 100 24·3 19–40 Prospective WC 81·82 cm 7·73 78·82 cm 7·96 Reductions in WC and 4
Sepwarobol, (SD 3·7) observational* HDL 52·84 mg/dl 13·2 48·89 mg/dl 11·91 HDL; no significant
2018(106) TAG 90·59 mg/dl 62·43 77·37 mg/dl 50·14 change in FG
FG 4·83 mmol/l 0·36 4·87 mmol/l 0·35
Rahbar et al., Iran 34 100 35 16–64 Prospective WC 91·97 cm 11·71 91·45 cm 11·59 WC and TAG 4
2019(107) (SD 11) observational* HDL 43·79 mg/dl 5·49 48·38 mg/dl 9·39 significantly
TAG 143·56 mg/dl 47·64 120·33 mg/dl 42·67 decreased; HDL
levels significantly
increased
FG, fasting plasma/serum glucose; NR, not reported; SBP, systolic blood pressure; UAE, United Arab Emirates; WC, waist circumference.
* Not reported by the study authors.
† Results are transcribed from the original papers as reported. To convert from mg/dl to mmol/l, divide by 18. To convert mmol/l to mg/dl, multiply by 18.
11
Downloaded from https://www.cambridge.org/core. IP address: 46.4.80.155, on 13 Feb 2021 at 06:52:08, subject to the Cambridge Core terms of use, available at https://www.cambridge.org/core/terms. https://doi.org/10.1017/S000711451900254XDownloaded from https://www.cambridge.org/core. IP address: 46.4.80.155, on 13 Feb 2021 at 06:52:08, subject to the Cambridge Core terms of use, available at https://www.cambridge.org/core/terms. https://doi.org/10.1017/S000711451900254X
12 M. A.-I. E. Faris et al.
Table 2. Characteristics and pooled analyses of included studies for each metabolic syndrome component
Number of Mean age Overall % Fasting time
Component K* N† countries (years) male (min/d) Hedges’ g 95 % CI
WC 24 1557 14 31·5 58·7 841 −0·312 −0·387, −0·236
FG 51 2318 19 30·3 66 817 −0·101 −0·260, 0·004
TAG 63 2862 21 31 67 820 −0·088 −0·171, −0·004
HDL 57 2771 19 31·5 66 830 0·150 0·064, 0·236
SBP 22 1172 13 33 63 876 −0·239 −0·372, −0·106
FG, fasting plasma glucose; SBP, systolic blood pressure; WC, waist circumference.
* K: denotes number of studies.
† N: denotes number of participants.
Fig. 2. According to Hedges’ g value with 95 % CI, small (−0·312) significant reduction in waist circumference was induced by Ramadan fasting. Heterogeneity
statistics: 95 % CI −0·387, −0·236, I 2 = 49 %. Hedges’ g value is considered small when value = 0·2, medium = 0·5, large = 0·8.
more studies were available to explore differences in findings Fasting glucose
among countries (Table 4).
Age ( β = 0·005, P = 0·05; online Supplementary Fig. S10) and
fasting time/d (β = −0·001, P = 0·001; online Supplementary
Fig. S11) had significant impacts as moderators for changes in
Waist circumference
FG, whereas sex had no significant impact on FG changes during
Age (online Supplementary Fig. S6) and fasting time/d (online Ramadan fasting (online Supplementary Fig. S12). Six countries
Supplementary Fig. S7) were NS moderators for changes in contributed three or more studies that measured FG changes
WC. However, sex was significant in explaining variation during Ramadan month (online Supplementary Fig. S13):
in WC (β = −0·20, P = 0·03) (online Supplementary Fig. S8), Iran (K = 15, N 828, Hedges’ g = −0·173, 95 % CI −0·348,
suggesting that women experienced a larger change in WC than 0·002, I2 = 81·93 %), Saudi Arabia (K = 5, N 218, Hedges’
men during RDIF. Only Iran contributed three or more studies g = 0·075, 95 % CI −0·240, 0·390, I2 = 80·41 %), Turkey (K = 4,
that measured WC change during RDIF (K = 7, N 783): N 146, Hedges’ g = −0·069, 95 % CI −0·735, 0·596,
Hedges’ g = −0·275, 95 % CI −0·346, −0·204, I2 = 0·0 %; online I2 = 93·05 %), Tunisia (K = 4, N 109, Hedges’ g = 0·180, 95 %
Supplementary Fig. S9). CI −0·271, 0·630, I2 = 81·6 %), Jordan (K = 3, N 186, Hedges’Downloaded from https://www.cambridge.org/core. IP address: 46.4.80.155, on 13 Feb 2021 at 06:52:08, subject to the Cambridge Core terms of use, available at https://www.cambridge.org/core/terms. https://doi.org/10.1017/S000711451900254X
Ramadan fasting and the metabolic syndrome 13
Fig. 3. According to Hedges’ g value with 95 % CI, small (−0·101) significant reduction in fasting glucose was induced by Ramadan fasting. Heterogeneity statistics:
95 % CI −0·206, 0·004, I 2 = 26·6 %. Hedges’ g value is considered small when value = 0·2, medium = 0·5, large = 0·8.
g = −0·239, 95 % CI −0·383, −0·095, I2 = 0·0 %) and Pakistan in TAG than men during Ramadan month and that longer fasting
(K = 3, N 175, Hedges’ g = −0·215, 95 % CI −0·494, 0·064, time/d was associated with a greater reduction in TAG at the end
I2 = 69·8 %). of Ramadan. Six countries contributed three or more studies that
measured TAG change during RDIF (online Supplementary
Fig. S17): Iran (K = 20, N 1156, Hedges’ g = −0·073, 95 %
TAG
CI −0·204, 0·058, I2 = 78·7 %), Turkey (K = 6, N 210, Hedges’
Sex (β = −0·14, P = 0·01; online Supplementary Fig. S14) and g = −0·229, 95 % CI −0·458, 0·001, I2 = 63·4 %), Jordan (K = 4,
fasting time/d (β = −0·005, P = 0·01; online Supplementary N 243, Hedges’ g = −0·244, 95 % CI −0·370, −0·117, I2 = 0·0 %),
Fig. S15) had significant impacts as moderators for changes in Tunisia (K = 4, N 109, Hedges’ g = −0·116, 95 % CI −0·706,
TAG during RDIF, but age (online Supplementary Fig. S16) 0·473, I2 85·6 %), Pakistan (K = 3, N 175, Hedges’ g = −0·212,
had no significant impact on TAG changes (Table 3). These 95 % CI −0·591, 0·168, I2 = 83·5 %) and Saudi Arabia (K = 3,
findings suggested that women experienced a larger change N 94, Hedges’ g = 0·269, 95 % CI −0·366, 0·905, I2 = 88·5 %).Downloaded from https://www.cambridge.org/core. IP address: 46.4.80.155, on 13 Feb 2021 at 06:52:08, subject to the Cambridge Core terms of use, available at https://www.cambridge.org/core/terms. https://doi.org/10.1017/S000711451900254X
14 M. A.-I. E. Faris et al.
Fig. 4. According to Hedges’ g value with 95 % CI, small (−0·088) significant reduction in serum TAG was induced by Ramadan fasting. Heterogeneity statistics: 95 % CI
−0·171, −0·004, I 2 = 78 %. Hedges’ g value is considered small when value = 0·2, medium = 0·5, large = 0·8.
HDL-cholesterol Jordan (K = 4, N 243, Hedges’ g = 0·137, 95 % CI −0·124,
0·397, I2 = 76·1 %), Pakistan (K = 3, N 175, Hedges’ g = −0·142,
Age (online Supplementary Fig. S18) and fasting time/d
95 % CI −0·411, 0·126, I2 = 67·6 %) and Saudi Arabia (K = 3,
(online Supplementary Fig. S19) were NS moderators for
N 94, Hedges’ g = −0·019, 95 % CI −0·655, 0·617, I2 = 88·5 %).
RDIF-induced changes in HDL. However, sex was significant
in explaining the variation in HDL (β = 0·15, P = 0·005; online
Supplementary Fig. S20), which suggested that men experi-
Systolic blood pressure
enced larger changes in HDL than women during Ramadan
month. Five countries contributed three or more studies that Age, sex and fasting time had no significant impact on SBP
measured HDL changes during Ramadan month (online changes during RDIF (online Supplementary Figs. S22–S24).
Supplementary Fig. S21): Iran (K = 19, N 1165, Hedges’ Two countries contributed three or more studies that measured
g = 0·135, 95 % CI 0·002, 0·268, I2 = 79·4 %), Turkey (K = 6, SBP changes during RDIF (online Supplementary Fig. S25):
N 210, Hedges’ g = 0·244, 95 % CI −0·087, 0·574, I2 = 80·4 %), Iran (K = 7, N 522, Hedges’ g = −0·226, 95 % CI −0·313,Downloaded from https://www.cambridge.org/core. IP address: 46.4.80.155, on 13 Feb 2021 at 06:52:08, subject to the Cambridge Core terms of use, available at https://www.cambridge.org/core/terms. https://doi.org/10.1017/S000711451900254X
Ramadan fasting and the metabolic syndrome 15
Fig. 5. According to Hedges’ g value with 95 % CI, small (0·150) significant increment in serum HDL-cholesterol was induced by Ramadan fasting. Heterogeneity sta-
tistics: 95 % CI 0·0640, 0·236, I 2 = 79 %. Hedges’ g value is considered small when value = 0·2, medium = 0·5, large = 0·8.
−0·138, I2 = 0·0 %) and Jordan (K = 3, N 162, Hedges’ g = −0·342, It is worth to emphasise that subjects included in the present
95 % CI −0·501, −0·183, I2 = 0·0 %). analysis were normal, not patients. We excluded those studies
on patients during Ramadan month, as shown in the exclusion
section and depicted in Fig. 1 of Preferred Reporting Items for
Discussion
Systematic Reviews and Meta-Analyses. It is well-known and
This systematic review and meta-analysis was the first to commonly seen that elderly Muslim people are very keen to fast
clarify the impact of RDIF on the cluster of the MetS components. during Ramadan, even those who are patients and excused not
We found that RDIF incurred small significant improvements in to observe Ramadan fasting(110). Providing that the authors of the
the MetS components; namely, decreased WC, TAG, FG, and used articles did not mention that elderly people interrupted
SBP and increased HDL. their fasting during Ramadan, we cannot assume that fastingDownloaded from https://www.cambridge.org/core. IP address: 46.4.80.155, on 13 Feb 2021 at 06:52:08, subject to the Cambridge Core terms of use, available at https://www.cambridge.org/core/terms. https://doi.org/10.1017/S000711451900254X
16 M. A.-I. E. Faris et al.
Table 3. Overall Hedges’ g values for the metabolic syndrome components and statistical values for the three moderators
(age, sex and fasting time) at the end of Ramadan
Moderators
Overall Fasting
Component K* N† I 2‡ τ 2§ Hedges’ g 95 % CI Age Sex (% Male) time/d
WC 24 1557 49 % P = 0·001 −0·32 −0·39, −0·24 β = −0·002, β = −0·20, β = −0·001,
P = 0·78 P = 0·03 P = 0·08
FG 51 2318 26·6 % P = 0·001 −0·10 −0·20, 0·004 β = 0·005, β = −0·10, β = −0·001,
P = 0·05 P = 0·08 P = 0·001
TAG 63 2862 78 % P = 0·04 −0·10 −0·12, 0·004 β = 0·0004, β = −0·14, β = −0·005,
P = 0·90 P = 0·01 P = 0·01
HDL 57 2771 79 % P = 0·001 0·15 0·07, 0·24 β = −0·0003, β = 0·15, β = −0·002,
P = 0·90 P = 0·005 P = 0·25
SBP 22 1172 78 % P = 0·001 −0·25 −0·38, −0·11 β = −0·015, β = −0·216, β = 0·00005,
P = 0·064 P = 0·20 P = 0·96
FG, fasting plasma glucose; SBP, systolic blood pressure; WC, waist circumference.
* K: denotes number of studies.
† N: denotes number of participants.
‡ I 2 statistic describes the percentage of variation across studies due to heterogeneity rather than chance(108).
§ In a random-effects meta-analysis, the extent of variation among the effects observed in different studies (between-study variance) is referred to as τ2(109).
Fig. 6. According to Hedges’ g value with 95 % CI, small (−0·239) significant reduction in systolic blood pressure was induced by Ramadan fasting. Heterogeneity
statistics: 95 % CI −0·372, −0·106, I 2 = 78 %. Hedges’ g value is considered small when value = 0·2, medium = 0·5, large = 0·8.
days were reduced. Further, it is expected that differences may beneficial effect on abdominal obesity, serum lipids, glucose
be existing in lipid profile changes between pre- and post- metabolism and BP levels; all of which are the MetS components
menopause women included in the present analysis, as and risk factors for the development of insulin resistance,
supported by the published literature(111,112). However, such diabetes and CVD. The beneficial impact of RDIF on health is
differences cannot be inferred from the present analysis and further reinforced by its ability to induce and activate antioxidant
need to be executed in a special sub-group analysis. and anti-inflammatory mechanisms(8,18).
The RDIF model is a widely known and well-studied model The small reduction in WC shown in our results was
of religion-based intermittent fasting. Intermittent fasting is consistent with (and may partially explain) the significant small
associated with improved human health(113–116). The results of RDIF-induced reduction in inflammatory markers including IL-6,
this meta-analysis expanded existing knowledge and confirmed TNF-α and hs-C-reactive protein and the oxidative stress
that practicing RDIF had positive health impacts. RDIF had a marker malondialdehyde shown in a recent meta-analysis(8).You can also read