Behavior of saline ice under cyclic flexural loading - The ...
←
→
Page content transcription
If your browser does not render page correctly, please read the page content below
The Cryosphere, 15, 2415–2428, 2021
https://doi.org/10.5194/tc-15-2415-2021
© Author(s) 2021. This work is distributed under
the Creative Commons Attribution 4.0 License.

Behavior of saline ice under cyclic flexural loading
Andrii Murdza1 , Erland M. Schulson1 , and Carl E. Renshaw1,2
1 Thayer   School of Engineering, Dartmouth College, Hanover, NH, 03755, USA
2 Department   of Earth Sciences, Dartmouth College, Hanover, NH, 03755, USA

Correspondence: Andrii Murdza (andrii.murdza@dartmouth.edu)

Received: 12 October 2020 – Discussion started: 1 December 2020
Revised: 20 April 2021 – Accepted: 21 April 2021 – Published: 26 May 2021

Abstract. New systematic experiments reveal that the flex-         cyclic loading from ocean swells that can penetrate deeply
ural strength of saline S2 columnar-grained ice loaded nor-        into an ice pack and potentially result in the breakup of the
mal to the columns can be increased upon cyclic loading by         ice cover (Squire, 2007). Such events, where under the ac-
about a factor of 1.5. The experiments were conducted using        tion of surface waves a floating ice cover exhibited sudden
reversed cyclic loading over ranges of frequencies from 0.1        breakup into smaller pieces, have been repeatedly witnessed
to 0.6 Hz and at a temperature of −10 ◦ C on saline ice of two     and described (Shackleton, 1982; Liu et al., 1988; Prinsen-
salinities: 3.0 ± 0.9 and 5.9 ± 0.6 ‰. Acoustic emission hit       berg and Peterson, 2011; Asplin et al., 2012; Collins et al.,
rate during cycling increases with an increase in stress ampli-    2015; Kohout et al., 2016; Hwang et al., 2017). Ice cover
tude of cycling. Flexural strength of saline ice of 3.0 ± 0.9 ‰    breakup leads to a decline in albedo (Pistone et al., 2014;
salinity appears to increase linearly with increasing stress       Zhang et al., 2019) and to the acceleration of melting. Also,
amplitude, similar to the behavior of laboratory-grown fresh-      smaller ice floes attenuate ocean waves less effectively than
water ice (Murdza et al., 2020b) and to the behavior of lake       does the parent solid ice cover, thereby endangering coastal
ice (Murdza et al., 2021). The flexural strength of saline ice     zones to erosion. Given the retreat of the sea ice cover and
of 5.9 ± 0.6 ‰ depends on the vertical location of the sample      the attendant increase in oceanic fetch, larger waves are ex-
within the thickness of an ice puck; i.e., the strength of the     pected to develop; correspondingly, the remaining ice cover
upper layers, which have a lower brine content, was found to       is expected to be subjected to episodes of greater cyclic load-
be as high as 3 times that of lower layers. The fatigue life of    ing. The potential for fatigue failure is thus increasing.
saline ice is erratic. Cyclic strengthening is attributed to the      Cyclic loading may also play an important role in other
development of an internal back stress that opposes the ap-        scenarios. For instance, during ice–structure interactions
plied stress and possibly originates from dislocation pileups.     (Jordaan, 2001; Hendrikse and Metrikine, 2016; O’Rourke
                                                                   et al., 2016; Jordaan et al., 2008) the structure itself, such
                                                                   as a lighthouse, may be weakened or damaged to a degree
                                                                   that depends on the strength of the ice. Other examples are
1   Introduction                                                   runways and roads that are built by freezing water on cold
                                                                   oceans, rivers, and lakes and subsequently subject to cyclic
Fatigue of materials is a subject of practical importance in en-   loading. Therefore, it is important to understand the behavior
gineering and has been widely studied (Bathias and Pineau,         of ice under cyclic loading.
2013; Broek, 1986; Schijve, 2009; Suresh, 1998). Fatigue              Currently, the effects of cyclic loading on the physical and
refers to changes in material properties resulting from cyclic     mechanical properties of sea ice and on the susceptibility
loading. Fatigue strength of crystalline materials is typically    of the material to fatigue are poorly constrained. Tabata and
controlled by microcrack initiation and subsequent growth          Nohguchi (1980) conducted experiments on sea ice sampled
that leads to failure.                                             from Lake Saroma, Hokkaido, Japan, and from Utqiaġvik,
   It is not surprising that fatigue appears to play an impor-     Alaska. They loaded the ice cyclically under uniaxial com-
tant role in sea ice mechanics. For example, the Arctic and        pression between two specified stress levels under a vari-
Antarctic floating ice covers and ice shelves are subjected to

Published by Copernicus Publications on behalf of the European Geosciences Union.
2416                                                     A. Murdza et al.: Behavior of saline ice under cyclic flexural loading

ety of combinations of strain rate (from 10−5 to 10−2 s−1 ),           Therefore, given that limited information about the be-
temperature (from −2 to −24 ◦ C) and orientation (horizon-          havior of sea/saline ice under cyclic loading and given the
tal and vertical). They found that with a decrease in average       discrepancy in behavior of fresh and sea/saline ice, we
stress and with a decrease in amplitude, the time to failure in-    conducted a study under controlled conditions in the lab-
creases; and by lowering the temperature, the time to failure       oratory on the flexural behavior of saline ice. In this pa-
and the number of cycles also increases.                            per, we describe the experiments in which beams of S2
   Other evidence of the weakening of sea ice under wave-           columnar-grained saline ice of two salinities (3.0 ± 0.9 and
driven in situ cyclic loading is discussed by Haskell et            5.9 ± 0.6 ‰) were subjected at −10 ◦ C to four-point, reverse
al. (1996), Bond and Langhorne (1997), Langhorne et                 cycling at ∼ 0.1–0.6 Hz and then, after several hundred or
al. (1998, 1999, 2001). In these works the authors obtained an      more cycles, were bent to failure, provided the beams did not
S–N fatigue curve (S, upper peak stress of cycling; N, num-         break during cycling. We chose the rate of cycling to simu-
ber of cycles imposed to failure), typical of curves obtained       late the vibration frequency of a natural sea ice cover (Collins
from engineering materials, i.e., for lower stress amplitude        et al., 2015).
more cycles are needed for failure. The authors stated that
the endurance limit, that is the stress amplitude below which
the sea ice can withstand an unlimited number of cycles, is         2     Experimental procedure
approximately one-half the failure stress of non-cycled ice.
                                                                    2.1    Ice growth and characterization
   The constitutive behavior of saline ice under cyclic loading
was also investigated previously (Cole, 1995, 1998; Cole et         We studied saline ice of two meltwater salinities: 3.0 ± 0.9
al., 1998, 2002; Cole and Dempsey, 2004; Cole and Durell,           and 5.9 ± 0.6 ppt, where ± sign indicates standard devia-
1995; Dempsey et al., 2003; Wei et al., 2020); specifically,        tion. We produced the ice in the laboratory in an 800 L
inelastic deformation of sea ice was explored and interpreted       circular polycarbonate tank in the manner described previ-
in terms of a dislocation-based mechanism. In these works           ously (Golding et al., 2014). Briefly, solutions containing
the authors investigated the effect of temperature (from −5         17.5 ± 0.2 ppt and 35 ± 0.2 ppt (parts per thousand, or ‰) of
to −50 ◦ C), microstructure (total porosity varied from 14          the commercial product “Instant Ocean” salt mixture were
to 104 ppt), cyclic stress amplitude (from 0.04 to 0.8 MPa),        prepared and then frozen unidirectionally downward over a
loading frequency (from 10−3 to 1 Hz), and dry isothermal           period of about 7 d by using a top-placed cold plate main-
vs floating specimens on the response of the ice. However,          tained at a temperature T = −20 ± 0.1 ◦ C. Before bringing
the strength of ice after it had been cycled was not measured.      the cold plate into contact with the salt-water solution, the
   Nothing more (to our knowledge) has been reported on the         top surface of the solution was seeded with freshwater ice
fatigue of sea ice. The topic is absent from a critical review      fragments of ∼ 0.3–1 mm in diameter. This procedure pro-
by Squire (2007) and from two recent books on ice (Schulson         duced pucks ∼ 1 m in diameter and ∼ 0.3 m thick. For prac-
and Duval, 2009; Weeks, 2010).                                      tical considerations, the bottom, skeletal layer of ice of about
   The behavior summarized above indicating the weaken-             7–10 cm was discarded as it was slushy and weak; we also
ing of ice under cyclic loading, obtained from experiments          believe that the skeletal layer does not play a significant role
conducted on saline and sea ice, might possibly account for         in supporting load. The top layer of ice of a few centimeters
the sudden breakup of natural ice covers. However, this be-         was also discarded because it was seeded and its grain size
havior appears in conflict with the behavior of freshwater          was considerably smaller and its microstructure thus differ-
ice under cyclic loading (Cole, 1990; Gupta et al., 1998;           ent from the rest of the ice puck. Meltwater salinity was mea-
Iliescu et al., 2017; Iliescu and Schulson, 2002; Murdza et         sured using a calibrated YSI Pro30 conductivity and salinity
al., 2019, 2020b, a). In those experiments, it was discov-          probe.
ered that the ice flexural strength increases upon repetitive          Figure 1 shows the microstructure of the ice. Table 1 lists
loading, followed by the recovery of the cyclic-induced in-         its density and the average grain size of the test specimens
crement in strength to the original non-cycled strength upon        described below. Figure 2 shows stereographic projections of
post-cycling annealing. This difference in the behavior of the      the orientation of the crystallographic c axes. The ice is char-
two kinds of ice could perhaps be attributed to the presence        acterized by columnar-shaped grains whose growth texture
of defects in sea/saline ice, such as brine pockets , brine chan-   is marked by c axes confined within about 15◦ of the hor-
nels and non-penetrating microcracks. Such defects serve as         izontal plane of the parent ice puck and randomly oriented
stress concentrators, thereby lessening the need to nucleate        within that plane. In other words, the ice is termed S2, after
cracks to the degree that fatigue life may be governed pri-         Michel and Ramseier (1971), and is similar to natural first-
marily by crack propagation. The strengthening of ice is of         year sea ice (for comparison, see Fig. 3.7 of Schulson and
more than scientific interest, reflected, perhaps in an interest-   Duval, 2009). The grain size noted above is the average di-
ing comment of an arctic engineer who reported that builders        ameter of the columnar-shaped grains, ranging from about 2
of ice roads never trust the ice until it had been “worked in”      to 7 mm in Fig. 1.
(Masterson, 2018).

The Cryosphere, 15, 2415–2428, 2021                                                    https://doi.org/10.5194/tc-15-2415-2021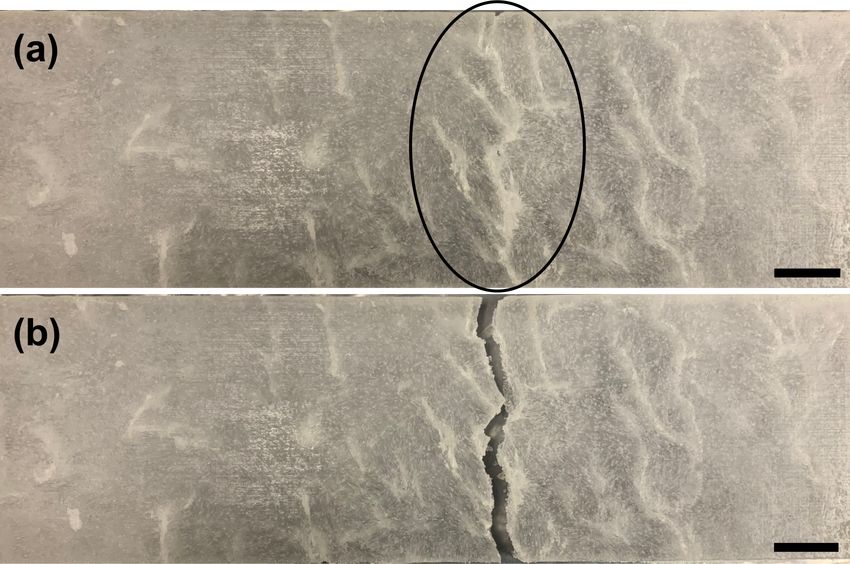
A. Murdza et al.: Behavior of saline ice under cyclic flexural loading                                                               2417

Table 1. Physical properties of as-grown saline ice.

                                                                      Density         Average          Grain
                                     Material                       (kg m−3 )    salinity (ppt)   size (mm)
                                     Saline ice (lower salinity)    878 ± 11         3.0 ± 0.9     3.8 ± 0.9
                                     Saline ice (higher salinity)   897 ± 10         5.9 ± 0.6     3.6 ± 1.1

                                                                           tinct linear whitish features which we took to be sets of in-
                                                                           terconnected brine pockets that could possibly be filled with
                                                                           very fine-grained ice. The ice of higher salinity possessed
                                                                           more of these features, especially near the bottom of the par-
                                                                           ent puck (which was the last part to solidify). Our sense is
                                                                           that these features served as stress concentrators, particularly
                                                                           ones that traversed the width of the test specimen (described
                                                                           below), thereby weakening the ice. Indeed, as will become
                                                                           apparent, samples obtained from near the bottom of a puck
                                                                           of higher salinity (5.9 ± 0.6 ppt) had relatively low flexural
                                                                           strength.
                                                                              Because the ice of both salinities exhibited a different ap-
                                                                           pearance from the top and bottom of the parent puck, in
                                                                           preparing test specimens for flexing we distinguished them
                                                                           by their position (depth from top surface) within the ice puck
                                                                           from which they were prepared, Table 2.

                                                                           2.3   Sample preparation and test setup

                                                                           Once the ice had been grown, it was cut into blocks of
                                                                           dimensions ∼ 10 × 30 × 20 cm3 , where the longest and the
                                                                           shortest dimensions are in the horizontal plane of the orig-
                                                                           inal ice puck, perpendicular to the direction of growth. The
                                                                           blocks were stored in a cooler (at −10 ± 0.5 ◦ C) on their side
                                                                           (such that columnar-shaped grains were oriented horizon-
                                                                           tally) to reduce brine drainage for periods of time of about
                                                                           1–10 weeks.
Figure 1. Photographs of a vertically oriented (a) and a horizon-             Specimens for flexing were manufactured from the ice
tally oriented (b) thin section (∼ 1 mm) of columnar-grained, saline       blocks in the form of thin beams of dimensions h ∼ 16 mm in
ice of lower salinity (3.0 ± 0.9 ppt) as viewed between crossed-           thickness (parallel to the long axis of the grains), b ∼ 85 mm
polarized filters; photographs of a vertically oriented (c) and a hor-     in width, and l ∼ 300 mm in length. The test specimens were
izontally oriented (d) thin section of saline ice of higher salinity
                                                                           allowed to equilibrate to the test temperature of −10 ± 0.5 ◦ C
(5.9 ± 0.6 ppt).
                                                                           for at least 24 h before testing.
                                                                              A detailed description of the specimens’ preparation and
                                                                           loading can be found elsewhere (Iliescu et al., 2017; Mur-
2.2   Growth features                                                      dza et al., 2018, 2019, 2020b). To summarize, the ice beams
                                                                           were flexed up and down under four-point loading under con-
The ice contained both sub-millimeter-sized brine pockets                  stant displacement rate using a servo-hydraulic loading sys-
and supra-millimeter-sized drainage channels, reminiscent of               tem (MTS model 810.14) to which we attached a custom-
natural sea ice. Figures 3 and 4 show examples. The ice of                 built four-point loading frame, Fig. 5. The hydraulic actua-
lower salinity (3.0 ± 0.9 ppt) had fewer defects of both kinds.            tor was driven up and down under displacement control with
Some of the ice of higher salinity (5.9 ± 0.6 ppt) possessed               the load limited in both directions. A load cell, calibrated for
channels whose size was almost as large as the grain diame-                both tension and compression, and a linear variable differen-
ter. The defects scattered light to the degree that in bulk form           tial transformer (LVDT) gauge were used for measurements
the ice had an overall opaque appearance. When observed in                 of load and displacement of the upper surface of the ice beam
thin section (∼ 1 mm) the ice exhibited to the naked eye dis-              during cycling.

https://doi.org/10.5194/tc-15-2415-2021                                                            The Cryosphere, 15, 2415–2428, 2021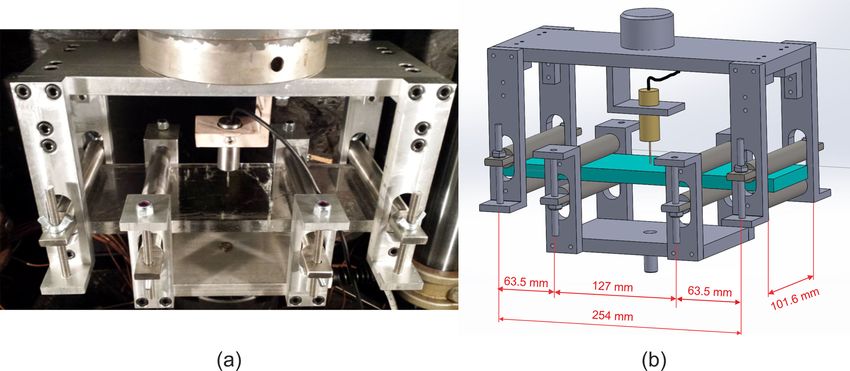
2418                                                         A. Murdza et al.: Behavior of saline ice under cyclic flexural loading

Figure 2. Stereographic projection plots of crystal c-axis {0001} orientations in saline ice of lower (3.0 ± 0.9 ppt) salinity (a) and saline ice
of higher (5.9 ± 0.6 ppt) salinity (b).

Figure 3. Photographs of saline ice samples of lower salinity (3.0 ± 0.9 ppt) from the top (a) and bottom (b) of an ice block and saline ice
samples of higher salinity (5.9 ± 0.6 ppt) from the top (c) and bottom (d) of an ice block. The concentration of whitish features along the
width of a sample in (d) is shown inside circles, which is a predominant place for a crack to initiate. The columnar grains run in and out of
the images. Scale bars: 20 mm.

   Acoustic emissions were recorded during cycling using a                 0.5 MPa s−1 , outer-fiber stress amplitude in the range from
PCI-2 18-bit A/D system; its frequency response was 3 kHz–                 0.35 to 1.2 MPa, outer-fiber strain amplitude in the range
3 MHz and its minimum acoustic emission (AE) amplitude                     from ∼ 1 to 5 × 10⁻⁴ , and frequencies in the range from 0.1
detection threshold was set to 45 dB. We used a micro 30STC                to 0.6 Hz (i.e., periods from ∼ 10 to 1.5 s). The period, as al-
sensor (9.5 mm diameter, 11 mm thickness), which was at-                   ready noted, is similar to the period of ocean swells (Collins
tached to the top surface of an ice beam with a rubber band.               et al., 2015). The major outer-fiber stress σf was calculated
Vacuum grease was used as the coupling agent between the                   from the relationship (the loading span is one-half of the sup-
sensor and the ice surface.                                                port span)
   The experiments were performed in a cold room at a
temperature of −10 ◦ C and at an outer-fiber center-point
displacement rate of 0.1 mm s−1 (or outer-fiber strain rate
of about 1.4 × 10⁻⁴ s−1 ). This displacement rate resulted                        3P L
in an outer-fiber stress rate in the range from ∼ 0.3 to                   σf =        ,                                                     (1)
                                                                                  4bh2

The Cryosphere, 15, 2415–2428, 2021                                                              https://doi.org/10.5194/tc-15-2415-2021
A. Murdza et al.: Behavior of saline ice under cyclic flexural loading 2419
Table 2. Flexural strength of non-cycled saline ice at −10 ◦ C and a displacement rate of 0.1 mm s−1 .
Flex strength of Flex strength of
ice of lower salinity Depth ice of higher salinity Depth
(3.0 ± 0.9 ppt) (MPa) (cm) (5.9 ± 0.6 ppt) (MPa) (cm)
1.08 – 0.45 20–22.5
0.86 – 0.53 17.5–20
1.06 – 0.62 12.5–15
0.96 – 0.98 7.5–10
0.83 17–21 1.17 5–7.5
0.75 13.5–17 1.26 5–7.5
1.08 10–13.5 1.26 2.5–5
0.97 6.5–10 1.44 1–2.5
1.09 3–6.5 1.17 –
Average Average
0.96 ± 0.13 0.98 ± 0.36
0.8, 0.85 MPa, and so on either until failure occurred or until
a specific value of stress amplitude set by the operator (see
Iliescu et al., 2017, and Murdza et al., 2018, for details). To
change stress amplitude the loading was stopped for ∼ 15 s to
change settings. After pre-conditioning, the specimens were
cyclically loaded according to Type I loading at least 300
times and generally for ∼ 2000 times, since no change in
strength was observed beyond a few hundred cycles (see be-
low).
Figure 6 shows measurements of load and of displace-
ment versus time at the beginning and near the end of cy-
cling before specimen failure of a lower-salinity specimen
(3.0 ± 0.9 ppt). The measurements detected no softening.
According to Bažant et al. (1984) softening is a decline of
Figure 4. Photograph of a sample from the bottom of an ice block stress at increasing strain or, in our case, an increase in strain
of higher salinity (5.9 ± 0.6 ppt) before cycling (a) and after (b) fail- during cycling at constant stress amplitude during the tests.
ure. Note a crack that propagated along whitish features in the area The absence of detectable softening during cycling of the
in (a) depicted by the circle. Scale bars: 20 mm. saline ice is reminiscent of the absence of softening during
the cycling of freshwater ice (Iliescu et al., 2017; Murdza et
al., 2020b).
where P is the applied load and L is the distance between
the outer pair of loading cylinders (shown in Fig. 5b) and is
set by the geometry of the apparatus to be L = 254 mm. 3 Results and observations
We used two different loading procedures, as we did ear-
lier in our study of S2 freshwater ice. Type I loading was a 3.1 Flexural strength of non-cycled ice
completely reversed stress cycle with constant stress ampli-
tude and mean stress of zero. Type II was similar to Type The flexural strength of non-cycled saline ice of both salin-
I but incorporated an increasing multi-level (or step-level) ities was measured at −10 ◦ C and at a nominal outer-fiber
stress amplitude. This second type of loading essentially con- center-point displacement of 0.1 mm s−1 . The results are
sisted of several Type I steps of increasing stress amplitudes. listed in Table 2. Failure more often occurred at random loca-
In the present study for stress amplitudes below 0.7 MPa, we tions between the two inner loading cylinders and less often
used Type I loading. To cycle ice samples at stress amplitudes either below or slightly outside the loading cylinders. The
above 0.7 MPa, we first pre-conditioned specimens through reason for the latter location was the presence prior to test-
step-loading the Type II procedure at progressively higher ing of a significant concentration of whitish features at load-
stress amplitude levels; i.e., we cycled specimens for ∼ 300 ing cylinders which served as stress concentrators and along
times at each of the following stress amplitudes: 0.7, 0.75, which the failure ultimately occurred (similar to Fig. 4).
https://doi.org/10.5194/tc-15-2415-2021 The Cryosphere, 15, 2415–2428, 20212420 A. Murdza et al.: Behavior of saline ice under cyclic flexural loading
Figure 5. Photograph (a) and sketch (b) of the four-point bending apparatus connected to an MTS hydraulic testing system (Iliescu et al.,
2017; Murdza et al., 2020b). The upper part is attached to the frame of the machine while the mobile middle part is attached through a
fatigue-rated load cell to the piston. The apparatus is made from an aluminum alloy; the loading cylinders are made from stainless steel.
Figure 6. Curves of force/load and displacement vs. time for periods of 200 s near the beginning and near the end of cycling before fatigue
failure occurred. Marker symbol “x” denotes a moment of specimen failure. Force of ∼ 135 N corresponds to ∼ 1.2 MPa.
The average and standard deviation of the measured flexu- ported by Timco and O’Brien (1994) for sea ice of similar
ral strength of saline ice of lower salinity (3.0 ± 0.9 ppt) are salinity, as can be seen in Fig. 7. Brine volume fraction νb
0.96 ± 0.13 MPa. The strength of the lower-salinity ice did was calculated according to Frankenstein and Garner (1967):
not correlate systematically with the depth of the parent puck
from which ice beams were prepared. The measured strength
compares favorably with the value of 0.85 ± 0.20 MPa re- 49.185
νb = 0.001 × S + 0.532 , (2)
|T |
The Cryosphere, 15, 2415–2428, 2021 https://doi.org/10.5194/tc-15-2415-2021A. Murdza et al.: Behavior of saline ice under cyclic flexural loading 2421
Figure 7. Flexural strength of saline ice as a function of root brine Figure 8. Flexural strength and the corresponding number of cy-
volume for the ice grown in the present study and for data from cles imposed for saline ice of lower salinity (3.0 ± 0.9) ppt cycled
Timco and O’Brien (1994) for comparison. at 0.35 MPa outer-fiber stress amplitude at −10 ◦ C and 0.1 mm s−1
outer-fiber center-point displacement rate.
where T is temperature in degrees Celsius between −0.5 and
−22.9 ◦ C, and S is meltwater salinity (in parts per thousand) first-year sea ice of 4.1 ± 0.3 ppt salinity loaded uniaxially
of the ice. across the columns at a temperature of −10 ◦ C and strain
The average and standard deviation of the measured flex- rates of 10−5 and 10−3 s−1 . Recall that in the present exper-
ural strength of saline ice of higher salinity (5.9 ± 0.6 ppt) iments the outer-fiber strain rate was about 1.4 × 10⁻⁴ s−1 ,
are 0.98 ± 0.36 MPa. The measured values (Fig. 7) deviate which is within the range reported by Richter-Menge and
slightly towards higher values compared to the data of Timco Jones (1993). This agreement between direct and indirect
and O’Brien (1994), although scatter is significantly greater measurements of tensile strength lends confidence that our
than the scatter in the strength of the ice of lower salinity lab-grown saline ice is a reasonably faithful analogue of nat-
(3.0 ± 0.9 ppt). This may be explained by the greater degree ural sea ice.
of interconnectivity of brine pockets at the bottom of an ice
puck (discussed above and shown in Figs. 3 and 4). Indeed, 3.2 Flexural strength versus number of reversed cycles
the flexural strength of the higher-salinity specimens appears under constant low stress amplitude
to depend on the depth of ice from which beams were pre-
pared, Table 2. This result shows how much the strength of To determine whether there is a relationship between flex-
ice is sensitive to flaws and defects. Given that larger bodies ural strength and number of cycles imposed under a con-
usually contain larger defects, the flexural strength of sea ice stant low stress amplitude, we performed via Type I load-
on the medium and large scales, in the field (Karulina et al., ing a series of experiments on saline ice of lower salinity
2013, 2019; Murdza et al., 2016) for instance, is expected to (3.0 ± 0.9 ppt) at −10 ◦ C at an outer-fiber center-point dis-
be lower than on the smaller scale of the present experiments. placement rate of 0.1 mm s−1 at a low stress amplitude of
We also compare our measurements of flexural strength 0.35 MPa, i.e., at an amplitude less than one-half the flexural
with the tensile strength of sea ice. For this purpose, and strength of non-cycled ice. Figure 8 shows the results. The
as we did in our previous work on freshwater ice (Ili- number of cycles varied from about 100 to 14 000. The aver-
escu et al., 2017; Murdza et al., 2020b), flexural strength age strength and standard deviation of all data from Fig. 8 are
is divided by 1.7 (Ashby and Jones, 2012). This factor re- 0.96 ± 0.23 MPa. As noted above, the strength and standard
flects the fact that the volume of the material which is deviation of non-cycled ice are 0.96 ± 0.13 MPa. In other
subjected to the highest stress in bending is smaller than words, no strengthening was detected upon cycling up to
in uniaxial tension; thus, the largest defect which gov- 14 000 times at a stress amplitude of 0.35 MPa. For freshwa-
erns the failure may not be near the surface of a bent ter ice (Murdza et al., 2020b), we found that once the num-
specimen. Upon dividing the flexural strength of the non- ber of cycles at a given low stress amplitude exceeded 300,
cycled saline ice of lower salinity by 1.7, we found the the number of cycles had no significant effect on the flexural
average across-column tensile strength from our experi- strength, implying that a kind of saturation of strength de-
ments to be 0.96 ± 0.13 MPa / 1.7 = 0.56 ± 0.08 MPa. This veloped. Given that result and the new results for saline ice,
value compares favorably with the values 0.56 ± 0.06 MPa we followed the practice in the present study of cycling more
and 0.63 ± 0.12 MPa reported by Richter-Menge and than 300 times, often as many as 2000 times, before bending
Jones (1993) for the tensile strength of columnar-grained the ice to failure.
https://doi.org/10.5194/tc-15-2415-2021 The Cryosphere, 15, 2415–2428, 20212422 A. Murdza et al.: Behavior of saline ice under cyclic flexural loading
Figure 9. Flexural strength of freshwater ice and saline ice of lower Figure 10. Flexural strength as a function of position of saline ice
(3.0 ± 0.9 ppt) and of higher (5.9 ± 0.6 ppt) salinity as a function samples of higher salinity (5.9 ± 0.6 ppt) for different cyclic ampli-
of reverse-cycled stress amplitude. Freshwater ice laboratory and tudes. The imposed number of cycles for specimens cycled at 0.35
lake data are taken from Murdza et al. (2020b, 2021). Red five- and 0.7 MPa is ∼ 2000.
pointed stars and green squares represent tests performed on saline
ice of lower and higher salinities, respectively, at 0.1 mm s−1 and
−10 ◦ C. During all depicted tests the ice did not fail during cycling strength compared with about 100 % for freshwater ice (Mur-
and was broken by applying one unidirectional displacement until dza et al., 2020b). Another point is that we almost were
failure occurred. not able to cycle specimens at stress amplitudes greater than
the flexural strength of non-cycled material, whereas in the
case of freshwater ice we were able to cycle at stress am-
3.3 Flexural strength versus stress amplitude
plitudes significantly greater than flexural strength of non-
The flexural strength increases with stress amplitude. Fig- cycled ice. Indeed, the maximum cycled stress amplitude we
ure 9 shows measurements obtained from saline ice of both were able to reach in the case of saline ice of lower salin-
salinities cycled at −10 ◦ C at an outer-fiber displacement rate ity (3.0 ± 0.9 ppt) during all tests was 1.1 MPa, which is not
of 0.1 mm s−1 . For comparison, data from laboratory grown statistically different from the non-cycled flexural strength of
freshwater ice (Murdza et al., 2020b) of S2 character and 0.96 ± 0.13 MPa.
from lake ice of the same character (Murdza et al., 2020a, For saline ice of lower salinity (3.0 ± 0.9 ppt), there is no
2021) are also shown. The relationship between the flexural evidence that the flexural strength of both non-cycled and
strength, σfc , and cycled stress amplitude, σa , for saline ice cycled ice is significantly affected by the depth of ice from
appears to be a linear one and, within experimental scatter, which ice beams were harvested. For saline ice of higher
to have essentially the same sensitivity to stress amplitude as salinity (5.9 ± 0.6 ppt), however, the flexural strength of both
freshwater ice, namely non-cycled and cycled ice appears to depend on the depth of
ice from which beams were prepared, Fig. 10. Indeed, the
σfc = σf0 + kσa , (3) flexural strength of specimens from the bottom and from the
top of an ice puck of higher salinity (5.9 ± 0.6 ppt) differs by
where k = 0.68 is a constant. For freshwater ice the non- a factor of ∼ 3 (∼ 0.4 MPa vs. ∼ 1.4 MPa).
cycled flexural strength is σf0 = 1.75 MPa compared with
σf0 = 0.96 MPa for the saline ice. There is, perhaps, in Fig. 9 3.4 Fatigue behavior
a hint that for saline ice there is a threshold of about 0.4 MPa
that must be exceeded to detect strengthening. Interestingly, Although the specimens from which the data in Fig. 9 were
this apparent threshold is similar in magnitude to the stress obtained did not fail during cycling, other specimens cycled
that marks the onset of significant AE activity under cyclic under similar conditions did fail while being cycled. Results
loading of sea ice cores (Cole and Dempsey, 2006). Although from such tests (on saline ice of lower salinity (3.0 ± 0.9 ppt)
saline ice is weaker than freshwater ice, it appears that upon at −10 ◦ C and 0.1 mm s−1 outer-fiber displacement rate) al-
cycling its strength increases at the same rate as freshwater lowed us to construct a S–N fatigue curve, shown in Fig. 11.
ice. The number of cycles here is the number of cycles to fail-
Although the rate of strengthening with stress amplitude ure during cycling at the last stress amplitude level and not
appears to be the same for saline ice and freshwater ice, the the total number of cycles. At most the S–N curve showed
maximum increase in strength in the case of saline ice of only a weak systematic dependence of the number of cycles
lower salinity (3.0 ± 0.9 ppt) is significantly lower. We were to failure on stress amplitude. Indeed, for the same stress am-
able to strengthen saline ice by about 50 % of the non-cycled plitude of ∼ 0.9 MPa, fatigue failure occurred after as few as
The Cryosphere, 15, 2415–2428, 2021 https://doi.org/10.5194/tc-15-2415-2021A. Murdza et al.: Behavior of saline ice under cyclic flexural loading 2423
Figure 12. Acoustic emissions (hits) against time for saline ice
Figure 11. Stress amplitude as a function of the number of cy-
of lower salinity (3.0 ± 0.9 ppt), cycled at a stress amplitude
cles to fatigue fracture for saline ice of lower salinity (3.0 ± 0.9 ppt)
of 0.5 MPa at −10 ◦ C at an outer-fiber displacement rate of
tested at −10 ◦ C and 0.1 mm s−1 outer-fiber center-point displace-
0.1 mm s−1 .
ment rate.
< 10 cycles and after as many as a few thousand cycles. Sta- from brine pockets or brine channels, should they be present.
tistical analyses to test the hypothesis that the slope in Fig. 11 The plane of the thin section was parallel to the long axis
is zero resulted in a p value equal ∼ 0.06. Therefore, there is of the columnar grains and parallel to the direction of the
only a marginally significant effect of number of cycles on greater normal stress. This plane was taken as the best plane
the stress at which failure occurred. We attribute this vari- to observe possible cracks. Thin sections were observed us-
ability in fatigue life to the variability in microstructure from ing non-polarized light. We found no evidence of microc-
specimen to specimen. racks starting from brine pockets or from other defects. In
That said, a note of caution is appropriate. The data in fact, we found no microcracks at all. It appears, therefore,
Fig. 11 should not be viewed as fatigue data in the usual that slow crack growth is not a significant contribution to the
sense, i.e., in the way such data are viewed when obtained fatigue life of the beams of the laboratory-grown saline ice
from other materials (e.g., metals and alloys) that exhibit that we studied.
classical fatigue behavior. In those cases, before cycling, all
specimens are assumed to have the same thermal–mechanical 3.6 Acoustic emissions
history. That was not the case here for the saline ice, as most
of the samples were pre-conditioned according to the Type Acoustic emissions (AE) during repetitive loading of ice
II procedure before they were cycled at the last stress level have been previously recorded and analyzed in labora-
where they failed while cycling. In other words, in order tory and in situ (Langhorne and Haskell, 1996; Cole and
to get fatigue failure, we were increasing stress amplitude Dempsey, 2006, 2004; Lishman et al., 2020; Murdza et al.,
by small increments of ∼ 0.05 MPa and allowed a sufficient 2020b). Langhorne and Haskell (1996) suggested that the
number of cycles at each stress level (∼ 500–1000) before emissions originate either from dislocation breakaway or
we reached a fatigue failure. from microcracking associated with dislocation motion.
The question to address here is why we did not obtain a In contrast to freshwater ice, where no sound was detected
classical S–N curve. We suggest that the classical mecha- until failure (Murdza et al., 2020b), continuous emission was
nism of fatigue, i.e., accumulation of damage, is not in play detected while cycling at constant stress amplitude. Figure 12
in our tests, and some other process is controlling fatigue life. shows the cumulative acoustic emissions, or “hits”, as a func-
tion of time for ice that was cycled reversely at a constant
3.5 Microstructural observations of samples after stress amplitude of 0.5 MPa. As can be seen, the hit rate (or
fatigue failure hits per unit time), which is the slope of the curve in Fig. 12,
is about the same for the duration of the experiment.
In an attempt to reveal deformation damage in the form Interestingly, the hit rate depends on stress amplitude dur-
of microcracks, we examined using thin-section optical mi- ing cycling. Figure 13 shows this behavior. The greater the
croscopy (up to 50× magnification) the microstructure of stress amplitude, the greater the hit rate. However, during cy-
specimens of the lower-salinity ice (3.0 ± 0.9 ppt) after they cling below about 0.2 MPa no hits were detected.
had failed during cycling, i.e., failed in fatigue. Three thin Figure 13 also indicates that the hit rate is independent
sections were prepared from four specimens in order to en- of the sequence of different stress amplitudes. The numbers
sure a greater probability of observing microcracks growing in Fig. 13 show the order of cycling at different stress am-
https://doi.org/10.5194/tc-15-2415-2021 The Cryosphere, 15, 2415–2428, 20212424 A. Murdza et al.: Behavior of saline ice under cyclic flexural loading
lier work (Murdza et al., 2020b) we proposed that strengthen-
ing might be due to the development of an internal back stress
that originates from either dislocation pileups or grain bound-
ary sliding. However, one reviewer suggested the possibility
of a different strengthening mechanism. Due to the inherent
weakness of the saline ice microstructure, the microstructural
stress relief may occur through localized damage via microc-
racking mentioned above. More research, however, is needed
to examine this hypothesis.
The maximum degree of strengthening in the case of saline
ice is significantly lower than that for the freshwater ice, al-
though the slopes of the two data sets (rate of strength in-
crease with increasing cyclic amplitude) in Fig. 9 are nearly
equivalent. That difference may be explained by the structure
Figure 13. Hit rate as a function of cycled stress amplitude for
of saline ice which limits maximum possible strengthening.
saline ice sample of lower salinity (3.0 ± 0.9 ppt). Numbers show
the order of cycling at different stress amplitudes.
Given the significantly greater number of stress concentrators
in saline ice, such as brine pockets and channels, the propen-
sity for failure during cycling is greater in saline ice (Sammis
plitudes; i.e., firstly we cycled ice at higher stress ampli- and Ashby, 1986), thereby limiting the development of the
tudes (0.5–0.8 MPa) and then at lower stress amplitudes (0.2– back stress. Indeed, in the present study failure of specimens
0.4 MPa). The results showed an increase in the hit rate as during cycling occurred more frequently than in the study on
stress amplitude increases, regardless of the sequence of cy- freshwater ice (Murdza et al., 2020b).
cling. Flexural experiments conducted on saline ice of higher
salinity (5.9 ± 0.6 ppt) showed the importance of brine fea-
tures. Samples that were manufactured from the bottom of
4 Discussion the ice puck were characterized by more frequent whitish in-
terconnected features (taken to be interconnected brine pock-
The results obtained from the experiments described in this ets) that often were the path for easy crack propagation. Of-
paper show that the flexural strength of saline ice can be in- ten samples were so weak that they failed before testing sim-
creased upon reversed cyclic loading. Therefore, the same ply by handling. Interestingly, there were no interconnected
set of questions as for the freshwater ice should be addressed features in samples prepared from the top of an ice puck,
here. What governs the flexural strength of saline ice? Does which resulted in a difference of more than a factor of 3 in
crack propagation or crack nucleation control the tensile strength between samples from top and bottom. Samples pro-
strength? First of all, to understand the behavior of saline duced from saline ice of lower salinity (3.0 ± 0.9 ppt) also
ice, it is important to recognize that flexural strength in the had whitish features; however, these features were spread
present experiments is governed by the tensile strength, al- more uniformly (on a macroscopic scale) across the sample,
though greater by a factor of about 1.7 (Ashby and Jones, resulting in little difference in strength between the bottom
2012). Secondly, the apparent absence of remnant microc- and top samples.
racks within the two parts of broken samples (Sect. 3.5) indi- It is worth noting again that a significantly greater fraction
cates that crack nucleation controls the flexural strength, just of saline ice samples failed in fatigue while pre-conditioning
as it appears to do for freshwater ice. Indeed, this seems rea- compared with freshwater ice. This may be explained by the
sonable given the fact that freshwater ice comprises ∼ 95 % fact that freshwater ice was essentially free from pores, brine
by volume of the saline ice we studied. Within the freshwater pockets, and other defects. Based on this observation, it ap-
component, there is almost no solubility of salts (Weeks and pears that crack growth is not a significant contribution to the
Ackley, 1986). The remainder of the saline ice is a mixture fatigue life of saline ice under the conditions of our experi-
of air and brine. As was shown earlier, the microstructure of ments.
saline ice that we grew is closely similar to the microstruc- On the origin of the acoustic emissions, there are at least
ture of sea ice. Pores lower the saline ice strength (Sammis four possible sources of the noise detected. One is from mi-
and Ashby, 1986). However, the behavior of S2 saline ice un- crocracking. We imagine that microcracks form in regions
der cyclic loading is essentially the same as the behavior of of mechanical weakness which results in accumulation of
S2 freshwater ice (Murdza et al., 2020b); i.e., its strength in- damage that we detected via the AE method. Specifically,
creases at the same rate as freshwater ice upon cycling under the whitish brine drainage features discussed above in the
a given amplitude of the outer-fiber stress. Hence, it is rea- test specimens constitute regions of high porosity and thus
sonable to assume that the strengthening mechanism for the provide favorable sites for the concentration of such dam-
saline ice is similar to that for the freshwater ice. In our ear- age. Failure may occur when one of these sites can no longer
The Cryosphere, 15, 2415–2428, 2021 https://doi.org/10.5194/tc-15-2415-2021A. Murdza et al.: Behavior of saline ice under cyclic flexural loading 2425
support the applied stress and a microcrack emerges from the iv. Crack growth is not a significant contribution to the fa-
damage zone and propagates. It is possible that newly formed tigue life of saline ice.
microcracks are stable until a critical length is reached (Can-
v. There is high variability in structure and strength
non et al., 1990; Schulson et al., 1991), at which point the
through the thickness of a saline ice puck of higher
crack growth ensues. The reason that microcracks were not
salinity (5.9 ± 0.6 ppt).
observed under the optical microscope may be because they
filled up with liquid brine upon formation, which results in a vi. Given the lack of definitive proof of the underlying fail-
loss of contrast. A second possible explanation for the acous- ure mechanism in saline ice, the increase in flexural
tic emissions is the motion and friction of very fine particles strength of freshwater ice and saline ice attributable to
of ice which may have been entrapped inside brine drainage pre-failure load cycling is roughly equivalent.
features, as mentioned above. A third possibility is microc-
vii. Acoustic emission hit rate during cycling at a constant
racking along grain boundaries due to grain boundary slid-
stress amplitude is about constant.
ing (Elvin and Shyam Sunder, 1996; Goldsby and Kohlstedt,
1997; Mulmule and Dempsey, 1997; Schulson et al., 1997; viii. Acoustic emission hit rate during cycling increases with
Weiss and Schulson, 2000). A fourth possible explanation an increase in stress amplitude of cycling.
consistent with the non-history dependence of the hit rate
(Fig. 13) is a kind of water-hammer effect in which brine en-
trapped within pockets impacts the wall, first in one direction Code availability. The code used for data plotting was written in
and then another. None of these possibilities can be evaluated MATLAB. Scripts used for plotting are available from the authors
based upon the limits of the present observations. We refrain, upon request.
therefore, from further speculation on this point.
Returning to the observations noted in the Introduc-
tion, and to the results obtained from imposed in situ Data availability. All data points plotted in this work and not pro-
cyclic loading experiments on sea ice beams by Bond and vided in tables and more detailed information on the experimental
procedure and results are available from the authors upon request.
Langhorne (1997), Haskell et al. (1996), and Langhorne et
al. (1998, 1999), the question is as follows: why does ice fail
in the field under wave action and under imposed cyclic load-
Author contributions. AM, ES, and CR designed the experiments,
ing, but strengthen upon cycling in our experiments in the
and AM carried them out. AM prepared the manuscript with contri-
laboratory? Although we do not know the process through butions from all co-authors.
which the ice sheet failed in the field, we expect that there are
many micro- and macrocracks in natural sea ice. Indeed, ther-
mally induced tensile stresses can induce thermal cracking Competing interests. The authors declare that they have no conflict
in floating ice sheets (Evans and Untersteiner, 1971). There- of interest.
fore, our sense is that the difference in ice behavior under
cyclic loading in situ in the field (Bond and Langhorne, 1997;
Langhorne et al., 1998) and in the laboratory in the present Acknowledgements. We acknowledge helpful discus-
study is due to other types of defects other than brine chan- sions/communications with Harold Frost, Robert Gagnon,
nels and pockets that are generated in the field as a result of and Daniel Iliescu. We acknowledge the thoughtful and helpful
thermomechanical history of ice. critical comments from the two anonymous reviewers.
5 Conclusions Financial support. This research has been supported by the Na-
tional Science Foundation (grant no. FAIN 1947-107) and the
From new, systematic experiments on the flexural strength Bureau of Safety and Environmental Enforcement (grant no.
of sub-meter-sized beams of S2 columnar-grained saline ice E16PC00005).
stressed principally across the columns through reversed
cyclic loading at a temperature of −10 ◦ C and frequencies
in the range from 0.1 to 0.6 Hz, the following is concluded. Review statement. This paper was edited by Christian Haas and re-
viewed by two anonymous referees.
i. The flexural strength of saline ice can be increased upon
reversed cyclic loading by as much as a factor of 1.5.
ii. The flexural strength of ice subsequent to cycling scales References
linearly with the amplitude of the outer-fiber stress.
Ashby, M. M. and Jones, D. R. H.: Engineering Materials 1: An
iii. The fatigue life of saline ice is erratic and does not obey Introduction to Properties, Applications and Design, Elsevier,
classical S–N behavior. 2012.
https://doi.org/10.5194/tc-15-2415-2021 The Cryosphere, 15, 2415–2428, 20212426 A. Murdza et al.: Behavior of saline ice under cyclic flexural loading Asplin, M. G., Galley, R., Barber, D. G., and Prinsenberg, S.: able at: https://www.researchgate.net/publication/303460064_ Fracture of summer perennial sea ice by ocean swell as a re- The_cyclic_and_fracture_response_of_sea_ice_in_McMurdo_ sult of Arctic storms, J. Geophys. Res.-Ocean., 117, C06025, Sound_Part_II (last access: 14 January 2020), 2003. https://doi.org/10.1029/2011JC007221, 2012. Elvin, A. A. and Shyam Sunder, S.: Microcracking due to grain Bathias, C. and Pineau, A. (Eds.): Fatigue of Materials and Struc- boundary sliding in polycrystalline ice under uniaxial com- tures, John Wiley & Sons, Inc., Hoboken, NJ, USA, 2013. pression, Acta Mater., 44, 43–56, https://doi.org/10.1016/1359- Bažant, Z. P., Belytschko, T. B., and Chang, T.: Continuum 6454(95)00157-1, 1996. Theory for Strain-Softening, J. Eng. Mech., 110, 1666–1692, Evans, R. J. and Untersteiner, N.: Thermal cracks in https://doi.org/10.1061/(asce)0733-9399(1984)110:12(1666), floating ice sheets, J. Geophys. Res., 76, 694–703, 1984. https://doi.org/10.1029/JC076i003p00694, 1971. Bond, P. E. and Langhorne, P. J.: Fatigue behavior of can- Frankenstein, G. and Garner, R.: Equations for Determining the tilever beams of saline ice, J. Cold Reg. Eng., 11, 99– Brine Volume of Sea Ice from −0.5◦ to −22.9 ◦ C, J. Glaciol., 112, https://doi.org/10.1061/(ASCE)0887-381X(1997)11:2(99), 6, 943–944, https://doi.org/10.3189/S0022143000020244, 1967. 1997. Golding, N., Snyder, S. A., Schulson, E. M., and Renshaw, C. Broek, D.: Elementary engineering fracture mechanics, 1st edn., E.: Plastic faulting in saltwater ice, J. Glaciol., 60, 447–452, Springer, Dordrecht, 1986. https://doi.org/10.3189/2014JoG13J178, 2014. Cannon, N. P., Schulson, E. M., Smith, T. R., and Frost, H. J.: Wing Goldsby, D. L. and Kohlstedt, D. L.: Grain boundary slid- cracks and brittle compressive fracture, Acta Metall. Mater., ing in fine-grained ice I, Scr. Mater., 37, 1399–1406, 38, 1955–1962, https://doi.org/10.1016/0956-7151(90)90307-3, https://doi.org/10.1016/S1359-6462(97)00246-7, 1997. 1990. Gupta, V., Bergström, J., and Picu, C. R.: Effect of step-loading Cole, D. and Dempsey, J.: Laboratory observations of acoustic history and related grain-boundary fatigue in freshwater colum- emissions from antarctic first-year sea ice cores under cyclic nar ice in the brittle deformation regime, Philos. Mag. Lett., 77, loading, in: 18th International POAC Conference, Potsdam, New 241–247, https://doi.org/10.1080/095008398178372, 1998. York, USA, 26–30 June 2005, Vol. 3, 1083–1092, 2006. Haskell, T. G., Robinson, W. H., and Langhorne, P. J.: Prelimi- Cole, D. M.: Reversed direct-stress testing of ice: Initial experimen- nary results from fatigue tests on in situ sea ice beams, Cold tal results and analysis, Cold Reg. Sci. Technol., 18, 303–321, Reg. Sci. Technol., 24, 167–176, https://doi.org/10.1016/0165- https://doi.org/10.1016/0165-232X(90)90027-T, 1990. 232X(95)00015-4, 1996. Cole, D. M.: A model for the anelastic straining of saline ice Hendrikse, H. and Metrikine, A.: Edge indentation of subjected to cyclic loading, Philos. Mag. A, 72, 231–248, ice with a displacement-controlled oscillating cylindri- https://doi.org/10.1080/01418619508239592, 1995. cal structure, Cold Reg. Sci. Technol., 121, 100–107, Cole, D. M.: Modeling the cyclic loading response of sea ice, Int. https://doi.org/10.1016/j.coldregions.2015.10.013, 2016. J. Solids Struct., 35, 4067–4075, https://doi.org/10.1016/S0020- Hwang, B., Wilkinson, J., Maksym, E., Graber, H. C., Schweiger, 7683(97)00301-6, 1998. A., Horvat, C., Perovich, D. K., Arntsen, A. E., Stanton, T. P., Cole, D. M. and Dempsey, J. P.: In situ Sea Ice Experi- Ren, J., and Wadhams, P.: Winter-to-summer transition of Arctic ments in McMurdo Sound: Cyclic Loading, Fracture, and sea ice breakup and floe size distribution in the Beaufort Sea, Acoustic Emissions, J. Cold Reg. Eng., 18, 155–174, Elem. Sci. Anth., 5, 40, https://doi.org/10.1525/elementa.232, https://doi.org/10.1061/(ASCE)0887-381X(2004)18:4(155), 2017. 2004. Iliescu, D. and Schulson, E. M.: Brittle compressive failure of ice: Cole, D. M. and Durell, G. D.: The cyclic load- Monotonic versus cyclic loading, Acta Mater., 50, 2163–2172, ing of saline ice, Philos. Mag. A, 72, 209–229, https://doi.org/10.1016/S1359-6454(02)00060-5, 2002. https://doi.org/10.1080/01418619508239591, 1995. Iliescu, D., Murdza, A., Schulson, E. M., and Renshaw, C. E.: Cole, D. M., Johnson, R. A., and Durell, G. D.: Cyclic loading and Strengthening ice through cyclic loading, J. Glaciol., 63, 663– creep response of aligned first-year sea ice, J. Geophys. Res.- 669, https://doi.org/10.1017/jog.2017.32, 2017. Ocean., 103, 21751–21758, https://doi.org/10.1029/98JC01265, Jordaan, I. J.: Mechanics of ice-structure interaction, Eng. 1998. Fract. Mech., 68, 1923–1960, https://doi.org/10.1016/S0013- Cole, D. M., Dempsey, J., Kjestveit, G., Shapiro, S., Shapiro, L., 7944(01)00032-7, 2001. and Morley, G.: The cyclic and fracture response of sea ice in Jordaan, I. J., Xiao, J., Wells, J., and Derradji-Aouat, A.: Ice crush- McMurdo Sound. Part I, in: Proceedings of the 16th IAHR In- ing and cyclic loading in compression, in: 19th IAHR Interna- ternational Symposium on Ice, Dunedin, New Zealand, 2–6 De- tional Symposium on Ice, Vancouver, Canada, 6–11 July 2008, cember 2002. 1097–1106, 2008. Collins, C. O., Rogers, W. E., Marchenko, A., and Babanin, A. Karulina, M., Karulin, E., and Marchenko, A.: Field investigations V.: In situ measurements of an energetic wave event in the of first year ice mechanical properties in North-West Barents Sea, Arctic marginal ice zone, Geophys. Res. Lett., 42, 1863–1870, in: Proceedings of the 22nd International Conference on Port and https://doi.org/10.1002/2015GL063063, 2015. Ocean Engineering under Arctic Conditions, Espoo, Finland, 9– Dempsey, J., Cole, D. M., Shapiro, S., Kjestveit, G., Shapiro, 13 June 2013, 1–11, 2013. L., and Morley, G.: The cyclic and fracture response of sea Karulina, M., Marchenko, A., Karulin, E., Sodhi, D., Sakharov, ice in McMurdo Sound. Part II, in: Proceedings of the 17th A., and Chistyakov, P.: Full-scale flexural strength of International Conference on Port and Ocean Engineeringunder sea ice and freshwater ice in Spitsbergen Fjords and Arctic Conditions, Trondheim, Norway, 16–19 June, 2003, avail- The Cryosphere, 15, 2415–2428, 2021 https://doi.org/10.5194/tc-15-2415-2021
A. Murdza et al.: Behavior of saline ice under cyclic flexural loading                                                                  2427

   North-West Barents Sea, Appl. Ocean Res., 90, 101853,                     IAHR International Symposium on Ice, Virtual Conference, 23–
   https://doi.org/10.1016/j.apor.2019.101853, 2019.                         25 November, 2020a.
Kohout, A. L., Williams, M. J. M., Toyota, T., Lieser,                    Murdza, A., Schulson, E. M., and Renshaw, C. E.: Strengthening of
   J., and Hutchings, J.: In situ observations of wave-                      columnar-grained freshwater ice through cyclic flexural loading,
   induced sea ice breakup, Deep. Res. Pt. II, 131, 22–27,                   J. Glaciol., 66, 556–566, https://doi.org/10.1017/jog.2020.31,
   https://doi.org/10.1016/j.dsr2.2015.06.010, 2016.                         2020b.
Langhorne, P. J. and Haskell, T. G.: Acoustic emission during fa-         Murdza, A., Marchenko, A., Schulson, E. M., and Renshaw, C.
   tigue experiments on first year sea ice, Cold Reg. Sci. Technol.,         E.: Cyclic strengthening of lake ice, J. Glaciol., 67, 182–185,
   24, 237–250, https://doi.org/10.1016/0165-232X(95)00021-3,                https://doi.org/10.1017/jog.2020.86, 2021.
   1996.                                                                  O’Rourke, B. J., Jordaan, I. J., Taylor, R. S., and Gürt-
Langhorne, P. J., Squire, V. A., Fox, C., and Haskell, T. G.: Break-         ner, A.: Experimental investigation of oscillation of
   up of sea ice by ocean waves, Ann. Glaciol., 27, 438–442,                 loads in ice high-pressure zones, part 1: Single in-
   https://doi.org/10.3189/S0260305500017869, 1998.                          dentor system, Cold Reg. Sci. Technol., 124, 25–39,
Langhorne, P. J., Squire, V. A., and Haskell, T. G.: Role of fatigue         https://doi.org/10.1016/J.COLDREGIONS.2015.12.005, 2016.
   in wave-induced break-up of sea ice – a review, in: Ice in Surface     Pistone, K., Eisenman, I., and Ramanathan, V.: Observational
   Waters: Proceedings of the 14th International Symposium on Ice,           determination of albedo decrease caused by vanishing Arc-
   Potsdam, New York, USA, 27–31 July 1998, 1019–1023, 1999.                 tic sea ice, P. Natl. Acad. Sci. USA, 111, 3322–3326,
Langhorne, P. J., Squire, V. A., Fox, C., and Haskell, T.                    https://doi.org/10.1073/pnas.1318201111, 2014.
   G.: Lifetime estimation for a land-fast ice sheet sub-                 Prinsenberg, S. J. and Peterson, I. K.: Observing regional-scale
   jected to ocean swell, Ann. Glaciol., 33, 333–338,                        pack-ice decay processes with helicopter-borne sensors and
   https://doi.org/10.3189/172756401781818419, 2001.                         moored upward-looking sonars, Ann. Glaciol., 52, 35–42,
Lishman, B., Marchenko, A., Sammonds, P., and Murdza, A.:                    https://doi.org/10.3189/172756411795931688, 2011.
   Acoustic emissions from in situ compression and indentation            Richter-Menge, J. A. and Jones, K. F.: The tensile
   experiments on sea ice, Cold Reg. Sci. Technol., 172, 102987,             strength of first-year sea ice, J. Glaciol., 39, 609–618,
   https://doi.org/10.1016/j.coldregions.2019.102987, 2020.                  https://doi.org/10.3189/S0022143000016506, 1993.
Liu, A. K., Mollo-Christensen, E., Liu, A. K., and Mollo-                 Sammis, C. G. and Ashby, M. F.: The failure of brittle porous
   Christensen, E.: Wave Propagation in a Solid Ice Pack, J.                 solids under compressive stress states, Acta Metall., 34, 511–
   Phys. Oceanogr., 18, 1702–1712, https://doi.org/10.1175/1520-             526, https://doi.org/10.1016/0001-6160(86)90087-8, 1986.
   0485(1988)0182.0.CO;2, 1988.                              Schijve, J.: Fatigue of Structures and Materials, 2nd edn., Springer
Masterson, D.: The Story of Offshore Arctic Engineer-                        Netherlands, 2009.
   ing – Cambridge Scholars Publishing, available at:                     Schulson, E. M. and Duval, P.: Creep and Fracture of Ice, Cam-
   https://books.google.com/books/about/The_Story_of_Offshore_               bridge University Press, Cambridge, 2009.
   Arctic_Engineering.html?id=y9N1DwAAQBAJ (last access: 4                Schulson, E. M., Kuehn, G. A., Jones, D. A., and Fifolt,
   March 2021), 2018.                                                        D. A.: The growth of wing cracks and the brittle com-
Michel, B. and Ramseier, R. O.: Classification of river and lake             pressive failure of ice, Acta Metall. Mater., 39, 2651–2655,
   ice, Can. Geotech. J., 8, 36–45, https://doi.org/10.1139/t71-004,         https://doi.org/10.1016/0956-7151(91)90081-B, 1991.
   1971.                                                                  Schulson, E. M., Qi, S., Melton, J. S., and Gratz, E.
Mulmule, S. V. and Dempsey, J. P.: Stress-Separation Curves                  T.: Across-column cracks and axial splits in S2 saline
   for Saline Ice Using Fictitious Crack Model, J. Eng.                      ice under compression, J. Glaciol., 43, 411–414,
   Mech., 123, 870–877, https://doi.org/10.1061/(asce)0733-                  https://doi.org/10.3189/s0022143000034997, 1997.
   9399(1997)123:8(870), 1997.                                            Shackleton, E. H.: South: The Story of Shackleton’s Last Expedi-
Murdza, A., Marchenko, A., Sakharov, A., Chistyakov, P., Karulin,            tion, 1914–17, Macmillian, USA, 1982.
   E., and Karulina, M.: Test with L-shaped cantilever beam for           Squire, V. A.: Of ocean waves and sea-ice re-
   complex shear and bending strength, in: 23rd IAHR Interna-                visited, Cold Reg. Sci. Technol., 49, 110–133,
   tional Symposium on Ice, Ann Arbor, Michigan, USA, 31 May–                https://doi.org/10.1016/j.coldregions.2007.04.007, 2007.
   3 June 2016, 1–9, 2016.                                                Suresh, S.: Fatigue of Materials, Cambridge University Press, 1998.
Murdza, A., Schulson, E. M., and Renshaw, C. E.: Hysteretic behav-        Tabata, T. and Nohguchi, Y.: Failure of Sea Ice by Repeated Com-
   ior of freshwater ice under cyclic loading: preliminary results, in:      pression, in: Physics and Mechanics of Ice, Springer, Berlin Hei-
   24th IAHR International Symposium on Ice, Vladivostok, Rus-               delberg, 351–362, 1980.
   sia, 4–9 June 2018, 185–192, 2018.                                     Timco, G. W. and O’Brien, S.: Flexural strength equa-
Murdza, A., Schulson, E. M., and Renshaw, C. E.: The effect of               tion for sea ice, Cold Reg. Sci. Technol., 22, 285–298,
   cyclic loading on the flexural strength of columnar freshwater            https://doi.org/10.1016/0165-232X(94)90006-X, 1994.
   ice, in: Proceedings of the International Conference on Port and       Weeks, W. F.: On Sea Ice, University of Alaska Press, Fairbanks,
   Ocean Engineering under Arctic Conditions, POAC, Delft, The               664 pp., 2010.
   Netherlands, 9–13 June, 2019.                                          Weeks, W. F. and Ackley, S. F.: The Growth, Structure, and Prop-
Murdza, A., Marchenko, A., Schulson, E., Renshaw, C., Sakharov,              erties of Sea Ice, in: The Geophysics of Sea Ice, Springer US,
   A., Karulin, E., and Chistyakov, P.: Results of preliminary cyclic        Boston, MA, USA, 9–164, 1986.
   loading experiments on natural lake ice and sea ice, in: 25th          Wei, M., Polojärvi, A., Cole, D. M., and Prasanna, M.: Strain
                                                                             response and energy dissipation of floating saline ice under

https://doi.org/10.5194/tc-15-2415-2021                                                          The Cryosphere, 15, 2415–2428, 2021
You can also read