First reported quantitative microbiota in different livestock manures used as organic fertilizers in the Northeast of Thailand
←
→
Page content transcription
If your browser does not render page correctly, please read the page content below
www.nature.com/scientificreports
OPEN First reported quantitative
microbiota in different livestock
manures used as organic fertilizers
in the Northeast of Thailand
Lampet Wongsaroj1,2, Ratmanee Chanabun3, Naruemon Tunsakul4,
Pinidphon Prombutara2,5, Somsak Panha6,7 & Naraporn Somboonna1,2*
Northeastern Thailand relies on agriculture as a major economic activity, and has used high levels
of agrochemicals due to low facility, and salty sandy soil. To support soil recovery and sustainable
agriculture, local farmers have used organic fertilizers from farmed animal feces. However, knowledge
about these animal fecal manures remains minimal restricting their optimal use. Specifically,
while bacteria are important for soil and plant growth, an abundance and a diversity of bacterial
composition in these animal fecal manures have not been reported to allow selection and adjustment
for a more effective organic fertilizer. This study thereby utilized metagenomics combined with 16S
rRNA gene quantitative PCR (qPCR) and sequencing to analyze quantitative microbiota profiles in
association with nutrients (N, P, K), organic matters, and the other physiochemical properties, of the
commonly used earthworm manure and other manures from livestock animals (including breed and
feeding diet variations) in the region. Unlike the other manures, the earthworm manure demonstrated
more favorable nutrient profiles and physiochemical properties for forming fertile soil. Despite low
total microbial biomass, the microbiota were enriched with maximal OTUs and Chao richness, and
no plant pathogenic bacteria were found based on the VFDB database. The microbial metabolic
potentials supported functions to promote crop growth, such as C, N and P cyclings, xenobiotic
degradation, and synthesis of bioactive compounds. Pearson’s correlation analyses indicated that
the quantitative microbiota of the earthworm manure were clustered in the same direction as N, and
conductivity, salinity, and water content were essential to control the microbiota of animal manures.
Sustainable agriculture requires healthy soils, provided that soil microorganisms play significant functions in
soil nutrient cycling, decomposition of toxic and complex organic molecules, and an increased crop fertility
and health1–5. The northeastern region of Thailand is characterized by undulating terrains with four mountains
(about 15% of the region’s total land surface) of a largely infertile, salty sandy soil t ype6. However, agriculture is
the major economic activity in this region. Common cultivars include rice, cassava, rubber, sugarcane and corn.
Subsequently, due to the inappropriate land area and soil type, the agriculture relies on agrochemicals. The Thai
government’s Eleventh National Economic and Social Development Plan (2012–2016) reported that Thailand
ranked first in the world for the use of registered chemicals in agriculture, without comment on the additional
use of banned agrochemicals. Thai certified organic farmland accounted for only 0.3–0.5% of Thailand’s agri-
culture land7. Intensive use of agrochemicals include fertilizers that have been used to accelerate the production
of plant products by providing mineral nutrients, including nitrogen (N), phosphorous (P) and potassium (K),
1
Department of Microbiology, Faculty of Science, Chulalongkorn University, Phyathai Road, Pathumwan,
Bangkok 10330, Thailand. 2Microbiome Research Unit for Probiotics in Food and Cosmetics, Chulalongkorn
University, Bangkok 10330, Thailand. 3Program in Animal Science, Faculty of Agriculture Technology, Sakon
Nakhon Rajabhat University, Sakon Nakhon 47000, Thailand. 4Program in Biotechnology, Faculty of Science,
Chulalongkorn University, Bangkok 10330, Thailand. 5Omics Sciences and Bioinformatics Center, Faculty of
Science, Chulalongkorn University, Bangkok 10330, Thailand. 6Department of Biology, Faculty of Science,
Chulalongkorn University, Bangkok 10330, Thailand. 7Centre of Excellence on Biodiversity, Ministry of Higher
of Education Science Research and Innovation/Faculty of Science, Chulalongkorn University, Bangkok 10330,
Thailand. *email: Naraporn.S@chula.ac.th
Scientific Reports | (2021) 11:102 | https://doi.org/10.1038/s41598-020-80543-3 1
Vol.:(0123456789)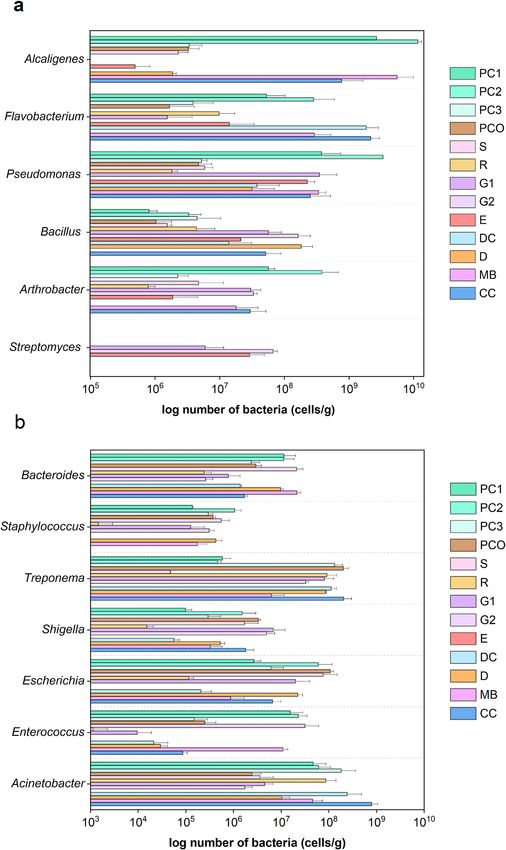
www.nature.com/scientificreports/
and average 5–6 million tons were applied per year in Thailand during 2012–2016, of which 42% were used in
rice farming8.
Chemical fertilizer, with defined inorganic formulations to match needs for different kinds of plant cultivars,
cause imbalances in natural ecosystems. The application of chemical fertilizers, especially in poor soil with little
ability to prevent leaching into groundwater, can cause adverse effects to the environment, such as waterway
pollution, increased air pollution, and acidification and mineral depletion of the s oil8,9. Long-term use also affects
the soil microbial diversity and natural e cosystem10–12.
Organic fertilizers, including those from animal feces and plant waste composting, would seem preferable.
Organic fertilizers from livestock feces contain decomposed complex molecules as nutrients and microbial
diversity with the ability for decomposition. Hence, organic fertilizer provides, in addition to nutrients for plant
growth and soil organisms, bacteria that may function to decompose and recycle agriculture wastes, and the
long-term use was able to increase and modify soil microbial diversity. The manures (animal fecal composts)
have contents and microorganisms to accommodate sustained arable soil bacterial c ommunities13. Nevertheless,
no knowledge of microbial and biophysiochemical compositions of the actual manures (type of species, breeds
and diets) utilized by farmers in the northeastern region of Thailand is present. The assorted livestock species
manures include Perionyx excavatus (earthworm, abbreviated as E), three breeds of Gallus gallus (Phuparn
black-bone chickens) including black feather and bones breed (PC1), white feather but black skin and bones
breed (PC2) and yellow feather but black skin and bones breed (PC3), three subspecies of Bos taurus (beef black
cattles) including Phuparn cow (PCO), Charole cow (CC) and dairy cattle (DC), Bubalus bubalis (dairy Murrah
buffalo, MB), Capra aegagrus hircus (goats) that were fed on (1) Pangola grass Digitaria eriantha (the highest
quality of grasses for grazing with a high metabolizable energy, nutrients and protein level)14 (G1) or (2) Napier
grass Pennisetum purpureum (the major livestock feed among ruminant animals in Thailand with a low nutrient
digestibility and crude protein content)15 (G2), Cervus timorensis (Lucy deer, D), Sus scrofa domesticus (pig, S),
and Oryctolagus cuniculus (rabbit, R). These animals have been predominantly farmed in the Northeast and their
feces are used as organic fertilizers16–18. Yet, these livestock manures have given variable effects in promoting
plant growth (Chanabun, personal communication).
The addition of manures to the soil has been reported to change the soil bacterial diversity, which had been
affected from the long-term use of chemical f ertilizers12. For example, Proteobacteria, Bacteroidetes, and Gem-
matimonadetes became abundant in organic farm lands, and the presence of these bacteria were reported to
correlate with an increased level of soil organic carbon (C) and nitrogen (N), and the total microbial b iomass17.
In contrast, Actinobacteria and Acidobacteria had become abundant in the agrochemical farm lands, where the
soil was acidic and the chemically-grown crops more often had disease incidences17–19. Hence, organic fertiliza-
tion is presumed to be one key to acquire a plant-beneficial bacteria community in the soil that is required for
sustainable agriculture.
Consequently, understanding the diversity of indigenous microbial populations in diverse animal fecal
manures that were commonly applied in the Northeast agriculture region of Thailand could provide insights
into the possible impacts on the changes in soil microbial activities (affecting soil quality). This study, therefore
utilized the advanced culture-independent approaches of 16S rRNA gene sequencing combined with quantitative
PCR (qPCR) technologies to firstly identify and quantify the microbial compositions and diversities (quantitative
microbiota), along with nutritional and physiochemical analyses, of the organic livestock fecal manures used in
local farms in the Northeast of Thailand. The microbial metabolic potentials of each manure was also estimated
from the quantitative microbiota. Together, the microbiome knowledge and the selection of appropriate animal
fecal manure may help improve the soil quality management towards the sustained fertile lands.
Materials and methods
Livestock fecal manure collections. In total, 13 livestock fecal manure samples (E, PC1-3, PCO, CC,
DC, MB, G1, G2, D, S and R), each with three independent random samplings at sites, as representative local
organic fertilizers, were collected in the Phuparn Royal Development Study Centre area, Sakon Nakhon prov-
ince, Thailand, in August 2018, between 11.00 and 15.00 h. This centre is a learning source for farmers to improve
their own lands, in term of not only planning of agriculture (specifically rice, mushroom, para rubber, economic
vegetables, mulberry, etc.) and livestock farming, but also water source and forest rehabilitation.
Nitrogen (N), phosphorus (P), potassium (K), and fecal organic matter (FOM) composi-
tions. The total N, P, and K contents in the fecal samples were measured following published protocols using
a Rapitest Soil Test Kit 1601 (Luster Leaf Products, Inc., Illinois, USA)20. In brief, the fecal sample (5 g) was
diluted 1:5 (w/v) in sterile water, mixed by vortexing for a minimum of 1 min, and allowed to settle overnight.
The liquid suspension was harvested: 10 mL was used for the NPK measurements while 20 mL was used for the
physiochemical properties. The 10 mL for NPK measurements was split into three aliquots, and the respective N,
P or K powder (0.3 g) (Luster Leaf Products, Inc., Illinois, USA) was added to one aliquot (1 mL) and mixed by
shaking for 30 s. The suspension was settled for 15 min, and the developed color was used to determine the N, P,
or K amount (µg) based on comparison with the Rapitest Soil Test Kit 1601 manual’s color chart. In addition, the
FOM content was measured in 1 g of each fecal sample using a Soil Organic Matter Test Kit (Kasetsart University
Research and Development Institute, Bangkok, Thailand). Three independent measurements were performed to
compute mean ± S.D.
Physiochemical properties. The 20 mL fecal liquid suspension of each sample was used to analyse the
pH, conductivity and salinity, using an Oakton PCD 650 Multiparameter with Calibration (GlobalTestSupply.
com, North Carolina, USA). For measurement of water content in the sample, 2 g fecal sample was accurately
Scientific Reports | (2021) 11:102 | https://doi.org/10.1038/s41598-020-80543-3 2
Vol:.(1234567890)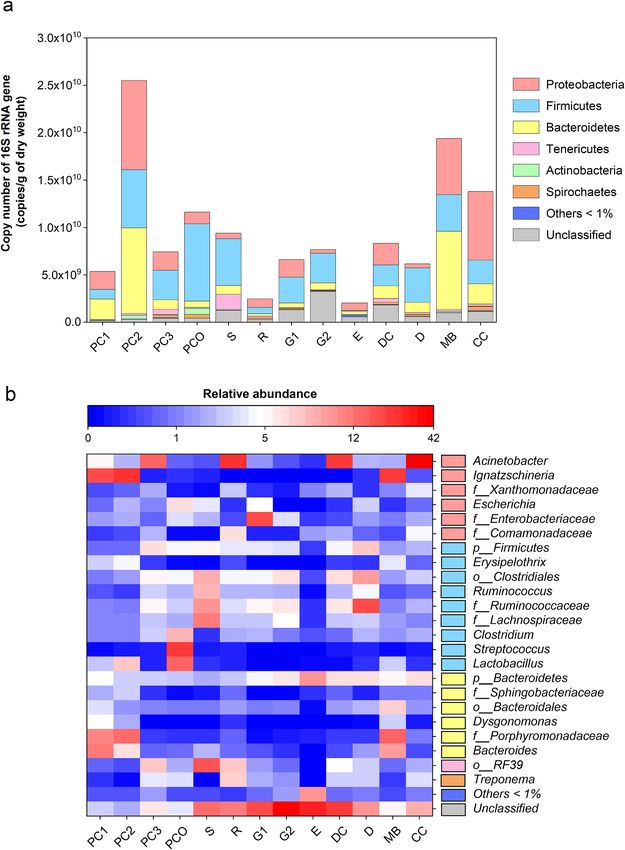
www.nature.com/scientificreports/
21 to obtain the dry weight
weighted (wet weight; WW) and then dried in a microwave oven at 105 °C for 24 h
(DW). The percent water content was computed from 100 × (WW-DW)/DW. Three independent measurements
were performed to compute mean ± S.D.
Metagenomic extraction, and quantification of total bacteria copy number, nirS and
alkB. Each sample (0.25 g) was extracted for metagenomic (microbial genomic) DNA using a DNeasy Pow-
erSoil Kit, following the manufacturer’s instructions (Qiagen, Maryland, USA). The quantity and quality of the
extracted metagenomic DNA was analysed by 1% (w/v) agarose gel electrophoresis and nanodrop spectropho-
tometry (A260 and A260/A280, respectively). For a quantitative count of the total bacteria in copy unit, the 16S
rRNA gene qPCR was performed using the universal primers 1392F (5′-GYACACACCGCCCGT-3′) and 1492R
(5′-GGTTACCTTGTTACGACTT-3′)22. The qPCR thermocycling conditions were 95 °C 5 min, followed by 40
cycles of 95 °C 30 s, 55 °C 45 s and 72 °C 45 s, and ended with a melting curve analysis to validate a single proper
amplicon peak (i.e. neither primer-dimer nor non-specific amplification)23. The reference for copy number com-
putation was Escherichia coli, in which the 100 base pair (bp) 1392F-1492R amplicon fragments were cloned into
pGEM-T-Easy Vector (Promega, Wisconsin, USA) and the recombinant plasmids were transformed into E. coli
DH5α for expression. The inserted fragments were verified by colony PCR using the primers M13F (on vector)
and 1492R (inserted fragment). Ten-fold serial dilutions of the extracted plasmids ( 104–108 copies/μL) were used
as the references for the bacterial copy number computation based on Eq. (1)23:
concentration (ng/µL) × 6.023 × 10²³ copies/mol
Copy number per µL = . (1)
length (bp) × 6.6 × 10¹¹ (ng/mol)
The reference DNA and metagenomic DNA (1 ng) were quantified by qPCR for bacterial copy number esti-
mate using primers 1392F and 1492R, and iQ SYBR Green Supermix (Bio-Rad, California, USA) in a 20 µL total
volume per well in a 48-well plate using the PCRmax Eco 48 real time PCR system (PCRmax, Staffordshire, UK).
Three replicates were performed per reaction. For quantification of cytochrome-containing nitrate reductase
(nirS) and alkane monooxygenase (alkB), established primers nirSF: 5′-GTSAACGTSAAGGARACSGG-3′ and
nirSR: 5′-GASTTCG GRT GSGTCT TGA -3′, and alkBF: 5′-AACT
ACA
TCG
AGC
ACT
ACG
G-3′ and alkBR: 5′-TGA
AGATGTGGTTGCTGTTCC-3′, along their thermal cycling parameters, were used24,25.
16S rRNA gene V3‑V4 library preparation and MiSeq sequencing. PCR amplification of the 16S
rRNA gene at the V3-V4 region was performed using the universal prokaryotic primers 515F (5′-GTGCCA
GCMGCCGCGGTAA-3′) and 806R (5′-GGACTACHVGGGTWTCTAAT-3′) with appended adaptor and bar-
codes sequences as previously reported26,27. Briefly, each PCR reaction was comprised of 1 × EmeraldAmp GT
PCR Master Mix (TaKaRa), 0.3 μM of each primer, and 50–100 ng of metagenomic DNA in a total volume of 50
μL. The PCR conditions were 94 °C 3 min, and 25 cycles of 94 °C 45 s, 50 °C 1 min and 72 °C 1 min 30 s, followed
by 72 °C 10 min. A minimum of two independent PCR reactions were performed and pooled to prevent PCR
stochastic bias. Then, the 381-bp amplicon was excised after agarose gel resolution and purified using a Pure-
DireX PCR Clean-Up & Gel Extraction Kit (Bio-Helix, Keelung, Taiwan) prior to quantification using a Qubit
3.0 Fluorometer and Qubit dsDNA HS assay kit (Invitrogen, Waltham, USA). Finally, 180 ng of each barcoded
amplicon product was pooled for sequencing using the Miseq300 platform (Illumina, San Diego, CA, USA),
along with the sequencing primers and index sequence26. Sequencing was performed at the Omics Sciences and
Bioinformatics Center, Chulalongkorn University (Bangkok, Thailand).
Bioinformatic analyses for bacterial microbiota diversity and potential metabolisms. Raw
sequences were processed according to Mothur version 1.39.1′s standard operating procedures for MiSeq28. Pro-
cesses of screening for the quality sequences included removal of (1) short read lengths of ≤ 100 nucleotides (nt)
excluding primer and barcode sequences, (2) ambiguous bases ≥ 8, (3) chimera sequences and (4) homopolymer
of ≥ 8 nt. The quality sequences were aligned against the 16S rRNA gene databases SILVA version 132 to remove
sequences of mitochondria, chloroplast, and eukaryotic l ineages29, and Greengenes version 13.8 for prediction of
taxonomy30. The sequences were classified into operational taxonomic unit (OTUs) based on the naïve Bayesian
taxonomic method and default parameters (sequence similarity in OTU clustering was 78% for phylum, 88%
order, 91% class, 93% family, 95% genus, and 97% species)31. Samples were normalized to an equal sequencing
depth (7,945 quality sequences per sample), and the count of total bacteria from the 16S rRNA gene qPCR data
were analyzed together with the percent microbiota composition from the 16S rRNA gene sequencing to yield
the quantitative microbiota32–34.
Mothur version 1.39.1 was used to estimate the sequencing coverage (Good’s coverage index), rarefaction
curve, alpha diversity (individual sample diversity: Chao richness and Shannon diversity), and beta diversity
based on thetayc dissimilarity coefficients among the samples’ quantitative microbiota and two-dimension non-
metric multidimensional scaling (NMDS)28,35. One-way ANOVA test was used to analyze the statistical sig-
nificance for alpha diversity (p < 0.05), and Analysis of molecular variance (AMOVA) was used to analyze the
statistical significance for beta diversity (p < 0.001). The frequencies of plant symbiosis bacteria and pathogenic
bacteria were identified from the respective list of plant symbiosis (growth promoting) and plant pathogenic bac-
teria available in the Virulence Factor Database (VFDB)36,37, and compared among manure samples. Functional
profiles of the microbial communities were predicted from the quantitative microbiota using PICRUSt (Phy-
logenetic Investigation of Communities by Reconstruction of Unobserved States), then the communities were
clustered from the predicted functional profiles by unweighted pair group with arithmetic mean (UPGMA), and
the functional profiles were statistically compared using STAMP (Statistical Analysis of Metagenomic Profiles)38.
Scientific Reports | (2021) 11:102 | https://doi.org/10.1038/s41598-020-80543-3 3
Vol.:(0123456789)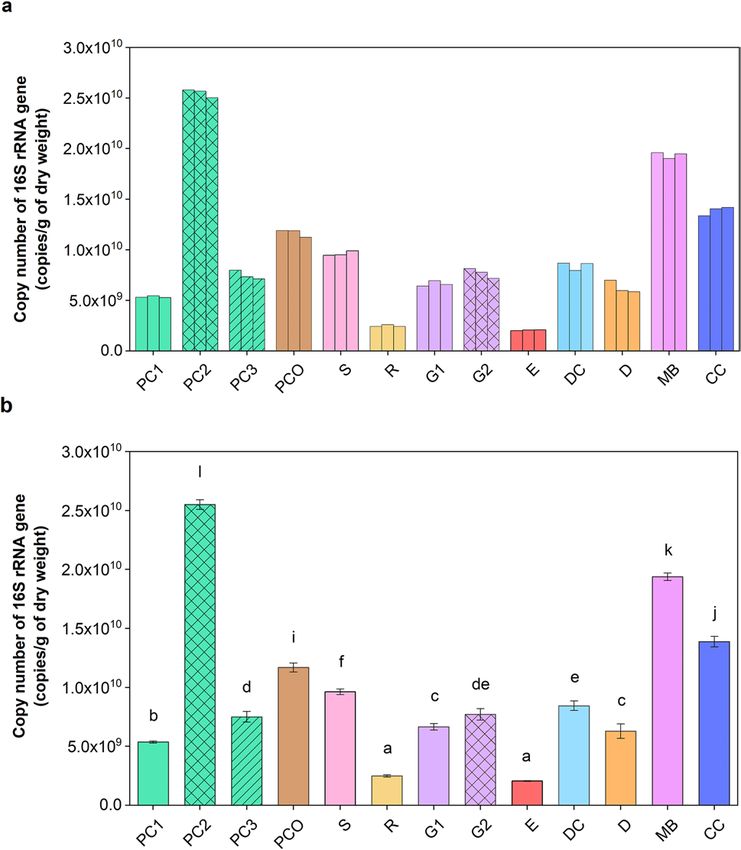
www.nature.com/scientificreports/

                                                            Nutrient compositions (µg/g)1
                                            Fecal manures   N                 P                      K                 FOM (%)
                                            (a)
                                            PC1             < 52              100.00 ± 0.00d         250.00 ± 50.00b   1.67 ± 0.29
                                                                                             c
                                            PC2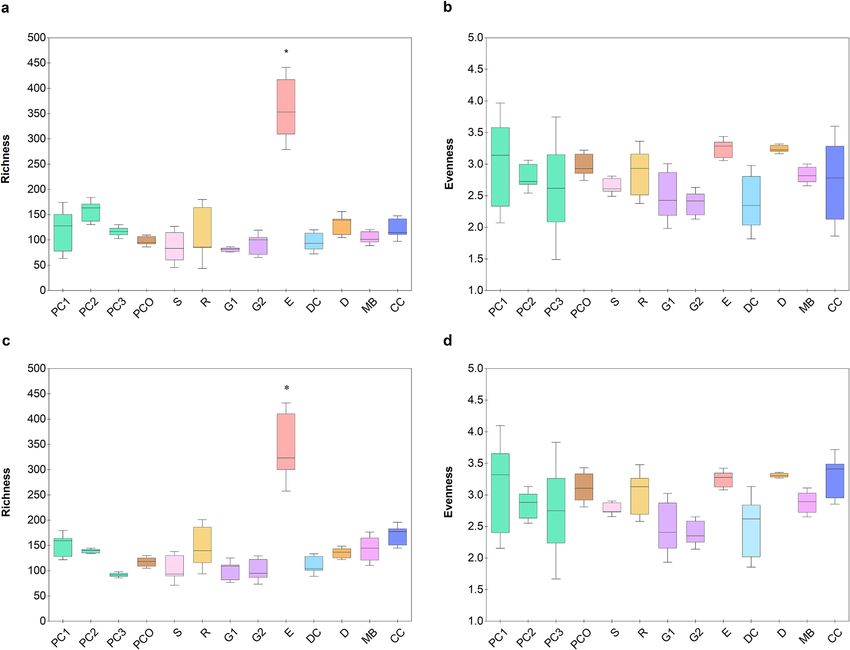
www.nature.com/scientificreports/
Figure 1. Quantification of 16S rRNA gene copies showing (a) the individual results from independent
triplicate repeats and (b) mean ± S.D., in different livestock manure samples (per g DW) using qPCR. In (b),
different letters above the bar indicated statistically significant differences among samples (one-way ANOVA
with Waller Duncan test, p < 0.05).
and E composts (Table 1b). The manure pH can change through reactions such as organic matter decomposition
that affects the availabilities of NPK39.
From the overall comparison of the NPK nutrients and physiochemical properties, the fecal manures from
the Phuparn chicken species might be less suitable as a fertilizer because of the poor N level, and high level of
salts and conductivity. Indeed, the manures from most species contained a low N level, and those from goat
and rabbit also had a relatively low water content (insufficient water for a plant to absorb nutrients from the soil
through the roots, to the trunk, leaves and fruits). A moderate water content in the manure was appropriate.
But of course, a somewhat low water level could be adjusted by adding water. The biophysiochemical quality
analyses of the manures suggested that the E manure would be appropriate as a fertilizer because of the enhanced
NPK levels, low salinity, low conductivity, slightly acidic-neutral pH, and a moderate water content (Table 1b).
Quantification of total bacteria in the fecal manures. The total number of bacteria in copies/g DW
fecal manure was derived from the 16S rRNA gene qPCR. Figure 1a showed the data were consistent between
independent triplicate samples, and that the E and R manures had the lowest bacterial counts (at 2.1 × 10⁹ and
2.5 × 10⁹ copies/g DW, respectively). The other animal fecal manures contained more than 5 × 10⁹ copies/g DW,
and the greatest bacterial load was found in PC2 and MB at 2.6 × 10¹⁰ and 1.9 × 10¹⁰ copies/g DW, respectively,
while PC1 and PC3 had a significantly lower level (p < 0.001 [PC1:PC2] and p = 0.001 [PC3:PC2]) (Fig. 1b).
Bacterial taxonomic profiles by 16S rRNA gene sequences. The 16S rRNA gene V3-V4 library
preparation and next generation sequencing were successful in that the number of raw and quality reads allowed
data normalization (N = 7945 quality reads per sample) that covered > 99% and > 98% of the sequencing coverage
of taxonomic compositions at the genus and species levels, respectively (Table 2). The average Good’s coverage
indices were 99.54% and 99.43% for the genus and species levels, respectively (Supplemental Table 1). This
was consistent with the plateau rarefaction curves, showing the frequencies of OTUs become constant despite
increasing sequencing reads, meaning a sufficient sequencing coverage was obtained (Supplemental Fig. 1).
Combining the count of total 16S rRNA gene copies with the OTU percent compositions gave the quantitative
number of copies of each OTU in a community. These quantitative microbiota data were then used to compute
the alpha and beta diversity measurements. The alpha diversity revealed that the microbiota of E had the relatively
most diverse OTUs at both the genus and species levels (Chao richness, Fig. 2a,c), regardless of having the lowest
total bacterial count (Fig. 1). The low total bacterial abundance but high diversity in E underlined that the various
OTUs of bacteria in E might be present in small numbers when compared to the copy numbers of OTUs in the
other animal manures. Note that the alpha diversity obtained by considering the distribution of general OTUs
among the different animal manures were similar (Shannon diversity, Fig. 2b,d).
Scientific Reports | (2021) 11:102 | https://doi.org/10.1038/s41598-020-80543-3 5
Vol.:(0123456789)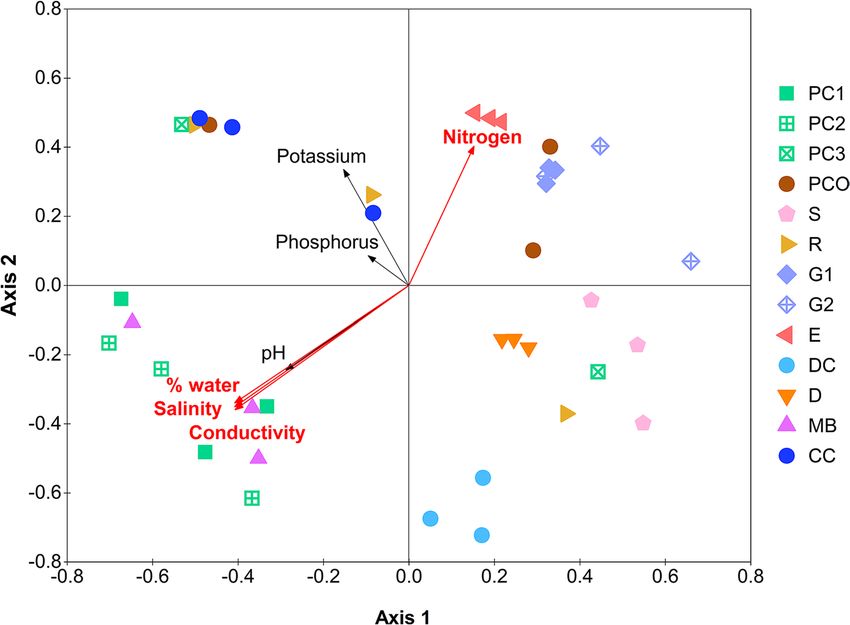
www.nature.com/scientificreports/
Fecal manure Sample ID Raw reads Quality reads OTUs Good’s coverage Chao Shannon
(a)
E_1 49,832 18,613 261 0.98930 380 3.16098
E E_2 33,624 12,371 309 0.98754 406.02 3.39099
E_3 28,559 10,894 310 0.98628 437.95652 3.47094
PC1_1 301,641 196,013 148 0.99584 174.4 3.59382
PC1 PC1_2 464,643 299,411 168 0.99484 198.37037 3.20792
PC1_3 372,058 246,862 106 0.99648 129.625 2.38559
PC2_1 243,712 159,192 144 0.99509 218.1 2.66204
PC2 PC2_2 270,242 176,288 155 0.99332 280.27272 3.02093
PC2_3 276,023 178,737 127 0.99597 154.55555 2.76922
PC3_1 317,279 206,799 107 0.99672 132 3.19780
PC3 PC3_2 371,787 237,351 116 0.99648 145.07692 3.27428
PC3_3 275,511 183,585 107 0.99584 147.61538 2.07227
PCO_1 209,667 108,003 104 0.99698 134.66666 3.20418
PCO PCO_2 279,425 168,142 115 0.99622 140.58823 2.78577
PCO_3 172,991 100,335 101 0.99761 109.55 2.89678
S_1 161,937 107,210 91 0.99622 163.5 2.80794
S S_2 320,353 205,017 83 0.99761 97.25 2.62696
S_3 218,944 198,614 88 0.99648 135.25 2.66646
R_1 98,546 93,085 120 0.99610 153.21428 3.21580
R R_2 136,011 127,435 165 0.99383 234.17647 2.51931
R_3 272,892 255,428 115 0.99622 146.07142 3.01602
G1_1 127,942 112,607 99 0.99786 112.6 2.87956
G1 G1_2 44,671 16,998 84 0.99711 109.3 2.17222
G1_3 82,404 29,752 92 0.99799 100 2.51211
G2_1 24,100 8,688 93 0.99748 108.83333 2.38991
G2 G2_2 22,265 8,204 86 0.99786 105.42857 2.23782
G2_3 20,917 7,945 100 0.99685 127.27272 2.57821
DC_1 119,376 114,228 130 0.99560 165 2.37328
DC DC_2 112,197 40,854 100 0.99685 142.85714 2.00946
DC_3 148,943 137,401 105 0.99698 151.5 2.82303
D_1 154,153 97,954 136 0.99585 165.33333 3.21510
D D_2 201,247 117,168 141 0.99610 162.13636 3.25661
D_3 211,853 115,864 150 0.99371 222.05882 3.29154
MB_1 146,008 135,114 126 0.99484 189.07692 2.82331
MB MB_2 134,925 128,005 146 0.99585 173.78947 3.04006
MB_3 132,775 125,347 124 0.99622 157.46153 2.68982
CC_1 186,002 173,315 182 0.99396 225.38461 3.39068
CC CC_2 130,352 122,980 121 0.99597 148.55555 2.07403
CC_3 180,039 171,258 119 0.99610 161.27272 2.81354
Fecal manure Sample ID OTUs Good’s coverage Chao Shannon
(b)
E_1 293 0.98754 396.2128 3.21184
E E_2 332 0.98351 521.2222 3.38902
E_3 325 0.98540 496.0256 3.46138
PC1_1 175 0.99358 230.4348 3.66648
PC1 PC1_2 185 0.99446 230.0476 3.34555
PC1_3 123 0.99534 174.2308 2.44652
PC2_1 162 0.99421 211.2857 2.68645
PC2 PC2_2 167 0.99308 249.5 3.02509
PC2_3 145 0.99421 214 2.92657
PC3_1 131 0.99459 195.5 3.31345
PC3 PC3_2 130 0.99622 163.4615 3.39241
PC3_3 114 0.99522 177.9091 2.26757
Continued
Scientific Reports | (2021) 11:102 | https://doi.org/10.1038/s41598-020-80543-3 6
Vol:.(1234567890)www.nature.com/scientificreports/
Fecal manure Sample ID OTUs Good’s coverage Chao Shannon
PCO_1 140 0.99408 200.0556 3.37754
PCO PCO_2 139 0.99471 200.5 2.94793
PCO_3 122 0.99534 182.5455 3.09510
S_1 115 0.99522 193.1111 2.84378
S S_2 109 0.99585 157 2.77461
S_3 98 0.99610 140.2727 2.74297
R_1 132 0.99610 157.8333 3.30997
R R_2 189 0.99295 248.2308 2.78897
R_3 127 0.99597 165.1538 3.10773
G1_1 130 0.99559 172.5 2.93511
G1 G1_2 92 0.99698 126.5 2.22541
G1_3 112 0.99648 146.3636 2.523160
G2_1 106 0.99660 129.4 2.40532
G2 G2_2 96 0.99736 115.0909 2.25199
G2_3 119 0.99509 180.75 2.59913
DC_1 134 0.99534 185.2308 2.49933
DC DC_2 118 0.99547 163 2.06601
DC_3 109 0.99723 120 2.82375
D_1 165 0.99396 210.12 3.28698
D D_2 178 0.99245 266.5 3.32280
D_3 166 0.99320 237.55 3.34855
MB_1 126 0.99660 140.04 2.89128
MB MB_2 176 0.99358 217.129 3.06995
MB_3 161 0.99383 217 2.82487
CC_1 199 0.99333 258.913 3.49072
CC CC_2 131 0.99547 166 2.33934
CC_3 142 0.99534 177.0526 2.91837
Table 2. Good’s coverage indices (estimated sequencing coverage) and alpha diversity indices of bacterial
taxonomic profiles by 16S rRNA gene sequences at the (a) genus and (b) species levels.
Figure 3a described the quantitative number of bacterial phylum OTUs. Proteobacteria, Firmicutes and Bacte-
roidetes were common in all manure samples. PC2 and CC were predominantly Proteobacteria (at 9.41 × 10⁹ and
7.24 × 10⁹ copies/g DW, respectively), and MB and also PC2 were predominantly Bacteroidetes (at 8.22 × 10⁹ and
9.03 × 10⁹ copies/g DW, respectively). Firmicutes were also moderately common in all the manures except for E.
The percentage abundance of genera above 1% were demonstrated in Fig. 3b, and was comprised of a total of 23
genera. The genus Ignatzschineria were responsible for the high Proteobacteria levels in PC2, MB and PC1, while
the genus Acinetobacter were responsible for the high Proteobacteria levels in the other animal manures except
for the E. Manures PC1, PC2 and MB contained all Bacteroides genera. Streptococcus was only found in PCO and
was relatively abundant (20.04%). Escherichia were relatively low in R, G2, E, DC and MB, while Treponema were
responsible for the high Spirochaetes levels in PC3, PCO and R at 3.63, 3.20 and 6.75%, respectively. Noted that
the diversified OTUs in E belonged to Bacteroidetes at 6.28%. Moreover, a proportionate percentage of unclas-
sified OTUs were presented in G1, G2, DC and E at 19.62, 41.86, 21.71 and 27.22%, respectively.
Relative frequencies of plant symbiotic and pathogenic bacterial genera. Plant symbiosis and
pathogenic bacteria were analysed across the different animal manures. Manures PC1-3, G1, G2 and CC dem-
onstrated generally abundant symbiotic bacteria comprised of the genera Pseudomonas, Bacillus, Arthrobac-
ter, Flavobacterium, Alcaligenes and Streptomyces (Fig. 4a). For examples, PC2 contained abundant Alcaligenes
(1.16 × 10¹⁰ cells/g DW), Pseudomonas (3.35 × 10⁹), Flavobacterium (2.82 × 10⁸) and Arthrobacter (3.8 × 10⁸).
Streptomyces was only found in G1, G2 and E in moderate numbers (5.9–29.0 × 10⁶ cells/g DW).
For the plant pathogenic bacteria, high levels were found in the manures that also contained high levels of
plant symbiosis bacteria (PC1-3, G1, G2 and CC), except for E, plus the other manures, such as S, D and MB.
The E had none of VFDB-listed plant pathogens. Thus, all manures except for E contained plant pathogenic
bacteria, and these were from Escherichia, Shigella, Enterococcus, Clostridium, Acinetobacter, Treponema, Staphy-
lococcus and Bacteroides (Fig. 4b). This finding correlated with the percent abundance of genera (Fig. 3b) where,
examples, Treponema were relatively high in PCO and PC3 at 2.03 × 10⁸ and 1.31 × 10⁸ cells/g DW, respectively.
Escherichia were relatively low in R and DC at 1.15 × 10⁵ and 2.06 × 10⁵ cells/g DW, respectively. In contrast,
only E did not contain any VFDB-listed plant pathogenic bacteria suggesting that E offers a plant pathogen-free
organic fertilizer.
Scientific Reports | (2021) 11:102 | https://doi.org/10.1038/s41598-020-80543-3 7
Vol.:(0123456789)www.nature.com/scientificreports/
Figure 2. Alpha diversity measurements of OTU compositions at (a,b) genus and (c,d) species levels, by
richness (Chao) and evenness (Shannon). Box plot with bar representing the mean from three sequencing
replicates, and asterisk (*) indicates a statistically significant difference by one-way ANOVA at p < 0.05.
Relationship among bacterial communities, and statistical correlation with the biophysio-
chemical properties. The NMDS demonstrated both the reproducibility of the data between the independ-
ent triplicate samples, except for R and PCO. The larger variation in bacterial communities were found generally
between the manures from different animal species, while the minor variation in bacterial communities were
found between the breeds, or the feeding diets. For examples, the variation in quantitative microbiota profiles
between G1, G2 and E, compared with PC1-3 (p = 0.085) and MB (p = 0.59) (Supplemental Fig. 2). Indeed, the
quantitative microbiota structures belonging to the six animal manures that had all the VFDB’s categorized plant
pathogens (PC, S, R, D and MB, except PCO) were rather distant from E (p = 0.101, 0.052, 0.089, 0.104 and 0.099,
respectively).
Seven parameters (NPK and four physiochemical properties) were analyzed for possible Pearson’s correla-
tion with any of the quantitative microbiota structures. The N level was strongly correlated (p = 0.01) to the
structures and in the same direction of the E (Fig. 5). The percent water, salinity and conductivity characteristics
were significant and associated in the direction opposite to E, and also to the G1, G2 and PCO microbiota struc-
tures. On the other hand, the PC1, PC2 and MB microbiota structures were strongly associated with the water
content, salinity and conductivity. These parameters are suggested to be important in controlling the diversity
of microbiota structures.
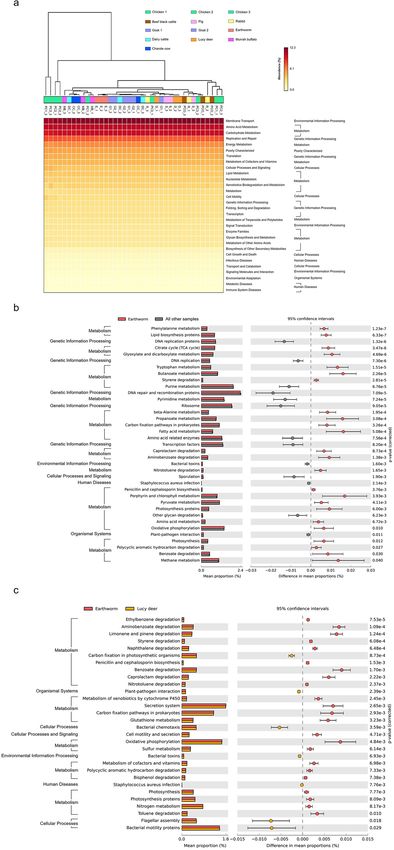
Predicted functional profiles from quantitative microbiota. Clustering by metabolic profiles sepa-
rated most of the PC communities, then PCO and CC, from the E clusters (Fig. 6a). The quantitative microbiota
in E demonstrated enhanced levels of COGs defined as metabolism, for instances, carbon fixation, oxidative
phosphorylation and photosynthesis pathways compared to the rests (Fig. 6b: p = 3.26 × 10⁻³, 0.01 and 0.012, in
order). The degradation functions of toxic compounds (xenobiotics) including styrene, caprolactam, aminoben-
zoate, nitrotoluene, polycyclic aromatic hydrocarbon and benzoate were also high in E compared to the rest
(p = 2.81 × 10⁻⁵, 8.73 × 10⁻⁴, 1.38 × 10⁻³, 1.65 × 10⁻³, 0.027 and 0.03, respectively), indicating that the earthworm
manure had a greater potential potency to degrade toxic compounds contaminated in the soil.
The KEGG categories of bacterial toxin, Staphylococcus aureus infection, and plant-pathogen interaction were
dominated statistically higher in the other manures than E (p = 1.6 × 10⁻³, 2.14 × 10⁻³ and 0.011, respectively),
in which the findings were correlated with Fig. 4b. Within the same metabolic profile clusters with E (Fig. 6a)
but carried all VFDB listed plant pathogens (Fig. 4b), the metabolic profile of D was selected for comparison
Scientific Reports | (2021) 11:102 | https://doi.org/10.1038/s41598-020-80543-3 8
Vol:.(1234567890)www.nature.com/scientificreports/
Figure 3. Analyses of bacterial community structures by (a) copy number of each phylum and (b) percent
abundance of each genus (heatmap showed only genera with > 1% abundance). In (b), the OTUs where Mothur
could not identify the genus name were denoted by small letters (p_ abbreviates phylum; o_, order; and f_,
family) to the deepest taxonomic names that could be identified.
with that of E to perhaps capture some metabolic differences that might involve pathogens. Consistently, anti-
bacterial compounds (i.e. biosynthesis of penicillin and cephalosporin, and antibiotic secondary metabolites)
Scientific Reports | (2021) 11:102 | https://doi.org/10.1038/s41598-020-80543-3 9
Vol.:(0123456789)www.nature.com/scientificreports/
Figure 4. Comparative number of bacterial genera categorized as plant (a) symbiotic or (b) pathogenic
genera across the different animal manures. Data represented mean ± S.D. List of bacteria categorized as plant
symbionts and pathogens were downloaded from the Virulence Factor Database (VFDB).
Scientific Reports | (2021) 11:102 | https://doi.org/10.1038/s41598-020-80543-3 10
Vol:.(1234567890)www.nature.com/scientificreports/
Figure 5. Relationship among bacterial communities via NMDS constructed from thetayc distance coefficients
among quantitative microbiota (stress value = 0.15, R2 = 0.86), and Pearson’s correlation with nutrients and
physiochemical properties (AMOVA, p < 0.001). A vector direction and length represented the direction and
strength of that nutrient or physiochemical factor to the communities. A red arrow with red font indicated a
statistically significant correlation (p < 0.05).
were higher in E (Fig. 6c), supporting the ability of the manure’s bacterial community to potentially protect
against plant pathogens40. Related plant pathogen functions (bacterial toxin, Staphylococcus aureus infection,
and plant-pathogen interactions) were statistically higher in D (Fig. 6c), resembling those in the other manures
(Fig. 6b: all other samples). Moreover, E had enhanced levels for carbon fixation and photosynthesis, which are
essential for plant growth (p = 2.93 × 10⁻³ and 7.77 × 10⁻³, respectively).
Discussion
Organic manures have been valued as one approach to improve soil quality for planting among Thai local farm-
ers. This study contributes a novel understanding of the assorted range of different local livestock manures by
their quantitative microbiota compositions using the advanced next generation sequencing, associated with
the manures’ nutrients and biophysiochemical properties. The NPK measurements revealed that the E manure
had high organic N and P levels, consistent with previous reports that earthworms in soil increased N, P and C
nutrients to support soil quality for plant g rowth41,42. The elevation of N and P levels in soil could also shift the soil
bacterial communities in a way to support common and copiotrophic bacteria (e.g. Actinobacteria and Alphapro-
teobacteria), while limiting Acidobacteria and Planctomycetes19,43. This is consistently related to our study where,
for example, the E manure showed relatively higher Actinobacteria and Alphaproteobacteria levels (4.89 × 10⁹ and
2.55 × 10⁹ cells/g DW, respectively) than those in the manures of the other animals. Although, the NPK and FOM
contents in E might be lower than agrochemical fertilizers, the organic minerals in E are safe for use in the soil
and our environmental ecosystems, and can add bacterial diversity to the chemically damaged soil.
Selection of the appropriate physiochemical properties (pH, salt, and ions) is essential for soil fertility. The
high salinity and electrical conductivity in the PC1-3 manures compared to the others, suggested that chicken
feces might not be an appropriate manure because the high ionic salts could interfere with the plant’s water
absorption and also cause an imbalance in nutrient ions. A dramatically low soil pH (< 5.5) was caused from the
long-term chemical fertilizer treatment. Here, none of the tested animal feces (manure) exhibited an acidic pH.
Rather, they exhibited a near neutral range pH of 6.2–6.8 in E, R and MB which was optimal for a fertile soil,
given the slight decrease of pH in E with its high N nutrient content could be due to an incomplete N cycling
erivative44.
activity leading to acidic d
The lower total bacterial biomass, yet higher alpha diversity (Chao, OTUs’ richness index) in E compared to
the other manures supported the fact that the earthworm gut lacks sufficient enzymes to digest OMs, but rather
the earthworm gut selects and stimulates microorganisms (thus the reduced total microbial biomass in the E) to
assist in the digestion of OMs. These include denitrifying bacteria that are able to survive in the reduced oxygen
condition of the earthworm g ut41,45,46. Further, the relatively high level of available N and P nutrients in the E
manure would increase the species richness by promoting copiotrophic m icroorganisms41.
Scientific Reports | (2021) 11:102 | https://doi.org/10.1038/s41598-020-80543-3 11
Vol.:(0123456789)www.nature.com/scientificreports/
Figure 6. Predictions of functional profiles into KEGG levels 2 and 3 from quantitative microbiota using
PICRUSt and STAMP. (a) On the top showing the clustering of functional profiles of manure samples by
UPGMA. The significantly different KEGG functions between (b) the earthworm and the average from the
other samples, and (c) the earthworm and Lucy deer, were compared using two-sided Welch’s t-test (corrected
p < 0.05).
Scientific Reports | (2021) 11:102 | https://doi.org/10.1038/s41598-020-80543-3 12
Vol:.(1234567890)www.nature.com/scientificreports/
Overall, Proteobacteria, Firmicutes and Bacteroidetes were found to be common phyla in all the manures (avg.
16.7, 31.3 and 15.9%, respectively), which was consistent with previous reports. For instances, the fecal microbiota
of horse, minipig and conventional pig were mainly comprised of the phyla Firmicutes and B acteroidetes23,47. The
low (3.3%) content of Firmicutes, gram-positive bacteria that can survive in desiccated and extreme conditions,
found in E supported an amiable fecal compost along with the NPK availabilities, low salinity, and conductivity;
hence the low presence of Firmicutes were present. The presence of Proteobacteria might be due to available
nutrients (NPK and C) in animal feces to support their growth19, where Proteobacteria promote nutrient cycling
to support soil bacterial growth.
In addition, the microbiota in E were found to be plant pathogen-free, and were comprised of every genus
listed as plant growth promoting bacteria, for examples, Pseudomonas, Streptomyces and Flavobacterium. These
bacteria function to assist soil nutrient cycling and plant growth, such as P. fluorescens and P. putida process nitro-
gen fixation and phosphate solubilization, and Flavobacterium processes (solubilizes) complex organic substrates
to simple forms for other species usages37,48. Subsequently, the presence of plant growth-promoting bacteria
was linked to the ability to support crop growth. Manures PC1-3 also contained high numbers of plant-growth
promoting bacteria (except for Streptomyces), but had a number of plant pathogens similar to the other animal
manures (except for E). Plant-pathogenic bacteria, such as Escherichia (e.g. E. coli), Shigella and Acinetobacter,
come from soil and animal fecal contaminations. Many species of Escherichia and Shigella synthesize toxins, and
some have been reported to be antibiotic-resistant (e.g. Acinetobacter baumannii), reducing the success of plant
treatment by a ntibiotics49. Treponema cause chronic venereal disease (syphilis). Thus, even the minor abundance
of some plant pathogens in fecal composts might be hazardous as an organic manure to enrich soil fertility for
crop growth. Consistently, previous studies reported that E enhance plant growth and soil biodiversity by promot-
ing beneficial bacteria, which could directly benefit plants via production of plant growth-regulating hormones
and enzymes, or indirectly via secondary metabolites that control plant pathogens, nematodes and other pests40.
However, our study analysis was limited to bacteria, while plant pathogens may be fungi.
In support of E, we observed rice and lemon planting results in our sampling local farms, and found that
rice kernels supplemented E were relatively healthy with fewer leaves, while those supplemented with CC, for
example, were withering with many leaves. Furthermore, many leaves could pose a risk for one of the most rice
pest named brown planthopper that directly damages rice cultivars by feeding and transmitting two viruses,
ragged stunt virus and rice grassy stunt virus. For lemon cultivars, using E was found relatively high in flower
stalking and fruiting (Chanabun, personal communication). Studies reported that earthworms’ guts (including
gut microbial communities) can digest various types of organic and even agro-industrial wastes into the reduced
organic carbon forms, which represent the more ready-to-use N, P and K forms for plants and soil microbiota50.
The vermicompost was thereby considered a powerful biofertilizer in sustainable agriculture, containing not only
nutrients but also potentially beneficial microbial communities41. Indeed, the presence of earthworms represents
one biological indicator of naturally arable soil, because its living could accelerate a soil bioconversion process
by 2–5 times faster compared to traditional composting (Chanabun, personal communication). Subsequently,
we analyzed two key microbial functional gene expressions in E that involve a soil bioconversion process, a
cytochrome-containing nitrite reductase (nirS) and an alkane monooxygenase (alkB). The nirS functions in
denitrification in nitrogen cycling and alkB functions in alkane biodegradation, respectively. Comparing among
E, D and MB, E had the relatively greatest nirS and alkB copies while the total bacterial copy number (16S rRNA)
was lowest (Supplemental Fig. 3). This finding was consistent with the high metabolisms of “nitrogen metabolism”
and “alkene degradation” predicted from the E’s quantitative microbiota using PICRUSt (Fig. 6b,c). The PICRUSt
algorithm has been used to predict the functional features of the bacterial community in environmental samples,
including soil and fecal manure. For instances, Wang et al.51 analyzed metabolism functions of bacterial com-
munity from microbiota data using PICRUSt in different phases of a swine composting system. In 2019, Meng
et al. utilized PICRUSt to analyze metabolic potentials from daily livestock manure microbiota and found that
metabolisms of amino acids, lipids and carbohydrates were similar to the previous r eports52. Therefore, our E
quantitative microbiota and functional analyses revealed the understanding of the E.
Different earthworm species have previously been reported to contain different bacterial richness and
diversity41. This study reported the influences that affect the microbiota diversity and microbial metabolic poten-
tials in livestock manures that were found different between animal genera and species (e.g. PCO vs. CC), and
animal feeds (G1 vs. G2). Analyses of statistical correlations suggested the importance of available N, conductiv-
ity, salinity, and water content, in regulating the quantitative microbiota structures and the microbial metabolic
functions. Worthy for our further ongoing studies are effects of (1) these organic manure farmlands compared
with long-term chemical farmlands, (2) different species of earthworms, and (3) the appropriate feed diets and
beddings for earthworm manures (fecal and urea composts).
Conclusion
Total microbial biomass and microbial community structures were characterized from the manures of different
livestock species and breeds, and livestock diets. These fecal manures showed differences in available nutrients
and physiochemical properties that could affect the soil fertility for crop growth. The most appropriate live-
stock manures among the different animal species and feeds analyzed in this study was the E manure due to its
appropriate fecal composition, as well as the bacterial communities, which consisted of several plant promoters
but no plant pathogens, and metabolic potentials that involved many nutrient cyclings, complex phosphate or
other xenobiotics degradation, and bioactive compounds. The favorable microbial community in this E manure
is expected to support soil fertility and crop health.
Scientific Reports | (2021) 11:102 | https://doi.org/10.1038/s41598-020-80543-3 13
Vol.:(0123456789)www.nature.com/scientificreports/
Data availability
Nucleic acid sequences in this study were deposited in an NCBI open access Sequence Read Archive database,
accession number SRP246309.
Received: 18 February 2020; Accepted: 23 December 2020
References
1. Hou, P. F. et al. Paddy-upland rotation for sustainable agriculture with regards to diverse soil microbial community. Sci. Rep. 8,
7966. https://doi.org/10.1038/s41598-018-26181-2 (2018).
2. Hu, J. et al. Probiotic diversity enhances rhizosphere microbiome function and plant disease suppression. mBio 7, 1. https://doi.
org/10.1128/mBio.01790-16 (2016).
3. Meliani, A., Bensoltane, A. & Mederbel, K. Microbial diversity and abundance in soil: Related to plant and soil type. Am. J. Plant
Nutr. Fertil. Tech. 2, 10–18. https://doi.org/10.3923/ajpnft .2012.10.18 (2012).
4. O’Donnell, A. G., Seasman, M., Macrae, A., Waite, I. & Davies, J. T. Plants and fertilisers as drivers of change in microbial com-
munity structure and function in soils. Plant Soil 232, 135–145. https://doi.org/10.1023/A:1010394221729 (2001).
5. Gaiero, J. R. et al. Inside the root microbiome: Bacterial root endophytes and plant growth promotion. Am. J. Bot. 100, 1738–1750.
https://doi.org/10.3732/ajb.1200572 (2013).
6. Choenkwan, S., Fox, M. J. & Rambo, A. T. Agriculture in the mountains of Northeastern Thailand: Current situation and prospects
for development. MRD 34, 95–106. https://doi.org/10.1659/MRD-JOURNAL-D-13-00121.1 (2014).
7. Office of the national economic and social development board. The eleventh national economic and social development plan
(2012–2016). Preprint at https://www.nesdb.go.th/nesdb_en/ewt_dl_link.php?nid=3786. (2011).
8. Nganchamung, T., Robson, M. G. & Siriwong, W. Chemical fertilizer use and acute health effects among chili farmers in Ubon
Ratchathani province Thailand. J. Health Res. 31, 427–435. https://doi.org/10.14456/jhr.2017.53 (2017).
9. Savci, S. Investigation of effect of chemical fertilizers on environment. APCBEE Proc. 1, 287–292. https://doi.org/10.1016/j.apcbe
e.2012.03.047 (2012).
10. Ramirez, K. S., Lauber, C. L., Knight, R., Bradford, M. A. & Fierer, N. Consistent effects of nitrogen fertilization on soil bacterial
communities in contrasting systems. Ecology 91, 3463–3470. https://doi.org/10.1890/10-0426.1 (2010).
11. Coolon, J. D., Jones, K. L., Todd, T. C., Blair, J. M. & Herman, M. A. Long-term nitrogen amendment alters the diversity and
assemblage of soil bacterial communities in tallgrass prairie. PLoS ONE 8, e67884. https://doi.org/10.1371/journal.pone.0067884
(2013).
12. Sun, R., Zhang, X. X., Guo, X., Wang, D. & Chu, H. Bacterial diversity in soils subjected to long-term chemical fertilization can be
more stably maintained with the addition of livestock manure than wheat straw. Soil Biol. Biochem. 88, 9–18 (2015).
13. Lin, W. W. et al. The effects of chemical and organic fertilizer usage on rhizosphere soil in tea orchards. PLoS ONE 14, 1. https://
doi.org/10.1371/journal.pone.0217018 (2019).
14. Tikam, K. et al. Pangola grass as forage for ruminant animals: a review. Springerplus 2, 1. doi:https://doi.org/10.1186/2193-1801-
2-604 (2013).
15. Tikam, K. et al. In vitro gas production, in vivo nutrient digestibilities, and metabolisable energy concentrations for sheep of fresh
and conserved pangola grass. Small Ruminant. Res. 128, 34–40. https://doi.org/10.1016/j.smallrumres.2015.05.002 (2015).
16. Boonthongniem, N. Number of livestock inventory in Thailand on 2019. Department of Livestock Development, Ministry of
Agriculture and Cooperatives. Preprint at http://ict.dld.go.th/webnew/index.php/en/service-ict/report/247-report-thailand-lives
tock (2019).
17. Chaudhry, V., Rehman, A., Mishra, A., Chauhan, P. S. & Nautiyal, C. S. Changes in bacterial community structure of agricultural
land due to long-term organic and chemical amendments. Microb. Ecol. 64, 450–460. https://doi.org/10.1007/s00248-012-0025-y
(2012).
18. Ushio, K., Wagai, R., Balser, T. C. & Kitayama, K. Variations in the soil microbial community composition of a tropical montane
forest ecosystem: Does tree species matter?. Soil Biol. Biochem. 40, 2699–2702. https: //doi.org/10.1016/j.soilbi o.2008.06.023 (2008).
19. Wang, R. et al. Microbial community composition is related to soil biological and chemical properties and bacterial wilt outbreak.
Sci. Rep. 7, 343. https://doi.org/10.1038/s41598-017-00472-6 (2017).
20. Faber, B. A., Downer, A. J., Holstege, D. & Mochizuki, M. J. Accuracy varies for commercially available soil test kits analyzing
nitrate–nitrogen, phosphorus, potassium, and pH. Horttechnology 17, 358–362 (2007).
21. O’Kelly, B. C. Oven-drying characteristics of soils of different origins. Dry Technol. 23, 1141–1149. https://doi.org/10.1081/DRT-
200059149 (2005).
22. Suzuki, M. T., Taylor, L. T. & DeLong, E. F. Quantitative analysis of small-subunit rRNA genes in mixed microbial populations via
5’-nuclease assays. Appl. Environ. Microbiol. 66, 4605–4614. https://doi.org/10.1128/aem.66.11.4605-4614.2000 (2000).
23. Oldham, A. L. & Duncan, K. E. Similar gene estimates from circular and linear standards in quantitative PCR analyses using the
prokaryotic 16S rRNA gene as a model. PLoS ONE 7, e51931. https://doi.org/10.1371/journal.pone.0051931 (2012).
24. Powell, S. M., Ferguson, S. H., Bowman, J. P. & Snape, I. Using real-time PCR to assess changes in the hydrocarbon-degrading
microbial community in Antarctic soil during bioremediation. Microb. Ecol. 52, 523–532. https://doi.org/10.1007/s00248-006-
9131-z (2006).
25. Throback, I. N., Enwall, K., Jarvis, A. & Hallin, S. Reassessing PCR primers targeting nirS, nirK and nosZ genes for community
surveys of denitrifying bacteria with DGGE. FEMS Microbiol. Ecol. 49, 401–417. https://doi.org/10.1016/j.femsec.2004.04.011
(2004).
26. Caporaso, J. G. et al. Ultra-high-throughput microbial community analysis on the Illumina HiSeq and MiSeq platforms. ISME J.
6, 1621–1624. https://doi.org/10.1038/ismej.2012.8 (2012).
27. Bulan, D. E. et al. Spatial and seasonal variability of reef bacterial communities in the Upper Gulf of Thailand. Front. Mar. Sci. 5,
1. https://doi.org/10.3389/fmars.2018.00441 (2018).
28. Schloss, P. D. et al. Introducing mothur: open-source, platform-independent, community-supported software for describing and
comparing microbial communities. Appl. Environ. Microbiol. 75, 7537–7541. https://doi.org/10.1128/AEM.01541-09 (2009).
29. Pruesse, E. et al. SILVA: A comprehensive online resource for quality checked and aligned ribosomal RNA sequence data compat-
ible with ARB. Nucleic Acids Res. 35, 7188–7196. https://doi.org/10.1093/nar/gkm864 (2007).
30. McDonald, D. et al. An improved Greengenes taxonomy with explicit ranks for ecological and evolutionary analyses of bacteria
and archaea. ISME J. 6, 610–618. https://doi.org/10.1038/ismej.2011.139 (2012).
31. Wang, Q., Garrity, G. M., Tiedje, J. M. & Cole, J. R. Naive Bayesian classifier for rapid assignment of rRNA sequences into the new
bacterial taxonomy. Appl. Environ. Microbiol. 73, 5261–5267. https://doi.org/10.1128/AEM.00062-07 (2007).
32. Total bacterial quantification via qPCR. Microbiome insights services network. https://microbiomeinsights.com/qpcr-2/ (2020).
33. Vandeputte, D. et al. Quantitative microbiome profiling links gut community variation to microbial load. Nature 551, 507–511.
https://doi.org/10.1038/nature24460 (2017).
Scientific Reports | (2021) 11:102 | https://doi.org/10.1038/s41598-020-80543-3 14
Vol:.(1234567890)www.nature.com/scientificreports/
34. Jian, C., Luukkonen, P., Yki-Järvinen, H., Salonen, A. & Korpela, K. Quantitative PCR provides a simple and accessible method
for quantitative microbiome profiling. Preprint at https://europepmc.org/article/PPR/PPR62951. (2018).
35. Schloss, P. D. Reintroducing mothur: 10 years later. Appl. Environ. Microbiol. 86, 1. https: //doi.org/10.1128/AEM.02343- 19 (2020).
36. Yang, J. The virulence factor database (VFDB) http://www.mgc.ac.cn/cgi-bin/VFs/v5/main.cgi (2019).
37. Hayat, R., Ali, S., Amara, U., Khalid, R. & Ahmed, I. Soil beneficial bacteria and their role in plant growth promotion: A review.
Ann. Microbiol. 60, 579–598. https://doi.org/10.1007/s13213-010-0117-1 (2010).
38. Langille, M. G. et al. Predictive functional profiling of microbial communities using 16S rRNA marker gene sequences. Nat.
Biotechnol. 31, 814–821. https://doi.org/10.1038/nbt.2676 (2013).
39. Huang, N. et al. The influence of different concentrations of bio-organic fertilizer on cucumber Fusarium wilt and soil microflora
alterations. PLoS ONE 12, e0171490. https://doi.org/10.1371/journal.pone.0171490 (2017).
40. Pathma, J. & Sakthivel, N. Microbial diversity of vermicompost bacteria that exhibit useful agricultural traits and waste manage-
ment potential. Springerplus 1, 26. https://doi.org/10.1186/2193-1801-1-26 (2012).
41. Medina-Sauza, R. M. et al. Earthworms building up soil microbiota: A review. Front. Environ. Sci. 7, 81. https://doi.org/10.3389/
fenvs.2019.00081 (2019).
42. Bertrand, M. et al. Earthworm services for cropping systems: A review. Agron. Sustain. Dev. 35, 553–567. https://doi.org/10.1007/
s13593-014-0269-7 (2015).
43. Leff, J. W. et al. Consistent responses of soil microbial communities to elevated nutrient inputs in grasslands across the globe. Proc.
Natl. Acad. Sci. USA 112, 10967–10972. https://doi.org/10.1073/pnas.1508382112 (2015).
44. Bolan, N. S., Hedley, M. J. & White, R. E. Processes of soil acidification during nitrogen cycling with emphasis on legume based
pastures. Plant Soil 134, 53–63. https://doi.org/10.1007/Bf00010717 (1991).
45. Fujii, K., Ikeda, K. & Yoshida, S. Isolation and characterization of aerobic microorganisms with cellulolytic activity in the gut of
endogeic earthworms. Int Microbiol 15, 121–130. https://doi.org/10.2436/20.1501.01.165 (2012).
46. Drake, H. L. & Horn, M. A. As the worm turns: the earthworm gut as a transient habitat for soil microbial biomes. Annu. Rev.
Microbiol 61, 169–189. https://doi.org/10.1146/annurev.micro.61.080706.093139 (2007).
47. Salem, S. E. et al. Variation in faecal microbiota in a group of horses managed at pasture over a 12-month period. Sci. Rep. 8, 8510.
https://doi.org/10.1038/s41598-018-26930-3 (2018).
48. Ma, Y., Rajkumar, M., Zhang, C. & Freitas, H. Beneficial role of bacterial endophytes in heavy metal phytoremediation. J. Environ.
Manage 174, 14–25. https://doi.org/10.1016/j.jenvman.2016.02.047 (2016).
49. Peleg, A. Y., Seifert, H. & Paterson, D. L. Acinetobacter baumannii: emergence of a successful pathogen. Clin. Microbiol. Rev. 21,
538–582. https://doi.org/10.1128/CMR.00058-07 (2008).
50. Bhat, S. A., Singh, J. & Vig, A. P. Earthworms as organic waste managers and biofertilizer producers. Waste Biomass Valori 9,
1073–1086. https://doi.org/10.1007/s12649-017-9899-8 (2018).
51. Wang, K., Mao, H., Wang, Z. & Tian, Y. Succession of organics metabolic function of bacterial community in swine manure com-
posting. J. Hazard. Mater. 360, 471–480. https://doi.org/10.1016/j.jhazmat.2018.08.032 (2018).
52. Meng, Q. et al. Bacterial community succession in dairy manure composting with a static composting technique. Can. J. Microbiol.
65, 436–449. https://doi.org/10.1139/cjm-2018-0560 (2019).
Acknowledgements
The authors acknowledged the Phuparn Royal Development Study Centre, Sakon Nakhon, for collection of the
fecal manure samples, Julia N. Adams for language editing, and thanked Piraya Chathanathon, Matanee Palasuk
and Alisa Wilantho for technical assistances. This research was supported by the Thai Government Budget
Grant (GB-A 61 024 23 05), Microbiome Research Unit for Probiotics in Food and Cosmetics, Chulalongkorn
University, Center of Excellence on Biodiversity (BDCPG1-163001), and LW is supported by the Ratchadapisek
Somphot Fund for Postdoctoral Fellowship, Chulalongkorn University.
Author contributions
L.W. performed molecular biology experiments and data analysis, and wrote the manuscript. R.C. provided sam-
ples and advised. N.T. helped molecular biology experiment. P.P. advised. S.P. advised and wrote the manuscript.
N.S. conceived and designed the study, coordinated the experiments and data analysis, and wrote the manuscript.
All authors read and approved the final manuscript.
Competing interests
The authors declare no competing interests.
Additional information
Supplementary Information The online version contains supplementary material available at https://doi.
org/10.1038/s41598-020-80543-3.
Correspondence and requests for materials should be addressed to N.S.
Reprints and permissions information is available at www.nature.com/reprints.
Publisher’s note Springer Nature remains neutral with regard to jurisdictional claims in published maps and
institutional affiliations.
Open Access This article is licensed under a Creative Commons Attribution 4.0 International
License, which permits use, sharing, adaptation, distribution and reproduction in any medium or
format, as long as you give appropriate credit to the original author(s) and the source, provide a link to the
Creative Commons licence, and indicate if changes were made. The images or other third party material in this
article are included in the article’s Creative Commons licence, unless indicated otherwise in a credit line to the
material. If material is not included in the article’s Creative Commons licence and your intended use is not
permitted by statutory regulation or exceeds the permitted use, you will need to obtain permission directly from
the copyright holder. To view a copy of this licence, visit http://creativecommons.org/licenses/by/4.0/.
© The Author(s) 2021
Scientific Reports | (2021) 11:102 | https://doi.org/10.1038/s41598-020-80543-3 15
Vol.:(0123456789)You can also read