Journal of Hydrology: Regional Studies - Global Institute for Water Security
←
→
Page content transcription
If your browser does not render page correctly, please read the page content below
Journal of Hydrology: Regional Studies 36 (2021) 100834
Contents lists available at ScienceDirect
Journal of Hydrology: Regional Studies
journal homepage: www.elsevier.com/locate/ejrh
Tracers reveal limited influence of plantation forests on surface
runoff in a UK natural flood management catchment
Leo M. Peskett a, *, Kate V. Heal a, Alan M. MacDonald b, Andrew R. Black c,
Jeffrey J. McDonnell d, e
a
University of Edinburgh, School of GeoSciences, Crew Building, Alexander Crum Brown Road, Edinburgh, EH9 3FF, United Kingdom
b
British Geological Survey, The Lyell Centre, Research Avenue South, Edinburgh, EH14 4AP, United Kingdom
c
Geography and Environmental Science, Tower Building, University of Dundee, Dundee, DD1 4HN, United Kingdom
d
Global Institute for Water Security, School of Environment and Sustainability, University of Saskatchewan, Saskatoon, SK, S7N 3H5, Canada
e
School of Geography, Earth and Environmental Sciences, University of Birmingham, Birmingham, B15 2TT, United Kingdom
A R T I C L E I N F O A B S T R A C T
Keywords: Study region: United Kingdom (UK).
Flooding Study focus: Natural flood management (NFM) schemes are increasingly prominent in the UK.
Upland catchments Studies of NFM have not yet used natural tracers at catchment scale to investigate how in
Stable isotopes
terventions influence partitioning during storms between surface rainfall runoff and water
Runoff attenuation
Afforestation
already stored in catchments. Here we investigate how catchment properties, particularly plan
Hydrograph separation tation forestry, influence surface storm rainfall runoff. We used hydrograph separation based on
hydrogen and oxygen isotopes (2H, 18O) and acid neutralising capacity from high flow events to
compare three headwater catchments (2.4-3.1 km2) with differences in plantation forest cover
(Picea sitchensis: 94%, 41%, 1%) within a major UK NFM pilot, typical of the UK uplands.
New hydrological insights: Plantation forest cover reduced the total storm rainfall runoff fraction
during all events (by up to 11%) when comparing two paired catchments with similar soils,
geology and topography but ~50% difference in forest cover. However, comparison with the
third catchment, with negligible forest cover but different characteristics, suggests that soils and
geology were dominant controls on storm rainfall runoff fraction. Furthermore, differences be
tween events were greater than differences between catchments. These findings suggest that
while plantation forest cover may influence storm rainfall runoff fractions, it is not a dominant
control in temperate upland UK catchments, especially for larger events. Soils and geology may
exert greater influence, with implications for planning NFM.
1. Introduction
There is increasing interest globally in the use of nature-based solutions for flood risk management and disaster risk reduction (EEA,
2017; World Bank, 2018). In the UK, one manifestation of nature-based solutions is a new wave of policies and projects in support of
natural flood management (NFM) (Dadson et al., 2017; Kay et al., 2019; Lane, 2017). These policies promote a catchment-wide
* Corresponding author.
E-mail addresses: leo.peskett@ed.ac.uk, k.heal@ed.ac.uk (L.M. Peskett), amm@bgs.ac.uk (A.M. MacDonald), a.z.black@dundee.ac.uk
(A.R. Black), jeffery.mcdonnell@usask.ca (J.J. McDonnell).
https://doi.org/10.1016/j.ejrh.2021.100834
Received 3 December 2020; Received in revised form 12 March 2021; Accepted 15 May 2021
Available online 24 May 2021
2214-5818/© 2021 The Authors. Published by Elsevier B.V. This is an open access article under the CC BY license
(http://creativecommons.org/licenses/by/4.0/).
L.M. Peskett et al. Journal of Hydrology: Regional Studies 36 (2021) 100834
approach to flood risk management, through interventions aimed at reducing surface runoff (e.g. tree planting and livestock man
agement) and slowing the flow of water in rivers (e.g. leaky wooden dams and re-meandering) during flood events (Dadson et al., 2017;
Environment Agency, 2017). There are now over 94 NFM projects in the UK, but monitoring and quantitative assessment of these
schemes remain low, and evidence of effectiveness is limited (Dadson et al., 2017; Environment Agency, 2020; Hankin et al., 2017; Kay
et al., 2019; NFM Network Scotland, 2020). Key challenges surround how to determine the effectiveness of NFM at larger scales (>50
km2) as well as understanding the behaviour of NFM schemes under different storm or antecedent conditions (Dadson et al., 2017).
Addressing these challenges requires considerable understanding of hydrological processes in NFM catchments and the application of
techniques, such as tracers, that can help assess processes at scale and using different measures of catchment response.
A focal area of NFM policy surrounds the potential for afforestation in catchment headwaters to reduce rapid runoff during storm
events through increased interception, infiltration and surface roughness (Ngai et al., 2017). However, the effects of woodland creation
on reducing peak flows are not clear in UK catchments (Bathurst et al., 2020; Carrick et al., 2018; Stratford et al., 2017). Discerning the
impact of afforestation on runoff depends on the ability to detect changes in flood peak magnitude or timing following interventions, as
well as understanding the underlying processes through which forest cover influences water movement in catchments (Zégre et al.,
2010). Paired catchment studies have been widely used to detect changes but are subject to challenges such as lack of comparability
between treatment and control catchments, short time series and small sample sizes (Alila et al., 2009; Bosch and Hewlett, 1982;
Brown et al., 2005). Model-based change detection provides an alternative approach that has also been widely used. However, as
sumptions about the stationarity of catchment processes in pre- and post-treatment periods have rarely been tested and uncertainties
evaluated (Zégre et al., 2010). There are also many challenges involved in parameterisation, such as representing surface roughness,
which is affected by land use and seasonal vegetation changes (Bond et al., 2020). While model-based change detection can be applied
in ways that allow for the exploration of input parameters (Seibert and McDonnell, 2010), neither this approach nor paired catchment
studies give direct insights into hydrological processes.
Research on how afforestation impacts on hydrological processes complements change detection studies by helping to identify
dominant runoff mechanisms and the relative importance of different catchment characteristics in controlling flow paths (Geris et al.,
2015). Understanding these relationships is particularly important from a management perspective as it may help to identify how and
where to locate afforestation within catchments (Murphy et al., 2020). For example, the impact of afforestation or forest removal on
runoff processes may be highly variable depending on soil type, soil depth and bedrock permeability, which affect catchment storage
(Pfister et al., 2017), as well as forest management practices such as the type of trees, planting configuration and drainage (Archer
et al., 2013; Lunka and Patil, 2016; Robinson, 1986, 1998). It is also necessary to understand the relative importance of meteorological
factors, such as the magnitude and duration of rainfall events and antecedent wetness conditions, on runoff mechanisms. Evidence in
the UK suggests that NFM is unlikely to be effective during the largest events (Dadson et al., 2017).
So how can such process effects of forest cover be detected in natural systems? Conservative, naturally occurring tracers, such as 2H
and 18O can be used in hydrograph separation as a method for investigating runoff mechanisms (Kendall and McDonnell, 1998). Such
tracers can help determine the degree to which event rainfall, versus water already stored in the catchment (pre-event water), con
tributes to storm runoff. Many studies have demonstrated the dominance of pre-event water in runoff, which has changed perceptions
of runoff mechanisms (Klaus and McDonnell, 2013). This has shifted the emphasis of catchment process studies towards questions of
how stored water can be quickly mobilised during storm events, which in turn raises questions about infiltration, threshold behaviour
and connectivity that could be influenced by catchment management (Bracken et al., 2013). These issues warrant consideration in a
NFM context. A common perception in current NFM practice (as in earlier waves of upland environmental management (Neal et al.,
1997)) is of event runoff originating primarily as rapid overland flow of event water from saturated variable source areas, which does
not place enough emphasis on the potentially important role of water already stored in the catchment. Surprisingly, tracers have not
been used more in change detection studies, despite early work that showed how in land use studies, changes in the source components
of flow were not revealed by simple hydrograph analysis (Gremillion et al., 2000). To our knowledge, NFM projects have not yet been
the subject of catchment scale tracer-based studies or used tracers to evaluate assumptions about management efficacy based on source
components.
What do we know about source components in catchments like those targeted for NFM? Pre-event water contributions have been
found to vary with catchment characteristics. In general there is an increase in event water runoff on a rural to urban gradient
(Hasenmueller et al., 2017; Klaus and McDonnell, 2013). Early work showed that event-water contributions are inversely related to
catchment size (Brown et al., 1999) and that pre-event water increases with increasing antecedent wetness (Muñoz-Villers and
McDonnell, 2012). Forests influence throughfall volumes, soil infiltration rates and subsurface connectivity, which can result in greater
subsurface flow and higher pre-event water in streams (Buttle, 1994). Grasslands have been shown to have higher event water fractions
(Bonell et al., 1990; Muñoz-Villers and McDonnell, 2013; Roa-García and Weiler, 2010). These land cover effects are influenced by
catchment soils and topography: catchments with thin soils and steeper slopes often have higher event water fractions (Suecker et al.,
2000).
Here we use hydrograph separation to test the impact of catchment interventions on the source components of peak flows. We
follow the Gremillion et al. (2000) idea that tracer-based hydrograph separations will reveal possible differences in flow pathways that
could be useful for planning and evaluating NFM, even if there are no discernible changes to the timing and magnitude of storm
hydrographs. Our work uses additional tracers for hydrograph separation to further unpick the time- and geographic-based compo
nents of runoff sources and pathways. While there are some challenges in using tracer-based approaches (Klaus and McDonnell, 2013),
there are a number of ways in which this approach could be valuable in planning and monitoring NFM in addition to more standard
hydrological methods. It can help in understanding the relative importance of shallow subsurface flow within soils (which might be
influenced by changes to soil management) and deeper subsurface flow within bedrock (which is more difficult to influence).
2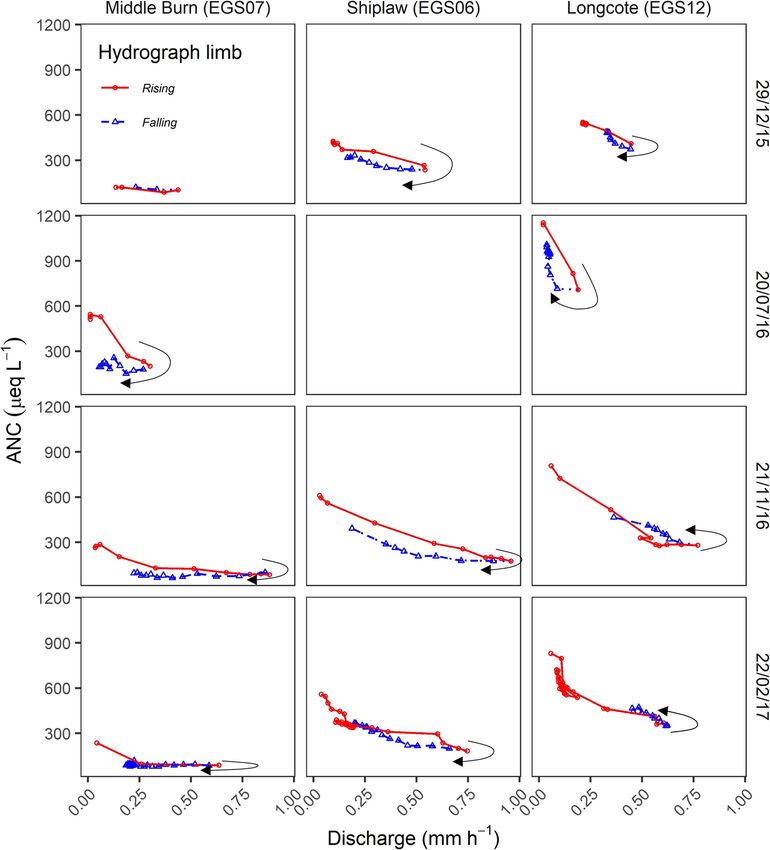
L.M. Peskett et al.       Journal of Hydrology: Regional Studies 36 (2021) 100834

                                                        (caption on next page)

                      3
L.M. Peskett et al.                                                                                Journal of Hydrology: Regional Studies 36 (2021) 100834

Fig. 1. Maps of the study site. a) location of the Eddleston Water catchment (including TBR rain gauges and weather station locations) highlighting
the three catchments (pink outline shows catchment boundaries) where event sampling was carried out (red arrow indicates stream flow direction);
b) monitoring network in the three sub-catchments and sub-catchment topography (red arrows indicate stream flow direction). Automatic water
samplers were located adjacent to stream gauges; c) sub-catchment land use; d) sub-catchment soil cover (‘Mobol’ is undifferentiated mixed bottom
land); e) sub-catchment geology. R. sampler (seq): sequential rainfall sampler; TBR / S R.gauge: paired tipping bucket and storage rain gauges. At
the time of the study, forest cover figures in the Middle Burn and Shiplaw catchments, respectively, included ~25% and ~10% recently felled forest,
with stumps left in the ground.

Tracer-based hydrograph separation has a physical basis that is lacking in most standard hydrometric separation methods (Klaus and
McDonnell, 2013). When applied at high resolution through storm events, tracers can reveal not just the proportions of different runoff
components during events but the timing of different components during individual event hydrographs (e.g. whether flood peaks are
dominated by event rainfall). Finally, tracers can help in evaluating the co-benefits and risks of different types of interventions, for
example by helping to investigate flow paths and residence times of water around interventions such as field buffer strips (Novara
et al., 2013; Wilkinson et al., 2014).
    We report tracer-based hydrograph separation (2H/18O and acid neutralising capacity (ANC)) in three neighbouring catchments
within a wider 70 km2 pilot NFM project in the UK uplands. Two of these catchments are paired, with similar soils, geology and
topography but ~50% difference in forest cover. The third catchment, with the lowest forest cover, has some differences in underlying
characteristics, but is representative of the range of conditions in the wider NFM project. We test the null hypothesis that plantation
forest cover has no influence on the source components of runoff. We then further investigate the relative influence of catchment and
storm event characteristics on fractions of event and groundwater runoff.
    The main questions addressed in the research were:

 1 What is the effect of plantation forest cover on the fraction of event water runoff?
 2 How do other catchment features (soils, geology and topography) impact the source components of runoff?
 3 How do the event magnitude and intensity impact these differences?

    Finally, we discuss the implications for NFM in the UK from these process findings.

Table 1
Summary of characteristics of the three catchments. ‘Mixed bottom land’ soil type was reclassified into Alluvial soils, and Lithosols into Brown soils
for clarity. Data sources: topographic data – in ArcGIS from 5 m × 5 m resolution digital terrain model (DTM) (Ordnance Survey, 2016); land cover -
Scottish Borders Council survey (Medcalf and Williams, 2010); soils data - 1:25,000 soils map of Scotland (Soil Survey of Scotland Staff, 1970);
geology - 1:25,000 geological map produced by the British Geological Survey (Auton, 2011).
  Characteristic                                                Middle Burn (EGS07)                 Shiplaw (EGS06)                  Longcote (EGS12)

  Topographic indices
  Area (km2)                                                    2.4                                 3.1                              2.7
  Median elevation (m)                                          313                                 324                              376
  Median slope (◦ )                                             5                                   5                                16
  Drainage density (km km− 2)                                   0.0031                              0.0020                           0.0027
  Topographic wetness index (ln(m))                             6.7                                 6.5                              5.7

  Land cover
  Woodland – all types, including recently felled (%)           94                                  41                               1
  Improved and semi-improved grassland (%)                      2                                   28                               11
  Acid grassland/bracken/                                       1                                   3                                64
      heathland (%)
  Dry/wet modified bog and fenland (%)                          0                                   27                               22

  Soils
  Alluvial soils (%)                                            17                                  6                                0
  Basin peats (%)                                               9                                   5                                0
  Blanket peats (%)                                             19                                  11                               2
  Brown soils (%)                                               12                                  35                               62
  Gleys (%)                                                     39                                  33                               8
  Podzols (%)                                                   4                                   10                               28

  Geology
  Glacial till and peat (%)                                     76                                  63                               8
  Sand and gravel (%)                                           12                                  16                               8
  Bedrock (%)                                                   12                                  21                               84

                                                                          4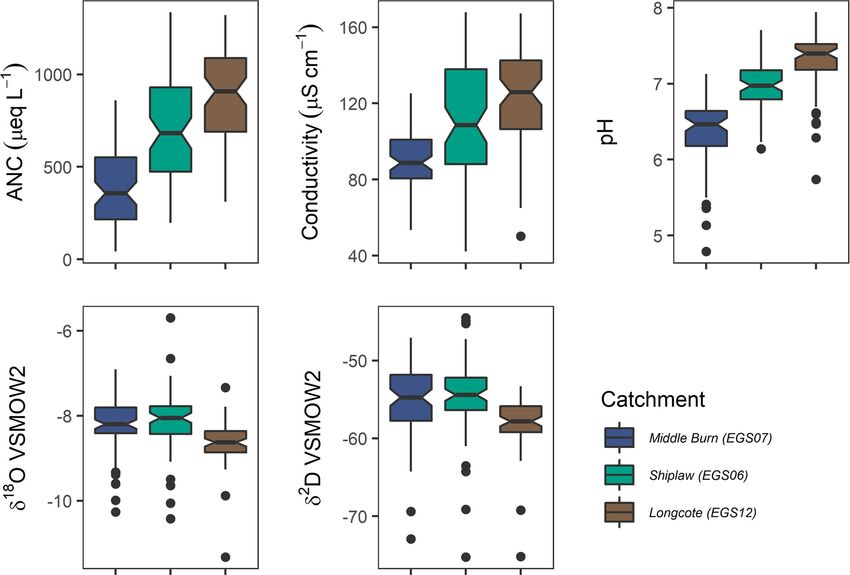
L.M. Peskett et al. Journal of Hydrology: Regional Studies 36 (2021) 100834
2. Methods
2.1. Study site and design
The research focussed on three small headwater catchments (2.4-3.1 km2, Fig. 1, Table 1) in the Scottish Borders, UK, which are
typical of many UK upland catchments and are monitored within the wider NFM project. The catchments have a large range in forest
cover (94%, 41% and 1%), making them ideal for investigating the influence of forest cover on source components of flow. Com
parisons between the neighbouring Shiplaw and Middle Burn catchments enabled a ‘paired catchment’ approach, given their similar
catchment characteristics other than percentage forest cover. Comparisons between these catchments and the Longcote catchment
allowed for insights into the relative role of other catchment characteristics on runoff components across the wider NFM catchment.
We used hydrograph separation based on isotopes (2H and 18O) and ANC to compare time and geographic source components,
respectively, of runoff in the three catchments during four high flow events. The wider Eddleston Water catchment (a sub-catchment of
the River Tweed) is the focus of one of the UK’s largest and long running NFM pilot sites, which aims to inform national water policy
(under the EU Water Framework Directive and EU Floods Directive) (Tweed Forum, 2019; Werritty et al., 2010).
Forest cover was historically limited in most of the catchment during the 20th century, but conifer plantations (primarily Sitka
spruce, Picea sitchensis) were established in the 1960s and 1970s particularly in the west. The peaty soils were prepared for planting by
deep ploughing to create drainage ditches. However, it was assumed that these had minimal impact in this study since they have not
been maintained since at least the 1990s and have been actively blocked in some cases to follow more recent forest management
guidelines. Approximately 94% of Middle Burn was conifer forest cover at various growth stages at the time of the study, including
~25% recently felled forest. No new access roads were built during felling and brash mats were used to minimise compaction. A series
of leaky wooden dams has also been constructed in this catchment as part of the NFM project, but these are only active during the
largest events (Black et al., 2021) and release water rapidly as storms subside, so we assume they have negligible effect on total event
water runoff fractions. The adjacent Shiplaw catchment has 41% conifer forest cover (including ~10% recent felling), 28% improved
and semi-improved grassland, much of which has under-field tile drainage that is common in the UK uplands (Harrison, 2012), and
27% fenland. The steeper Longcote catchment in the east has 1% conifer forest cover, 11% improved grassland and 64% rough
grassland (30% heathland, 22% unimproved acid grassland, 12% bracken), and 22% fenland. Most of the catchment is grazed by
sheep, cattle grazing occurs on the lower slopes and drains exist under the improved grassland areas.
Soils in the western catchments include extensive areas of poorly permeable gleyed soils and peats, but also areas of more freely
draining brown soils, whilst the eastern catchment is dominated by brown soils with some peaty and gleyed soils on hilltops. Soil
median field saturated hydraulic conductivities measured nearby (~3 km) in the wider catchment in a separate study (Archer et al.,
2013) were 0.50− 0.94 m d− 1 for improved grassland sites, 1 m d− 1 for ~50 year old plantation forest, and 2.86-4.18 m d− 1 for
broadleaf forests >180 years old. Soils and underlying geology are strongly associated. The western catchments are dominated by
poorly permeable glacial till (Aitken et al., 1984) with pockets of permeable glacio-lacustrine sands and gravels (Fig. 1a). The esti
mated hydraulic conductivity of the glacial till is < 0.001 to 1 m d− 1 (MacDonald et al., 2012). The eastern catchment is mostly rock
head overlying bedrock, with smaller areas of glacial till mantling some of the main streams. The hydraulic conductivity of the Silurian
greywacke bedrock was not measured, but Silurian greywacke aquifers elsewhere in southern Scotland have low productivity (Ó
Dochartaigh et al., 2015), with an estimated average transmissivity of 20 m2 d-1 (Graham et al., 2009).
Elevation ranges between 250 and 600 masl across the three study catchments. At Eddleston Village mean annual precipitation
(2011–2017) is ~900 mm, falling mainly as rainfall; monthly mean air temperatures are 3-13 ◦ C; and actual daily evapotranspiration
ranges from 0.2 mm in winter to 2.5 mm in summer (estimated using methods of Granger and Gray, 1989).
2.2. Field methods
2.2.1. Hydrometric monitoring
Rainfall has been measured since April 2011 at four locations, representative of the wider ~70 km2 Eddleston Water catchment,
using stainless steel Octapent storage rain gauges and tipping bucket rain gauges (RIM8020) recording at 15 min intervals and in
increments of 0.2 mm. These gauges are situated inside or within 1 km of the study catchments (Fig. 1). Air temperature, solar ra
diation, relative humidity and wind speed and direction have been measured at the same time step over the same period at a weather
station (Campbell CR1000 Automatic Weather Station) located at the centre of the catchment (Fig. 1 a and b).
Stream water levels have been measured every 15 min (Hobo U20 0–3.5 m unvented pressure-based water level recorders) in each
catchment since April 2011. Discharge was calculated at the same time step using rating curves derived from applying the mid-section
method (Dingman, 2014) to velocity-area gauging at natural rated sections approximately 8 times a year under a range of conditions
(Peskett, 2020).
2.2.2. Event precipitation sampling
Event sampling was carried out over a 48 h period in the three catchments for seven events between December 2015 and February
2017. Events were targeted based on weather forecasts and predicted precipitation maps from the UK Met Office, and were only
considered if total predicted event rainfall was above 15 mm with an average intensity of approximately 2 mm h− 1 (based on prior
knowledge of the responsiveness of the catchment).
Event rainfall was sampled within the Longcote and Shiplaw catchments (Fig. 1) using sequential rainfall samplers built using a
modified version of the method described in Kennedy et al. (1979). These were deployed a few hours prior to the start of the forecast
5
L.M. Peskett et al. Journal of Hydrology: Regional Studies 36 (2021) 100834
event rainfall in open field locations. The samplers collect rainfall in 6 mm increments for the first three samples, 11 mm for the fourth
sample and then a bulk sample for the rest of the event. The volume increments were converted to time increments by pairing with the
cumulative rainfall data from the closest TBR rain gauge. Bulk rainfall samples for the whole event were also collected from adjacent
temporary storage gauges in case of failure of the sequential samplers.
Rainfall samples were collected before any further rainfall (and within 12 h of the end of each event), with aliquots for isotopic
analysis transferred in the field into two 15 mL HDPE bottles filled completely to remove air. Snow samples were also taken in the
February event to test for the influence of snow on separation results (see Supplementary data S1.1). Throughfall was not sampled, but
a sensitivity analysis was conducted for the effects of throughfall in hydrograph separation using data from the literature (S1.1).
2.2.3. Event stream water sampling
Stream water sampling for the first event (December 2015) used two automatic water samplers (ISCO 6712, Teledyne ISCO,
Nebraska, USA) programmed for a 2 hly sampling frequency and manual sampling in the third catchment (Middle Burn) at lower
frequency, as an automatic sampler was not available. All subsequent events used three automatic samplers sited adjacent to the
gauging stations and programmed at a 2 hly sampling frequency, giving a sampling window of up to 48 h, since each sampler held 24
bottles. All samplers were primed with clean, dry bottles prior to the event, timed to start a few hours before forecast rainfall and
programmed to purge the inlet tubing with river water prior to collecting each sample. We used a number of approaches to prevent and
check for evaporation: samples were pumped into bottles with narrow necks within the shaded, wind-free and pale-grey compartment
of automatic water samplers; samples were collected within 12 h of the sampler programmes finishing; samples were transferred
directly from the automatic sampler bottles into two 15 mL HDPE bottles in the field, and were filled completely to exclude air before
sealing; and after sample analysis we also checked that there was no systematic deviation on δ2H vs. δ18O plots compared to the Local
Meteoric Water Line. The remaining stream water samples were transported to the laboratory in capped automatic sampler bottles,
where they were refrigerated at 4 ◦ C prior to ANC analysis and analysed within 48 h of the event ending.
Automatic water samplers failed during two events. During the July 2016 event, a blocked sampling tube in Shiplaw meant that
only the first sample was collected and this catchment had to be removed from the analysis of that event. An electronic failure in the
Middle Burn automatic sampler during the February 2017 event resulted in some missing data for the first part of the event. Manually
collected samples prior to the event and before the onset of the main flow peak enabled estimation of the event fraction using
interpolation and linear regression based on the neighbouring Shiplaw catchment data (as explained in Tables S1 and S2).
In total, 60 event rainfall samples, 4 event snow samples and 395 stream samples were collected across seven events. The final event
dataset for isotopic and ANC analysis reported here is based on four events (Table 2). Three of the events were excluded due to smaller
than forecast rainfall or rainfall isotopic composition that was insufficiently different from streams to enable hydrograph separation.
2.3. Laboratory methods
Precipitation and stream samples were analysed for H and O isotope compositions using a Los Gatos Research liquid water Off-Axis
Integrated-Cavity Output Spectroscopy (Off-Axis ICOS) laser absorption spectrometer at the University of Saskatchewan, Canada. We
used standard analytical methods (IAEA, 2009) and report δ2H and δ18O values relative to V-SMOW; precision was ±1.0‰ and ±0.2‰,
respectively.
ANC was determined in stream water samples using acidimetric titration with H2SO4 in accordance with Rounds (2012) to end
points of pH 4.5, 4.1, 4.0 and 3.5 within 48 h of returning from the field. In natural waters where aluminium concentrations are low
this method has been shown to give a good approximation of ANC (Neal, 2001).
Conductivity and pH were not a focus of this study, but were determined in stream samples to help characterise water chemistry.
Conductivity was measured using a temperature compensated conductivity meter (Mettler Toledo SG7) and pH was measured during
Table 2
Summary of samples and hydrological characteristics for four events sampled at high frequency in the three catchments. R: total event rainfall; I:
maximum rainfall intensity; API: 5 day Antecedent Precipitation Index (Kohler and Linsley, 1951); AP28d: 28 day pre-event rainfall; RR: runoff ratio;
Bulk δ2H; isotopic signature for all precipitation sampled during the event.
Event Catchment Precip. samples Stream samples R (mm) I API (mm) AP28d (mm) RR Bulk δ2H (‰)
(mm
15 min− 1)
29/12/2015 M. Burn (EGS07) 1 21 14.6 1.8 35.1 249 0.16 − 39.05
29/12/2015 Shiplaw (EGS06) 1 5 14.6 1.8 35.1 249 0.20 − 39.05
29/12/2015 Longcote (EGS12) 1 23 24.4 1.4 41.6 189 0.06 − 37.07
20/07/2016 M. Burn (EGS07) 5 18 19.0 9.7 9.61 69.6 0.10 − 30.79
20/07/2016 Shiplaw (EGS06) 5 0 19.0 9.7 9.61 69.6 0.16 − 30.79
20/07/2016 Longcote (EGS12) 5 19 18.4 10 12.5 99.8 0.04 − 33.09
21/11/2016 M. Burn (EGS07) 3 18 28.2 2.8 11.7 69.2 0.23 − 97.17
21/11/2016 Shiplaw (EGS06) 3 23 28.2 2.8 11.7 69.2 0.25 − 97.17
21/11/2016 Longcote (EGS12) 5 18 44.2 1.0 12.2 84.2 0.11 − 105.13
22/02/2017 M. Burn (EGS07) 9 (+2 snow) 43 32.6 1.8 10.5 53.2 0.14 − 73.29
22/02/2017 Shiplaw (EGS06) 9 (+2 snow) 26 32.6 1.8 10.5 53.2 0.18 − 73.29
22/02/2017 Longcote (EGS12) 11 (+2 snow) 42 37.8 1.4 7.61 56.6 0.13 − 81.77
6L.M. Peskett et al. Journal of Hydrology: Regional Studies 36 (2021) 100834
Table 3
Discharge statistics for the three catchments based on daily discharge data for October 2011-September 2017. Calculation methods are detailed in
S1.3. MAPR: mean annual peak runoff; RB: Richards-Baker flashiness index (Baker et al., 2004); FDC_Q1_5: gradient of flow duration curve between
1st and 5th percentiles; Lag time (LT) is between rainfall centroid and discharge peak for events selected based on the methodology outlined in S1.3.
Time to peak (TTP) and runoff ratio (RR) are based on the same events dataset.
Variable Middle Burn (EGS07) Shiplaw (EGS06) Longcote (EGS12)
MAPR (mm h¡1) 0.84 1.10 0.78
RB 0.43 0.59 0.18
FDC_Q1_5 28 32 22
LT (h) 7.7 5.0 6.9
TTP (h) 10.7 8.3 11.7
RR 0.23 0.39 0.19
ANC titration.
2.4. Data analysis
2.4.1. Long-term hydrometric and geochemical sampling data
To help characterise catchment responses to rainfall, hydrometric data were initially analysed for the three catchments using the
complete 15 min frequency time series (October 2011 – September 2017) to generate summary statistics as well as statistics based on a
set of ~60 events in each catchment. The data analysis methods used are detailed in S1.3. These data were used to calculate Spearman
rank correlation coefficients to highlight any possible relationships between event runoff ratios and event total rainfall depth, rainfall
intensity and antecedent rainfall. Summary statistics were also derived from routine (weekly / 2 weekly) geochemical sampling data
for May 2015 – May 2017 encompassing the duration of the storm sampling (S1.4).
Fig. 2. Boxplots of the composition of stream water samples collected between May 2015 and May 2017, based on weekly routine sampling
(September 2015-August 2016) and two-weekly routine sampling at other times. The horizontal line represents the median and the lower and upper
hinges correspond to the first and third quartiles. The upper and lower whiskers extend from the hinge to the largest value no further than 1.5 * the
interquartile range (IQR) from the hinge. The notches extend 1.58 * IQR / sqrt(n). This gives a roughly 95% confidence interval for comparing
medians. Black circles are outliers. ANC: acid neutralising capacity.
7L.M. Peskett et al.
Table 4
Summary of hydrograph separations for four events across the three catchments. Note that stream water in the summer event (July 2016) was sampled at Middle Burn and Longcote only as explained in the
text. R: Total event rainfall. Qmax: Maximum discharge. Fe: fraction event water. Fp: fraction pre-event water. Fsoil: fraction soil water. Fgw: fraction groundwater. ‘Qtot’ is fraction based on summing event
water fraction over whole event (event window is defined in the text) and ‘Qmax’ is fraction at the maximum Q. ‘δ2H’ denotes fraction calculation based on δ2H data. ‘ANC’ denotes fraction calculation
based on ANC data. TTP: Time to peak with subscripts p, e and gw denoting pre-event, event and groundwater components respectively. RR: runoff ratio based on separation with δ2H data.
Event Catchment R Qmax (mm Fe (Qtot) Fp (Qtot) Fsoil (Qtot) (δ2H & Fgw Fe (Qmax) Fp (Qmax) Fsoil (Qmax) (δ2H & Fgw (Qmax) TTP TTPp TTPe TTPgw RR
(mm) h− 1) (δ2H) (δ2H) ANC) (Qtot) (δ2H) (δ2H) ANC) (ANC) (h) (h) (h) (h) (δ2H)
(δ2H)
M. Burn
14.6 0.49 0.03 0.97 0.85 0.12 0.07 0.93 0.82 0.11 15.0 15.0 11.8 15.0 0.02
(EGS07)
29/12/ Shiplaw
14.6 0.58 0.04 0.96 0.74 0.22 0.12 0.88 0.70 0.18 14.8 14.8 13.0 13.8 0.03
2015 (EGS06)
Longcote
24.4 0.49 0.02 0.98 0.63 0.35 0.10 0.9 0.60 0.30 13.2 13.2 13.2 13.3 0.01
(EGS12)
M. Burn
8
19.0 0.30 0.25 0.75 0.5 0.25 0.34 0.66 0.43 0.23 8.0 8.0 7.3 6.0 0.06
20/07/ (EGS07)
2016 Longcote
18.4 0.20 0.20 0.8 0.15 0.65 0.32 0.68 0.13 0.55 3.5 1.5 3.8 1.5 0.02
(EGS12)
M. Burn
28.2 0.90 0.25 0.75 0.64 0.11 0.37 0.63 0.53 0.10 16.2 11.5 16.2 17.8 0.18
(EGS07)
21/11/ Shiplaw
28.2 0.97 0.36 0.64 0.46 0.18 0.54 0.46 0.32 0.14 14.5 7.8 16.0 7.8 0.27
2016 (EGS06)
Longcote
44.2 0.77 0.28 0.72 0.45 0.27 0.48 0.52 0.31 0.21 17.5 24.0 17.5 24.0 0.14
(EGS12)
Journal of Hydrology: Regional Studies 36 (2021) 100834
M. Burn
32.6 0.64 0.12 0.88 0.75 0.13 0.16 0.84 0.74 0.10 55.2 56.2 55.2 55.3 0.08
(EGS07)
22/02/ Shiplaw
32.6 0.80 0.22 0.78 0.56 0.22 0.34 0.66 0.52 0.14 54.0 54.0 55.0 49.0 0.15
2017 (EGS06)
Longcote
37.8 0.64 0.09 0.91 0.56 0.35 0.10 0.9 0.63 0.27 57.8 61.8 54.2 53.5 0.05
(EGS12)L.M. Peskett et al. Journal of Hydrology: Regional Studies 36 (2021) 100834
2.4.2. Isotope and ANC event-based hydrograph separation
We used isotope- and ANC-based hydrograph separation to calculate the fractions of pre-event water and groundwater, respec
tively, in stream discharge at the 2 h stream water sampling time step for each event. Hydrograph separation relies on a number of
assumptions and has limitations that have been extensively reviewed elsewhere (Klaus and McDonnell, 2013). Despite these limita
tions, isotope-based hydrograph separation is considered more objective than separation methods based on hydrometric data alone
and provides a useful first approximation of runoff components operating at the catchment scale (Klaus and McDonnell, 2013).
Pre-event water fractions were estimated as follows:
Qt = Qp + Qe (1)
Ct Qt = Cp Qp + Ce Qe (2)
Ct − Ce
Fp = (3)
Cp − Ce
Fe = 1 − F p (4)
where Qt is stream discharge, Qp the discharge contribution from pre-event water, Qe the discharge contribution from event water, Ct,
Cp and Ce are the δ values of stream water, pre-event water and event water, and Fp and Fe are the fractions of pre-event and event water
in the stream (Klaus and McDonnell, 2006). The analysis was conducted using both 18O and 2H. Both isotopes gave similar results,
indicating minimal fractionation effects, so only the 2H data are presented here.
To define the pre-event endmember for each stream, we used the mean of the pre-event stream water samples collected on the day
prior to the event, as in other studies (Klaus and McDonnell, 2013). For the event endmember, we used both the sequential rainfall
samples for each event (except December 2015 when sequential samples were not available) and bulk rainfall samples in order to
crosscheck the results. Fp and Fe are presented in the subsequent analysis as values at peak discharge using the sample closest to peak
discharge (Fp (Qmax) or Fe (Qmax)) and as a total for the storm based on a sampling window defined by the first sample on the rising limb
of the hydrograph and the earliest final sample across the three catchments (Fp (Qtot) or Fe (Qtot)). Time to peak (TTP) from the start of
the rising limb to the peak discharge and the runoff ratio based on the event water fraction (RR) were also calculated (with subscripts p
and e denoting pre-event and event water respectively). We also carried out sensitivity analyses to assess the influence of throughfall
and of snow on hydrograph separation (S1.1).
We used a similar two-component mixing model to estimate the groundwater fraction in runoff during each event, subject to the
same assumptions as the isotope-based model:
Ar − As Qgw
Fgw = = (5)
Ar − Agw Qt
Fig. 3. Three-component hydrograph separation in the November 2016 event.
9L.M. Peskett et al. Journal of Hydrology: Regional Studies 36 (2021) 100834
where Fgw is groundwater fraction, Qt is stream discharge, Qgw is discharge contribution from groundwater, As is ANC of stream water,
Ar is ANC of surface runoff endmember, and Agw is ANC of groundwater endmember.
The groundwater endmember was defined as the mean ANC of the five lowest flows in each sub-catchment for the period
September 2015-August 2016 (based on weekly sampling as discussed in S1.4) similar to other studies (Neal et al., 1997; Soulsby et al.,
2003). The surface runoff endmember was defined as zero, as this approximates the ANC of rainfall. The stream water endmember was
taken as the ANC at the time of sampling. As for isotope-based hydrograph separation, Fgw is presented in the subsequent analysis as
values at peak discharge or total discharge (Fgw (Qmax); Fgw (Qtot)), and TTPgw and RRgw are reported for time to peak and runoff ratios
based on groundwater components.
Uncertainties in the pre-event water and groundwater fractions were estimated using the Gaussian error propagation approach of
Genereaux et al. (1998), based on 70% confidence intervals which were considered appropriate for analysis of this size of dataset and
the uncertainties involved in hydrograph separation (Bazemore et al., 1994). Details of the input parameters for the uncertainty
analysis are outlined in S1.5.
Finally, three-component hydrograph separation was conducted using a two-step approach (Klaus and McDonnell, 2013) to
approximate soil water based on the difference between the pre-event water and groundwater fractions.
Fig. 4. Relationships between event water (Fe) or groundwater (Fgw) fractions and event size, in plots of (a, b) maximum event water (or
groundwater) discharge fraction against maximum discharge (Qmax) and (c, d) total event water (or groundwater) discharge against maximum
discharge fraction (Qmax). Error bars represent 70% confidence intervals calculated as explained in the text.
10L.M. Peskett et al. Journal of Hydrology: Regional Studies 36 (2021) 100834
Fig. 5. ANC-discharge plots for four events sampled at 2 hly intervals in the three sub-catchments. Black arrows show direction of hysteresis.
These data were used to compare catchment responses during the different events. Spearman rank correlation coefficients were
calculated to highlight any possible relationships between tracer-based event water fractions/runoff ratios and event total rainfall
depth, rainfall intensity and antecedent rainfall.
3. Results
3.1. Catchment characteristic controls on runoff components
3.1.1. Long-term hydrometric and geochemical sampling data
Analysis of the complete stream discharge time series indicated that the two western catchments, Middle Burn and Shiplaw, were
more responsive to rainfall events than the eastern catchment, Longcote (Table 3). The highly forested Middle Burn catchment was less
responsive than the adjacent Shiplaw with lower forest cover, but much more responsive than Longcote with the lowest forest cover.
Large differences were also observed in catchment long-term (May 2015 – May 2017) stream water geochemistry (Fig. 2, Fig. S1).
Middle Burn was most acidic, and had the lowest ANC and conductivity compared to the other catchments, which may be due to the
acidifying effects of the forest; Shiplaw had intermediate values; and Longcote had the highest values. Shiplaw had a wider range of
ANC and conductivity compared to the other catchments, which may reflect its greater responsiveness. The median values and range in
isotopic composition were similar for Middle Burn and Shiplaw, but notably different for Longcote, reflecting both the proximity of the
western catchments and potentially the higher groundwater fraction in Longcote.
11L.M. Peskett et al. Journal of Hydrology: Regional Studies 36 (2021) 100834
3.1.2. Event-based hydrograph separation
Overall, despite the responsiveness of the catchments, event water runoff was generally limited. The total event runoff fraction, Fe
(Qtot), wasL.M. Peskett et al. Journal of Hydrology: Regional Studies 36 (2021) 100834
1979). Findings were similar using either 2H or 18O, with differences in the event fractions of +/- 7%, which were lower than the error
propagation estimates. Nevertheless, there was high variability in pre-event water fraction between different events, suggesting that
humid forested catchments may have more variable pre-event fractions than many early studies suggested (Fischer et al., 2017). There
was also relatively low spatial variability in bulk precipitation isotopic composition for different events across different parts of the
catchment, in contrast to some studies (Fischer et al., 2017; McGuire et al., 2005), suggesting that in this environment isotopic tracers
can provide a useful tool for understanding event runoff. Further research is warranted on the effects of throughfall on isotopic
composition. Assuming the bulk throughfall δ18O and δ2H value differences to storm rainfall reported in Kubota and Tsuboyama
(2003), we estimated that Fe (Qmax) ranged from 12% lower to 17% higher than estimates based on the sampled rainfall across the
different events in Middle Burn. However, this did not alter the relative order of catchments in terms of their event water runoff
fractions.
Groundwater was a small fraction of stream discharge during the winter events, although variable between catchments and
important in Longcote where it still constituted 21% of stream discharge during the largest event. The small groundwater fraction
implies that soil water is an important water source in these temperate upland catchments. This is consistent with studies in similar
catchments with poorly permeable bedrock (or superficial deposits), where surface runoff and shallow subsurface runoff in soils tend
to dominate (Tetzlaff et al., 2007b). Groundwater appears to be more important in summer events, but testing this hypothesis would
require sampling larger and more summer events.
4.2. Forest cover and management controls on event runoff fractions
Comparisons between Shiplaw and Middle Burn suggest that forest cover has some influence on event water fraction. In these
paired catchments, the total event water fraction in the forested Middle Burn catchment was consistently lower across the sampled
events, and in the largest event it was 11% lower (and 17% lower at peak discharge). We are not aware of data on event water fractions
from similar environments with NFM schemes in the UK, but reductions due to forest cover are consistent with other studies generally
(Buttle, 1994), although not as high as reductions seen in other areas. For instance, Muñoz-Villers and McDonnell (2013) reported
~24% difference in event water contributions between forest and pasture in a tropical environment due mainly to (much higher)
contrasts in infiltration rates between the two land uses, and to a lesser extent to canopy interception. Considering this evidence, and
the infiltration data we have from the wider Eddleston catchment and similar environments in the UK (3.4/0.026 m d− 1 (A/B horizon)
for grassland, versus 8.3 m d− 1 for forest Marshall et al., 2009), we suggest that the reductions in event water in Middle Burn compared
to Shiplaw are linked to relative differences in exceedance of rainfall infiltration capacity between forest and grassland areas and
resulting reductions in overland flow in the forested areas. Interception by the forest is also likely to have led to reductions in the event
water fraction as reported in other studies (Roa-García and Weiler, 2010).
Forest management methods (particularly drainage in site preparation and compaction during harvesting) and under-field
drainage in improved grassland may introduce uncertainties. The effects of drainage systems in similar temperate environments are
poorly studied, particularly at catchment scale, and are highly variable depending on factors such as drain spacing, soil type and
antecedent conditions (Dadson et al., 2017). Open forest drainage ditches and compaction are likely to have increased the fraction of
event water runoff compared to undrained forest, although, as already noted, the effects of drainage ditches and compaction are
expected to be minimal in the study catchments. Under-field drainage is also likely to have increased event water runoff fraction under
the wet antecedent conditions of most of the storms we investigated, but less so than increases due to drainage in the forest. The net
effect of drainage in both the Middle Burn and Shiplaw catchments is a likely decrease in the difference in event water fractions
between them, though it is unlikely to have changed the results we have reported. These relative effects of drainage would benefit from
further study in this catchment and elsewhere in the UK, given that around 61% of agricultural land in the UK is drained (Wiskow and
van der Ploeg, 2003).
4.3. Soil, geological and meteorological controls on runoff fractions
Comparisons between the western (Shiplaw, Middle Burn) catchments and the eastern catchment (Longcote) illustrate the wide
variation in response across the wider NFM catchment. Event water fractions were up to 48% lower in Longcote compared to Shiplaw
(whilst up to 33% lower in Middle Burn). Longcote responded rapidly to rainfall, though with lower peak discharge, slow recession
rates and double peak hydrographs, as well as high groundwater and soil water fractions. These findings suggest a dominance of
subsurface flow despite the steeper catchment topography and low forest cover. Given the poorly permeable bedrock in Longcote,
subsurface flow is most likely to occur in the soils, superficial deposits and weathered bedrock. This is in contrast to some hydrograph
separation studies in steep catchments that have reported positive correlations between slope and event water fraction (Suecker et al.,
2000).
There is some uncertainty in whether the lower event water fractions in the Longcote catchment are related to lower levels of
disturbance (and particularly the acid grassland, heathland and bracken land cover with an expected higher roughness and infiltration)
or to the underlying soils and geology. Research on catchment disturbance has frequently found evidence of increased runoff and event
water fraction in more disturbed catchments (e.g. Monteith et al., 2006; Nainar et al., 2018). However, the higher groundwater
fraction and the nature of the stream response, suggest that more permeable soils and superficial deposits are particularly important in
controlling event water fractions. This corresponds with research in other Scottish upland catchments, which has demonstrated the
importance of freely draining soils and glacial drift deposits in controlling catchment flow paths, leading to much longer transit times
even on steeper slopes (e.g. Soulsby et al., 2006). Regardless of these uncertainties, a conclusion emerging from our results that is
13L.M. Peskett et al. Journal of Hydrology: Regional Studies 36 (2021) 100834
relevant to planning NFM interventions more widely is the likely limited effect on flood risk of hillslope afforestation in areas already
dominated by deeper subsurface flow.
The small number of storms sampled make it difficult to test how different meteorological characteristics (in terms of total rainfall
depth, intensity and API) control event runoff fractions. However, given that there were greater differences in event runoff between
events than between catchments, these characteristics may be more important controls on the fraction of event water in the hydro
graph than catchment characteristics. Fischer et al. (2017) reported a similar hierarchy of influences controlling pre-event water
fraction across multiple storms in pre-alpine catchments. Antecedent conditions may be particularly important, as suggested by the
large contrast between summer and winter events, and in Longcote the switch in hysteresis direction, which has been linked to the
changing inputs of hillslope soil water in streams under different wetness states (Zuecco et al., 2016).
4.4. Implications for natural flood management policy
Our study demonstrates the importance of the displacement of pre-event water in runoff mechanisms in landscapes subject to NFM
interventions, implying that saturated overland flow may not be a dominant runoff mechanism even in relatively responsive catch
ments. The results also suggest that upland afforestation can influence the partitioning of runoff at the catchment scale, so could be
used to manipulate flow paths in NFM. However, the effects might be minimal for the largest events compared to improved grassland
areas, which NFM measures frequently target, due to the limited effects of forests on infiltration and transient storage (Soulsby et al.,
2017; Tetzlaff et al., 2007a) and relatively high infiltration rates in improved grasslands in many UK upland environments. These
findings support suggestions in the NFM literature that climatic conditions and individual storm event characteristics dominate over
catchment characteristics in influencing peak flows in the largest events (Dadson et al., 2017). In other regions, for example where
grasslands are severely degraded, forest planting may have a greater effect on reducing event water runoff fractions (van Meerveld
et al., 2019; Zwartendijk et al., 2017).
The implication of these results is that in areas of more permeable geology and soils, similar to the Longcote catchment, hillslope
afforestation may have limited benefit as a NFM strategy (we do not consider the effects of riparian or floodplain planting), although
woodland may of course bring other benefits. Therefore, hillslope planting for NFM should target other areas, in particular areas with
compacted soils overlying relatively permeable soils or geology, where forest planting may help to connect runoff to streams via the
groundwater zone. In this case the location of forest cover and the type of trees become important, as discussed by Neal et al. (1997)
who suggested long term experiments with more deeply rooting trees. To take account of these mechanisms in NFM, implementation
might require greater consideration of subsurface features. Flood vulnerability maps used to determine the location of
woodland-related NFM interventions in the UK consider some proxies for soil and related geological substrate permeability at a coarse
resolution (Environment Agency, 2018), but should include further consideration of the interaction with factors such as the degree of
compaction and depth to groundwater. Targeted tracer studies could improve such process understanding, helping better constrain
models to detect change as well as quantify co-benefits of NFM interventions involving woodland, such as increased biodiversity,
carbon storage and water quality (Iacob et al., 2014; Keesstra et al., 2018). Of course, there are practical challenges, given high costs
associated with tracer studies, but the increasing availability of in-situ high frequency sensors for tracers such as conductivity, tem
perature and potentially isotopic tracers (Berman et al., 2009) mean that such approaches could be incorporated into NFM planning
and monitoring.
5. Conclusions
To our knowledge this is the first study using natural tracers at the catchment scale to investigate runoff mechanisms in UK-based
NFM projects. It gives insights into the diversity of runoff mechanisms operating during storm events across different upland catch
ments. The results suggest that pre-event water is an important fraction of stream discharge during events for the size of catchments (<
10 km2) and events (< 20% of the mean annual flood) for which there is currently some evidence that forest cover could have an
impact on discharge (Dadson et al., 2017). The study also suggests that plantation forest cover reduces the fraction of event water
runoff in streams over this range of event magnitudes. However, the effects of these differences in land cover may be dominated by
differences in event characteristics, suggesting limited impacts of land cover for the largest events. Since many NFM measures are
designed to target event water, this implies a need for careful consideration of the types and locations of NFM interventions to ensure
they are effective. Finally, the study demonstrates the potential utility of using tracers in NFM for understanding runoff processes and
monitoring co-benefits such as surface water and groundwater pollution management.
Author statement
Leo Peskett: Conceptualization, Methodology, Investigation, Formal Analysis, Writing - Original Draft, Writing - Review & Editing,
Funding acquisition. Kate Heal: Conceptualization, Methodology, Writing- Original draft, Writing - Review & Editing, Funding
acquisition. Alan MacDonald: Conceptualization, Methodology, Writing- Original draft, Funding acquisition. Andrew Black:
Investigation, Data curation, Writing - Review & Editing. Jeffrey McDonnell: Resources, Writing - Review & Editing.
Funding
This work was supported by L. Peskett’s NERC E3 DTP /BGS BUFI PhD studentship (grant number NE/L002558/1) and a NERC
14L.M. Peskett et al. Journal of Hydrology: Regional Studies 36 (2021) 100834
Research Experience Placement grant to R. Fairhurst; a SAGES Postdoctoral & Early Career Researcher Exchange (PECRE) grant
supporting collaboration with J. McDonnell; in-kind contributions and loan of equipment from the School of GeoSciences and BGS
Edinburgh; and financial support from the Tweed Forum for paper drafting.
Declaration of competing interest
The authors declare that they have no known competing financial interests or personal relationships that could have appeared to
influence the work reported in this paper.
Acknowledgements
We would like to thank the landowners for giving us access to the sites and the Tweed Forum for helping to enable this work
through collaboration with the Eddleston Water Project (a collaboration between Scottish Government, Tweed Forum, SEPA, Uni
versity of Dundee, British Geological Survey, Scottish Borders Council and others). We would also like to thank Kirsty Upton, Robert
Fairhurst and Adam Francis, for their help with fieldwork.
Appendix A. Supplementary data
Supplementary data related to this article can be found, in the online version, at doi:https://doi.org/10.1016/j.ejrh.2021.100834.
References
Aitken, J.H., Lovell, J.H., Shaw, A.J., Thomas, C.W., 1984. The Sand and Gravel Resources of the Country Around Dalkeith and Temple, Lothian Region: Description of
1:25000 Sheets NT 25 and 35, and NT 26 and 36, Mineral Assessment Report. British Geological Survey, Edinburgh.
Alila, Y., Kuraś, P.K., Schnorbus, M., Hudson, R., 2009. Forests and floods: a new paradigm sheds light on age-old controversies. Water Resour. Res. 45, W08416
https://doi.org/10.1029/2008WR007207.
Archer, N.A.L., Bonell, M., Coles, N., MacDonald, A.M., Auton, C.A., Stevenson, R., 2013. Soil characteristics and landcover relationships on soil hydraulic
conductivity at a hillslope scale: a view towards local flood management. J. Hydrol. 497, 208–222. https://doi.org/10.1016/j.jhydrol.2013.05.043.
Auton, C., 2011. Eddleston Water Catchment, Superficial Geology, 1: 25 000 Scale. British Geological Survey.
Baker, D.B., Richards, R.P., Loftus, T.T., Kramer, J.W., 2004. A new flashiness index: characteristics and applications to Midwestern rivers and streams. J. Am. Water
Resour. Assoc. 40, 503–522. https://doi.org/10.1111/j.1752-1688.2004.tb01046.x.
Bathurst, J.C., Fahey, B., Iroumé, A., Jones, J., 2020. Forests and floods: using field evidence to reconcile analysis methods. Hydrol. Process. 1–16. https://doi.org/
10.1002/hyp.13802.
Bazemore, D.E., Eshleman, K.N., Hollenbeck, K.J., 1994. The role of soil water in stormflow generation in a forested headwater catchment: synthesis of natural tracer
and hydrometric evidence. J. Hydrol. 162, 47–75. https://doi.org/10.1016/0022-1694(94)90004-3.
Berman, E.S.F., Gupta, M., Gabrielli, C., Garland, T., McDonnell, J.J., 2009. High-frequency field-deployable isotope analyzer for hydrological applications. Water
Resour. Res. 45, W10201 https://doi.org/10.1029/2009WR008265.
Black, A.R., Peskett, L.M., MacDonald, A.M., Young, A., Spray, C., Ball, T., ThomasWerritty, H.A., 2021. Natural flood management, lag time and catchment scale:
results from an empirical nested catchment study. J. Flood Risk Manag. 12717 https://doi.org/10.1111/jfr3.12717.
Bond, S., Kirkby, M.J., Johnston, J., Crowle, A., Holden, J., 2020. Seasonal vegetation and management influence overland flow velocity and roughness in upland
grasslands. Hydrol. Process. 34, 3777–3791. https://doi.org/10.1002/hyp.13842.
Bonell, M., Pearce, A.J., Stewart, M.K., 1990. The identification of runoff-production mechanisms using environmental isotopes in a tussock grassland catchment,
eastern Otago, New Zealand. Hydrol. Process. 4, 15–34. https://doi.org/10.1002/hyp.3360040103.
Bosch, J.M., Hewlett, J.D., 1982. A review of catchment experiments to determine the effect of vegetation changes on water yield and evapotranspiration. J. Hydrol.
55, 3–23. https://doi.org/10.1016/0022-1694(82)90117-2.
Bracken, L.J., Wainwright, J., Ali, G.A., Tetzlaff, D., Smith, M.W., Reaney, S.M., Roy, A.G., 2013. Concepts of hydrological connectivity: research approaches,
pathways and future agendas. Earth-Sci. Rev. 119, 17–34. https://doi.org/10.1016/j.earscirev.2013.02.001.
Brown, V.A., McDonnell, J.J., Burns, D.A., Kendall, C., 1999. The role of event water, a rapid shallow flow component, and catchment size in summer stormflow.
J. Hydrol. 217, 171–190. https://doi.org/10.1016/S0022-1694(98)00247-9.
Brown, A.E., Zhang, L., McMahon, T.A., Western, A.W., Vertessy, R.A., 2005. A review of paired catchment studies for determining changes in water yield resulting
from alterations in vegetation. J. Hydrol. 310, 28–61. https://doi.org/10.1016/j.jhydrol.2004.12.010.
Buttle, J.M., 1994. Isotope hydrograph separations and rapid delivery of pre-event water from drainage basins. Prog. Phys. Geogr. Earth Environ. 18, 16–41. https://
doi.org/10.1177/030913339401800102.
Carrick, J., Rahim, M.S.A.B.A., Adjei, C., Kalee, H.H.H.A., Banks, S.J., Bolam, F.C., Luna, I.M.C., Clark, B., Cowton, J., Domingos, I.F.N., Golicha, D.D., Gupta, G.,
Grainger, M., Hasanaliyeva, G., Hodgson, D.J., Lopez-Capel, E., Magistrali, A.J., Merrell, I.G., Oikeh, I., Othman, M.S., Mudiyanselage, T.K.R.R., Samuel, C.W.C.,
Sufar, E.K., Watson, P.A., Zakaria, N.N.A.B., Stewart, G., 2018. Is planting trees the solution to reducing flood risks? J. Flood Risk Manag. 12, e12484 https://doi.
org/10.1111/jfr3.12484.
Dadson, S., Hall, J., Murgatroyd, A., Acreman, M., Bates, P., Beven, K., Heathwaite, L., Holden, J., Holman, I., Lane, S., O’Connell, E., Penning-Rowsell, E.,
Reynard, N., Sear, D., Thorne, C., Wilby, R., 2017. A restatement of the natural science evidence concerning catchment-based ‘natural’ flood management in the
UK. Proc. R. Soc. A 473, 20160706. https://doi.org/10.1098/rspa.2016.0706.
Dingman, S.L., 2014. Physical Hydrology, third edition. ed. Waveland Press, Illinois.
EEA, 2017. Green Infrastructure and Flood Management: Promoting Cost-efficient Flood Risk Reduction Via Green Infrastructure Solutions (No. 14). European
Environment Agency, Luxembourg.
Environment Agency, 2017. Working with Natural Processes to Reduce Flood Risk: The Evidence Behind Natural Flood Management v2.0. Environment Agency,
Bristol.
Environment Agency, 2018. Mapping the Potential for Working with Natural Processes – Technical Report (No. SC150005). Environment Agency, Bristol.
Environment Agency, 2020. NFM Projects Monitoring and Evaluation Tool v2.501 [WWW Document]. URL https://www.arcgis.com/apps/MapSeries/index.html?
appid=5086d50ee3bc49f1bd25b039c7129c1a (accessed 20.10.20).
Fischer, B.M.C., Stähli, M., Seibert, J., 2017. Pre-event water contributions to runoff events of different magnitude in pre-alpine headwaters. Hydrol. Res. 48, 28–47.
https://doi.org/10.2166/nh.2016.176.
15You can also read