ACTION PLAN FOR REJUVENATION OF DAMODAR RIVER IN JHARKHAND - JHARKHAND STATE POLLUTION CONTROL BOARD, DHURWA, RANCHI, JHARKHAND-834004
←
→
Page content transcription
If your browser does not render page correctly, please read the page content below
ACTION PLAN FOR
 REJUVENATION OF DAMODAR
    RIVER IN JHARKHAND

 JHARKHAND STATE POLLUTION CONTROL
BOARD, DHURWA, RANCHI, JHARKHAND-834004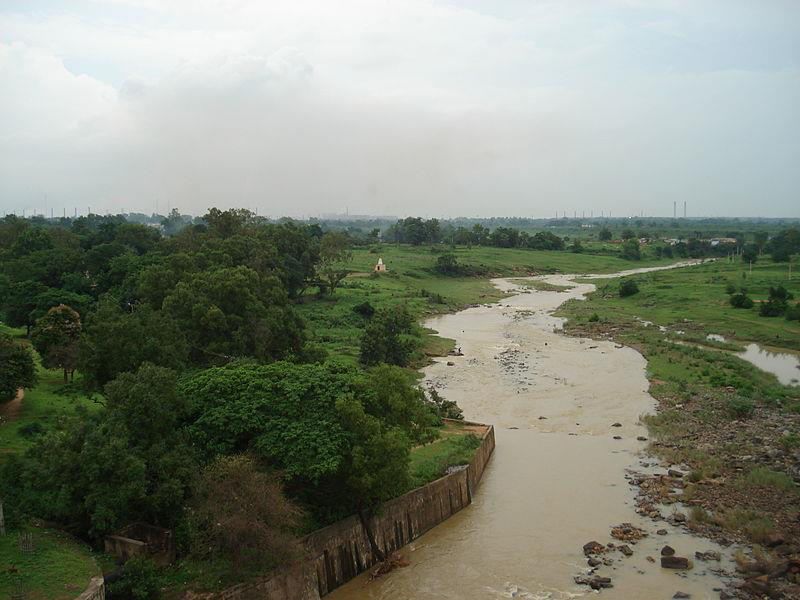
CONTENT
CHAPTER I
❖ BACKGROUND
❖ INTRODUCTION
❖ PHYSIOGRAPHY
❖ WATER RESOURCES & RAINFALL
❖ ANNUAL RAINFALL
❖ DEVIATION OF RAINFALL
❖ SEASONAL RAINFALL
❖ RAINFALL TREND IN RABI SEASON
❖ AVERAGE MOTHLY RAINFALL
❖ MOVING AVERAGE OF THE RAINFALL
❖ EXTREME EVENT ANALYSIS
❖ SURFACE WATER RESOURCES
❖ GROUND WATER RESOURCES
❖ DRAINAGE SYSTEM AND MAPS
CHAPTER II
DAMODAR RIVER BASIN
RIVER COURSE AND MAJOR TRIBUTARIES
CHAPTER III- SOCIO-ECONOMIC IMPORTANCE
❖ WATER RESOURCES AND ITS USES
❖ MINING AND INDUSTRIAL ACTIVITIES
❖ NATURAL AND ANTHROPOGENIC HAZARDS
❖ IDENTIFIED STRETCHES FOR REDUCING POLLUTION
CHAPTER IV- ACTION PLAN
❖ ACTION PLAN- SHORT TERM AND LONG TERM ACTION AND THE
IDENTIFIED AUTHORITIES FOR INITIATING ACTIONS AND THE TIME
LIMITS FOR ENSURING COMPLIANCE
❖ SHORT TERM AND LONG TERM ACTION PLANS FOR REJUVENATION OF
RIVERS AND THE IMPLEMENTING AGENCIES RESPONSIBLE FOR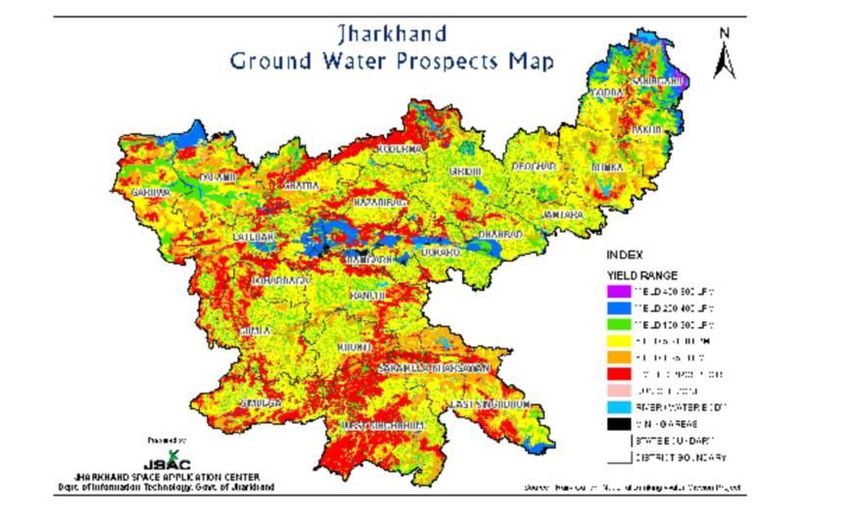
EXECUTION OF THE ACTION PLANS AND THE TIME LIMITS ARE GIVEN IN
    TABLE AS BELOW
❖   PROPOSED ACTION PLAN BY VARIOUS DEPARTMENT OF GOVT. OF
    JHARKHAND
❖   PROPOSED ACTION PLAN FOR RESTORATION OF JHARKHAND RIVERS
❖   ACTION PLAN AT VILLAGE LEVEL
❖   TIMELINES FOR IMPLEMENTATION OF MODEL RESTORATION PLAN in 2019-
    2020 and 2020-2021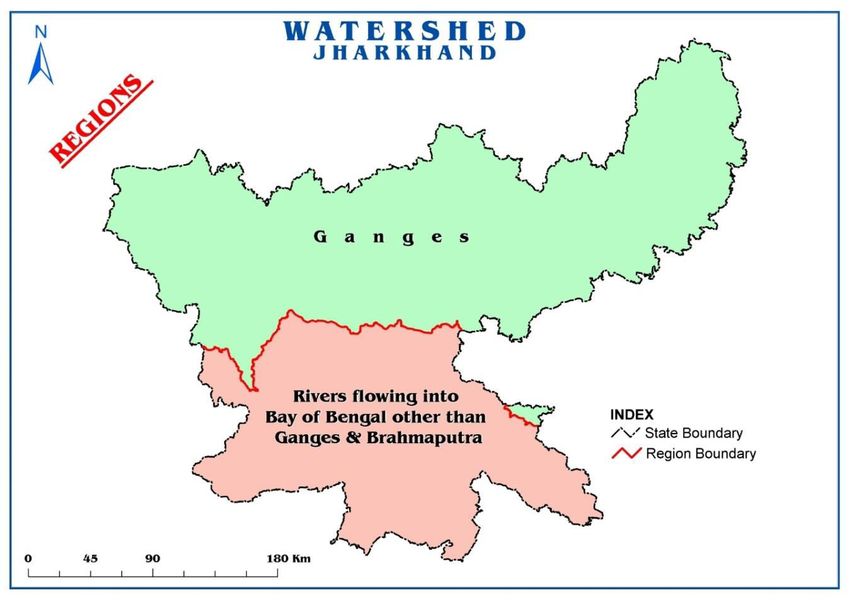
Chapter-1
                    JHARKHAND & ITS WATER RESOURCES

1.1 BACKGROUND:-Hon’ble National Green Tribunal passed the following orders in OA No.
673/2018 & M.A. No. 1777/2018 titled News item published in “The Hindu “authored by Shri Jacob
Koshy titled “More river stretches are now critically polluted: CPCB on 20.09.2018 as per excerpts
below.

“The issue taken up for consideration in this matter is abatement of pollution in 351 river stretches in
the country, identified as such by the Central Pollution Control Board (CPCB). The said river
stretches 2 are not meeting the prescribed standards of the water quality in terms of Bio-chemical
Oxygen Demand (BOD). Existence of polluted river stretches is evidence to show that the State
Pollution Control Boards (SPCBs) have failed to perform their statutory obligation to take
appropriate action to achieve the objects of the Water (Prevention and Control of Pollution) Act,
1974.

Having regard to the importance of the issue and in the light of judgments of the Hon’ble Supreme
Court in M.C. Mehta Vs. Union of India & Ors.1, M.C. Mehta Vs. Union of India And Ors.2 (Calcutta
Tanneries' Matter), Vellore Citizen’ Welfare Forum Vs. Union of India3, S. Jagannath Vs. Union of
India & Ors.4, And Quiet Flows The Maily Yamuna5, Tirupur Dyeing Factory Owners Association
Vs. Noyyal River Ayacutdars Protection Association & Ors.6 and TechiTagi Tara Vs. Rajendra Singh
Bhandari & Ors.7 and of this Tribunal in Manoj Mishra Vs. Union of India8, M.C. Mehta Vs. Union
of India9, Mahendra Pandey Vs. Union of India &Ors.10, Sobha Singh & Ors. Vs. State of Punjab &
Ors. 11, Nityanand Mishra Vs. State of M.P. & Ors12, Stench Grips Mansa’s Sacred Ghaggar River
(Suo-Moto Case)13, Doaba Paryavaran Samiti Vs. State of U.P. & Ors.14, Arvind Pundalik Mhatre
Vs. Ministry of Environment, Forest and Climate Change & Ors.15, Meera Shukla Vs. Municipal
Corporation, Gorakhpur & Ors.16, Amresh Singh Vs. Union of India & Ors.17, Sudarsan Das Vs.
State of West Bengal & Ors.18, Satish Kumar vs. U.O.I & Ors.19, this Tribunal noted 1 (1987) 4 SCC
463 ¶14 & (1988) 1 SCC 471 2 (1997) 2 SSC 411 3 (1996) 5 SSC 647 4 (1997) 2 SCC 87 5 (2009) 17
SSC 720 6 (2009) 9 SSC 737 7 (2018) 11 SCC 734 8 O.A. No. 6/2012, 2015 ALL(I) NGT REPORTER
(1) (DELHI) 139 9 O.A No. 200 of 2014, 2017 NGTR (3) PB 1 10 O.A. No. 58/2017 11 O.A.No.
101/2014 12 O.A. No. 456/2018 13 O.A. No. 138/2016 (TNHRC) 14 O.A. No. 231/2014 15 O.A. No.
125/2018 16 O.A. No. 116/2014 17 Execution Application No. 32/2016 in O.A. No. 295/2016 18
O.A.No. 173 of 2018 19 O.A No. 56 (THC) of 2013 3 the need for steps to check discharge of
untreated sewage and effluents, plastic waste, e-waste, bio-medical waste, municipal solid waste,
diversion of river waters, encroachments of catchment areas and floodplains, over drawal of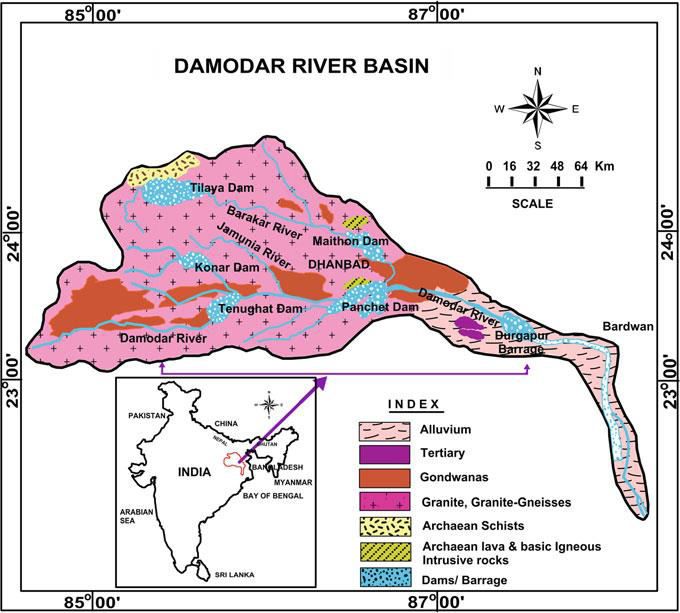
groundwater, river bank erosion on account of illegal sand mining. There is need for installation of
Effluent Treatment Plants (ETPs), Common Effluent Treatment Plants (CETPs), Sewage Treatment
Plants (STPs), Solid Waste Treatment and processing facilities etc.

It was also noted that BOD was required to be less than 3.0 mg/l, Dissolved Oxygen more than 5.0
mg/l and Faecal Coliform bacteria less than 500 MPN/100 ml”

1.2 Introduction
The State of Jharkhand was created as the 28thState of the Indian Union by the Bihar Re-organization
Act on 15th November 2000, the birth anniversary of the legendary Bhagwan Birsa Munda. It
comprises of the forest tracts of Chhotanagpur plateau and Santhal Paragna. It is bounded by Bihar on
the North, Orissa on the South, Chhattisgarh on the west and West Bengal on the East. Topography of
the State is mostly undulating, hilly and sloping with mountains, forests, river basins and valleys. It
has a rich endowment of forests and mineral resources. It has some of the richest deposits of coal and
iron ore in the world. It is the largest producer of coal, copper, kyanite and mica in the country. It is
blessed with rich fauna and flora.

The State is home to nearly a tenth of the country’s Scheduled Tribes1, who constitute 28% of
Jharkhand’s population. Another 12% of the population is from Scheduled Castes. Jharkhand is
mostly rural, with 77.77% of the State’s population in villages. The State has 24 districts, 38 sub-
divisions, 260 blocks, 4118 panchayats and 32620 villages. For safeguarding and protecting the
interest of the Scheduled Tribes and for ensuring equity and social justice in the planned process of
development, the State is following Tribal Sub-Plan (TSP) approach in 12 districts fully and 2
districts partly, covering 112 blocks.

With an area of 79714 km2 which accounts for 2.42% of the country’s area, Jharkhand supports a
population of 32.97 million (2011) which constitutes 2.72% of the country’s population. South Bihar,
as it was called in the earlier dispensation, is a hill state comprising ethnic groups (tribals), Hos,
Mundas, Santhals and others ; The state needs intensive development initiatives.

Jharkhand, literally meaning a forested region, is landlocked and is an integral part of the north-
eastern portion of the Peninsular Plateaus of India. As part of ancient Gondwanaland, Jharkhand has
rock formations ranging from the earliest Archean Era to the latest Post-tertiary period. It is a region

1
  The main tribes in Jharkhand are Asur, Birhor, Birjia, Chik Baraik, Korba, Lohara, Mahali, Mal Paharia,
Kumarbhag Paharia, Souriya Paharia, Savar, Santal, Oraon, Munda, Ho and Kharia.
of diverse physical features consisting of a succession of plateaus, hills and valleys, drained by several
large rivers such as Damodar, Barakar, Subarnarekha, Koel, Brahmani, Baitarani and Mahanadi. The
northern part of Jharkhand adjoining Bihar broadly comes under the Gangetic river basin.

The State has a sub-humid climate with average annual rainfall of 1,350 mm. However, due to high
variability of monsoon rains, low moisture holding capacity of soils, absence of developed aquifers
due to the hard rock substrate and high run-off due to the undulating terrain, agriculture is fraught
with high risks2. Paddy, the principal crop of the State sown over 1.3 mha in 2001-023 had an average
yield of only 1.11 ton/ha4. Maize, minor millets and pulses are the other principal crops and together
occupy about 25% of the net sown area, with similar low yields. Oilseeds production is negligible.
Horticulture and floriculture is undeveloped in spite of a suitable climate.

Jharkhand is a mineral rich state, contributing 40% of the nation’s mineral wealth. Yet, it had little
impact on local livelihoods outside the industrial enclaves. Even in the most industrialized districts,
such as East Singhbhum, Bokaro, Ranchi and Dhanbad, the proportion of main workers engaged in
mining and industry is less than 3%. Agriculture remains the principal source of livelihoods for an
overwhelming majority of the population. About 48% of the State’s geographical area is cultivable.
However, the net sown area is only about 23% (all India 47%) of the geographical area and more than
half of the cultivable land remains fallow. Subsidiary farm-based activities like dairy, poultry, etc.
generally follow growth in agriculture. These have not developed in the State in spite of increasing
demand for the products. The State has a large population of scrub cattle, kept principally for draught
power and manure.

In the last 13 years, since the creation of the State, the Government has done effective work in
extending primary education in the rural areas. Government’s priority to spread road network in the
rural areas is very important. Similarly, the health sector also needs serious attention in the rural areas.
Health services in rural areas need improvement, the people are traditionally dependent on traditional
medicine men. In terms of potential opportunities, some of the considerations which require action to
reduce poverty and enhance food security are:
2
 As per the categorization by Indian Meteorological Department, Jharkhand figures in the "drought corridor”
of the country, which also includes Rajasthan, Gujarat, Andhra Pradesh (drought prone districts of
Rayalaseema and Telengana regions), West Uttar Pradesh, Madhya Pradesh (including Chhatisgarh), Bihar and
parts of West Bengal adjoining Jharkhand.
3
Planning Commission, ibid.
4
 The average yield for India during the year was 1.9 ton/ha, with Tamil Nadu, having the highest average yield
at 3.2 ton/ha. Yields vary a great deal within Jharkhand due to the undulating topography and varying levels of
development of agriculture. Source: Fertilizer statistics 2002-03 New Delhi (Published in Jharkhand Agriculture
data book 2006)
▪      An overwhelming majority of the State’s population is rural and dependent on agriculture and
       other natural resource based livelihoods.
▪       Less than half the cultivable land in the State is presently utilized.
▪       85% of the net sown area is under mono-cropping.
▪       Potential of water resources is not adequately developed.
▪       Productivity of agriculture is significantly lower than potential.
▪       There is little diversity in the farm sector.
▪      The State is a net importer of food grains, oilseeds, milk and milk products and poultry.
▪      Intensification of agriculture would in the long run call for improved land husbandry,
       including use of organic inputs given the undulating and hilly terrain and relatively low
       fertility of soils.
▪       Almost a third of the State is classified as forests.
▪      Forests have been a significant source of income (produce/materials required for domestic use
       in general/during scarcity) for nearly 1/3 of the population.
▪      Livelihood infrastructure of extension services and input-output markets is not adequately
       developed.

1.3 PHYSIOGRAPHY

Physiography of the State: Physiographically Jharkhand state consists of series of four distinct
plateaus, the highest plateau is formed by western Ranchi plateau or the pat region, which is 800 to
1100 meters above the mean sea level. It covers the north-western part of the Ranchi district and
southern edge of Palamau district. The next plateau is known as the Ranchi, except the pat region.
This plateau is about 600 meters above mean sea level. The Ranchi plateau is separated from the other
surface of the same elevation by Damodar trough. The third plateau has an elevation of 300 meters
above mean sea level and may be termed as the lower Chotanagpur plateau. The fourth plateau is a
uniform surface formed by the river valleys, plains and lower parts of the outer plateau lying between
150-300 meters above mean sea level. Rajmahal hills and the Kaimur plateau belong to this category.

The soil in the state of Jharkhand has been formed from disintegration of rocks and stones. The soil
thus formed can be divided into various soil types including red soil, micacious soil, sandy soil, black
soil and laterite soil. Red soil is found mostly in the Damodar valley, and Rajmahal area. The
Micacious soil (which consist particles of mica) is found in the regions of Koderma, Jhumeritilaiya,
Barkagaon and areas around the Mandar hill. Sandy soil is generally found in Hazaribagh and
Dhanbad and black soil in Rajmahal areawhereas the lateritic soil is found in western part of Ranchi,
Palamu, and parts of Santhal Parganas and Singhbhum.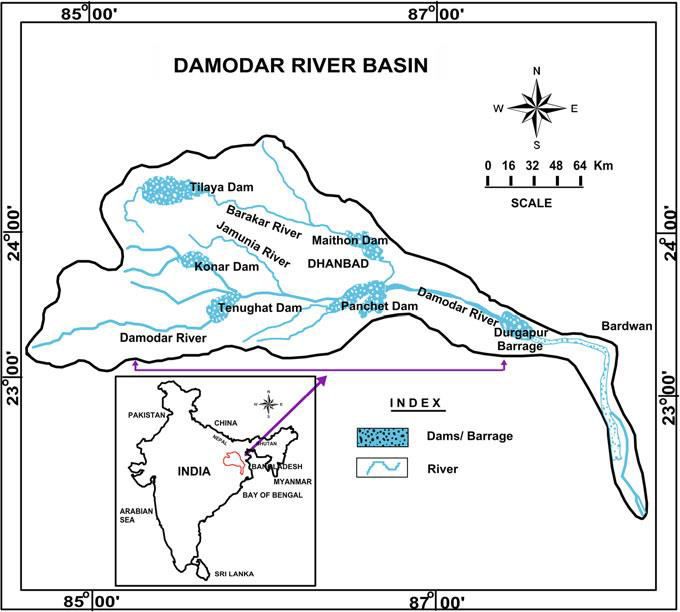
1.4 Water Resources & Rainfall

The state receives rainfall in the range of 1200-1300 mm per year against the national average of
1000mm. Precipitation is rather variable. Winter season precipitation is meagre and highly variable.
About 60 percent of the rainy days have rainfall below 2.5 mm. On about 40 percent rainy days,
evaporation level is more than 2.5 mm per day.

Jharkhand receives rain mainly from South Western monsoon wind. Generally, this monsoon
wind hits Jharkhand in the mid of June and continues up to the month of September. The total
precipitation during these months amounts to 90-95% of the total rainfall. July and August are
the peak month of the monsoon and are the backbone of the agriculture in Jharkhand. The
table given below shows that the state receives good amount of rainfall. However, the erratic
distribution of rainfall across monsoon months (June to September) creates drought situation in
the state. Graph showing the distribution of rainfall across months (JSAC) is given below :

The erratic rainfall of 5 years, for instance, depicts the pattern well in the graph above. During winter
months the state receives winter rain (10-5% of the total rainfall). These small rains become the
deciding factors for rabi crops for many farms. The South Chhotanagpur and Santhal Pargana
Divisions receive higher rainfall whereas Palamu Division receives lowest rainfall in the state.

Despite the fact that the state has a good rainfall, the surface water availability is not sufficient
especially for agriculture due to inadequate storage facilities etc. As far as the status of ground water
is concerned, it is also in the poor state due to little recharging of ground water by natural process and
the absence of artificial recharging facilities, as a result the water level in the plateau goes down.

1.4.1 Annual Rain fall:

Rainfall data for the catchment area has been collected from the India water portal for the last 100
Years. It has been grouped and made arithmetic average to get the decadal average rainfall. The
normal rainfall has been assumed at 1200 mm and deviation has been calculated based on the
assumption and arithmetic average of the decadal rain fall.

Extreme events related to rain fall has been measured with the deviation in the rain fall and number of
times that it has exceeded or fall short of the normal rainfall. These deviations have been depicted in
the graphs.
350

 300

 250

 200                                                                                           Rainfall
                                                                                               Max Temp
 150                                                                                           Min Temp

 100

  50

    0

                               Rain Fall over last century

1.4.2 Deviation of rainfall:

The deviation has been measured with reference to the normal rain fall and all data has been taken
from the IMD data which is accepted country wise. It has been taken from the year 1900 onwards. In
the data it can be seen that in the last 10 Decades there has been seven decades with positive rainfall
and three decades have shown negative deviation.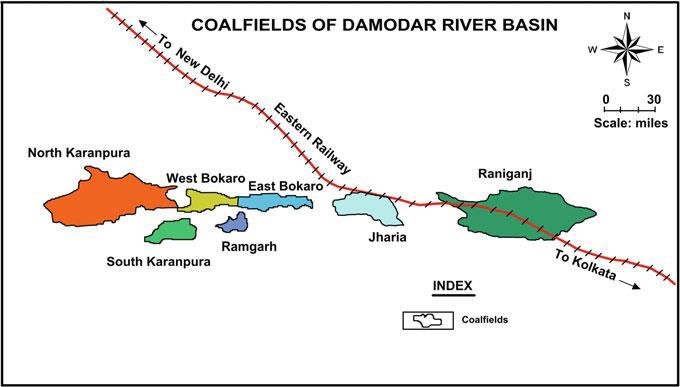
Rain fall deviation from normal

If we see the deviation in the last 10 years there has been absolute reversal of the pattern and out of
the ten year only three years have positive deviation otherwise seven years have negative deviation.

                       Rainfall Deviation between 2000-2010

1.4.3Seasonal Rainfall:

The district receives maximum rain from the advancing north east monsoon. Through the retreading
south west monsoon district also receives some rainfall. District has been mainly mono cropped and it
has only 3% area under irrigation as compared to 11% under the catchment area. It has been not
because that the district receives less rainfall but it has been mainly because land is undulating and it
causes fast runoff in the area. The variations as said above has been also high and it causes greater run
off. It has also been noticed in recent years that number of rainy days has been shrinking as evident
from the wet day data on the web site of India water portal.
There has been wide variation in the rainfall during the Khariff and Rabi season. It has been put as
graph and it shows that there has been decreasing rend over the last few years which can lead to a
significant decrease in the coming years. The highest rainfall in Kahriff has been reported in the year
1990 at 1693 mm and lowest in the year 1992 at 688 mm. Number of rainy days has decreased from
69 days /year to 63 days/year in the last decade.
Kahriff rainfall and Moving average for same
Rainy days
1.4.4 Rainfall trend in Rabi season:
The state and district are by-enlarge remain mono cropped, however the red lateritic soil is good for
vegetables and hence rainfall in Rabi or irrigation facilities has a great bearing on the cultivation in
Rabi season. Over the last few years there has been significant decrease in rainfall. Especially after
1996 the trend has been alarming.
The highest rainfall has been reported in the year 1919 at 138 mm and lowest rainfall has been
reported in the year 1999 at 37 mm. The trend has been showing that since 1992 in the month ofDecember there has been rarely rain while before 1992 there has been rain in the month of December.
Even in January there has been decreasing trend.
1.4.5 Average Monthly Rainfall:
The data for the last 30 years has been collected to know the trends and deviations in the each half of
fifteen years. The data has been collected for last 50 years from the web site. The trends have shown
that there has been variation in average monthly rainfall and for some decade starting from 1990 it has
shown an increasing trend and then it has started showing a decreasing trend for the district.
It has implications on the agriculture production and all livelihood activities based on land and water.
Even the allied livelihood activities of fisheries and animal husbandry are bound to be affected by the
changes in the precipitation regime.
Average rainfall 72-86 Vs 87-01
Rainfall in mm
72-86
87-011.4.6 Moving Average of the Rainfall:
It can be clearly seen that there has been a decreasing trend of rain fall indicted by the moving average
line. Post 1992 there has been decline in the average rain fall. The heaviest rain has been received in
the year 1994 at 1416.47 mm and lowest rainfall has been received in the year 1992 at 732.61 mm.
Rest of the years have received lesser rainfall and it varies with the last two year receiving
approximately 850 mm rainfall which is less than the average rain fall received by the state and the
district.
Rainfall and Moving average rainfall
Rainfall
Moving average
1.4.7 Extreme event analysis:
As mentioned above that in the last century there has been three decades with deficit average rainfall
where as in the last decade only there has been three average rainfall year. This indicates the absolute
reversal of trends in the last decade.
Rainfall Deviation ibetween 2000-2010There have been consecutive droughts in the year 2001-02-03, 2005-06 and 2009-10. It can be seen that on average every third year there has been drought. 1.4.8 Surface Water Resources Considering average annual rainfall of 1200 mm, the state receives 95,652 MCM rain water annually. However, as per the Second Bihar Irrigation Commission’s Report (1994), the total availability of water in the state of Jharkhand is 33,489 MCM, including downstream discharge from the basins. 1.4.9 Ground Water Resources Groundwater constitutes a major and widely used resource in Jharkhand for drinking and domestic purposes. However, it is not uniformly distributed due to the varied hydrogeology of the state. About 20% of the available ground water is used for irrigation mainly from privately owned dug well or shallow tube wells. District-wise ground water balance data indicate high levels of ground water withdrawal in certain urban agglomerations where groundwater potential developed is only a tenth of the utilizable reserves. Presently, the availability of water resource is only 287810 lakh m3, out of which 237890 lakh m3 is from surface water and rest 49920 lakh m3 is from ground water. The total utilization of surface and ground water in the state for irrigation purposes so far is only 47360 lakh m3, out of which 39640 lakh m3 is surface water and 7720 lakh m3 is ground water.
Today, nearly 90% of the water supplied to rural areas is from ground water sources whereas about
30% of the water supply in the urban areas comes from ground water sources and the rest from over
ground reservoirs and rivers. In the last 25 to 30 years the villages have shifted to the utilization of
water from surface water to ground water through wells and hand pump for their domestic purposes.
The annual replenishable ground water resource in the state has been established at 5.58 BCM
(Billion Cubic Meters) and net annual ground water availability is estimated to be 5.25 BCM (Central
Ground Water Board, 2006). Altogether, the state puts to use 21% of its ground water resources.
Table1 : Surface Water Snapshot of Jharkhand (Surface Water Information)
Average annual rainfall 1200 mm
Total average annual precipitation 95652 MCM
River Basin Area 79,262 sq. km
Surface water availability 27,528 MCM
Ground water availability 5,251MCM
Surface water usage 6,965 MCM
Allocation of Water- Table II
Surface Water Ground Water
Irrigation purpose 41% 89.40%
Industry & Drinking 5321 MCM 538 MCM
Municipal Use 6% 10.60%
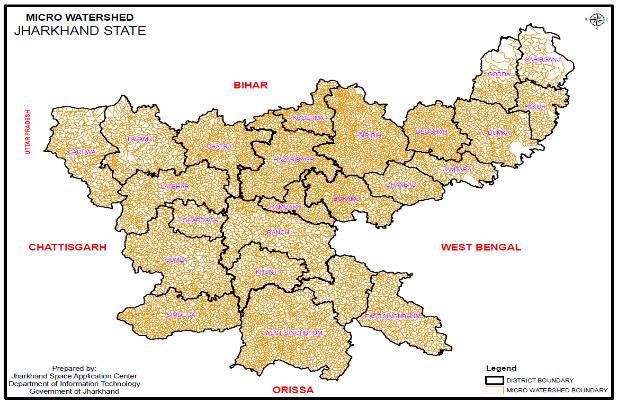
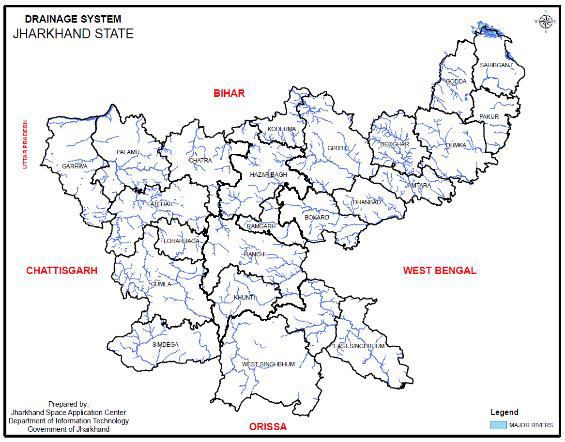
Industrial Use 13.76% Nil1.5 Drainage systems and Maps Jharkhand falls under the Chotanagpur Plateau from the North Eastern position of peninsular plateaus of India. The entire state is drained into Bay of Bengal. Major rivers such as Son, Damodar, Barakar, Subarnarekha, Brahmi and Baitarani and their sub drainage systems form nine major catchments in the state. These drainage systems and catchments are depicted by following two maps: Demarcation of micro-catchment areas The state of Jharkhand has 678 sub catchment areas, which has been further divided into 1952 mini catchment areas and finally broken up into 10,439 micro catchment areas5. The Rural Development Department has sought support from Jharkhand Space Application Centre (JSAC) under the aegis Department of Information Technology, Government of Jharkhand. JSAC digitized all sub- catchment area, mini-catchment areas and micro-catchment areas. These digitized maps are available for planning, review and monitoring. Each micro-catchment area has been given a unique code along with broad features of the catchment area. Below is the map showing micro- catchment areas in Jharkhand: 5 The area covered under a micro -catchment area varies from 60 hectares to more than 3,000 hectares depending on the drainage outlet of that area.
Major River basins and their watershed distribution

There are basically two regions of water shed in Jharkhand state, one that drain water into Ganges
river basin and second that is on southern part of Jharkhand state which drains water into rivers
flowing into Bay of Bengal other than Ganga and Brahmaputra.
The northern part of state that comes under Ganges water shed mainly drain its water to Lower
Ganga.
Damodar River basin which is sub basin of Ganges basin which drains into Lower Ganga. Damodar
sub basin have about 64 water shed in its basin as per Central Ground water board.
On the southern part there are about 32 water shed that drains water into Subarnarekha Riverwhich
further discharge water into Bay of Bengal.
Chapter 2
                             Damodar River Basin
Damodar is a rain fed, shallow, wide and flashy river, originating near the Khamarpat Hill on
Chotanagpur Plateau in the Palamau district of Jharkhand. It is a sub-basin and part of the
Ganges River System, having 10% of the total length and 2.7% of the total area of the Ganga
master basin. Damodar River flows through the industrial towns of Chandrapura, Ramgarh,
Bokaro, Jharia, Sindri, Dhanbad, Asansol, Andal, Durgapur, Burdwan, and Howrah before
joining the lower Ganga at Shayampur, 55 km downstream of Howrah (Sen 1991; Chandra
2003;
Bhattacharyya 2011). Its upper reaches known as Deonad, and in some of the local Jharkhand
languages, Damodar is also called as Damuda, ‘damu’ means sacred and ‘da’ means water.
Damodar basin is known for its coal deposits; accounting for 46% of the country’s coal
reserves.
It is considered as the centre of coking coal in the country (Sharma and Ram 1966). However,
Damodar basin is poor in metallic minerals. It flows through one of the richest mineral belts
in the world before joining the Hooghly at about 55 km downstream of Howrah. Coal mining
and mine-based industrial activities are the major source of economy with low agricultural
productivity in the upper part of the basin. The mining and industrial activities have made the
valley vulnerable to soil erosion and pollution. The ‘river of sorrow’ as Damodar was known
has now turned into the ‘river of agony’ from pollution point of view. Indian industry
depends on this region heavily; out of total 91% of the coal consumed by industry in this
country, a large share, i.e., 60% comes from the coal bearing belt of Damodar basin. The coal
requirement for power generation in the Jharkhand and West Bengal states entirely depends
on this area.
The catchment area of Damodar River basin extends from 22° 45′N to 24° 30′N to 84° 45′E
to 88° 00′E and is covering parts of Jharkhand and West Bengal which is about 11.8 and
8.6% of the total geographical areas of these two states, respectively (Fig. 1). The drainage
area of Damodar River basin extends over Hazaribagh, Ramgarh, Koderma, Giridih,
Dhanbad, Bokaro, and Chatra districts in Jharkhand and Burdwan and Hooghly districts in
West Bengal. It partially covers Palamau, Ranchi, Lohardaga, and Dumka districts in
Jharkhand and Howrah, Bankura, and Purulia districts in West Bengal. The observation
reveals that three-fourth of the total basin area lies in Jharkhand and one-fourth in West
Bengal. The total catchment area of basin is reported to be 25,820 km2 (DVC 1992).
However, Central Pollution Control Board (CPCB) has delineated catchment area of the
Damodar basin as 23,170 km2 only with sub-catchment areas as follows:

Sl. No.                       Name of the State                 Catchment Area (Km2)

1                             Main Damodar River                15,280

2                             Baraker tributary                 7,025
3 Bokaro–Konar tributaries 865
Total 23,170
Fig. 1 Drainage map of Damodar River basinRiver Course and Major Tributaries Damodar River along with its major tributary Barakar constitutes the core area of the Damodar River basin. Barakar, Konar, Bokaro, Haharo, Jamnia, Ghari, Guaia, Khudia, and Bhera are the major tributaries and sub-tributaries of Damodar River (DVC 1992; CMRI 2001). The river in its upper reaches traverses through the steep slope of the pat region to descend on the gneissic flat plain of Chandwa, and flow of the river becomes sluggish over the flattop surface (Fig. 4a). The landscape around the river changes after its entry into Gondwana area and confluence with Dharamauti. Waterfalls occur abound the courses of the streams due to steeper gradient of the stream in this region. After it, the river passes through the hard sandstone and grit of Gondwana rocks in hilly and woody areas. In this part, a number of tributaries such as Saphi, Batuka, Nalkari, Barki-Garhi, and Ramghat-Haharo meet with the Damodar River both from the southern and the northern sides. Before entering the Gondwana basin, these tributaries have characteristic headword erosion and flow over the Archaean granite-gneissic surface. The tributaries Konar and Bokaro originate over the Hazaribagh plateau near Hazaribagh town, and their combined courses meet Damodar River near Tenughat. The river Konar flows over Archaean gneiss country rocks, and a dam has been constructed near Gumea (Fig. 2). The Bokaro River flows through the Archaean gneiss and enters into the Gondwana basin near Bokaro coalfields. Damodar traverses further east after Tenughat and joined by some more tributaries both from the north and south side before reaching Panchet. The Jamunia and the Khudia which flow over the Raniganj coalfields area are the main tributaries joined the Damodar River from north side. Ijri and Gowai tributaries meet the Damodar River from the south side near the western end of the Panchet reservoir. A dam has been constructed on the Damodar River near Panchet hill, 5 km west of its confluence with the river Barakar. The river Barakar originate from the Koderma plateau and runs for a long distance before meeting the Damodar River near Dishergarh. The Barakar River has a total catchment area of 7,025 km2. It traverses through a steep-sided valley near its source region and drains into Tilaiya reservoir near Hazaribagh. The Barakar further emerges out of Tilaiya reservoir and meanders southeast. Barsoti and Usri are two important tributaries of river Barakar. A multipurpose dam has been constructed on the Barakar River at Maithon, which is 13 km upstream of Dishergarh. The Damodar River passes through flat alluvial plain after its confluence with Barakar River and runs towards southeast and east up to Barsul in Burdwan (Fig. 4b). Near Durgapur, 60 km east of its confluence with the Barakar, a barrage has been constructed over the Damodar River. After that, the river turns toward south near the village Chachai. The river flow becomes very sluggish at this part, and surplus water during monsoon seasons is carried by several spill channels locally, known as hanas. Damodar splits into two channels, Mundeswari and Amta, after flowing further south. The Damodar further traverses over the Arambagh of Hooghly district and Uluberia of Howrah district to join the Hooghly River at 55 km downstream of Kolkata.
Physiographically, the upper catchment of the Damodar basin is quite different tothe lower
part of the basin (DVC 1992). Three major geological features of the Damodar basin are:
(i)          Peninsular shield mainly consisting of granites and gneisses of the Archaean Age,
(ii)         Gondwana tract filled up by sediment during the Permo-Carboniferous period (Older
             Alluvium)
(iii) Bengal basin filled with
Newer Alluvium during Tertiary and Quaternary periods. Based on these geomorphological
characteristics, Damodar valley may be divided into three micro-geomorphic units:
       (i)     Plateaus, Hills and Ghats: Several plateaus are identified and classified asUpper,
               Middle, and Lower plateaus and, respectively, named as Ranchi, Hazaribagh, and
               Koderma plateau in the upper Damodar region. Similar land form characteristics
               have been observed in these plateaus. The flat,severely gullied, isolated, low
               rounded hills and monadnocks are scattered all over the platform (Mahadevan
               2002).
(ii) Dissected and Degradational Uplands:The dissected and degradational uplands
stretch over the middle part of Damodar valley. The areas fall in Purulia, Bankura
Burdwan, and Birbhum districts of West Bengal and Ramgarh, Bokaro, Dhanbad,
Giridih, Jamtara, and Dumka districts of Jharkhand. Major river valley is flanked
from west to east by the typical landforms. These are the remnants of the older
peneplains and marked by steep slope with very high relative relief around
Parashnath hill. This area has highest elevation of 1345 m in the Damodar valley
region.
(iii) Aggradational Flat Plains: This region is separated to the west from the
degradational and dissected uplands by a line approximately joining Arambagh,
Burdwan, and Bolpur. This region is characterized by monotonous flat alluvial
plains of shifting rivers with less than 15 m relative relief.Chapter 3
Socio-Economic Importance
Water Resource and Its Uses
The Damodar River was regarded as a flood-prone river due to its long history of the endemic
floods and commonly known as ‘Sorrow of Bengal.’ History of the endemic floods in the
Damodar River can be traced back from 1730 onward (Bhattacharyya 1999). Records show
that during the floods, peak flow of 8496 cumec or more occurred thirty seven times between
the years 1823 and 2007 (Bhattacharyya 2011). Different strategies including construction of
embankments, weir, dams, and barrages were adapted to deal the caprices of this vital water
resource by government agencies and local peoples. Damodar Valley Corporation (DVC), a
multitask organization, was constituted in year 1948 on the model of Tennessee Valley
Authority (TVA) for development and management of natural resources of Damodar River
basin. Damodar Valley Corporation (DVC) constructed India’s first multipurpose dams at
Tilaiya (1953), Konar (1955), Maithon (1957), and Panchet (1959). A barrage was
constructed on Damodar River near Durgapur for irrigation purpose in 1955. In year 1978,
one more reservoir was constructed on the mainstream of Damodar at Tenughat in Jharkhand
state (Chandra 2003; Bhattacharyya 2011). Dams of Damodar Valley Corporation are capable
of moderating floods of 6.51 lac cusec to 2.5 lac cusec. Four reservoirs of DVC having a
flood reserve capacity of 1292 mcm. This can moderate a peak flood of 18,395 cumec to a
safe carrying capacity of 7076 cumec. Four DVC reservoirs store 419 mcm of water which
are supplied to meet industrial, municipal, and domestic requirements in West Bengal and
Jharkhand states. Durgapur barrage was mainly commissioned to supply the irrigation water
especially for Burdwan, Bankura, and Hooghly districts of West Bengal. The DVC has
generated irrigation capacity of 3640 km2, besides water supply for industrial and domestic
uses (Chandra 2003). Effective water management planning of Damodar Valley Corporation
has turned the devastating river Damodar from a ‘River of Sorrow’ to a ‘River of
Opportunities.’
(ii) Mineral Resources and Industrial Activities
Damodar basin is regarded as the storehouse of Indian coal. Apart from coal, iron, limestone,
bauxite, baryte, mica, fire clay, china clay, etc., are the other minerals associated with the
geological formations of the Damodar valley. Coal is the most important mineral resource of
the basin, and coal deposits in the Damodar River basin may be divided into seven coalfields,
namely Jharia, Raniganj, East Bokaro,West Bokaro, North Karanpura, South Karanpura, and
Ramgarh (Fig. 3). Out of these coalfields, Jharia and Raniganj are oldest one and it bears
large number of workable coal mines. Besides coal, limestone quarries are found in Palamau
and North Karanpura areas and fireclay in Jharia and Raniganj coalfields area (Chandra
1992).Damodar River basin is a highly industrialized area having a large number of coal
mines and coal-based industrial establishments such as steel plants, thermal power stations,
coal washeries, metal smelting plants, chemical plants, cement mills, beehive cock oven
plants, metal alloy, steel re-rolling mills, refractories, mica and glass industries, as well as
lime and brick kilns. There are more than 300 operating coalmines, which provide basic
inputs for the other activities. Other than major industries, there are a number of small scale
as well as ancillary industrial units. These units apart from providing jobs to the localpopulation contribute significantly to the economy of the basin. The units comprise of mini workshop, tobacco processing units, textile and textile product units, petroleum and coal product units, chemical and chemical product units. There are five steel plants, eleven thermal power plants, ten cement factories, twenty-four coal washeries, sixty-four refractories, four hard coke oven plants, fourteen beehive coke oven plants, three hydroelectric power plants and number of other miscellaneous industries exist in the Damodar River basin. The thermal power stations of the basin having total installed capacity of 10,200 MW. Apart from these, three hydroelectric power plants having a capacity of 144 MW and one gas turbine power plant in Maithan with a capacity of 82.5 MW are also contributing toward the power generation in the basin. (iii) Natural and Anthropogenic Hazards Damodar is a rainfed river, and about 80% of the annual river discharge occurs during the four monsoon months ranging from June to September. Around 1400 mm annual rainfall occurs over the Chotanagpur plateau area, out of this more than 85% rainfall takes place in the monsoon months between June and August. The high monsoonal rainfall resulted imbalances in river flow and caused frequent flash floods in many parts of the basin. Though, floods sometimes affect the lower Damodar Valley but after construction of dams and reservoirs, the havoc it created in earlier years is now a matter of history (Ghosh 2013). The floods were virtually an annual ritual for Damodar River basin in the past. The damage was probably more in some years and of lesser magnitude in other years. The great floods of the Damodar River in pre-dam phase are recorded in the years of 1770, 1855, 1866,1873, 1874, 1875, 1876, 1884, 1891, 1897, 1900, 1907, 1913, 1927, 1930, 1935,and 1943. The massive floods in southern West Bengal had been occurred in 1959,1978, 1995, 1999, 2000, 2006, 2007, and 2009 in spite of flood regulation by the DVC and construction of dams and reservoirs. This signifies the vulnerability of lower valley to sudden floods even in post-dam era during monsoon season (Bhattacharyya 2011).
Damodar flows through India’s richest mining and industrial belt and considered as the most
polluted river in India. The river Damodar and its tributaries drain almost the entire coal
mining areas of North and South Karanpura, West and East Bokaro, Ramgarh, Jharia and
Raniganj coalfields. Occurrences of coal and easy availability of water and power favored the
setting of coal-based industries and power plants in this area. Coal washeries, thermal power
plants, coke oven plants, soft-coke batteries,steel, cement, and explosives plants are the major
industrial units of theDamodar basin. These industrial units draw water from the Damodar
River or it stributaries and many of them are discharging their untreated effluents into the
river. The contamination of the river water is mainly due to excessive excavation and
disposal of oil, fly ash, poisonous metals and coal dust. Defective and unscientific excavation
operations, outmoded processing activities, and deficiency of right upkeep were intensified
by insufficient pollution check measures and public ignorance toward environmental
protection (Fig. 4c–f). The inhabitants residing in the valley were gradually being poisoned
due to the fact that Damodar and its tributaries were the only source of drinking water for
majority of inhabitants residing in the locality. Study shows that the total suspended solids
(TSS) concentration at most places along the upper and middle stretches of the Damodar
River is much higher than the permissible limit (Fig. 4f). Coal mining and washeries account
for the bulk of pollution in terms of atmospheric dusts, suspended solids, oil, and grease.
Open-cast mining accounts for 60% of the coal production in the Damodar valley.
The open-cast mining and associated activities cause serious problems of land degradation,
dust generation, and deterioration in environmental quality of the region (Choubey 1991;
CMRI 2001; Tiwary 2001; Singh et al. 2008). The disposal and management of overburden
materials and fly ash is also a serious challenge for the coal authorities. Mine fire is the other
serious environmental issue associated with the coal mining areas of Damodar River basin
(Fig. 4d). More than seventy coalmine fires, covering 17.32 km2 areas are reported from the
mining areas of Jharia coalfields (BCCL 2003). Jharia mine fire is one of the largest coalmine
fire complexes in the world (Gupta and Prakash 1998). Mine fire gives rise to continuous and
uncontrolled emission of greenhouse gases such as CO2, NOx, SO2, CO, CH4, C2H6, and
C3H6 due to surface and subsurface burning of coals throughout the coalfield areas.
(iv) Erosion and Siltation
The fluvial environment of the lower Damodar basin has undergone gradual changes in post-
dam era due to construction of dams and reservoirs and diversion of water through canals.
The upper Damodar River catchment is susceptible to soil erosion, and extent of erosion
depends on the slope, rainfall intensity, soil characteristics, and vegetative cover. The soil
erosion problem is more severe in the catchment areas of the five reservoirs. Severe erosion
in the catchment is not only causing formation of wasteland but also posing the problem of
siltation and reduction in the reservoirs storage capacity (Ghosh 2014). Continuous sediment
generation and its transportation to the lower part of the valley kept on raising the river bed
year after year (Fig. 4b). The problem of siltation has also been aggravated by storing of
monsoon rainwater in the dams and barrages as the annual flushing of sand–silt–clay was
greatly checked. In this way, the then dynamic Damodar is now flowing very sluggishly
through the braided course. The bars and islands are so stable that not only those are used for
crop production due to higher fertility status but even settlements have been developed in
many places as also the pathways across the river in the dry period (Ghosh 2014). Land-use
alteration and natural river flows have a great impact in terms of volume and velocity of
water flows and determining the relationship between dissolved and sediment load to the
water discharge, river bank erosion, frequent shifts in the direction of river course sand
discontinuation of some old distributaries. The reduced river flow and increased sediment
load cause heavy siltation and led to the development of increasing quantum of falls channels
(blind rivers), marshes, oxbow lakes, etc. Further, to save the dams from bursting due to
overfilled reservoirs, the DVC authorities release huge quantity of water with a very short
notice, making an avalanche of water flow over the already monsoon submerged agricultural
fields and settlements. On the other hand, during the dry summer season while the farmers
are hoarsely crying for irrigation water for their parched fields to save crops, the DVC
remains reluctant to release adequate quantity of water as that may lower the water level in
the reservoirs affecting adversely the generation of hydroelectric power which is committed
for the industries in the upper catchments. Such circumstance forced the farmers to tap the
groundwater more and more for irrigating their lands and overexploitation of groundwater led
to lowering of water table and minimization of available annual water resource for future
exploitation.
Out of the 7 identified Polluted River Stretches in Jharkhand 4 River stretches comes
under Damodar Basin identified stretches are as follows:
   1.   Nalkari River –   along Patratu
   2.   Garga River   –   along Telmuchu bridge
   3.   Konar River –     along Tilaya and Konar
   4.   Damodar River –   along Phusro Road bridge to Turio
1. Nalkari River
   The Nalkari, a tributary of the Damodar river that flows through the eastern states of Jharkhand and
   West Bengal. Around 7 kilometers from Patratu in Jharkhand, the Nalkari carries huge quantities of
   oil and ash, discharged by the Patratu Thermal Power Station (PTPS).
   The Patratu dam was built to store the fresh water of the Nalkari river, so that the PTPS can run.
   The effluents discharged from the plant are being thrown in the river, which is not only poisoning
   the Nalkari but also, the Damodar river, which it meets downstream.
     PARTICULARS OF SEWER DRAIN FALLING INTO NALKARI RIVER:
 SNo.   LOCATION      SOURCE        OF   DISCHARGE              LENG   WIDTH     DEPTH     GRADIENT OF
                      GENERATION                                TH                         THE
                                         (KLD)                         (m)       (m)       RIVER(cm/km)
                                                                (km)

                                         Max      Min
 1      Patratu       PTPS Colony        Not      Not           1.5    2         1         Not Known
                                         Known    Known
 2      Patratu       Patratu            Not      Not           3      2         1         Not Known
                      Railway            Known    Known
                      Colony
 3      Saunda        Saunda       “D” Not        40            2      1         1         Not Known
                      Colony             Known
 4      Saunda        Central Saunda Not          106           3      1         1         Not Known
                      Colony             Known

     PARTICULARS OF INDUSTRIAL EFFLUENTS FALLING INTO NALKARI RIVER:
 SNo.     LOCATION      SOURCE     OF    DISCHARGE          LENGTH     WIDTH    DEPTH    GRADIENT         OF
                        GENERATION                                                       THE
                                         (KLD)              (km)       (m)      (m)      RIVER(cm/km)

                                         Max     Min
 1        Sayal         Sayal      “D” 4860      Not        2          2        2        Not Known
                        OCP                      Known
 2        Sayunda       Sayunda”D”       2430    Not        3          2        1        Not Known
                        Mine Water               Known
 3        Bhurkhnda     Bhurkhunda       32      Not        4          3        2        Not Known
                        Colliery                 Known
2. Garga River
Origin – Near Kasmar Village 'Kalaundi Baandh, Jharkhand
Total Length – 46.51km Garga flows through Bermo and Chas and discharge into
Damodar River near Telmuchu Bridge
It faces direct discharge of drain water of Chas Municipal Corporation areas and
Bokaro Steel City residential colonies.
State government to remove illegal hutments along the banks of Garga, especially in
Chira Chas locality, and set up a wastewater (sewage) treatment plants so that toxic
water is not discharged into the river.
We would also suggest Chas Municipal Corporation to construct soak pits for houses
near the riverbed so that direct discharge of sewage into the river can be prevented
The NGO functionary added that soil and sand were being illegally extracted from
Garga banks that would cause long-term ecological damage.
STATUS OF WATER QUALITY OF GARGA RIVERS
FECAL TOTAL
COLIFORM COLIFOR
YEAR LOCATION DO(mg/l) pH BOD(mg/l) COD(mg/l) (MPN/100ml M(MPN/10
) 0ml)
Min Max Min Max Min Max Min Max Min Max Min M
a
x
2017 Garga River 5.9 6.9 6.4 7.5 4.8 6.2 96 112 - - - -
near Talmuchu
Bridge
2018 Garga River 5.8 7.4 6.3 7.5 2.3 4.6 92 108 - - - -
near Talmuchu
Bridge
3. Konar River
Origin – Sultana village on the Hazaribagh-Chatra Road
Konar with its tributary Siwani drains a greater portion of the Hazaribagh plateau, and then
descending through the barren wastes of scrub and jungle passes Gomia to receive the waters of
the Bokaro River, shortly before it joins the Damodar River near Jaridih Bazar in Bokaro district.STATUS OF WATER QUALITY OF KONAR RIVERS
FECAL TOTAL
COLIFORM COLIFORM(MPN/10
YEAR LOCATION DO(mg/l) pH BOD(mg/l) COD(mg/l) (MPN/100ml) 0ml)
Min Max Min Max Min Max Min Max Min Max Min Max
2017 Near Swang Coal 7.3 7.8 6.4 8.4 1.7 2.8 56 72 - - - -
Washery
2018 Near Swang Coal 7.2 7.5 6.6 8.2 1.9 2.6 72 96 - - - -
Washery
PARTICULARS OF SEWER DRAIN FALLING INTO KONAR RIVER:
SNo. LOCATION SOURCE OF DISCHARGE LENGTH WIDTH DEPTH GRADIENT OF THE
GENERATION RIVER(cm/km)
(KLD) (km) (m) (m)
Max Min
1 Hazaribagh Hazaribagh Not Not 3 3 2 Not Known
Town Known Known
2 Konar Konar Colony Not Not 1 1 1 Not Known
Known Known
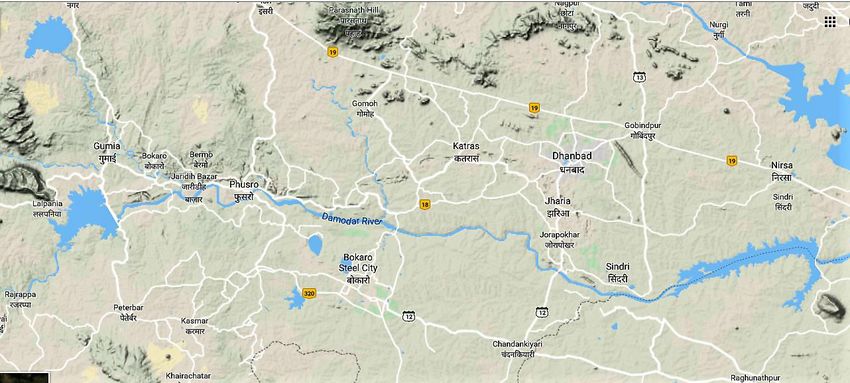
4. Damodar River
Origin – Chandwa, Latehar, Chota Nagpur Plateau, Jharkhand
The Damodar River is one of the most Pollute drivers in eastern India. It lies on the Chota
Nagpur Plateau in the state of Jharkhand. The river runs according to an easterly itinerary for
a stretch of around 592 km, traversing Jharkhand and West Bengal to the estuary of the
Hooghly River.
The tributaries and sub-tributaries of the Damodar include:-
Konar ,Barakar, Haharo, Bokaro, Ghari, Jamunia, Khadia, Guaia, Bhera
At present, Damodar is one of the most contaminated rivers in India due to the various
industries that have mushroomed on its riverbanks. There are number of coal-oriented
industries that are scattered over the Damodar basin. Majority of them are government-owned
coke oven plants, coal washeries, iron & steel plants, glass, zinc and cement plants and
thermal power plants.In addition, there are number of towns situated on the banks of the river. As narrated earlier, Dhanbad, Ramgarh and Phusro are the important towns within Jharkhand state. While the industrial units are controlling their discharges by adopting suitable treatment methods, there is no treatment given to the domestic sewage being discharged into the river. Data from Jharkhand State Pollution Board was studied, which clearly indicates that the liquid discharge from industries into the river is within the prescribed norms. This means untreated sewage discharge is the main cause of pollution of Damodar water, although further confirmatory investigation may be required to corroborate the fact and the level of pollution in the river.
PARTICULARS OF SEWER DRAIN FALLING INTO DAMODAR RIVER:
SNo.   LOCATION     NAME       OF   DISCHARGE         LENGTH   WIDTH   DEPTH   GRADIENT OF
                    INLETTING                                                  THE
                    DRAIN           (KLD)             (km)     (m)     (m)     RIVER(cm/km)

                                    Max       Min

1      Bachra       Bachra          15946.8   Not     2        15      3       Not Known
                    Colliery                  Known
2      Urimari      Urimari         200       Not     1        3       1       Not Known
                    Colliery                  Known
3      Sayal        Sayal           Not       Not     1        1       2       Not Known
                    Colliery        Known     Known
4      Giddi        Giddi           1525      Not     1        2       1       Not Known
                    Colliery                  Known
5      Bhurkunda    Bhurkhunda      312       Not     2        1       1       Not Known
                    Colliery                  Known
6      Barkakhana   Barkakhana      Not       Not     4        2       2       Not Known
                    Railway         Known     Known
                    Colony
7      Ramgarh      Ramgarh         Not       Not     0.5      3       1       Not Known
                    Cantt           Known     Known
8      Ramgarh      Ramgarh         Not       Not     0.5      1       0.5     Not Known
                    Township        Known     Known
9      Rajrappa     Rajrappa        1500      Not     5        2       1       Not Known
                    Colony                    Known
                    CCL
PARTICULARS OF INDUSTRIAL EFFLUENTS FALLING INTO DAMODAR RIVER:
SNo LOCATION SOURCE OF DISCHARGE LENG WIDTH DEPTH GRADIENT
. GENERATION TH OF THE
(KLD) (m) (m) RIVER(cm/km)
(km)
Max Min
1 Piparwar Ashoka OCP Not Not 4 10 5 Not Known
Mine water Know Known
2 Bachara Bachara 800 Not 1 2 1 Not Known
Underground( Known
Mine Water
3 Urimari Birsa 400 300KL 2 2 1 Not Known
Mines OCP(Mine D
Water)
4 Urimari Urimari 400 Not 1 2 1 Not Known
Mines OCP(Mine Known
Water)
5 Karma Karma OCP 624 Not 0.5 2 1 Not Known
OCP Known
6 Giddi Giddi “A” 1050 Not 4 1 1 Not Known
Mnie Water Known
7 Giddi Giddi “C” 300 Not 2 5 2 Not Known
Mine Water Known
8 Religarha Religarha Not Not 2 5 2 Not Known
OCP Mine Known Known
Water
9 Rajrappa Rajrappa OCP 50 Not 2 2 2 Not Known
Mine Water Known
-STATUS OF WATER QUALITY OF DAMODAR RIVER
FECAL TOTAL
COLIFORM COLIFORM(MPN/10
YEAR LOCATION DO(mg/l) pH BOD(mg/l) COD(mg/l) (MPN/100ml) 0ml)
Min Max Min Max Min Max Min Max Min Max Min Max
2017 Damodar at 6.9 7.5 7.2 7.5 2.1 2.7 76 92 - - - -
Phusro Road
Bridge
2018 Damodar at 7.2 7.6 7.3 7.6 2.0 2.5 80 96 - - - -
Phusro Road
BridgeSolid Waste Management Factsheet:-
Collection Wet Waste Dry Waste
Total Total Total Total Dry
No of Total
Sl. Total Total Wet Wet Total Wet No. of Dry Waste
ULB No of Wards Dry
Waste Waste Waste Waste Waste % Recycler Waste Processing
N Wards with Waste
generation collection generati Collecti Processin Processing Tagged Generat through
o (No.) D2D Collectio
(TPD) (TPD) on on g (TPD) No.) ion Recycler
(No.) n (TPD)
(TPD) (TPD) (TPD) (TPD)
1 Chas 35 35 46.5 46.5 19.5 18 18 92.31 6 27.5 27.5 20
2 Dhanbad 55 55 455 455 257.1 257.1 257 99.96 12 197.9 197.9 130
3 Phusro 28 28 22 22 9 9 5 55.56 1 12 12 8Chapter 4
ACTION PLAN WITH TIMELINE
A. Action Plan- Short Term and Long Term Action and the Identified
Authorities for initiating actions and the time limits for ensuring compliance
Sl.No. Action plan for rejuvenation of river Concerned Time Target
Dept.
A Industrial Pollution Control
1 Compliance of industries located in catchment area with JSPCB Continuous
respect to effluent discharge standards and its disposal as per
consent conditions
2 Inventorization of the industries in the catchment area of JSPCB Continuous
Rivers covering assessment on aspects relating to Status of
Consents under Water & Air Acts and Authorization, Effluent
Generation, ETP capacities and final mode of effluent
discharges
3 Actions against the Identified industries in operation without JSPCB Continuous
Consents under Water & Air Acts/Authorization under the
H& OW ( M & TM) Rules, 2016 as amended
4 Action against the industries not installed ETPs or ETPs exist JSPCB Continuous
but not operating or ETP outlet or treated effluent is not
complying to the effluent discharge standards or norms
5 Action against the red category industries for installation of JSPCB Continuous
OCEMS and not transferring data to CPCB and JSPCB
6 Small scale/tiny and service providing units located in urban Local December
or semi-urban limits like Dairies, Auto Service Stations to Authorities/ 2019
have minimum provision of O & G traps Municipal
Corporation7 Prohibition of burning of any kind of waste including agro State Govt. / Continuous
residues District
Administration
and Local
Authorities
& Agriculture
Department
8 Directions to all the Industries which are observed to be not in JSPCB/ District Continuous
operation or closed or temporarily closed to remain close till Administration
further orders from JSPCB.
9 Estimation of industrial effluent generation and the existing State September
CETP capacity and to arrive gap between the industrial Government , 2020
effluent generation and the existing treatment capacity District/Local
Administration
10 Channelization of industrial effluents to CETPs for ensuring State December
treatment to comply with the discharge standards. Government , 2020
District/Local
Identification of suitable site within industrial areas,
Administration
Execution and Commissioning of Adequate Capacity CETPs.B. Short term and long term action plans for rejuvenation of rivers and the
implementing agencies responsible for execution of the action plans and the
time limits are given in table as below :-
Concerned
Sl.No. Action Plan For Rejuvenation Of River Time Target
Dept.
A Sewage Treatment and Disposal Plan
State
District-wise estimation of total sewage generation, Government,
existing treatment capacities, quantum of disposal of UDD, Water March 2020
1 sewage presently through drains and the gaps in sewage Resource Dept.,
treatment capacity. District
Administration
and Local bodies
State
To undertake measurement of flow of all the drains Government,
presently contributing pollution load in rivers and to UDD, Water March 2020
2 formulate detailed project report (DPR) for each drain Resource Dept.,
and corresponding town and submission of DPR. District
Administration
and Local bodies
State
Government,
Proper design, execution of STPs with full utilization UDD, Water
3 capacity Resource Dept., March 2020
District
Administration
and Local bodies
Channelization including diversion of sewage generated State
from household/town ships/villages to sewer Government,
4 UDD, Water March 2021
lines/interception of all the drains presently carrying
sewage and for ensuring proper treatment through the Resource
Dept.,
upcoming STPs District
Administrationand Local bodies
Ensuring dairy/automobile service stations and Hotels /
Restaurants particularly located on road-side should
5 Local authorities March 2020
have a treatment system and levy of fine in case found
Violations
B Ground water quality
Rural drinking
water and
Sealing of contaminated hand pumps and found to be September
1 Sanitation
unfit for drinking purpose by the public 2020
Department and
Local authorities
Rural drinking
water and
Supply of potable water to the affected communities in
2 Sanitation March 2020
the identified critical blocks
Department and
Local authorities
Carrying assessment of ground water survey for quality
Ground Water
3 and to identify over exploited and critical blocks in the March 2020
Authority
districts
To conduct periodic surprise inspection of the industry JSPCB & Ground
4 to rule out any forceful injection of industrial effluents Water Authority Continuous
into ground water resource
Continuous
(The
proposed
All the industry should be directed to obtain NOC from CGWB/ CGWA new
the CGWB and action against the Units in Operation and .Ground industries
5 without obtaining of NOC from CGWA Water Authority will be
directed to
obtain NOC
from
CGWA)To ensure rain water harvesting by the industrial,
CGWA/ Ground
commercial and other institutions and groundwater
Water Authority/ March 2020
6 recharging with only clean water be encouraged by
JSPCB
CGWB/CGWA
C. Proposed Action Plan by various Department of Govt. of Jharkhand
Phases Actions Required Role
through work break
down structure
Pre- Planning Phase Identification of problem JSPCB
related to river health
(Recognition Phase)
Assessment of drivers JSCPB, Industries, WRD,
and barriers for the UDHD
problem
Assessment of catchment WRD
and valley area bio-
physical properties
Stakeholder consultations River Rejuvenation
and development of road Committee
map
Planning Phase Formation of core team – River Rejuvenation
Management -technical Committee
(Restoration Phase)
team- Community
mobilization team
Survey of the river sites WRD, Industries, JSPCB,
and prioritization of UDHD
restoration measures
Community mobilization Industry, JSPCB, UDHD,
District AdministrationPreparation of detailed River Rejuvenation
project report (Technical Committee
and Financial)
Implementation Phase Prioritization of measures River Rejuvenation
Committee
(Protection Phase)
Implementation of UDHD, Industry, JSPCB,
measures District Administration
Monitoring/Regulation of JSPCB (Regulate and
the implantation Monitor),
measures
JSPCB to work in
coordination of UDHD,
Industries, District
Administration to execute the
measures
Documentation of JSPCB, UDHD and
measures Industries
Scaling Up Phase Identification of lesson River Rejuvenation
Committee
(Improvement Phase)
Review and consultation River Rejuvenation
Committee
Planning for second River Rejuvenation
phase Committee
D. Achievable water quality goals with specific timelines
Sl.No. ACTION TO BE TAKEN TIMELINES
Identification and Cleaning of major drains directly September 2020
1
falling into Rivers of Jharkhand
Cleaning all tributary drains of Jharkhand River, – September 2020
2 Setting up of decentralized sewage treatment plants and
allied works
Trapping/ cleaning of remaining identified drains September 2020
3
directly falling into RiverYou can also read