Introduction of GIS into IKEA's wood sourcing system
←
→
Page content transcription
If your browser does not render page correctly, please read the page content below
Introduction of GIS
           into IKEA’s wood sourcing system
            Aspects of forest resource data availability
                    and system functionality

Renats Trubins
Supervisors: Mikael Andersson, SLU
Kjell-Owe Ahlskog, Alexey Naumov, IKEA

Swedish University of Agricultural Sciences
Master Thesis no. 134
Southern Swedish Forest Research Centre
Alnarp 2009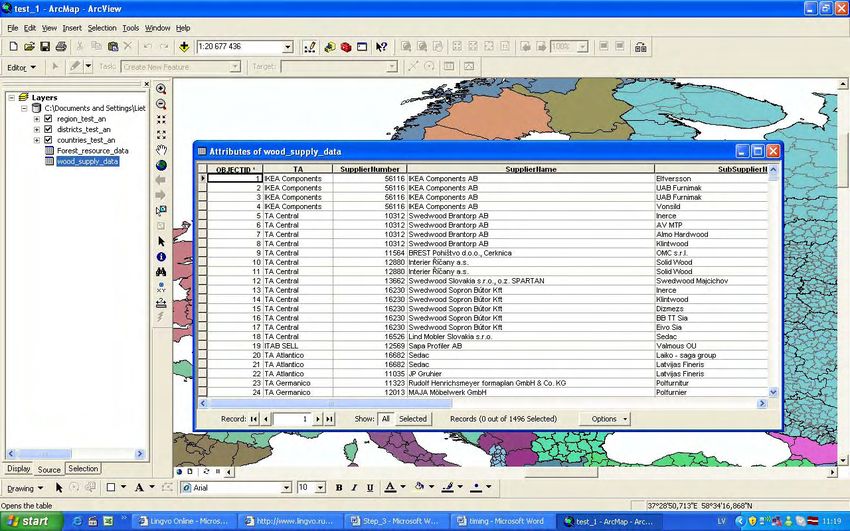
Introduction of GIS
              into IKEA’s wood sourcing system
               Aspects of forest resource data availability
                       and system functionality

Renats Trubins
Supervisors: Mikael Andersson, SLU
Kjell-Owe Ahlskog, Alexey Naumov, IKEA
Eximanator: Ola Sallnäs

Swedish University of Agricultural Sciences
Master Thesis no. 134
Southern Swedish Forest Research Centre
Alnarp 2009
Master thesis in Forest Management, SLU course code: EX0506 Advanced level(E) 30HEC (ECTS)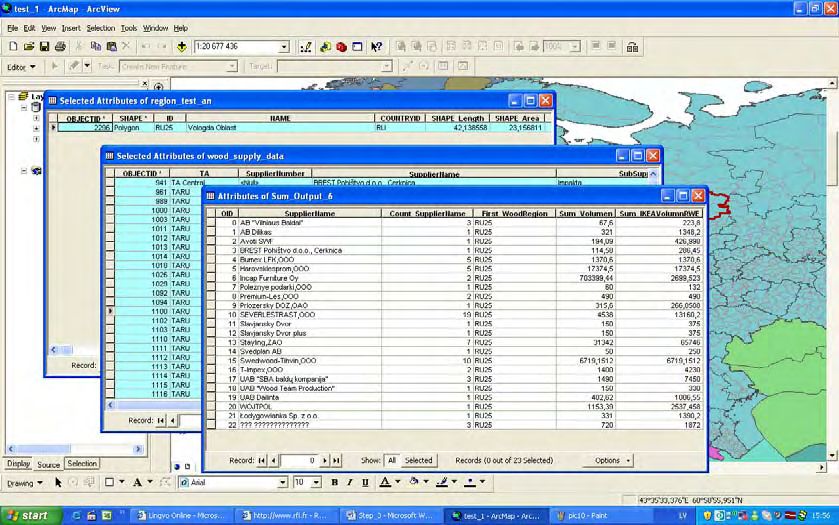
CONTENTS

ABSTRACT..................................................................................................... 4
1. INTRODUCTION....................................................................................... 5
1.1. Aim of the study....................................................................................... 11
2. MATERIALS AND METHODS ............................................................. 12
3. RESULTS .................................................................................................. 16
3.1. Examples of GIS applications in wood origin tracing ............................. 16
3.2. Wood origin regions in IKEA forest tracing system ............................... 18
3.2.1. Review of countries’ territorial division ............................................... 19
       Bulgaria.................................................................................................. 21
       Romania ................................................................................................. 21
       Estonia.................................................................................................... 22
       Latvia ..................................................................................................... 22
       Lithuania ................................................................................................ 22
       Finland ................................................................................................... 23
       Sweden................................................................................................... 23
       Czech Republic ...................................................................................... 23
       Slovakia.................................................................................................. 24
       Poland .................................................................................................... 24
       Ukraine................................................................................................... 24
       Belarus ................................................................................................... 25
3.3. Availability of forest resource data at regional level ............................... 26
3.3.1. Selected records .................................................................................... 26
3.3.2. International information sources ......................................................... 26
       FAO........................................................................................................ 27
       Eurostat .................................................................................................. 27
       EFISCEN ............................................................................................... 27
3.3.3. National information sources................................................................ 30
       Bulgaria.................................................................................................. 30
       Romania ................................................................................................. 30

                                                                                                                         2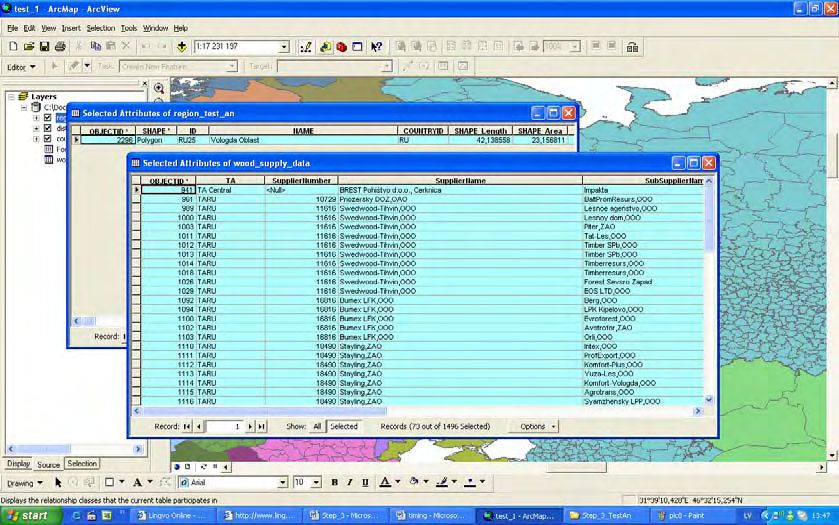
Estonia.................................................................................................... 31
       Latvia ..................................................................................................... 32
       Lithuania ................................................................................................ 33
       Finland ................................................................................................... 34
       Sweden................................................................................................... 35
       Czech Republic ...................................................................................... 36
       Slovakia.................................................................................................. 37
       Poland .................................................................................................... 38
       Ukraine................................................................................................... 39
       Belarus ................................................................................................... 39
3.3.4. Summary of data availability assessment ............................................. 41
3.4. System functionality ................................................................................ 43
3.4.1. Required basic system functionality ..................................................... 43
3.4.2. Sample database.................................................................................... 45
3.4.3. Examples of basic functions ................................................................ 46
4. DISCUSSION ............................................................................................ 50
5. CONCLUSIONS ...................................................................................... 52
ACKNOWLEDGMENTS ............................................................................ 53
REFERENCES.............................................................................................. 54

                                                                                                                         3
ABSTRACT

Being a large home products retailer IKEA uses around six and a half million cubic
meters of wood annually in its products. IKEA has a wide range of suppliers in many
countries all around the world. In 2007 IKEA launched a project introducing GIS into the
company’s wood sourcing system. The present study was conducted during the summer
and autumn of 2007 in collaboration with IKEA. Its aim was to investigate issues that had
arisen in the course of the GIS project in the company, such as region of origin in wood
tracing, availability of forest resource data on sub-country regional level. In addition, this
study is to provide an insight into the systems future usage by building a sample database
and testing essential functionality of the system by the means of ArcView 9.2 GIS
software.
A few examples of GIS in wood origin tracing and decision support systems in other
companies were reviewed. Information on territorial divisions in place was collected for
twelve countries selected for the study in order to investigate the wood origin region
definition issue. The selected countries were: Sweden, Finland, Estonia, Latvia,
Lithuania, Belarus, Poland, Ukraine, Czech Republic, Slovakia, Romania and Bulgaria.
In the next step, availability of forest resource data at the defined sub-country regional
level was assessed for the same set of countries. Finally a sample database was built
including IKEA’s forest tracing system data, acquired forest resource data for a sub-set of
countries and spatial data for displaying features of countries, regions and sub-regions on
the map. With the sample database and the GIS software programme, ArcView 9.2,
practical execution of a few principal tasks was tested.
Results revealed a pattern of multi-purpose territorial units in the countries covered by
the study and possible approaches to the wood origin region definition issue.
Furthermore, the results showed a limited availability of forest resource data on a sub-
country regional level in the investigated countries. However, it is important to point out
that the study presents just a “snap-shot” picture as of 2007. The final part allowed for
identifying basic relationships in the database which were necessary for the software to
execute principal data query and analysis tasks as well as allowing for obtaining a picture
of the visualization capabilities of the system.
A few recommendations were given concerning wood origin region definition and the
outlook of including forest resource data in the GIS system in IKEA’s wood sourcing.

Keywords: GIS, IKEA, wood sourcing, wood origin tracing, forest tracing system, forest
resources data, territorial unit, region.

                                                                                            4
1. INTRODUCTION
IKEA is a privately held, international home products retailer. IKEA sells a variety of low
price products including furniture, accessories, and bathroom and kitchen furnishings at
retail stores around the world. While IKEA’s core business is to sell home furnishings,
they also develop and purchase IKEA products in relationship with suppliers. The IKEA
Group has operations in 44 countries, 45 trading service offices in 31 countries, 1 300
suppliers in 54 countries, 26 distribution centres and 10 customer distribution centres in
16 countries. IKEA Group sales in 2006 were 17, 3 billion Euros. IKEA widely uses
wood in their products; it is the principal material in many of the home furnishing. Total
wood volume used in IKEA products in 2006 was 6, 4 mill m3 (IKEA, Social
Responsibility Report 2006).
IKEA’s suppliers of wood products are spread all around the world. IKEA’s top five
wood sourcing countries according to the Social Responsibility Report (2006) are:
• Russia
• Poland
• China
• Romania
• Sweden
The top five tree species used in IKEA products according to the Social Responsibility
Report (2006) are:
• Pine sp. - 42%
• Birch sp.- 18%
• Spruce/Fir sp. - 16%
• Beech sp. - 10%
• Oak sp. - 3 %
In the last decades, the forest sector has been facing many new challenges. Paradigmatic
changes have happened to the forest policy on a global scale. The rising general concern
about the unsustainable use of forest resources, illegal logging with spreading
deforestation, desertification and threats to biodiversity resulted in creation of different
forest certification systems. The most widely recognized certification system is the FSC
(Forest Stewardship Council) certification scheme; it is followed by PEFC (Programme
for the Endorsement of Forest Certification schemes), SFI (Sustainable Forest Initiative)
and others. Over the past 13 years (1994-2007), over 90 million hectares in more than 70
countries have been certified according to FSC standards (About FSC,
http://www.fsc.org/en/about). To enable the buyer to distinguish wood coming from
certified forest certification schemes, they have been extended into the wood supply
chain and CoC (Chain of Custody) certification standards have been introduced. Only a
portion of the forests have been certified so far and not all wood processing industries
benefit from chain of custody certificates.
As long as none of the credible third party certification schemes apply the risk of such
issues as illegal logging and threats to biodiversity, compliance with regional, national
and international legislation persists. Therefore, wood sources must be evaluated by the
wood purchasing company at the end of the supply chain.
5In this context, major forest companies and forest industries all over the world committed
themselves to ensure that the wood they use is coming from legal sources. In order to
fulfil that request, it is necessary to be aware of the source where the wood originates.
For wood importers, it is uncertain that the wood they are importing meets the necessary
requirements, without having a chain of custody systems. There are three main options
for timber importers to ensure that the imported wood has been sourced legally (Dennis
P. Dykstra et al., 2003):
1. To conduct their own audit of wood sources.
2. To purchase wood that has been certified as coming from sustainably managed forests
and for which the chain of custody to the point of importation can be verified.
3. To purchase wood that has been certified throughout the entire chain of custody.
IKEA’s long term goal is to source all wood in the IKEA range from forests that have
been certified according to a forest management standard recognized by IKEA. IKEA
uses the “staircase model” with their wood suppliers (Figure 1) in order to stepwise
increase the demands (IKEA’s position on forestry, 2006 and IKEA Social Responsibility
Report, 2006).
Figure 1. IKEA’s staircase model (IKEA’s position on forestry, 2006)
The staircase levels according to IKEA’s Social and Environmental Responsibility
Report 2006 are as follows:
Level 1: Start-up conditions. This level has basic requirements that wood product
suppliers must fulfil before starting up their business with IKEA. The origin of the wood
must be known. The supplier must be able to state from which region within a country
that the wood originates. The wood must not originate from intact natural forests (INF) or
high conservation value forests (HCVF) High value tropical tree species must be certified
according to the Forest Stewardship Council (FSC).
6Level 2: Minimum requirements. At Level 2 there are a number of minimum
requirements that suppliers must fulfil. The wood must be produced in accordance with
national and regional forest legislation and other applicable laws. The wood must not
originate from protected areas. The wood must not originate from plantations in the
tropical and subtropical regions established after November 1994 by replacing intact
natural forests.
Level 3: 4Wood to ease transition. 4Wood is a standard that was developed for
suppliers by IKEA in 2005 to ease the transition from Level 2 to Level 4. The 4Wood
standard emphasises the use of wood-tracking procedures and other routines to better
control wood from procurement through production.
Level 4: Forests certified as responsibly managed. The expectation at Level 4 is that
forest management and chain of custody standards must be produced in a balanced
cooperation between social, environmental and economic stakeholders and verified by an
independent third party. Currently, Forest Stewardship Council is the only Level 4
certification scheme recognised by IKEA.
IKEA’s short term goal for 2009 is to ensure that all suppliers meet the level 2 standards
in the staircase model and to have 30 % of wood certified according to the level 4
standards.
IKEA is also actively involved in forest projects in their prioritized wood sourcing
regions focusing on critical issues such as combating illegal logging, promoting forest
certification, and training and education on responsible forest management.
IKEA has twelve foresters working in different locations around the world to support and
encourage a more sustainable approach to the use of forest and wood resources. The
foresters work together with IKEA business teams to implement and follow up IKEA
supplier compliance with forestry minimum requirements (IKEA Social Responsibility
Report, 2006).
Collection of the information about wood origin, volumes and species by the means of
annual questionnaires forms the basis of IKEA’s Forest Tracing System (FTS). The
information from the FTS questionnaires is checked by IKEA’s foresters and purchasing
teams. After performing risk analysis, some supply chains are chosen for audit.
Suppliers’ and sub-suppliers’ wood supply is audited from factories to the forest. The
wood supply chain audit may be conducted by an IKEA forester or an independent
auditor. In 2006, 90 wood supply chain audits were conducted. This represents a volume
of 2.1 million cubic metres of round wood logs, which equals 33 percent of the total
wood used in IKEA products (IKEA Social Responsibility Report, 2006).
In 2007, IKEA started a project aimed at introducing GIS for supporting the company’s
wood sourcing. Prior to 2007, there had not been a special tool to handle spatial data in
IKEA’s wood sourcing routines. However, the records of wood origin and the data on
locations of performed field audits are geographic data.
7Geographic information system (GIS), also known as geographical information system or
geospatial information system is a system for capturing, storing, analyzing and managing
data and associated attributes which are spatially referenced to the Earth. In a more
generic sense, GIS is a tool that allows users to create interactive queries (user created
searches), analyze the spatial information, edit data, maps, and present the results of all
these operations (GIS, available at http://en.wikipedia.org/wiki/GIS).In the strictest sense,
it is an information system capable of integrating, storing, editing, analyzing, sharing, and
displaying geographically-referenced information.
GIS represents real world objects with digital data. There are two main types of data:
vector and raster data. Raster data consists of rows and columns where each cell
represents a certain value. Raster data is used to represent continuous fields, while vector
data represents discrete objects. There are three main types of vector data: points, lines
and polygons. Additional non-spatial data can also be stored. With vector data, the
additional data are attributes of the object. For example, a forest inventory polygon may
also have an identifier value and information about tree species.
Originally, up to the late 1990s, when GIS data was mostly based on large computers and
used to maintain internal records, software was a stand-alone product. However, with
increased access to the internet and networks, the demand for distributed geographic data
grew. GIS software gradually changed its entire outlook to the delivery of data over a
network (GIS, available at http://en.wikipedia.org/wiki/GIS).
According to Päivinnen and Köhl (2005) three basic elements of the GIS can be
distinguished: (i) data collection and input, (ii) data storage and management, (iii)
information retrieval. This structure is shown in Figure 2.
Data input Information
retrieval
(geographic
and
descriptive) Database system
Data collection and capture User interface system
procedure Communication means
Figure 2. GIS basic components (Päivinnen, R., Köhl, M., 2005)
According to Päivinnen and Köhl (2005) there are two main types of input data: (i)
geographic data: spatial geo-referenced elementary units which represent the whole
studied area when aggregated (in the present study these are maps with boundaries of
countries and regions); (ii) descriptive data: quantitative data which characterize spatial
8elementary units (in the present study this is the IKEA Forest tracing system data and
selected forest resource data). Data storage and management is ensured by special
software, which allows for the capturing, storing, analyzing and retrieving of the data.
Usually it is a relational database system; however, geographic data requires special
functions.
Users interact with the database by the means of an interface system. Päivinnen and Köhl
(2005) highlight the following functions of the interface systems: (i) user identification:
normal, privileged etc; (ii) user-friendly navigation tool for quick data access. The
information exchange between users and the database must be ensured by appropriate
communication means.
GIS application in relation to IKEA is supposed to connect wood sourcing data to digital
maps through declared wood origin regions. It has to be pointed out that what is being
introduced is an information management, analysis and decision support tool to support
the implementation of IKEA’s wood sourcing policy. However, it is not, at least at the
present stage of development, a tool for steering or optimizing wood flows on the
operative level. Since there are different groups of potential users located in different
places around the world the system must be web accessible with multi-level access
corresponding to the needs of respective user group. Thus, the internet would play a
crucial role in the implementation of the whole system.
This study addresses several issues which have surfaced in the course of the GIS project
with IKEA.
The first issue is related to the origin tracing of the wood used in IKEA products.
Handling data about wood origin is seen as one of the principal tasks for GIS. The term
“wood origin” can be understood very differently depending on the context and scale of
reference: single tree, forest stand, region, country and perhaps even a continent.
However, in wood supplies it is commonly understood as the harvesting site where the
wood was removed. The reason is that in most countries forest management activities
such as harvesting are documented including harvesting site location and therefore
possible to verify.
As GIS is supposed to operate on the top level where all the lines of the wood supply web
eventually meet, the data fed into the system will not be on such fine scale.
Documentation and control of every single supply chain up to the harvesting site is every
supplier’s responsibility; compliance with the latter being one of the principal
preconditions for a supplier to work with IKEA in line with the staircase model. A system
of supply chain audits carried out by IKEA helps to verify fulfilment of the requirements.
Thus, in the company’s forest tracing system IKEA refers to larger territorial entities as
wood origin regions. In most cases these are entities of countries administrative territorial
division. Suppliers must refer to these regions when submitting reports on the origin of
the wood used for the supplied product. It is, however, not obvious what the optimal scale
of such reference units should be and how to deal with the differences between countries.
This study is aimed to critically examine IKEA forest tracing territorial reference units
for selected countries with regard to aspects of average size, variation of size within and
9between countries, status and function of the concerned territorial division in given
country.
The second issue is concerned with the availability of forest resource data at the regional
level which, combined with forest tracing system data (see above) in the GIS, could be
used in the company’s wood procurement planning. The need of forest related
information for various interest groups was investigated by the EFI (European Forest
Institute) in the European Forest Information and Communication System study, 1997.
The study was conducted using a questionnaire. Respondents had to assess how
information about forest resources in other countries was important for their organization.
The study showed that information on wood resources was very important or important
for 83% of the respondents. Results by interest groups showed that the forest industry is
mainly interested in the volume of the annual cut, timber quality and the volume of the
annual increment. Information on the country level was found more important than on the
regional level. However, the interest in the information on the regional level increased
when larger countries with big variation in growth regions were concerned.
Better information on the region’s forest resources could help IKEA in evaluating
potential suppliers and the region’s potential to provide raw materials for certain wood
products. An assessment of suppliers’ capacities versus resources available in the region
helps to avoid undesired competitions for wood resources between their own suppliers.
As a result, this could cause a rise in prices. However, such information might be difficult
to obtain, especially in a foreign country, without knowing the organization of the forest
sector and the forest information system. Therefore, the availability and accessibility of
this data was investigated in the selected countries in relation to the regions of reference
for wood origin tracing.
The third issue deals with some of the practical tasks set for the system. The functionality
of the software can only be realized if the input data is consistent with its technical
features. The basic relations between the data, that are needed to enable the software to
execute the basic tasks, were investigated and tested.
In conclusion, it can be noted that the initiative to conduct this work came from the
company and speaks for the relevance of the study. However, it is also true that as a
result this study does not focus deeply on a certain scientific discipline but touches on
several disciplines with the development project in IKEA as the uniting factor. The
thematic focus of this study is at the intersection point of GIS, corporate policy and wood
procurement planning.
101.1. Aim of the study
The aim of the study is to investigate the aspects of data availability and system
functionality with regard to the introduction of GIS into IKEA’s wood sourcing system.
The tasks relating to the overall aim of the study are:
• Review examples of GIS in wood origin tracing in other companies.
• Examine the existing territorial division of twelve selected countries from the
wood origin tracing perspective. The selected countries are: Bulgaria, Romania,
Estonia, Latvia, Lithuania, Finland, Sweden, Czech Republic, Slovakia, Poland,
Ukraine and Belarus.
• Assess the availability of selected forest resource data on relevant regional levels
for the selected countries.
• Define principal structural features of a geodatabase suitable for including and
interlinking map data, IKEA’s wood sourcing data and selected forest resource
data so as to ensure relevant visualization and analysis functionality of the GIS
software Arc View 9.2. Build a sample database including named elements.
• Test relevant system functionality using ArcView 9.2 software and the sample
database.
.
112. MATERIALS AND METHODS
Information about comparable applications of GIS in other wood and forest sector
companies was researched primarily via the internet. The information was found on
companies’ home pages, various project reports and similar sources. The three most
comparable examples were selected for closer examination of the tasks and working
principles of the system.
The regional issue for wood origin tracing was approached using the patterns of existing
multi-purpose and level territorial divisions with delimited boundaries for the selected
countries. The average, minimum, and maximum values of a unit area (total and forested)
were found and summarized for each type of territorial division. The quantitative and
certain qualitative features of the examined territorial division patterns that could have
relevance for wood origin tracing were noted. The types of information sources that were
mainly used were: web-based encyclopaedias, releases of national institutions for
statistics, websites of national forest administrations of the respective countries.
Considering different aspects of wood origin tracing, several criteria were formulated for
evaluation of the possible wood origin reference regions. The identified territorial
division patterns were evaluated following the criteria.
In the second part of the study international and national forest related information
sources were examined in order to assess the availability of forest resource data for the
regional (sub-country) level. The international information sources were internet
accessible databases, e.g. the one maintained by FAO. National information sources were
studied in two ways. First, published information sources, such as forest statistical
yearbooks and annual reports on forests were identified and examined. These
publications give a reference to the actual source, i.e. the organization producing forest
resource data in given country. Secondly, the national organizations that maintain
national forest databases were contacted directly. Requests were sent to these national
organizations via e-mail and were supplemented by oral communication via the phone
when necessary.
Spatial data used as an input for the sample database in the third part of the study
comprised three polygon feature classes: countries, regions and districts according to the
IKEA forest tracing system. In addition, data from the IKEA forest tracing system’s last
survey on wood supplies and acquired forest resource data for a few selected countries
was used as attributes in the sample data base.
Data in the Countries’ feature class allows for the displaying of country boundaries. It
contains the attribute fields listed in Table 1.
12Table1: Attributes of the Countries’ feature class
Countries’ feature class
Object ID Automatically assigned
Shape Automatically assigned
ID Consists of two first letters of the country name
Name Name of the country
Usedbyikea Shows whether IKEA has any activities in a given country. The
field is confined to the domain yes/no.
Shape length Automatically assigned
Shape area Automatically assigned
Regions’ feature class is needed to display the boundaries of wood origin regions defined
by IKEA. Regions serve as wood origin reference in most of the countries. The attributes
of the Regions’ feature classes is listed in Table 2.
Table 2: Attributes of the Regions’ feature class
Regions’ feature class
Object ID Automatically assigned
Shape Automatically assigned
ID Consists of country code and three (usually first) letters of the
region name or country code and numeric value.
Name Name of the region
CountryID The same as ID field in the country feature class
Shape length Automatically assigned
Shape area Automatically assigned
Districts’ feature class covers only those countries where IKEA applies the division in
addition to the regions. The attributes of the Districts’ feature class are listed in Table 3.
Table 3: Attributes of the Districts’ feature classes
Districts’ feature classes
Object ID Automatically assigned
Shape Automatically assigned
ID Consists of combination of letters including country code and
numeric value
Name Name of the subregion
Shape length Automatically assigned
Shape area Automatically assigned
All spatial data was referenced to the WSG1984 coordinate system without a projected
coordinate system.
13The available forest resource data was compiled into a table and added as a non-spatial
data table to the geo-database. The fields of the forest resource database are listed in
Table 4.
Table 4: Fields of the Forest resource database table
Forest resource data
Object ID Automatically assigned
Country name Name of the country
Country ID The same as ID in the countries feature class
Region name Name of the region
Region ID The same as ID in the regions feature class
Gr st pine 01 20 Growing stock of pine by age classes in m3
Gr st pine 21 40
Gr st pine 41 60
Gr st pine 61 80
Gr st pine 81 100
Gr st pine 101
Growing stock pine Total growing stock of pine in m3
Gr st spruce 01 20 Growing stock of spruce by age classes in m3
Gr st spruce 21 40
Gr st spruce 41 60
Gr st spruce 61 80
Gr st spruce 81 100
Gr st spruce 101
Growing stock spruce Total growing stock of spruce in m3
Gr st conifers 01 20 Growing stock of all coniferous species by age classes in m3
Gr st conifers 21 40
Gr st conifers 41 60
Gr st conifers 61 80
Gr st conifers 81 100
Gr st conifers 101
Growing stock conifers Total growing stock of all coniferous species in m3
Gr st birch 01 20 Growing stock of birch by age classes in m3
Gr st birch 21 40
Gr st birch 41 60
Gr st birch 61 80
Gr st birch 81 100
Growing stock birch Total growing stock of birch in m3
Gr st beech 01 20 Growing stock of beech by age classes in m3
Gr st beech 21 40
Gr st beech 41 60
Gr st beech 61 80
Gr st beech 81 100
Gr st beech 101
Growing stock beech Total growing stock of beech in m3
Gr st oak 01 20 Growing stock of oak by age classes in m3
Gr st oak 21 40
Gr st oak 41 60
Gr st oak 61 80
Gr st oak 81 100
Gr st oak 101
Growing stock oak Total growing stock of oak in m3
14Table 4cont.: Fields of the Forest resource database table
Gr st broadl 01 20 Growing stock of all broadleaved species by age classes in m3
Gr st broadl 21 40
Gr st broadl 41 60
Gr st broadl 61 80
Gr st broadl 81 100
Gr st broadl 101
Growing stock broadleaves Total growing stock of all broadleaved species in m3
Growing stock all species Total growing stock of all species in m3
Annual cut of pine in m3 (data of the last year or up to two
Actual cut pine years back)
Actual cut spruce Annual cut of spruce in m3
Actual cut conifers Annual cut of all coniferous tree species in m3
Actual cut birch Annual cut of birch in m3
Actual cut beech Annual cut of beech in m3
Actual cut oak Annual cut of oak in m3
Annual cut of all other broadleaved tree species apart from
Actual cut other broadl birch, beech and oak in m3
Actual cut broadleaves Annual cut of all broadleaved tree species in m3
Actual cut all species Annual cut of all tree species in m3
The data from IKEA’s Forest tracing system were also added as non-spatial data table.
The fields of the wood supply database are listed in Table 5.
Table 5: Fields of the wood supply database table
Wood supply data
OBJECTID Automatically assigned
TA IKEA’s Trading Area
SupplierNumber Unique numeric value assigned to every supplier by IKEA
SupplierName Name of the supplier company
SubSupplierName Name of the subsupplier company
SubSupplierType Numeric code representing the type of subsupplier
MaterialType Numeric code representing the type of material
SpeciesName Numeric code representing the tree species
Species Latin name, mandatory only when other then ordinary
SpeciesLatinName species used
WoodCountry ID code of the wood origin country
WoodRegion ID code of the wood origin region
WoodSubregion ID code of the wood origin subregion
Volumen Volume of the supplied wood products in m3
RWEConvFact Conversion factor to the roundwood equivalent
IKEAVolumnRWE Wood volume in roundwood equivalent in m3
Represents if IKEA’s requirements on wood supply has been
IKEADemand met. Confined to yes/no values
FSCVolumen Share of the FSC certified wood in supplied volume
FSCCertificate Number of the FSC certificate
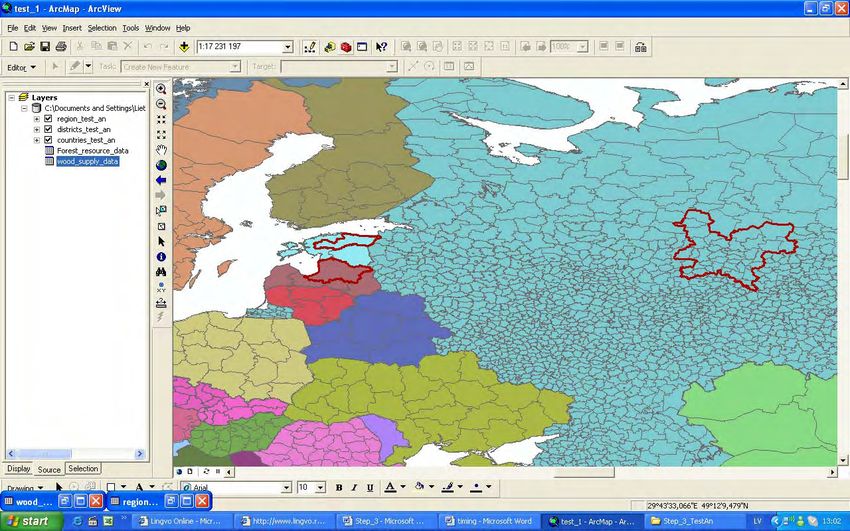
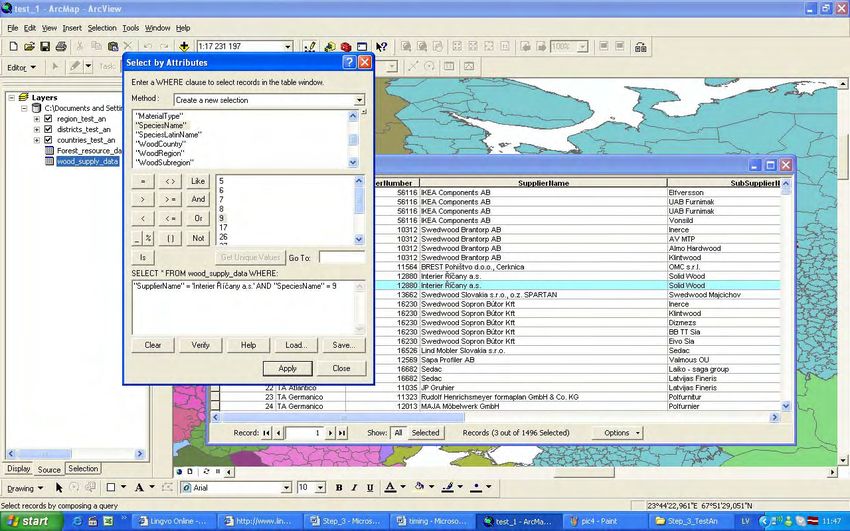
The GIS software package, ArcView 9.2, was used for building the sample database and
working with the data. The data in the sample database was interconnected so as to
enable the desired data query and analysis functions.
153. RESULTS
3.1. Examples of GIS applications in wood origin tracing
Most legitimate timber companies implement some type of log-tracking system. Initially,
motivation for the development of log-tracking systems was to prevent theft of logs or
other wood products. More recently, companies have begun to realize that significant
benefits can be achieved through careful management of logistical operations such as log
transport. Sophisticated logistic systems enable supply managers to know where the
certain batch of timber is at any given moment in time, i.e. when it is expected to arrive at
the mill. Real-time information produces time and cost savings, reduces environmental
impacts and helps supply the right quality raw materials to each mill. Another important
reason for companies to implement wood origin tracing is that such arrangements are
essential if the company wishes to obtain chain of custody certification (Dykstra et al,
2003). The sourcing policy of companies like IKEA motivates timber companies to seek
chain of custody certification and implement wood tracking practices. Next a few
examples of GIS supported wood tracing systems in some major forest companies that
use large quantities of imported wood are discussed.
“Tracing Russian Wood Imports” (2001) is a project report issued by the UPM Kymmene
and partner organizations. It describes the system used by UPM Kymmene for tracing
wood imports. In 1996, UPM Kymmene became the first forestry company to start
developing an information system for tracing the origin of wood. One of the main
objectives was to create a system that could be utilized to communicate information
about the group’s timber procurement from Russia, and Russian forestry in general, to
their staff, customers and other interested parties.
The system is built on three keystones: a statement of origin, a database and GIS mapping
program and audits in the country of origin.
The statement of origin includes specification of the location of the harvesting site. In this
case it implies indication of “subjects of Federation” and “leskhoz”. “Subjects of
Federation” are the self-governing regions constituting Russian Federation. “Leskhoz”
was used as a basic forest management unit in Russia before the adoption of the new
forest code.
The database contains information on suppliers and delivery contracts, information from
statements of origin and information on audits. The UPM Kymmene’s Tuonti GIS
program provides detailed information about imported wood deliveries to be recorded,
queried and displayed instantly on the screen. It can produce a variety of maps, charts or
reports for management purposes. High quality maps can be produced at the user's desk
or centrally on large digital plotters. The GIS is based on two maps: the base map which
provides general information such as land, water, topography, built up areas, etc., and the
function map which displays all regional boundaries, railway stations and audit locations.
Another major Finnish forest company, Metsalliito, requires all suppliers to indicate the
wood origin. Collected information is entered into a general GIS-linked database. As a
result, the data on the timber origin is linked to a digital map. Digital maps visualize
16locations of harvesting sites. In addition digital maps display areas of nature protection.
For wood tracking in Finland, Metsaliitto uses the contract number. Each timber purchase
contract between Metsaliitto and the forest owner has a unique number, so the origin of
each batch of timber entering the mill can be identified according to this number
(Samarina, 2006; http//www.metsaliitto.com). There is no information in regards to
which regional or management units Metsaliitto uses as a reference for indicating wood
origin for timber imported from other countries.
Stora Enso’s wood traceability system is based on similar principles as the two described
above. Stora Enso requires suppliers to provide the following information: geographical
and ownership data on harvesting area (e.g. land register numbers, forest management
unit details, and GPS coordinates). The data on wood origin is stored in a general
database, which comprises GIS maps, information on licenses and certificates,
environmental data and logging output. (http//www.storaenso.com).
In 2003, Stora Enso adopted a GIS based European-wide forest resource information
system. It serves as a support for strategic planning and wood procurement. The system
can provide the company’s wood supply managers with information on forest resources
in Europe in an illustrative way, for example as thematic maps. With the map-based user
interface, the user can view and produce reports, e.g. about production plants and wood
flows. A variety of analysis functions produces new information, which supports strategic
planning (GISnet supplies European-wide forest resource information system for Stora
Enso, available at
http://www.directionsmag.com/press.releases/index.php?duty=Show&id=7836&trv=1).
However, there is no available information about which kind of forest resource data is
included in this database and whether it contains data only at the country level or also at
the regional units’ level.
173.2. Wood origin regions in the IKEA forest tracing system
The “wood origin region” is defined in this study as a unit of a countries’ territorial
division that can be referenced by IKEA suppliers in their wood origin declarations. The
territory might have an administrative status, or be a forest management unit.
When defining such wood origin regions, certain aspects of the regions need to be
considered. First, these territories need to have clearly defined and identifiable
boundaries so that there is no uncertainty in regards to each wood origin region.
Secondly, the features of the chosen territorial division should facilitate implementation
of IKEA’s forestry related policy. Thirdly, information on the territory’s forest resources
should be distinguishable in accordance with the territory’s boundaries.
The scale of territorial division or the size of territories or regions delimited by the given
division also needs to be considered. In each country there are a few options to be
considered: one or two levels of administrative division, a specific territorial division
applied by a state forest administration or management organization. It is possible to
define wood origin regions comprising of more than one real region. However, the choice
might not be as obvious as it may seem. Small territories could significantly complicate
wood origin reporting routines for suppliers and could adversely affect their willingness
to collaborate without giving substantial improvements to the credibility of reporting.
Furthermore, from the policy implementation point of view it would hinder the
application of a reasonable risk assessment or risk-ranking to the wood origin regions.
However, a finer scale of wood origin regions would give more flexibility in responding
to issues like social conflicts and nature protection issues.
With regard to data management, the data would become more fragmented if the units
were smaller. However, large territories would reduce the relevance of wood origin
reporting and reduce its credibility. In some countries, usually with the domination of
state owned forests, most of the forest data records are based on a specific territorial
division according to the structure of the forest management organization and ignoring
the countries general administrative territorial division. Therefore, suppliers might have
difficulties separating wood flows with the latter division structure. It is more reasonable
to base the wood origin regions on these specific territories connected to the forest
management organization. In addition, it would be preferable to have the wood origin
regions of comparable size in different countries for consistency purposes.
These considerations are difficult to translate in certain quantitative terms such as what
the smallest or the largest acceptable area of a region or the acceptable difference
between regions in terms of area.
183.2.1 Review of countries’ territorial division
The selected types of territorial divisions for the twelve countries are shown in Table 6.
The summary includes the average minimum and maximum values of the total forested
area by country and by the type of territorial division. Cells with question marks means
there was no data available.
The table reveals a large variation in the size of territories, both within one country’s
territorial division and between the units of the territorial division of different countries.
The greatest variation in size of the administrative territorial units at the same level
among the selected countries is seen in Sweden and Finland. The main reason for the
various sizes of the administrative territorial units at the same level within one country is
the distribution of country’s human population. Administrative territories in densely
populated areas are more compact than in the scarcely populated parts of the land. The
average size of the administrative territories is correlated with the total size of the
country. Thus, for example, the average size of an administrative district (rajons) in
Latvia is 2,46 t. km2, as opposed to 19,54 t.km2, which is the average size of, vojvodship,
an administrative district in Poland.
19Table 6: Selected types of territorial division for the selected countries with the average, minimum and maximum values of the forest
land and total areas
Total area, t.km2 Forest land area, t.km2
Country Unit of territorial division Number max min average max min average
Bulgaria Region (NUTS 2 – EU statistics) 6 27,52 10,29 18,50 ? ? 5,37
Province (oblast) 28 7,62 2,05 4,08 ? ? 1,18
Regional Department of Forests 16 ? ? 6,93 3,95 1,46 2,11
Romania Development region (NUTS 2 – EU statistics) 8 36,85 29,21 33,80 12,82 5,73 9,65
County (judete)/ Regional Forest Directorate 41 8,70 3,53 5,89 4,54 0,22 1,69
Estonia County 15 4,81 1,02 2,90 ? ? 1,47
Region (NUTS 3 – EU statistics) 5 15,80 3,36 8,74 ? ? 4,42
Latvia Administrative District 26 3,59 1,61 2,46 1,74 0,48 1,13
Regional Forest District 12 8,28 2,60 5,33 4,28 1,36 2,46
Region (NUTS 3 – EU Statistics) 4 19,70 13,49 15,98 10,15 5,16 7,37
Lithuania County 10 9,76 4,35 6,53 4,08 1,73 2,21
State Forest Enterprise 42 ? ? 1,55 0,86 0,18 0,50
Finland Province (län) 6 98,95 34,38 62,65 50,06 17,28 40,55
Region (landskap) 20 98,95 2,82 16,85 50,06 1,59 10,67
Sweden Region (land) 4 153,31 79,91 102,56 68,18 49,99 57,22
County (län) 21 98,61 2,96 20,36 36,16 1,82 11,38
"Riksområden" (NUTS 2 – EU statistics) 8 153,30 14,00 57,73 68,19 5,35 32,34
Czech Republic Region (kraj) 13 11,02 3,16 6,03 3,76 1,33 2,03
Region (NUTS 2 – EU statistics) 8 18,08 6,48 12,12 6,75 2,06 4,02
Slovakia Region (kraj) 8 9,46 2,05 6,13 4,62 0,65 2,51
Regions (zoskupenia krajov) (NUTS2– EU stat.) 4 16,24 2,05 12,26 8,39 0,75 5,01
Regional Forest Enterprise (Odštepné závody) 32 ? ? 1,53 ? ? 0,63
Poland Voivodeship 16 35,60 9,41 19,54 7,97 2,48 5,62
Regional Forest Directorate 17 ? ? 18,39 6,40 1,71 4,47
Belarus Province (oblast)/ Regional Forest Enterprise 6 40,40 25,00 34,57 ? ? 15,58
Forest Enterprise 96 ? ? 2,16 ? ? 0,97
Ukraine Province (oblast)/ Regional Forest Directorate 24 33,31 8,10 23,99 ? ? 3,76
20Bulgaria
Area – 112, 9 t. km2
Forest cover - 29%
The basic administrative unit of Bulgaria is a province (oblast in Bulgarian). The
country is divided into 28 provinces and each province includes several
municipalities. Municipalities are not considered in this study. The average area of a
Bulgarian province is 4, 08 t.km2, when not including the province of the capital city,
Sofia. The average forest area per province is 1, 18 t.km2. The Bulgarian National
Forest Agency, which assures management functions in state forests and control
functions in private forests, is composed of 16 Regional Forest Directorates (or
Departments of Forest) covering the whole territory of the country. The boundaries of
the Regional Forest Directorates do not coincide with the boundaries of the provinces.
The average land area covered by a Regional Forest Directorate is 6, 93 t.km2 and the
average forest area is 2, 11 t.km2. The last type of territorial unit included in the list is
the NUTS 2 region1. These units have no administrative status in Bulgaria but exist
for statistical purposes. There are six regions and each comprises of several provinces.
The average land area of these regions is 18, 50 t. km2 and the average forest area is 5,
37 t. km2
Romania
Area – 238, 4 t.km2
Forest cover - 27%
The basic administrative unit of Romania is a county. The country is divided in 42
counties. The average area of a Romanian county is 5,89 t.km2 with an average forest
area of 1,69 t.km2 (capital city Bucharest and Ilfov counties were taken into account).
The National Forest Administration of Romania includes 41 Regional Forest
Directorates. The boundaries of the Regional Forest Directorates match the
boundaries of counties. However, the National Forest Administration ROMSILVA
assures only the management of state forests while there is a significant share of
privately owned forests.
Besides, there exists a division into 8 development regions. These regions have no
administrative status but serve mainly for statistics, planning, special economical
regimes and distribution of the EU funds. Average land area of these regions is 33,80
t. km2, average forest area is 9,65 t. km2 (capital city Bucharest-Ilfov region was not
taken into account) .
1
In the EU exists so called NUTS region classification (Nomenclature of Units of Territory for
Statistics) with NUTS 1 to NUTS 3 levels. Usually these NUTS levels are attributed to the existing
units of administrative division but if there is no corresponding level administrative unit NUTS regions
are defined specifically.
21Estonia
Area – 45, 2 t. km2
Forest cover - 50, 5%
Estonia is divided into 15 counties. The average area of a county is 2, 90 t.km2 and the
average forest land area per county is 1, 47 t.km2. State forests are managed by the
State Forest Management Centre and are divided into five Forest Management
Regions. Their boundaries, however, do not match with the boundaries of the
administrative territories. Control over all forests is ensured by the Regional Boards
of Environment. For the EU statistics, the country is divided in five other regions,
each covering several counties. The average land area of these regions is 8, 74 t.km2
and the average forest area is 4, 42 t.km2.
Latvia
Area – 64, 6 t. km2
Forest cover – 45 %
Latvia is divided into 26 administrative districts. The average area of an
administrative district is 2, 46 t. km2 and the average forest land area per district is 1,
13 t. km2. In addition, Latvian constitution recognizes four distinct regions of
historical and cultural character. However, this division has no administrative status
and is mainly used in regional development planning and statistics. With the Riga
District detached, these territories are designated also as NUTS 3 statistics regions for
Latvia. The State Forest Service that ensures control and advisory functions over all
forests, is divided into 11 regional forest districts (as of May 2008). Each regional
forest district covers territories of one or several administrative districts. However,
this organization has been subject to frequent reorganizations and the number of
districts might be changed again. The state enterprise, Latvian state forests, is
responsible for the management of state owned forests has 8 regional offices, but
other forests are not connected to this organization.
Lithuania
Area – 65, 2 t. km2
Forest cover - 32, 5%
Lithuania is divided into ten counties. The average area of a county is 6, 53 t. km2 and
the average forest area is 2, 21 t. km2. Lithuanian counties also serve as European
NUTS 3 level statistical regions. State forest enterprises are managing the state-owned
forests and ensuring control, advisory and policy implementation functions in private
forests. Currently, there are 42 state forest enterprises. In the future, forest
administration in Lithuania is likely to undergo reorganization, merging state forest
enterprises. The average land area covered by a state forest enterprise is 1, 55 t.km2
with an average forest area of 0, 50 t.km2.
22Finland
Area – 338,1 t. km2
Forest cover – 86%
Finland is divided into six provinces. The average size of a province is 62, 65 t km2
with an average forest land area of 40, 55 t.km2. Lower level territorial units are
regions referred to as maakunta in Finnish or landskap in Swedish. There are 20 such
regions and the average area of a region (Åland not included) is 16, 85 t. km2 with an
average forest area of 10, 67 t.km2. There is a huge difference in the size of the
Northern provinces and regions compared to the Southern provinces and regions. In
addition, there are 77 sub-regions referred as seutukunta in Finnish or ekonomisk
region in Swedish. There are also five NUTS 2 regions for the EU statistics but they
are not further considered since they are same scale as the provinces. Finnish forest
statistics are presented by 13 regional forestry centres which are supervised by the
Ministry of Agriculture and Forestry and whose task is promoting forestry and
enforcing forest legislation locally. Territories of the regional forestry centres do not
match with the units of countries administrative division.
Sweden
Area – 449, 9 t. km²
Forest cover - 60 %
The basic administrative unit of Sweden is a county. The country is divided into 21
counties. The average area of a county is 20, 36 t.km2 with an average forest area of
11, 38 t. km2. In addition, there is a traditional division in four (sometimes three)
regions or lands referred to, in Swedish, as Norra Norrland, Södra Norrland, Sveland
and Götaland. These regions have no administrative function but are used in reference
to statistics, and weather reports. Also, eight NUTS 2 level regions are defined for the
EU statistics. They are referred to as National Areas or Riksområden in Swedish.
Czech Republic
Area – 78, 8 t. km²
Forest cover – 33, 6%
Since 2000, the Czech Republic has been divided into 13 regions, referred to as kraj
in the Czech language, and the capital city of Prague. The average land area of a
region is 6, 03 t. km2 with an average forest area about 2 t. km2. The older division of
73 districts is also still recognized and they serve as seats for some branches of the
state administration. The old district division are not considered for this study. For the
EU statistics, there are eight defined NUTS 2 level regions, each of comprising of one
or several regions. The average area of these regions is 12, 12 t.km2 with an average
forest area of 4, 02 t.km2. The management of state owned forests is carried out by the
state enterprise, Forests of the Czech Republic, and includes 13 regional forest
directorates (Krajský inspektorát) matching up in boundaries with the administrative
regions.
23Slovakia
Area – 49,037 t. km2
Forest cover – 40%
Slovakia or Slovak Republic is divided into eight regions referred to as kraj in Slovak.
The average area of a region is 6, 13 t. km2 with an average forest area of 2, 51 t. km2.
Like in other EU countries, the NUTS 2 level regions are adopted for statistics,
making up four larger regions under the same names as the four regions that existed
before the political changes of the beginning of 1990’s but with different boundaries.
State forest administration includes 32 Regional Enterprises, subjected to the General
Directorate. The average territory corresponding to a regional forest enterprise is 1, 53
t. km2 with an average forest area of 0, 63 t.km2.
Poland
Area – 312, 68 km² t. km2
Forest cover – 30%
Poland is divided into 16 regions or voivodship, in Polish. The average area of a
region is about 19, 54 t. km2 with an average forest area of 5, 62 t. km2.
For EU statistics, there is a division into larger regions but these regions are not
considered for this study. The state forest administration plays a dominant role in
Poland. The territory of the country is covered by 17 regional forest directorates with
boundaries not matching voivodships. Most forestry records and statistics are based on
forest directorates. The average area of a regional forest directorate is 18, 39 t.km2
with an average forest area of 4, 47 t.km2.
Ukraine
Area – 603, 70 t. km²
Forest cover – 16 %
Ukraine is divided into 24 provinces referred to as oblasts in Ukrainian and one
Autonomous Republic, Crimea. The average area of a province is about 24 t. km2
with an average forest area of 3, 76 t. km2. However, Ukraine represents a special
case in the sense of a very uneven distribution of forest cover over the country’s
territory. In fact only few provinces possess significant forest resources. All forests in
Ukraine are state owned but are managed by different institutions. About 70% of
forests are managed by the Ukrainian State Committee of Forestry (USCF) that is a
part of the Ukrainian Ministry of Ecology and Natural Resources. Since 2004,
regional forest directorates, one for each province, serve as the Committee’s regional
bodies. The 306 State Forest Enterprises carry out forest management activities under
coordination with the Regional Forest Enterprises. Forest administration institutions
in Ukraine are subject to frequent restructuring in the context of an unstable political
situation.
24Belarus
Area – 207, 60 t. km²
Forest cover – 45 %
Belarus is divided into six provinces referred in Byelorussian as voblast. The average
area of a province is 34, 57 t. km2 with an average forest area of 15, 58 t. km2.
Provinces are divided into 118 administrative districts. All forests in Belarus are state
owned. More than 85 % of the forests are managed by the Ministry of Forestry. The
structure of the Ministry includes six regional forest enterprises, one for each
province, and 96 forest enterprises. The boundaries of the forest enterprises do not
match administrative districts. The average territory corresponding to a forest
enterprise is 2, 16 t.km2 with an average forest area of 0, 97 t.km2.
25You can also read