Reporting Period: Jan 1 - Jun 30, 2020 - Anaheim.net
←
→
Page content transcription
If your browser does not render page correctly, please read the page content below
Reporting Period: Jan 1 – Jun 30, 2020
Mission, Key Objectives, and Goals
             Anaheim Public Utilities’ (APU) mission is to add value to the community through a
             customer-focused approach by providing reliable, high-quality water and power at
            competitive rates. To fulfill this mission, APU strives to meet six key objectives: sustain
            a high level of customer satisfaction, deliver daily operations excellence, preserve
competitiveness and financial health, effectively manage enterprise risk, invest in a positive and
productive work environment, and maintain alignment with the City of Anaheim’s (City) goals.

To assess its performance in meeting these six high level objectives, APU established meaningful
performance goals that are tracked and reported. APU staff carefully evaluates each performance
metric to determine how the utility is performing and whether certain processes or practices require
closer monitoring or adjustment. To foster a culture of continuous improvement, APU will modify or
replace goals as needed to ensure that the Utilities Success Indicators report is current, relevant, and
moves APU forward into the future.

This report is an update on APU’s progress in meeting its key performance goals and covers the
reporting period January 1, 2020 – June 30, 2020.

Notable Events in the Reporting Period
COVID-19 Response

In March, the City of Anaheim announced the public closure of City Hall to help protect the health
                                of the community. During this time, APU’s remained fully
                                operational and maintained communication with the public
                                through its call center, social media, online chat, and email. To
                                assist customers currently experiencing financial strain from
                                COVID-19, APU is temporarily suspending utility service shut-
                                offs and offering flexible payment plans and emergency bill
                                assistance. Following the phased reopening of City Hall announced
                                in June, APU began scheduling appointments for the public for
                                customer service, programs and rebates, electric engineering, and
                                water engineering inquiries. For additional details on how APU is
                                helping the community and customers during this challenging time,
                                see COVID-19 Customer Assistance.

Bond Refunding

In January, APU capitalized on low interest rates and refunded existing bonds, saving customers more
than $67 million in future interest payments and shortening the term of the electric bond by seven
years and the water bond by five years. Shortening the length of debt maximizes savings, provides
APU with future flexibility, and helps pay down existing debt faster than originally anticipated – all
without increasing annual debt service payments.

ANAHEIM PUBLIC UTILITIES                         Page 1                    Utilities Success Indicators: 1H 2020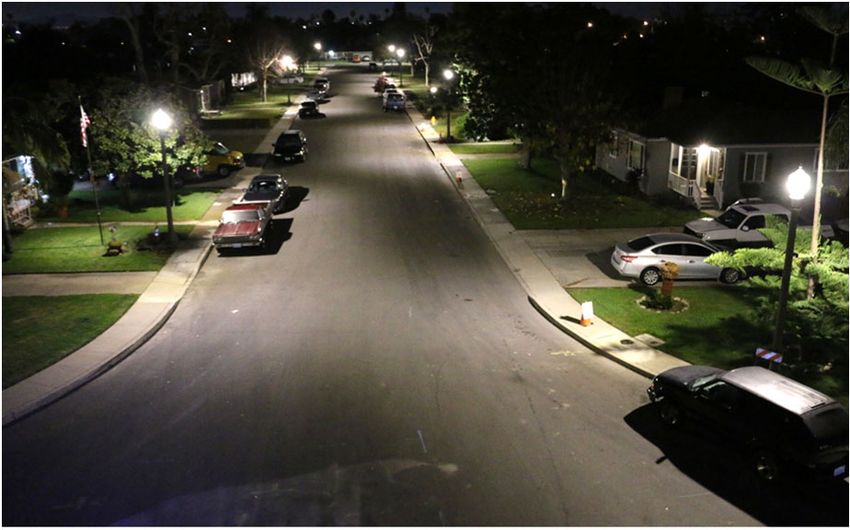
Wildfire Mitigation
During the reporting period, PUB and City Council approved APU’s 2020
Wildfire Mitigation Plan that establishes methods and procedures for
constructing, maintaining, and operating APU electrical lines and
equipment to minimize wildfire risk. The plan was developed in
consultation with Anaheim Fire & Rescue and includes preventative
strategies and actions to be taken during elevated weather conditions.
Approximately 98% of city-owned power lines in the fire threat zones are
currently underground, and efforts are already underway to underground
Eucalyptus Drive, south of Santa Ana Canyon Road, because of its
proximity to an elevated high fire threat zone.
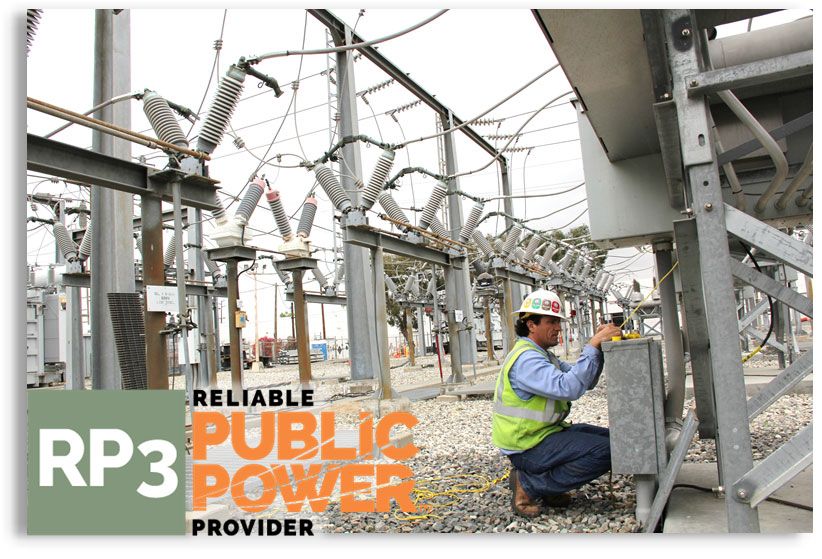
APPA Reliable Public Power Provider Award
In May, the American Public Power Association
recognized APU as a Platinum Level Reliable Public
Power Provider (RP3). This three-year designation
honors utilities that demonstrate high proficiency in
reliability, safety, workforce development, and system
improvement. Of the 2,000 public power utilities nation-
wide, only 274 currently hold the RP3 designation.
Arbor Day Recognition
The Arbor Day Foundation recently recognized APU as a Tree Line USA recipient, awarded to
agencies who deliver clean and reliable energy while building a
greener community. Through APU’s Tree Power program, residents
and businesses can receive up to six shade trees at no cost. Well-
situated and mature shade trees can reduce air conditioning use by
10% to 40%. Since the start of this program in 1992, APU has planted
approximately 56,000 shade trees throughout Anaheim to help
56,000 Shade Trees customers conserve energy and save money on their utility bills.
Sustainable Landscape Workshops
APU partnered with the Metropolitan Water District of Southern
California to host a sustainable landscape workshop series prior to the
onset of the coronavirus pandemic. Approximately 50 Anaheim residents
attended the first workshop, which offered information on the benefits
of alternative water-retaining landscapes, and showcased methods to
reduce water, energy, and green-house gases. Workshop attendees
learned about conservation rebates, received gardening guides and seed
packets, and had the opportunity to win gardening supplies through a
raffle. For safety reasons, the remaining workshops scheduled for this
year will be held virtually. To register for this workshop series, visit www.anaheim.net/1062/Turf-
Replacement-Program.
ANAHEIM PUBLIC UTILITIES Page 2 Utilities Success Indicators: 1H 2020
Water Awareness Month
During Water Awareness Month each May, APU typically promotes its water programs and rebates
at a community event. Because of the pandemic, APU retooled this
annual event as a virtual series called Water Wise Wednesdays, with
weekly social media posts covering a variety of water conservation topics
such as outdoor water use, leaky toilets, water tolerant landscaping, and
smart irrigation controllers. To drive community participation, APU also
held weekly raffles for an opportunity to win irrigation controllers and
succulent arrangements. For each entry, participants shared the changes
they made to become more “water wise” in their homes.
Key Capital Project Milestones
Below are key capital milestones that were completed during the reporting period.
Electric
APU continued to replace older street lights with 1,760 efficient LED street lights in various
neighborhoods, including Lakeview Ave. and La Palma Ave., Pioneer Park Neighborhood,
James Madison Neighborhood, Thomas Jefferson School Neighborhood, Maxwell Park
Neighborhood, and Olive St. from North St. to Lincoln Ave. New street lights were installed
in the Albert St. and Ohio St. in downtown Anaheim, significantly improving visibility in the
neighborhood.
Alberta St. & Ohio St. Before After
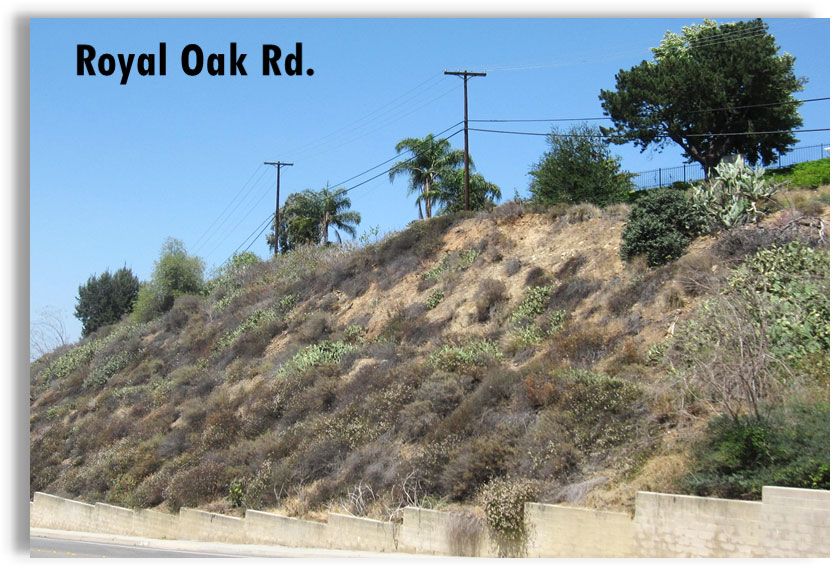
In May, construction began on the first phase of
Royal Oak Rd.
undergrounding Royal Oak Road, where the
steep terrain makes it challenging for crews to
access utility poles on these slopes. This project
will underground approximately 1.2 circuit miles
of overhead lines on Royal Oak Rd. from Santa
Ana Canyon Rd. to Nohl Ranch Rd., Crescent
Dr., and Cerro Vista Dr. – improving electric
service reliability for residents and businesses.
ANAHEIM PUBLIC UTILITIES Page 3 Utilities Success Indicators: 1H 2020
Water
For fiscal year 2019/20, APU installed a total of 2,285 feet of water mains on Fern Haven Ln.,
Hadrians Crescent, Pepper Creek Way, and along State College Blvd. The State College Blvd.
water main project is being performed in coordination with a large sewer replacement project
by the Orange County Sanitation District and is still under construction with completion
anticipated by late 2020. This project will replace
approximately 3,600 feet of water mains to improve
system reliability and avoid having to impact paved
streets with construction following the sewer project.
The Linda Vista Complex Phase II improvements are
currently underway with underground utility
infrastructure and the pump station building
foundation completed. Other project components
that are in progress include replacing all existing Linda Vista Phase II Improvements
pumps and upgrading electrical equipment. Project
completion is planned for spring 2021.
ANAHEIM PUBLIC UTILITIES Page 4 Utilities Success Indicators: 1H 2020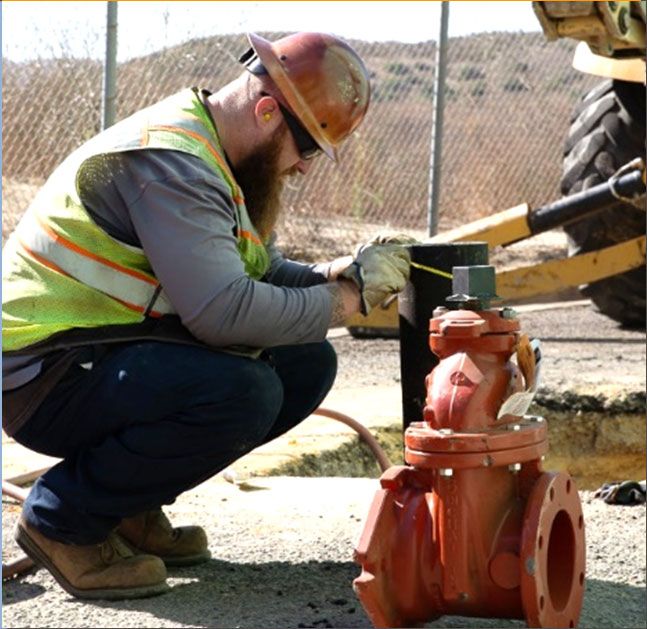
Summary of Results for Reporting Period
This section provides a brief summary of APU’s performance in meeting or exceeding its goals during the reporting
period. Following this section is the Appendix, which provides definitions, descriptions, and a more comprehensive
analysis of APU’s performance during the reporting period.

 A. Sustain a High Level of Customer Satisfaction
                   Employee Effectiveness
                   Goal: Meet at least 85% of Anaheim Anytime survey respondents’ evaluation of
                   employee effectiveness (with a rating of “good” or “superior”) in the categories of
                   employee courtesy, time to respond, and employee effectiveness
                   Result: All three measures were above the 85% target                                               GOAL MET

                   Customer Satisfaction
                   Goal: Meet or exceed at least 90% of Anaheim Anytime Survey respondents’
                   expectations
                   Result: Over 90% of survey respondents’ expectations were met or exceeded
                                                                                                                      GOAL MET

                   Timely Customer Service
                   Goal: Respond to customer calls in the Utility Call Center in 3 minutes or less
                   Result: Customer calls were answered within 1.7 minutes on average
                                                                                                                      GOAL MET

                   Timely Street Light Repairs
                   Goal: Ensure street light repairs are made within 4 business days on average
                   Result: Street light repairs were completed within 2.1 business days on average
                                                                                                                      GOAL MET

       ANAHEIM PUBLIC UTILITIES                           Page 5                      Utilities Success Indicators: 1H 2020
B. Deliver Daily Operational Excellence
              Electric Reliability
              Goal: Maintain electric system reliability indicators in the top 25% of the municipal utility
              category nationally
              Result: APU was in the top 25% of public power agencies nationwide for outage duration,
              frequency of outages, and restoration time                                                              GOAL MET

              Renewable Portfolio
              Goal: Procure adequate renewable resources to comply with state mandates on
              renewable portfolio standard, meet interim targets, and remain well-positioned for future
              compliance periods
              Result: APU is in compliance with all applicable state mandates and is on-track to meet
              the RPS target of 33% by 2020 and the accelerated RPS target of 60% by 2030                             GOAL MET

              Generator Availability
              Goal: Maintain electric generation availability rate at 95% or better
              Result: Canyon Power Plant recorded a 99.2% average availability rate
                                                                                                                      GOAL MET

              High Quality Drinking Water
              Goal: Meet or exceed all state and federal drinking water quality standards.
              Result: Drinking water quality met or exceeded all state and federal standards
                                                                                                                      GOAL MET

              Water System Reliability
              Goal: Minimize main breaks per 100 miles of pipe to under 8 annually, which is
              approximately 40% below the national average
              Result: APU recorded 4.9 main breaks per 100 miles of pipe
                                                                                                                      GOAL MET

              Water System Maintenance
              Goal: Meet the three-year maintenance goal of exercising all 23,000 system valves (or
              639 per month) and inspecting all 7,800 hydrants (or 217 per month)
              Result: APU met its goal of inspecting all hydrants and exercising all system valves for
              the most recent three-year maintenance cycle ending June 30, 2020                                       GOAL MET

   ANAHEIM PUBLIC UTILITIES                             Page 6                        Utilities Success Indicators: 1H 2020
C. Preserve Competitiveness & Financial Health

              Competitive Electric Rates
              Goal: Maintain annualized Electric rates below rates paid by other Orange County cities
              Result: Annualized electric rates are at least 27% below rates paid by other Orange
              County cities                                                                                      GOAL MET

              Competitive Water Rates
              Goal: Maintain annualized Water rates under the average of local agencies in the county
  $
              Result: Annualized water rates are approximately 23% below the average of local
              agencies in the county
                                                                                                                 GOAL MET

              High Bond Ratings
              Goal: Remain in the A rated or higher categories for bonds
              Result: All bonds are currently rated A or above; this goal remains at Watch as APU
              develops strategies and tools for the Water Utility to regain its AAA rating from S&P
                                                                                                                   WATCH

              Sufficient Liquidity
              Goal: Maintain 90 Days + $50 million of cash on hand for Electric, and 120 days cash on
              hand for Water
              Result: Both Electric and Water remained above their respective targets for days cash
                                                                                                                 GOAL MET

              Strong Positive Cash Flow
              Goal: Maintain debt service coverage ratio (DSCR) for Electric at 1.6 or higher, and for
              Water at 2.0 or higher
              Result: As of June 30, 2020, Electric and Water Utility’s DSCR is projected at 1.7 and
              1.8, respectively
                                                                                                                   WATCH

   ANAHEIM PUBLIC UTILITIES                          Page 7                      Utilities Success Indicators: 1H 2020
D. Effectively Manage Enterprise Risk
              Legislative & Regulatory Risk Management
              Goal: Proactively identify and manage enterprise-wide risks so that all key risks are
              properly addressed or mitigated, and no material violations occur that would adversely
              affect APU’s operations or its assets
              Result: No material violations or compliance issues arose and counterparty default risk
              was kept at 0%                                                                                        GOAL MET

E. Invest in a Positive & Productive Work Environment

               Strong Safety Culture
               Goal: Maintain an industrial safety and health injury rate that does not exceed 1.0
               Result: The disabling injury rate was 0.29
                                                                                                                    GOAL MET

               Employee Efficiency
               Goal: Meet or exceed industry benchmark for employee efficiency
               Result: APU exceeded its employee efficiency benchmark with over 40% more electric
               customers per non-power generation employee and over 25% more water customers per
               water utility employee                                                                               GOAL MET

F. Maintain Alignment with the City’s Goals
               City Council, Public Utilities Board & City Manager Vision
               Goal: Support City Council policies and initiatives, seek the Public Utilities Board’s
               recommendations and direction, and implement programs and projects at the City
               Manager’s direction
               Result: APU continued to support and expand many City Council and City Manager
                                                                                                                    GOAL MET
               policies and initiatives throughout the reporting period

   ANAHEIM PUBLIC UTILITIES                           Page 8                      Utilities Success Indicators: 1H 2020
Metric Goals, Definitions, Results
A. SUSTAIN A HIGH LEVEL OF CUSTOMER SATISFACTION

    1. Meet at least 85% of Anaheim Anytime survey respondents’ evaluation of employee
       effectiveness (with a rating of “good” or “superior”) in the categories of employee
       courtesy, time to respond, and employee effectiveness

        Detail: APU strives to achieve high satisfaction ratings through its many customer
        interactions, which occur through the call center, at the service counter, in the field, and on
        phone calls or emails. Through Anaheim Anytime, an interactive customer service tool, APU
        customers can rate the service they received in categories like service effectiveness, quality of
        service, and timeliness of response. Each of these categories can be rated on a scale of poor,
        below average, average, good, or superior. This metric will focus on the percentage of
        responses rated “good” or better during the reporting period.

        Result: Goal Met. For the reporting period, APU received a total of 199 Anaheim Anytime
        surveys and the percentage of responses that rated service effectiveness, quality of service, and
        time to respond with a rating of “good” or better was over 85%.

                           Service Effectiveness
                           “The communication was great from the time I submitted my
                           request to the light being fixed. Great experience!” – Chris P.

                           Time to Respond
                           “This response, as well as previous ones, exceeded expectations
                           due to the immediate action taken. Fantastic service that is much
                           appreciated.” – Jay J.

                           Employee Courtesy
                           “Fast, courteous, and in fact unbelievable. Thanks to the best
                           staff and department.” – Max F.

    2. Meet or exceed at least 90% of Anaheim Anytime survey respondents’ expectations

        Detail: Overall customer satisfaction is a barometer of whether APU is meeting the needs of
        its residential and business customers. Through Anaheim Anytime, APU customers have the
        opportunity to ask questions, submit a service request, communicate about an issue that needs
        service or immediate attention, and rate whether their service expectations were met. This
        metric will focus on the percentage of respondents that rated their expectations as being “met”
        or “exceeded” during the reporting period.

        Result: Goal Met. Of the 199 respondents that completed an Anaheim Anytime survey during
        the reporting period, 95% indicated that their expectations had been met or exceeded. The

ANAHEIM PUBLIC UTILITIES                                 A‐1                          Utilities Success Indicators: 1H 2020
most requested service during the reporting period were street light repairs, which made up
37% of the requests.
In October 2019, APU began tracking customer call satisfaction using its new automated
phone survey. During the reporting period, over 1,100 customers participated in the phone
survey – which is available to all callers who speak with a Utility Call Center representative –
and 91% of survey participants indicated that the reason for their call had been resolved. As
more survey results are collected, APU will establish a benchmark to measure customer
satisfaction in the Utility Call Center, which handles over 17,000 phone calls each month.1
3. Respond to customer calls in the Utility Call Center in 3 minutes or less
Detail: Customer Service Representatives (CSRs) in the Utility Call Center are trained APU
staff members who strive for the highest quality of professionalism, effectiveness, and courtesy
when answering customer phone calls. They are trained to provide answers and solutions to a
number of issues relating to the customer’s utility account or any number of city-wide issues.
The customer wait time metric result is calculated by totaling the duration of minutes where
customers experienced a wait before speaking to a representative during the reporting period
and dividing this total by the number of calls answered in the same reporting period.2 The
monthly daily call volume is calculated by dividing the total number of calls answered during
the month by the total number of full work days during that same month.3 Customers who
call the Utility Call Center can choose to speak to a live representative within 10 – 50 seconds,
depending on the menu option they choose from the Interactive Voice Response (IVR)4,
which provides a selection of commonly requested, self-service options. Wait times begin
immediately after a customer selects an IVR message option and ends when a service
representative answers their call.
1 Average based on Utility-related calls answered for the Fiscal Year 2020
2This metric is calculated by taking the total call wait duration during the reporting period and dividing it by the total calls answered
within that same period; this calculation also filters out customers who drop their call before speaking with a representative.
3Similar to call wait times, the daily call volume calculation filters out calls that were dropped. Full work days in the calculation are for
business weekdays only with at least 10.5 work hours.
4 The Interactive Voice Response (IVR) provides immediate self-service options for customers and may also alert customers to issues
like fraudulent callers pretending to be utility employees. For more information on scammers targeting utility customers, including tips
on how to avoid such scams, please see www.anaheim.net/4755/Scam-Alert.
ANAHEIM PUBLIC UTILITIES A‐2 Utilities Success Indicators: 1H 2020In addition to utility calls, CSRs answer phone calls for the City’s 311 service, a non-emergency
service allowing callers to report graffiti, submit code enforcement and community
preservation requests, make general city-related inquiries, or follow-up on requests made
through Anaheim Anytime. Wait times for 311 calls are typically much lower than Utility-
related calls due to the lower call volume and because specific CSRs are assigned to answer
these calls with urgency.
Result: Goal Met. Utility-related call wait times averaged 1.7 minutes during the reporting
period. Between March and June, the average daily calls handled and average wait time
dropped, likely because utility service shutoffs and late payments were temporarily suspended
to help customers experiencing financial hardship from the pandemic.
Utility Call Center Average Wait Time (Mins)
Wait Time & Daily Calls Handled Average Daily Calls Handled
932 931 886 928 910 889
861 867
732 689 698
606
2.3 2.2 2.4 2.4
1.8 2.1 2.1 1.9
1.3 1.3 1.5
0.5
Jul 19 Aug 19 Sep 19 Oct 19 Nov 19 Dec 19 Jan 20 Feb 20 Mar 20 Apr 20 May 20 Jun 20
During this reporting period, APU also promoted its customer chat feature on its social media
platforms – as an alternative to calling customer service. Customers can chat with a live
representative Monday through Friday from 9:00 am to 4:00 pm for their utility account
service needs. To utilize this feature, visit anaheim.net/3374/Customer-Service.
APU Customer Service Chats
176 195 183
124
79 80
Jan-20 Feb-20 Mar-20 Apr-20 May-20 Jun-20
Call wait times for the City’s 311 service averaged 1.0 minutes during the reporting period.
Many 311 calls during the reporting period were for COVID-19 related topics such as City
policies, programs, mask enforcement, and testing sites. For the latest City of Anaheim updates
on COVID-19, please visit www.anaheim.net/5454/Tracking-Coronavirus-Anaheim-Ready.
ANAHEIM PUBLIC UTILITIES A‐3 Utilities Success Indicators: 1H 2020Average Wait Time & Daily Calls Handled
Average Wait Time (Mins) Average Daily Calls Handled 113
90 90 85 86
77
64 58 58 63 58
57
1.6 1.4
1.2 1.1 1.1 1.0 1.1
0.7 0.8 0.8 0.9
0.5
Jul 19 Aug 19 Sep 19 Oct 19 Nov 19 Dec 19 Jan 20 Feb 20 Mar 20 Apr 20 May 20 Jun 20
4. Ensure street light repairs are made within 4 business days on average
Detail: Repairing street lights promptly is a high priority for residents and businesses and is
therefore tracked as its own metric. APU’s goal is to repair street lights within 4 business days
on average. For many street light repairs, a light bulb and photo sensor are replaced – which
is a straightforward and quick repair. However, more time may be required for wiring issues
or infrastructure repairs or replacements.
Result: Goal Met. Over 760 street lights were repaired during the reporting period within 2.1
business days on average.
As of June 2020, LED lights make up roughly 61% or over 12,800 of Anaheim’s total street
lights. Last year, APU identified LED solutions for other styles of street lights, which are
located in designated central and east Anaheim roadways.
2.0 2.2 2.1 2.5 2.1
2016 2017 2018 2019 2020 YTD
Average Business Days 2.0 2.2 2.1 2.5 2.1
# Repairs 1,837 1,884 1,608 1,791 769
Anaheim Street Light Styles
STANDARD COLONY TRADITIONAIRE
ANAHEIM PUBLIC UTILITIES A‐4 Utilities Success Indicators: 1H 2020B. DELIVER DAILY OPERATIONS EXCELLENCE
1. Maintain electric system reliability indicators in the top 25% of the municipal owned
utility category nationally
Detail: APU monitors its service reliability by tracking the following key reliability indicators
against the top quartile of municipal utilities across the nation, as well as neighboring utilities.5
Duration of Outages: The system average interruption duration index (SAIDI) is an
indicator of system performance and reflects the integrity of the local electric grid. It
measures the number of minutes over the year that the average customer is without power
by dividing the total customer minutes out by the number of electric service customers.
Restoration Time: The customer average interruption duration index (CAIDI) is an
indicator of response time for every occurring outage, indicating how quickly power was
restored to customers. It measures the average amount of time a customer is without
power per interruption by dividing the total customer minutes out by the number of
customer interruptions.
Frequency of Outages: The system average interruption frequency index (SAIFI) is an
indicator of system resilience, reflecting how often a typical customer is affected by an
outage. It measures the number of times an average customer experiences an interruption
by dividing the number of customer interruptions by the number of service customers.
Result: Goal Met. APU was in the top national quartile of the municipal owned utilities
category for all three reliability indicators, with the
average customer experiencing one outage every three
years (0.29 SAIFI), lasting approximately 19.2 minutes
on average (SAIDI), with power restored within 66.4
minutes on average (CAIDI). The charts below
demonstrate how APU fares against neighboring
utilities for all three reliability indices.
During the reporting period, Mylar balloons and
underground cable failure comprised 23% and 20% of the
total sustained outages, respectively. To mitigate such
issues and improve electric system reliability, APU
5Benchmark data is provided by PA Consulting Group Inc. as part of their annual, national benchmarking study, consisting of over
150 participating electric utilities. PA Consulting Group Inc., "System Reliability, Restoration, and Response Report (SR3), Reliability
Data for Calendar Year 2018".
APU looks at neighboring utilities whenever publicly available data is available. Only sustained outages, defined here as those outages
lasting 5 minutes or more, are included for comparison. Total system indices, which include distribution and transmission indices, are
also used. Major event days from benchmark agencies are excluded for a more accurate comparison. Results from other agencies are
from calendar year 2018, with the exception of PG&E and LADWP which have provided FY2019 and FY2020 results on their
website, respectively.
ANAHEIM PUBLIC UTILITIES A‐5 Utilities Success Indicators: 1H 2020continues to underground its overhead power lines and replace aged and degraded
underground cable. Operationally, tree trimming, equipment inspections, patrols, and
installation of automation have helped improve overall system reliability.
Duration of Outages (mins)
148.8
102.4
71.3 77.8
46.4
19.2
Anaheim SCE LADWP SDG&E PG&E Top 25%
POUs in Nation
Restoration Time (mins)
144.3
123.8 131.9
99.6
66.4 66.5
Anaheim SCE LADWP SDG&E PG&E Top 25%
POUs in Nation
Frequency of Outages (# per customer)
1.13
0.72 0.71
0.63 0.58
0.29
Anaheim SCE LADWP SDG&E PG&E Top 25% POUs
in Nation
2. Procure adequate renewable resources to comply with state mandates on renewable
portfolio standard, meet interim targets, and remain well-positioned for future
compliance periods Detail:
APU remains committed to reducing greenhouse gas emissions through increasing its
renewable resources while lowering more carbon-intensive resources like coal in its power
resources portfolio. State legislation requires a 33% renewable portfolio standard (RPS) by
ANAHEIM PUBLIC UTILITIES A‐6 Utilities Success Indicators: 1H 20202020, 60% RPS by 2030, and 100% carbon-free energy by 2045.6 California’s governor signed
the last two provisions into law (known as SB 100) on September 10, 2018.
APU’s outlook includes the replacement of the
Intermountain Power Project (IPP) coal and gas units with
renewable resources by 2030; and the replacement of the
Canyon (CPP) and Magnolia gas units with carbon-free or
renewable resources by 2045.
For a detailed breakdown of APU’s accomplishments and
highlights addressing greenhouse gas emissions, visit
www.anaheim.net/5507/Greenhouse-Gas-Reduction to view
APU’s 2020 Greenhouse Gas Reduction Plan, that includes
comments about sustainability initiatives from Anaheim high
school students.
Result: Goal Met. APU’s renewable portfolio standard (RPS) is
currently at 33%, and remains on track to meet RPS goals in
compliance with state mandates.
3. Maintain generation availability rate at 95% or better
Detail: Generation availability is a barometer of reliability, indicating the percentage of time
the power plant is available to operate and generate power. While the long-term goal is to
phase out of carbon-based resources, today’s influx of intermittent solar and wind requires the
ability to integrate renewables, especially as solar comes offline in the evening timeframe. This
metric is calculated by dividing the total number of hours the plant is available to operate by
the total number of hours in the reporting period. Results
of generation availability will be provided for Canyon
Power Plant (Canyon) since Kraemer Power Plant
(Kraemer) is no longer operational.7
Result: Goal Met. During the reporting period, Canyon
recorded an average availability rate of 99.2%, which is
currently an improvement from the prior calendar year
due to less forced outage hours (or shutdowns from an
unexpected failure).8
6See Senate Bill (SB) X1-2 for 33% RPS by 2020 and Senate Bill (SB) 100 for 60% RPS by 2030 and 100% carbon-free energy by
2045. SB 100 allows the 100% clean-energy provision to be met through eligible renewable resources along with “existing large hydro
and any other zero-carbon polluting resources” – which was intended to “leave the door open” to potential new technologies in the
future. See focus.senate.ca.gov/sb100/faqs for more information.
7 The Kraemer Power Plant was officially retired on December 31, 2019.
8
A forced outage is a shutdown condition of a power station, transmission line, or distribution line when the generating unit is
unavailable to produce power due to an unexpected breakdown.
ANAHEIM PUBLIC UTILITIES A‐7 Utilities Success Indicators: 1H 20204. Continue to meet or exceed all state and federal standards for drinking water quality
Detail: APU conducts more than 44,000 analyses each year to ensure its customers receive
high quality tap water that is clean, safe, and great-tasting. As a public water agency, Anaheim
is required by the U.S. Environmental Protection Agency (U.S. EPA) and the State Water
Resources Control Board (formerly regulated by the Department of Public Health) to comply
with all regulations that limit the amount of certain contaminants in water. For more
information about Anaheim’s drinking water quality and how it is tested, please see Anaheim’s
most recent Water Quality Report: www.anaheim.net/2092/Water-Quality-Report.
Result: Goal Met. APU met 100% of drinking water standards this reporting period.
Anaheim’s drinking water continues to meet or surpass all federal and state standards as
established by the U.S. EPA and State Water Resources Control Board.
APU continues to monitor per- and polyfluoroalkyl
substances (PFAS), industrial chemicals used in the country
between the 1940s to 2000s to coat carpets, clothes, furniture,
food packaging, cookware and other products. While these
chemicals are no longer in active use in the United States,
newer and advanced technologies have detected the smallest
traces of such chemicals in many of the country’s water sources, such as the Santa Ana River,
which replenishes much of Orange County’s groundwater. Scientific studies have shown
adverse health effects from exposure to these chemicals.9 Consequently, APU has taken the
majority of its wells offline in compliance with state guidelines. In the near term, more water
from Northern California and the Colorado River is being imported to serve Anaheim
customers. Because imported water can cost twice as much as pumping local groundwater,
long-term solutions are currently being planned, including capital investment in groundwater
treatment solutions to safely put Anaheim’s groundwater wells back online again. For the latest
information on APU’s actions to address PFAS, visit www.anaheim.net/3302/PFOS-PFOA.
5. Minimize main breaks per 100 miles of pipe to under 8 annually, which is
approximately 40% below the national average
Detail: A key reliability indicator that measures the strength and reliability of water system
infrastructure is the number of main breaks per 100 miles of distribution pipeline. According
to the Water Research Foundation and Partnership for Safe Water, “main breaks are a primary
indicator of the condition of distribution system infrastructure because they are a critical
element in maintaining distribution system integrity and have a large and very visible impact
on several other key operational parameters.”10
Anaheim’s performance goal is calculated by dividing the annual number of main breaks by
the total miles of pipe (per 100 miles) in the distribution system. To encourage greater pipeline
9 For more information, see the EPA’s website on PFAS: www.epa.gov/pfas/basic-information-pfas#health
10 See page 33, 37. LeMieux, Jason. Criteria for Optimized Distribution System. Water Research Foundation, 2010.
ANAHEIM PUBLIC UTILITIES A‐8 Utilities Success Indicators: 1H 2020replacement throughout Anaheim while minimizing the number of main breaks, a goal of
under 8 main breaks per hundred miles of pipe was established – a level that is approximately
40% below the national average.11
Main breaks can occur for any number of reasons including corrosive soil, age of pipe, pipe
installation methods, tree root intrusions, or even incidents where a contractor inadvertently
strikes a pipe. For these reasons, the number of main breaks per month can vary significantly,
which is why this metric is reported as an annualized figure. For consistency with other
agencies and benchmarks, a 12-month moving total of this metric will be utilized.
Result: Goal Met. For the reporting period, APU recorded 4.9 main breaks per 100 miles of
distribution pipeline. While main breaks can be unpredictable and occur for a variety of
reasons, APU monitors the condition of pipes throughout the city and utilizes main break data
to plan future main replacement projects. Last fiscal year, APU replaced over 2,200 feet of
water mains to minimize the likelihood of main breaks. The chart below shows that the
number of main breaks in Anaheim (per 100 miles of pipe) remains below the national average
and compares favorably against neighboring agencies.12
3 Year History Monthly # MBs
Main Breaks Per 100 Miles of Pipe 12 Month Rolling Total of MBs Per 100 Miles of Pipe
Goal = Less than 8
4.9
Comparison: Main Breaks Per 100 Miles of Pipe
19.6 18.4 5.2 4.9 3.6
LADWP Fullerton Santa Ana Anaheim Brea
7,340 miles 430 miles 478 miles 754 miles 212 miles
11See Folkman’s study, featuring survey results from 308 participating utilities for the year 2018, making it “one of the largest surveys
conducted on water main failures” that provides “an accurate representation of water main performance and operating conditions in
North America.” Water Main Break Rates in the USA and Canada: A Comprehensive Study,” March 2018, Steven Folkman.
12Results from other agencies are from FY 2019, with the exception of LADWP and Fullerton which currently have FY 2018 data
available.
ANAHEIM PUBLIC UTILITIES A‐9 Utilities Success Indicators: 1H 20206. Meet the three-year maintenance goal of inspecting all 7,800 hydrants (or 217 per
month) and exercising all 23,000 system valves (or 639 per month)
Detail: Preventative maintenance on hydrants and valves is important to managing the
operability of the water distribution system, as well as minimizing customer outages when
main breaks occur. Activities in this area are tracked monthly to ensure performance is on
target to meet program goals. On average, 217 hydrants should be serviced monthly to meet
the goal of inspecting all hydrants every three years (7,800 total hydrants divided by 36
months), while 639 valves should be exercised monthly in order to meet the goal of exercising
all valves every three years (23,000 total valves divided by 36 months).
Monthly performance on such maintenance activities may fluctuate as staff may be reassigned
to support higher priority activities such as time-sensitive construction, water line repairs, or
planned outages. Moreover, maintenance performed in high-traffic intersections or other
locations requiring additional staff for safety may also impact monthly performance.
Result: Goal Met. For the reporting period, APU serviced an average of 270 hydrants and
781 valves per month, meeting its performance goal. Additionally, every three years APU aims
to service all 7,800 hydrants and 23,000 valves to maintain good water system performance.
June 30, 2020 marked the completion of the most recent three-year maintenance cycle for
hydrants and valves, and APU also met this goal. The consistent maintenance of hydrants and
valves helps ensure that the water system continues to operate reliably and at optimum levels.
Hydrant & Valve Maintenance Program
3 YR MAINTENANCE GOAL Hydrants Serviced Valves Exercised
Hydrants: 7,840
Valves: 23,000
9,182
7,789
6,836
2,578 3,495
2,375
Year 1 Year 2 Year 3
FY 17/18 FY 18/19 FY 19/20
C. PRESERVE COMPETITIVENESS & FINANCIAL HEALTH
1. Maintain annualized electric rates below other Orange County cities
Detail: An electric rate comparison is based on a typical single-family home that consumes
500 kilowatt hours (kWh) of energy per month. APU is the only municipally-owned utility in
Orange County, while the rest of the county is served by Southern California Edison and San
Diego Gas & Electric.
ANAHEIM PUBLIC UTILITIES A‐10 Utilities Success Indicators: 1H 2020Result: Goal met. Annualized residential electric rates remain lower than rates paid by other
Orange County cities. This savings increases as usage increases because investor owned
utilities typically have more escalating rate tiers.
For typical residential usage of 500 kilowatt hours of energy per month, Anaheim customers
pay $88.60 per month, while North Orange County cities served by Southern California
Edison pay approximately 27% more, and South Orange County cities served by San Diego
Gas & Electric pay approximately 63% more.
Monthly Residential Bill Comparison: 500 kWh/month
South OC
(SDG&E)
$144.58
North OC
(Edison)
$112.80
Anaheim $88.60 Source: Calculated Using CPUC Utility Tariff Information
For reference, a comparison of system average rates is shown below. This rate captures the
average kilowatt hour cost across all customer segments, and reflects several factors including
power supply costs, customer type, number of customers, volume of sales, and efficiency of
customer load. As the chart13 indicates, some cities have an additional utility user’s tax, which
Anaheim does not.
Average Customer Cost Per kWh (in $/kWh)*
Average Customer Cost Per kWh ($/kWh) Utility User's Tax
SDG&E* 0.2521
PG&E* 0.2163
LADWP 0.2066
Pasadena 0.2012
Glendale 0.2012
Alameda 0.1963
Banning 0.1901
SCE* 0.1750
Lodi 0.1678
Lompoc 0.1671
CA State 0.1658
Redding 0.1650
Burbank 0.1639
Palo Alto 0.1632
Anaheim 0.1622
Riverside 0.1529
Modesto ID 0.1508
Azusa 0.1488
SMUD 0.1472
Turlock ID 0.1393
Roseville 0.1384
Imperial ID 0.1239
Santa Clara 0.1158 *Utility User's Tax varies by cities served
Merced ID 0.1143 by investor owned utilities
13Figures from the “Average Customer Cost Per kWh” chart were calculated or obtained from publicly available information
including the California Public Utilities Commission (CPUC) and U.S. Energy Information Administration (EIA) 861 filings.
ANAHEIM PUBLIC UTILITIES A‐11 Utilities Success Indicators: 1H 20202. Maintain annualized water rates under the average of other Orange County
competitors
Detail: Water rates are compared based on residential usage of 16 hundred cubic feet (HCF)
per month, which is equal to nearly 12,000 gallons of water per month. This represents the
total amount of water consumed by a typical residential household in Anaheim per month.
Many water districts are supported through revenue sources like property taxes or bonds paid
through property taxes, which can artificially lower their water rates significantly. This is
because the true cost of providing water service, which can be expensive especially in times of
drought, is subsidized through water district property taxes. In contrast, Anaheim's water rates
are not supported by any property taxes and only reflect the true cost of providing water
service. Despite these differences, Anaheim rates remain competitive with other water
agencies in Orange County.
Result: Goal met. Annualized water rates remained under the average of local Orange County
competitors during the reporting period. The typical water bill for a household in Anaheim is
$63.98, approximately 23% below the Orange County average as shown in the chart below.
However, APU is impacted by the shutdown of its groundwater wells, and the subsequent
increase in imported water costs. As a cost-of-service agency, cuts have been made including
a hiring freeze, deferring vehicle replacements, foregoing travel and non-compliance training,
and reductions to operating expenditures. To mitigate the costly impact of increasing imported
water purchases, APU has begun planning a three-year program to build new treatment plants
at the majority of its well sites throughout the city to restore many of its groundwater wells
and reduce imported water costs.
Comparison: Orange County Water Agencies
$160 (Based on 16 hcf/month)
$120 WATER BILL ($/MONTH) Est. Property Tax Alloc. ($/MONTH)
$80 Average $82.57
$63.98
$40
$-
LA PALMA
FOUNTAIN VALLEY
*YORBA LINDA WD
SERRANO WD
*SANTA MARGARITA WD
SAN CLEMENTE
*TRABUCO CYN WD
HUNTINGTON BEACH
WESTMINSTER
TUSTIN
GOLDEN STATE WATER CO.
*SAN JUAN CAPISTRANO CWD
*EAST ORANGE CWD
BUENA PARK
ORANGE
SEAL BEACH
GARDEN GROVE
NEWPORT BEACH
LA HABRA
SANTA ANA
FULLERTON
ANAHEIM
*IRVINE RANCH WD
BREA
*MOULTON NIGUEL WD
EMERALD BAY SERV DIST
MESA WD
*SOUTH COAST WD
*LAGUNA BEACH
*EL TORO WD
*Water districts receive property tax revenue which help them offset costs and subsidizes water rates. APU’s
water rates reflect the true cost of providing water to its customers without profit.
ANAHEIM PUBLIC UTILITIES A‐12 Utilities Success Indicators: 1H 20203. Remain in the A rated or higher categories for bonds
Detail: Moody’s, Standard & Poor’s (S&P), and Fitch provide credit ratings “about the ability
and willingness of an issuer, such as a corporation, state or city government, to meet its
financial obligations in full and on time. Credit ratings can also speak to the credit quality of
an individual debt issue, such as a corporate or municipal bond, and the relative likelihood that
the issue may default.”14
Result: Watch. Although both the Water and Electric Utility maintained its high credit rating
with a long-term outlook rated in the A category or higher, this metric remains on Watch to
develop strategies and tools for the Water Utility to regain its AAA rating from S&P, which
was lowered on Sept. 2016 during a statewide drought that resulted in a significant reduction
in water revenue.15 FitchRatings, however, reaffirmed the Water Utility’s AAA rating as
recently as January 2020, noting the Water Utility’s “healthy” debt service coverage and
liquidity, “favorable, affordable rate structure,” and “manageable capital plan.”16 As with many
utilities, the revenue impacts of the pandemic are being closely monitored by credit rating
agencies across the U.S. as APU continues to implement its financial strategies to mitigate the
impacts to customers.
Rating Agency Water Electric
Not rated Aa3
AA+ AA-
AAA AA-
4. Maintain days cash on hand of 90 Days + $50 million for the Electric Utility and 120
days for the Water Utility
Detail: Days cash on hand is a liquidity ratio that indicates the number of days an organization
can meet its operating expenses using the cash it currently has available. The higher the
number, the more days an organization can sustain its operations without any additional cash
14 See S&P’s website at www.spratings.com/en_US/understanding-ratings for more details.
15 S&P lowered its long-term rating on the Water Utility from ‘AAA’ to ‘AA+’ in Sep. 2016 after revising its rating criteria consisting
of an enterprise and financial risk framework. S&P noted that the Water Utility’s practices were “supportive of high credit quality”
and that its credit rating could be raised if “financial metrics improve such that the financial risk profile is commensurate with peers at
a higher rating level.” To view the S&P ratings report, click here: www.anaheim.net/DocumentCenter/View/10032 .
16 “Fitch Rates Anaheim, CA’s Water Revs ‘AAA’; Outlook Stable.” FitchRatings 7 January, 2020.
ANAHEIM PUBLIC UTILITIES A‐13 Utilities Success Indicators: 1H 2020inflows. The ratio is calculated in this report by dividing the unrestricted cash balance by the
total projected cash expenses for the entire fiscal year and multiplying this quotient by 365
days. For the Electric Utility, the $50 million balance – to meet specified financial performance
goals and debt service coverage requirements – is converted into days using this formula and
added on to the 90 days target. Currently, the target for the Electric Utility is roughly 140 days.
Result: Goal Met. As of June 30, 2020, the Electric Utility had 193 days of cash on hand,
while the Water Utility had 320 days of cash on hand.17 The charts below demonstrate that
utilities can maintain a high credit rating without holding excessive amounts of cash on hand.18
Water’s days cash on hand is projected to remain at current levels through Fiscal Year 2020/21
because the majority of Water Utility capital projects are funded through existing bond funds.
APU’s strategic financial plan focuses on cash-funding more routine, capital improvement
projects as a way to minimize bond issuances, lower future debt service costs, and to provide
greater financial flexibility.
600
Days Cash On Hand for Electric Utilities
400
With Credit Rating from S&P Ratings
200
0
Anaheim, Burbank, LADWP, Glendale, Riverside, Pasadena,
AA- AA- AA AA- AA- AA
600 Days Cash On Hand for Water Utilities
With Credit Ratings from S&P Ratings
400
200
0
Burbank, LADWP, Glendale, Anaheim, MWD, Riverside, Pasadena, OCWD,
AAA AA+ A+ AA+ AAA AAA AAA AAA
17 The Electric and Water Utility’s days cash are unaudited estimates as of June 30, 2020.
18 For consistency, credit ratings are taken from S&P Ratings only; the rating reflects S&P’s long term rating for that agency’s senior-
lien revenue bonds. Days cash was calculated based on financial figures listed in each respective agency’s Comprehensive Annual
Finance Report (CAFR) for the fiscal year ending June 30, 2019. S&P’s highest rating is AAA, followed by AA+, AA, and AA-. The
modifiers “+” or “-” indicates the relative status of that rating within the rating category. For more details, see S&P Ratings.
ANAHEIM PUBLIC UTILITIES A‐14 Utilities Success Indicators: 1H 20205. Maintain a debt service coverage ratio of 1.6 or higher for the Electric Utility, and 2.0
or higher for the Water Utility
Detail: Debt service coverage ratio (DSCR) is a financial metric that assesses an organization’s
ability to pay its debt. The metric in this report is calculated by dividing a fiscal year’s total
available net revenue to meet debt obligations by total direct debt service in that same period.19
The goal for this metric was established in accordance with Governmental Accounting
Standards Board (GASB) rules. Please note that financial figures in this report are unaudited,
and may change after the year-end audit when all adjustments have been made and are
finalized.
Result: Watch. As of June 30, 2020, the Electric and Water Utility’s debt service coverage
ratios are projected at 1.7 and 1.8, respectively. The COVID-19 pandemic and the associated
stay-at-home orders forced many businesses to close or scale back operations. As a result,
energy and water sales declined during the last few months of the fiscal year. And as mentioned
earlier, the presence of PFAS substances in the groundwater basin necessitated a shift towards
importing costlier water, contributing to a decrease in the Water Utility’s DSCR – which is
expected to decline further in fiscal year 2020/21. Over time, as groundwater treatment
solutions are implemented and the volume of imported water declines, Water Utility’s DSCR
is expected to climb back to 2.0 coverage.
D. MANAGE ENTERPRISE RISK EFFECTIVELY
1. Proactively identify and manage enterprise-wide risks so that all key risks are properly
addressed or mitigated, and no material violations occur that would adversely affect
APU's operations or its assets
Detail: APU manages its enterprise-wide risks on an ongoing basis and prepares an internal
compliance plan to monitor and report on its compliance with applicable laws and regulations.
Enterprise-wide risks also include keeping counterparty default risk – or the risk that the other
party in a transaction will be unable to fulfill its obligations – under a half percentage of short-
term power supply costs. APU minimizes such counterparty default risk through analyzing
and monitoring the credit risk of counterparties, and through employing a default risk model
against APU’s short term power supply costs.
Result: Goal Met. During the reporting period, no material violations or compliance issues
arose, and counterparty default risk was kept at 0%.
E. INVEST IN A POSITIVE AND PRODUCTIVE WORK ENVIRONMENT
1. Maintain an industrial safety and health injury rate that does not exceed 1.0
Detail: Many organizations measure the effectiveness of their safety program and culture
through an industrial safety metric known as the Disabling Injury Rate (DIR), or the number
19 Total available cash to meet debt obligations is before any general fund transfers.
ANAHEIM PUBLIC UTILITIES A‐15 Utilities Success Indicators: 1H 2020of injury cases involving days away from work for every 100 employees. According to some
safety experts, this rate “does a better job of representing the actual rate of workplace injury,”20
because it actually shows the incidence of serious injuries.
This safety metric conforms to the standard base rate calculation used by the Occupational
Safety and Health Administration (OSHA): a base of 100 employees, working 40 hours a week,
and 50 weeks per year is applied (for a total of 200,000 labor hours). To calculate the DIR,
multiply the number of injury incidents resulting in days away from work by 200,000, and
divide this product by the number of total employee hours worked.21
Result: Goal Met. For the reporting period, APU recorded a DIR of 0.29; for fiscal year
2019-20, the DIR is 0.27. APU promotes a
culture of safety and awareness through SAFETY: DISABLING INJURY RATE
convening regular safety meetings and
requiring employees to undergo safety TargetFor the Water Utility, APU uses the same methodology as above, dividing the number of water
customers by the number of full-time and part-time water employees. The number of water
meters is used as a proxy for the number of water customers. Employees that are shared with
the Electric Utility, such as customer service or billing staff, are prorated as part of this
calculation. APU uses the American Water Works Association (AWWA) benchmark to
compare itself against other water utilities nationally.24
Result: Goal Met. The Electric Utility had nearly 40% more retail customers per non-power
generation employee than the median benchmark reported by the American Public Power
Association for public power utilities with 100,000+ customers. The Water Utility had over
25% more water customers for every water employee than the median benchmark reported
by the American Water Works Association.
The charts below demonstrate how both the Electric and Water Utility’s employee efficiency
metric compares favorably against other peers.25
Burbank 198 LADWP 180
LADWP 205 Pasadena 285
Riverside 232 Riverside 415
Pasadena 240 Burbank 527
Anaheim 423 Anaheim 619
F. MAINTAIN ALIGNMENT WITH CITY GOALS
1. Support City Council policies and initiatives, as well as the City Manager’s direction
Detail: This section will describe how APU supports City Council and City Manager policies
and initiatives. Although definitive targets are not always available for these broad, city-wide
initiatives, APU will provide specific examples of programs and efforts that are in-line with
the City’s vision and goals.
24 AWWA published their 2017 benchmarking in 2018. See “2018 AWWA Utility Benchmarking Performance Management for
Water and Wastewater.” Anaheim’s Water Utility had 615 water customers for every water employee compared to the AWWA median
benchmark of 486 water customers per employee.
25Each agencies’ employee count was compiled from FY 2019 budget information found on their website. Because peer agencies do
not specify how many generation employees they have, Anaheim includes all of its Electric Utility employees in this comparison chart
for a fair apples-to-apples comparison.
ANAHEIM PUBLIC UTILITIES A‐17 Utilities Success Indicators: 1H 2020Result: Goal Met. During the reporting period, the City declared a local emergency due to
COVID-19, with City Departments responding to local challenges and focusing on providing
assistance and service to the community in a safe fashion. The next section describes some of
APU’s activities to help customers and their communities during this pandemic.
COVID-19 Customer Assistance
New Appointment System: APU prioritized the development of an appointment system
so that customers can now make an in-person appointment with Customer Service,
Electrical Engineering, Water Engineering, and Community and Sustainability Programs
through the APU website. The new appointment system facilitates planned customer visits
in a convenient fashion to reduce safety risks.
Activity Care Packages: APU sent over 100 activity kits to residents impacted by school
closures that took effect in March. The kits contained a model utility truck, a utility
coloring book with crayons, and a Dr. Seuss inspired
Thank You Frontline Workers!
activity book about sustainability, offering a fun and
educational way for families to interact with their
children.
Energy Efficiency Kit: APU provided LED
lighting kits to frontline workers as a way to honor
and show support to them. Each kit included a thank
you note featuring student-created art, a three-way
LED bulb, a motion sensor LED bulb, a dusk to
dawn security LED bulb, and a dusk to dawn night
light. To date, over 200 kits have been distributed to
frontline workers in the community.
Customer Assistance: APU implemented several strategies to help customers impacted
by the pandemic. This includes temporarily suspending utility service shut offs, offering
extensions and payment plans, and providing emergency bill payment relief to customers
experiencing financial hardship. Through federal
and local emergency payment relief programs,
eligible customers can receive financial assistance
for their electric and water utility bills. APU is also
participating in the City’s Economic
Development outreach efforts and is offering
small business customers utility payment
assistance and efficiency improvements. The chart
on the right provides a summary of the customer
assistance provided since March.
ANAHEIM PUBLIC UTILITIES A‐18 Utilities Success Indicators: 1H 2020Student Engagement
The following student events and programs held during the reporting period focused on
encouraging sustainability and helping students grow professionally as they pursue their
educational and career endeavors.
Sustainable Schools Award: In January, members of the Public Utilities Board awarded
two schools that exemplified environmental stewardship as the inaugural recipients of the
Sustainability Schools Award Program. The first was
Baden-Powell Elementary, selected for installing 630 Sustainable Schools Award
LED light fixtures, 59 plug load power management
devices, 31 high efficiency network controller HVAC
units, and 8 high efficiency transformers; offering a
STEM component for teachers and students; hosting
a science event for junior high school students; and
generating thousands of dollars in electrical savings. Baden-Powell
Katella High School was also selected for establishing Elementary
a water reclamation site; installing LED light fixtures;
constructing an agricultural area featuring two
greenhouses; creating an aquaponics garden;
implementing a sustainability curriculum; and
generating thousands of dollars in electrical savings.
Both schools received 30 Energy Star® laptops and Katella High School
charging stations for their efforts in incorporating Sustainable Landscape
sustainability practices and initiatives.
Canyon High School EV Presentation: In February, APU piloted the first electric
vehicle (EV) school presentation geared towards high school students to encourage EV
adoption. The students of Canyon High School learned about green transportation and
EVs, and analyzed the environmental effects of
Canyon High School EV Presentation different methods of transportation. During the visit,
students also weighed the costs and benefits of various
hybrid and electric vehicles, explored EV related
careers, and had the opportunity to examine EVs up
close. APU is planning additional EV demonstration
events to help encourage EV adoption and reduce
greenhouse gas emissions following safety protocols.
ANAHEIM PUBLIC UTILITIES A‐19 Utilities Success Indicators: 1H 2020You can also read