A Smart Service Platform for Cost Efficient Cardiac Health Monitoring - MDPI
←
→
Page content transcription
If your browser does not render page correctly, please read the page content below
International Journal of
           Environmental Research
           and Public Health

Review
A Smart Service Platform for Cost Efficient Cardiac
Health Monitoring
Oliver Faust 1, *, , Ningrong Lei 1 , Eng Chew 2 , Edward J. Ciaccio 3 and U Rajendra Acharya 4,5,6
 1    Department of Engineering and Mathematics, Sheffield Hallam University, Sheffield S1 1WB, UK;
      N.Lei@shu.ac.uk
 2    Faculty of Information Technology, University of Technology Sydney, Ultimo, NSW 2007, Australia;
      Eng.Chew@uts.edu.au
 3    Department of Medicine—Cardiology, Columbia University, New York, NY 10027, USA;
      edwardciaccio@gmail.com
 4    Biomedical Engineering Department, Ngee Ann Polytechnic, Singapore 599489, Singapore; aru@np.edu.sg
 5    Department of Bioinformatics and Medical Engineering, Asia University, Taichung 41354, Taiwan
 6    School of Management and Enterprise, University of Southern Queensland, Springfield, QLD 4350, Australia
 *    Correspondence: oliver.faust@gmail.com

 Received: 16 July 2020; Accepted: 24 August 2020; Published: 30 August 2020

 Abstract: Aim: In this study we have investigated the problem of cost effective wireless heart health
 monitoring from a service design perspective. Subject and Methods: There is a great medical
 and economic need to support the diagnosis of a wide range of debilitating and indeed fatal
 non-communicable diseases, like Cardiovascular Disease (CVD), Atrial Fibrillation (AF), diabetes,
 and sleep disorders. To address this need, we put forward the idea that the combination of Heart
 Rate (HR) measurements, Internet of Things (IoT), and advanced Artificial Intelligence (AI), forms
 a Heart Health Monitoring Service Platform (HHMSP). This service platform can be used for
 multi-disease monitoring, where a distinct service meets the needs of patients having a specific
 disease. The service functionality is realized by combining common and distinct modules. This forms
 the technological basis which facilitates a hybrid diagnosis process where machines and practitioners
 work cooperatively to improve outcomes for patients. Results: Human checks and balances on
 independent machine decisions maintain safety and reliability of the diagnosis. Cost efficiency comes
 from efficient signal processing and replacing manual analysis with AI based machine classification.
 To show the practicality of the proposed service platform, we have implemented an AF monitoring
 service. Conclusion: Having common modules allows us to harvest the economies of scale. That is an
 advantage, because the fixed cost for the infrastructure is shared among a large group of customers.
 Distinct modules define which AI models are used and how the communication with practitioners,
 caregivers and patients is handled. That makes the proposed HHMSP agile enough to address safety,
 reliability and functionality needs from healthcare providers.

 Keywords: service platform; internet of things; e-health; deep learning; heart rate

1. Introduction
      Heart Rate Variability (HRV) is a good indicator of human health, which can be used to
detect Atrial Fibrillation (AF), sleep disorders, Cardiovascular Disease (CVD), and diabetes. These
non-communicable diseases cause major public health problems. The Background section provides
some context on these diseases by reviewing relevant scientific work. HRV can be used for cost
efficient and unobtrusive disease diagnosis and treatment monitoring. Therefore, this technology has
the potential to play a major role in systems which address these public health problems. In order to
realize this potential, a framework is needed which turns the versatility of HRV into tangible benefits

Int. J. Environ. Res. Public Health 2020, 17, 6313; doi:10.3390/ijerph17176313    www.mdpi.com/journal/ijerph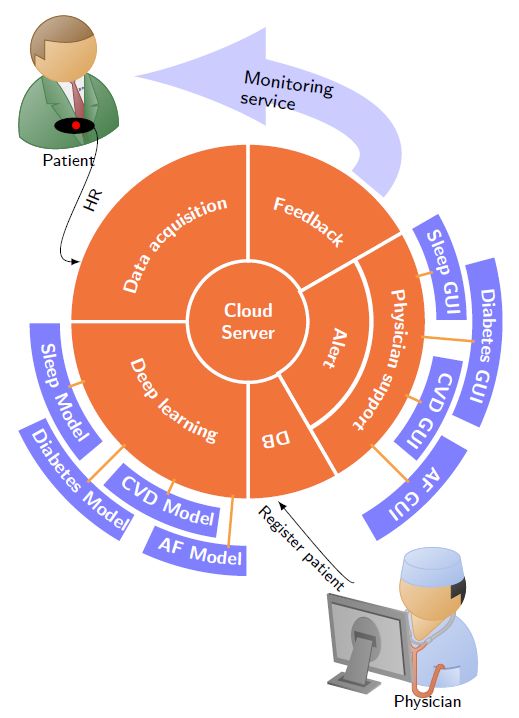
Int. J. Environ. Res. Public Health 2020, 17, 6313 2 of 18
for patients and public health providers. Heart Rate (HR) signals report the beat-to-beat interval of
the human heart. Due to natural HR fluctuations, the data rate varies from about 2 bytes to 8 bytes
a second. The high information content and low data rate makes HR data ideal for cost effective
e-health applications. To be specific, the data can travel from the patient over most of the wired and
wireless infrastructure to cloud services based on Internet of Things (IoT) protocols. The ability to
move HR data from the patient to a central and universally accessible location has the advantage
that the disease detection can be independently verified by human practitioners, and the data can
be used to improve the decision-making processes which ultimately improves the diagnostic quality.
Another advantage of the low data rate and the associated low processing requirements is real-time
disease symptom detection. This is important, because disease symptoms can be intermittent and,
during an acute phase, a particular risk may significantly increase. For example, the stroke risk in
paroxysmal (intermittent) AF has a five-fold increase when the AF is active [1]. Hence, it is important
to monitor the disease and act immediately to protect the patient’s life. The real-time requirement
poses a significant challenge to the technology which underpins a health monitoring service. Apart
from these technological challenges, the time pressure during real-time monitoring raises also safety
concerns for the diagnosis process. To be specific, evidence which underpins the diagnosis must
be preserved in order to conduct a root cause analysis in case an undesired outcome has occurred.
To maintain the evidence is also important for future training and testing purposes.
Rapidly evolving information technologies underpin the HR data acquisition, communication,
and storage processes. A modular service platform can help to translate data-centric information
into knowledge, which improves diagnosis and treatment monitoring. Hence, this approach can
enhance the quality of healthcare and reduce the cost. A service platform is defined as a specific
set of service functionality that is used across multiple services, or the procedural connections that
bridge and link specific sets of service functionality [2]. The platform functionality is realized with
a modular service architecture. The architecture is based on the concept of common and distinct
modules [3]. The common modules are shared among multiple services. This resource sharing leads to
cost savings. In contrast, distinct modules implement the functionality to address specific customer
needs. The challenge for the platform design is to find a balance between commonality and specificity,
such that the resulting services are safe, reliable, and functional in a cost-effective way.
With this paper, we propose a smart Heart Health Monitoring Service Platform (HHMSP) based
on HR signals. We address the need for a cost effective monitoring and diagnostic process that
can be used for a wide range of non-communicable diseases, including AF, CVD, sleep disorders,
and diabetes, in a safe and reliable way. The platform was created by combining readily available
technology. The signal measurement was done with commercial HR sensors. The acquired HR data
was relayed via smart phones to an IoT framework. The framework provides almost universal access
to the data. Having access to the data anytime anywhere allows us to interpret the signals through
machine classification or human expertise. Furthermore, the stored data can be used for root cause
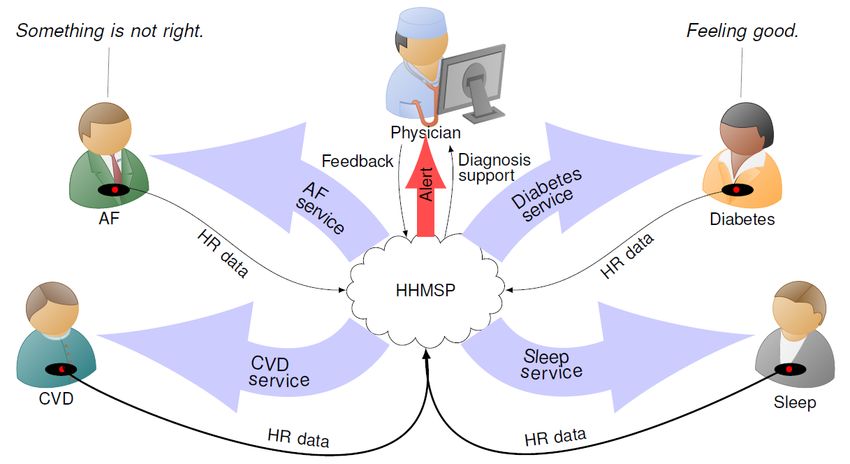
analysis and future improvements to the analysis process. Figure 1 shows an overview diagram of
the proposed service platform. The cloud server, at the center, incorporates the machine classification
functionality. We envision that, for routine disease monitoring tasks, the data interpretation is done by
machine classification, and human experts just validate the machine decisions. This hybrid approach,
where machines and humans work together cooperatively, improves cost efficiency while maintaining
the safety and reliability of the diagnosis. With respect to cost, the HHMSP harvests the economies of
scale with common modules that implement an IoT infrastructure. These modules handle the data
communication from the point of measurement to a central storage location. Distinct modules facilitate
both decision-making processes and the resultant dissemination. The concept of common and distinct
modules makes the HHMSP sufficiently agile to cope with future requirements.Int. J. Environ. Res. Public Health 2020, 17, 6313 3 of 18
Figure 1. Overview diagram of the Heart Health Monitoring Service Platform (HHMSP).
To support our claim that the proposed service platform is safe, reliable, and functional, as well as
cost effective, we have structured the remainder of the manuscript as follows. The Background section
introduces the public health problems caused by CVD, AF, diabetes, and sleep disorders. Furthermore,
we show how disease symptoms can be detected in HR signals. The section details the service platform
architecture. Subsequently, the merits and indeed the limitations of this architecture are discussed.
The Conclusion wraps up the paper and summarizes the main points.
2. Background
The medical justification for the proposed HHMSP comes from the fact that HR signals are a
good indicator of human health [4]. To be specific, the beat-to-beat intervals of the human heart hold
valuable information about the Autonomic Nervous System (ANS). The information content of HR
is similar to the information content of other physiological signals which have higher requirements
for measurement setup as well as communication and processing infrastructure [5]. For example,
Electrocardiogram (ECG) signals record more details of the human heart’s electrical activity when
compared to HR [6]. Hence, the ECG measurement setup is more complex, and more resources are
required to communicate and process the signal. As a result, the operating cost of diagnostic support
processes that use ECG is higher when compared to those that use HR.
The information contained in HR signals can be used to monitor AF, CVD, sleep disorders,
and diabetes. Formalizing the information extraction is a major challenge for practical monitoring
systems. Most of these systems depend on feature engineering and machine learning. The next sections
provide some background on the economic cost of these diseases and they outline how HR signals can
support diagnosis and treatment monitoring.
2.1. Atrial Fibrillation
Worldwide, about 33.5 million suffer from AF, which makes it the most prevalent sustained
rhythm disorder [7]. In developed countries, the majority of AF patients are aged 65 years and
above. There are two types of AF, namely persistent and paroxysmal (intermittent) AF. Both types
are associated with adverse health effects, through thromboembolic complications, heart failure,
and stroke. During an active period, AF increases the stroke risk five-fold [1]. The combination
of all these negative consequence makes AF an independent predictor for death. Untreated AF
poses a significant cost burden on healthcare systems worldwide, because of increased morbidity-
and mortality-associated therapeutic interventions [8]. Public Health England estimated that
only about 79% of all AF cases are detected. Based on this estimate, they put forward thatInt. J. Environ. Res. Public Health 2020, 17, 6313 4 of 18
optimizing risk factor detection and subsequent decease treatment will return £2.30 for every £1
spent (https://www.gov.uk/government/publications/health-matters-preventing-cardiovascular-
disease/health-matters-preventing-cardiovascular-disease).
AF changes the beat to beat interval of the human heart [9]. However, it is difficult and time
consuming for a cardiologist to detect these changes [6]. Therefore, computer support is essential
for HR based AF diagnosis. Table 1 provides an overview of HR based AF detection since 2016.
As such, the detection process involves either classical machine learning or Deep Learning (DL).
Classical machine learning requires feature engineering, basically extracting the information from
the signal first before making a decision. DL does not require explicit feature engineering. This has
the advantage that the decision-making algorithm sees the complete signal, and hence a decision is
based on all of the available information. Studies have shown that DL algorithms outperform classical
machine learning, based on feature engineering, for larger data sets, i.e., big data [10]. That is the
reason why the more recent studies employ this type of decision-making. All studies listed in Table 1
were based on data from the publicly accessible PhysioNet database [11]. That creates a competitive
environment with a clear history of improvement. To be specific, it is possible to compare the study
results with a fair bit of understanding about common and distinctive aspects of the work.
Table 1. Methods for Heart Rate (HR) based detection of Atrial Fibrillation (AF). Abbreviations in the
table: Acc, Sen, Spe, Deep Learning (DL), and Normal Sinus Rhythm (NSR).
Performance
Author Data and Method
Acc/% Sen/% Spe/%
Physionet Long Term AF Database.
Faust et al. 2020 [12] 94 - -
DL with hold out validation
Ivanovic et al. 2019 [13] Private data set. DL 89.67 94.20 -
Physionet: MIT-BIH AF Database, MIT-BIH
Andersen et al. 2019 [14] Arrhythmia Database, and MIT-BIH NSR - 98.98 96.95
Database DL
Faust et al. 2018 [15] MIT-BIH Atrial Fibrillation Database. DL 98.51 98.32 98.67
MIT-BIH Atrial Fibrillation Database.
Henzel et al. 2017 [16] 93 90 95
Linear measures & Threshold
MIT-BIH Atrial Fibrillation Database
Cui et al. 2017 [17] 97.78 97.04 97.96
Ensemble model & Threshold
MIT-BIH AF database and MIT-BIH
Islam et al. 2016 [18] 96.38 96.39 96.38
Arrhythmia database. Entropy & Threshold
2.2. Sleep Disorders
Sleep is essential for physical and mental health. It is an active and regulated process that
metabolizes energy, matures neural connections, and consolidates learning as well as memory [19].
Unfortunately, a faster paced rhythm of life and other detrimental lifestyle changes cause a higher
prevalence of sleep disorders [20]. These disorders cause daytime sleepiness which has a negative
impact on public safety and reduces the quality of life [21,22]. Epidemiologic studies show that up to
24% of the adult population has some sort of sleep disorder [23,24]. Wickwire et al. found that the
annual cost for the global economy caused by sleep disorders exceeds 100 billion USD per year [25].
Ozminkowski et al. estimated that, within a six month period, the average direct and indirect costs for
adults with sleep disorders were about 1000 USD greater than for normal control subjects [26].
The ANS activity reflects individual sleep stages [27]. During Rapid Eye Movement (REM)
sleep, the respiratory rate is irregular and the overall lung tidal volume decreases when compared to
Non-Rapid Eye Movement (NREM) sleep [28]. Consequently, both HR and respiratory rate change
according to the sleep stages [29]. HRV measures can be used to detect changes in HR signals.
These measures may provide useful information about the ANS state, which is relevant for a medical
diagnosis. During REM sleep, the ANS fluctuations between sympathetic and parasympathetic
activities. That increases the statistical measures of mean HR and HR variability. Therefore, it is possibleInt. J. Environ. Res. Public Health 2020, 17, 6313 5 of 18
to find HRV features which discriminate between NREM and REM sleep. The feature extraction process
is based on statistical, time-, frequency-domain, and nonlinear analyses algorithms. Trinder et al. used
HRV measures to analyze the autonomic activity during sleep [30]. Penzel et al. extracted spectral
analysis and detrended fluctuation features to gain sleep stage information [31]. Table 2 summarizes
scientific work that used HR signals to detect sleep disorders. The sparsely populated result columns
indicate that HR for sleep disorder detection is a research area which is still in its initial exploration
phase. Scientific studies, like the most recent one by Yajima et al. [32], are still concerned with feature
engineering, which aims to establish the role of HR based sleep disorder detection. The studies,
detailed in Table 2, were based on private data sets. That makes it difficult to compare and indeed to
repeat the studies.
Table 2. Methods for HR based detection of sleep disorders.
Performance
Author Data and Method
Acc/% Sen/% Spe/%
One case: 52-year-old man.
Yajima et al. 2019 [32] - - -
Statistical features and statistical analysis
Fourteen subjects (six female and eight
1-5 Tripathy et al. 2018 [33] male). Recurrence quantification analysis 95.71% - -
and dispersion & DL
Twenty-one healthy subjects (male: 12,
female: 9) and 30 subjects (male: 25,
female: 5) with obstructive sleep apnea
1-5 Yoon et al. 2017 [34] 87.54% - -
(OSA). Statistical parameters, Spectral
power, variability measurements.
Threshold decision
Seventy-five sleep apnea patients.
Time domain statistical parameters,
1-5 Liu et al. 2017 [35] - - -
Spectral power, nonlinear measurements
evaluated with statistical methods
2.3. Cardiovascular Disease
CVD describes a class of diseases, including, but not limited to, Coronary Artery Disease (CArD)
and Congestive Heart Failure (CHF). Worldwide an estimated 422.7 million patients suffer from
CVD [36]. 49 million people live with this disease in the EU. In 2016, the World Health Organization
(WHO) estimated that 17.9 million people died from CVD globally (www.who.int/news-room/fact-
sheets/detail/cardiovascular-diseases-(cvds)). This represented 31% of global death. It is estimated
that CVD costs the EU economies e210 billion (≈240 USD) a year [37]. CVDs are more prevalent with
age, due to prolonged accumulation of plaque and vascular aging [38,39]. Other more controllable
risk factors for CVD are e.g., high blood pressure, high cholesterol levels, obesity, diabetes mellitus,
and stress [40,41].
CArD describes a condition where the coronary arteries cannot deliver enough oxygen and
nutrients to the heart muscle [42]. That reduced blood flow is caused by a decreased artery diameter.
CArD is one of the root causes for Sudden Cardiac Death (SCD) [43]. Table 3 summarizes scientific
work that used HR signals to detect CArD. With the advent of DL the research field began to mature.
Lih et al. did not report the best accuracy in Table 3, but their study involved the detection of CArD,
Myocardial infarction, and CHF [44]. Posing such a multi-class problem indicates a high degree of
data handling sophistication which might be sufficiently robust to support clinical practice. Table 3
shows that public data sets are available which can be used for CArD detection. That provides some
means to compare and repeat the studies.Int. J. Environ. Res. Public Health 2020, 17, 6313 6 of 18
Table 3. Methods for HR based detection of Coronary Artery Disease (CArD).
Performance
Author Data and Method
Acc/% Sen/% Spe/%
Lih et al. 2020 [44] Physionet data, no further specifications. DL 98.5% 99.30% 97.89%
Fantasia and St. Petersburg Institute of
Cardiological Technics 12-lead Arrhythmia
Shi et al. 2019 [45] 97.5 100 95
databases. Wavelet and entropy & K-Nearest
Neighbour (K-NN)
Venkatesh et al. 2018 [46] Privaate data set. Statistical analysis - - -
NSR Physionet and St. Petersburg Institute of
Cardiological Technics database.
Singh et al. 2018 [47] 100 - -
Generalized discriminant analysis & extreme
learning machine
Yıldız et al. 2016 [48] Private data set. Statistical analysis - - -
Private data set. FAWT and entropy &
Kumar et al. 2016 [49] 100 - -
LS-Support Vector Machine (SVM)
CHF causes high morbidity and mortality. Worldwide, around 26 million people suffer from
this condition [50]. Long term monitoring is needed to collect sufficient evidence for a reliable
diagnosis of this cardiovascular disease. Binder et al. used HR signals to derive a prognosis for
CHF patients [51]. CHF changes the heart rhythm. Studies that employ feature engineering and
threshold techniques, such as Hsuet al. [52] and Liu et al. still aimed to establish that these changes
are reflected in HR traces [53]. Whereas DL approaches aim to automate the detection process and
thereby improve clinical workflows. Table 4 summarizes scientific work that detected CHF in HR
signals. CHF detection systems were designed based on publicly available databases. Hence, it is
possible to repeat and compare the study results.
Table 4. Methods for HR based detection of Congestive Heart Failure (CHF).
Performance
Author Data and Method
Acc/% Sen/% Spe/%
BIDMC Congestive Heart Failure Database,
MIT-BIH Normal Sinus Rhythm Database,
Hsuet al. 2019 [52] 90 - -
and Long Term AF Database.
Average entropy & Threshold
Physionet CHF database.
Liu et al. 2019 [53] - - -
Statistical measures & analysis
Wanget et al. 2018 [54] Physionet CHF database. DL 85.13 - -
MIT-BIH Atrial fibrillation, MIT-BIH
Normal Sinus Rhythm, BIDMC Congestive
Heart Failure, and Congestive Heart
Yoon et al. 2017 [55] 91.08 88.09 94.06
Failure RRI databases. CHF & AF detection
with statistical methods and threshold
decision making
Physionet NSR and CHF databases.
Liu and Gao 2017 [56] 85.6 - -
Multiscale Entropy Analysis & SVM
Chenet et al. 2017 [57] Physionet CHF and NSR databases. DL 72.41 - -
2.4. Diabetes
The WHO estimates that there were 422 million people living with diabetes in 2014 (www.who.
int/news-room/fact-sheets/detail/diabetes). The disease is associated with long-term complications
that result from damaged blood vessels. As such, diabetes is not a deadly disease, however recent
studies indicate that having diabetes doubles the risk of death [58]. Bommer et al. estimated that the
global economic burden will rise from 1.3 trillion USD in 2015 to 2.5 trillion USD in 2030 [59]. T. M. DallInt. J. Environ. Res. Public Health 2020, 17, 6313 7 of 18
put forward that undiagnosed and poorly managed diabetes has a high economic burden on the US.
Hence, finding cost-effective methods to detect and monitor this disease is of high importance [60].
Currently, diabetes is diagnosed based on blood tests [61]. Taking blood from patients is invasive
and there are non-trivial risks associated with this action (https://www.medic8.com/blood-disorders/
blood-test/risks-of-blood-tests.html). HRV analysis can provide a non-invasive alternative to blood
testing for initial diagnosis [62]. The reason why diabetes can be detected in this manner comes from the
fact that the disease alters the ANS and these alterations impact on the HR [63,64]. Acharya et al. used
HRV to establish an integrated diabetes index which can help clinicians during the initial diagnosis [65].
Swapna et al. used higher order spectra to detect diabetes based on HR signals [66]. The non-invasive
nature, coupled with the low data rate and the simple measurement setup, make HR signals ideal for
treatment monitoring. Table 5 summarizes scientific work on automated detection of diabetes based
on HR signals. All studies on HR based diabetes detection were based on private data sets. Hence, it is
difficult to repeat and compare the study results.
Table 5. Selected work on HR based diabetes detection, since 2016.
Performance
Author Data and Method
Acc/% Sen/% Spe/%
Yildirim et al. 2019 [67] Private data set. DL 97.62% 100% -
Private data set. Multiscale
Xiao et al. 2018 [68] Cross-Approximate Entropy & - - -
Statistical analysis
Swapna et al. 2018 [69] Private data set. DL 95.7 - -
Swapna et al. 2018 [70] Private data set. DL 90.9 - -
Private data set. Linear analysis methods &
Wilsonet et al. 2017 [71] - - -
statistical evaluation
2.5. Research Gap
The literature review highlights the economic cost of AF, sleep disorders, CVD, and diabetes.
Furthermore, it establishes that computer based algorithms can be used to detect disease symptoms in
HR signals. However, we found that there is no agreement on which features work best for a given
problem. Furthermore, state-of-the-art features are used for both human and machine decision-making.
Having similar features for both decision processes raises safety concerns, because the decisions are
not independent, i.e., they might be based on the same erroneous feature. That may be the reason why
the published studies fail to describe a system which can be used to make the theoretical results work
for patients in a real-world scenario. Related to the lack of system proposals, a business strategy on
how to build cost-effective, scalable, and safe diagnostic systems is also missing. In the next section
we tackle these problems by introducing a service platform architecture which addresses both patient
and economic needs in an economical way. Implementing this architecture creates a multi-disease
monitoring platform which is both practical and cost-effective.
3. System Architecture
The HHMSP allows us to frame the health monitoring problem in a business environment
which demands cost-effective solutions. Furthermore, the business centric framing mandates that
the healthcare provider becomes a customer who uses a service to improve disease diagnosis or
disease monitoring. The healthcare provider registers a patient with a service, which is tailored for
an individual disease. For example, a cardiologist registers a patient with the AF monitoring service.
That service will provide diagnosis and treatment support.
The HHMSP architecture was designed such that it incorporates HR measurement, IoT for data
distribution, cloud servers for storage and advanced Artificial Intelligence (AI) for data interpretation.
The block diagram, shown in Figure 2, provides a graphical representation of the proposed HHMSP
architecture.Int. J. Environ. Res. Public Health 2020, 17, 6313 8 of 18
Figure 2. Heart Health Monitoring Service Platform (HHMSP) architecture. The common modules
are in orange and the distinct modules are in blue. Abbreviations in the figure: Cardiovascular
Disease (CVD), Atrial Fibrillation (AF), and Graphical User Interface (GUI).
Implementing the platform architecture establishes the service functionality, which can be
described as follows: The healthcare provider purchases a specific diagnosis support service
(The specific service offering will depend on the service provider business model and on regulatory
requirements.). At the clinic, a patient is fitted with a HR sensor and registered with the service
platform (DB module). The patient wears the sensor which communicates the measurement data to
a data acquisition module. That module relays that data to an IoT cloud server. Once on the cloud
server, the HR data can be used for diagnosis support. The deep learning module queries the data
from the cloud and extracts relevant information with a disease specific model. The alarm module
informs the physician if the DL results meet a specific condition, for example a disease is detected.
Once alerted, the medical expert can use the physician support module to interact with both the DL
result and raw HR data during the diagnostic process. Having two cascaded decision processes, where
a DL algorithm provides an initial assessment and a human practitioner reaches a diagnosis, improves
the safety when compared to each individual decision system. The feedback module can be used to
disseminate rapid response warnings when an immediate health risk was detected, and it can be used
for patient compliance, i.e., a request to wear the sensor. A diagnosis should be communicated via
the standard channels established by the healthcare provider. The following sections describe both
common and distinct modules of the proposed HHMSP. To illustrate the platform functionality, we
discuss the details and state performance results from an AF monitoring service.Int. J. Environ. Res. Public Health 2020, 17, 6313 9 of 18
3.1. DB Module
The DB module incorporates a Database (DB) which holds patient information. Necessary fields
are: Patient ID, disease type, assigned physician, cloud server login key, service start date, service end
date. For the HHMSP, the disease type can be sleep disorders, CVD, diabetes or AF. Optional fields
are: Patient name and detailed feedback. The feedback could be a list of healthcare instructions for the
patient. At the start of the service subscription, the caregiver registers the patient with the DB module.
In response, the DB module will provide the cloud server login key. That login key is used to set up
the data acquisition module, as described in the next section.
3.2. Data Acquisition Module
The measurement setup is straight forward. The patient wears a breast strap with an embedded
HR sensor. The sensor picks up the electrical activity which indicates the human heartbeat, known as
the R peak. The time between two consecutive R peaks is measured and the resulting value is
communicated to the mobile phone as the RR interval. A stream of RR intervals is referred to as HR
signal. We tested our system with two commercially available sensors, namely Polar H10 and Polar
H7 (www.polar.com/uk-en). Low power Bluetooth is used to transfer the data from the HR sensor to
an Android smartphone or tablet.
The heart health app relays the sensor information to the IoT cloud server. The data exchange
with the IoT cloud server is facilitated by an Internet connection. Figure 3 shows a screen shot of the
heart health app, which was created by extending the BLEConnect program (https://github.com/
mobilars/BLEConnect). The background shows an averaged HR trace. The dialogue in the foreground
requests the user to enter the login data for the IoT server. Each user has a unique cloud server login
key. Both the patient and authorized caregivers can access the patient’s data using the same cloud
server login key, which is stored in the DB module.
Figure 3. Screen shot of the heart health app which relays the sensor data to the cloud server.
3.3. Cloud Server
We have used ThingSpeak from Mathworks (https://thingspeak.com/) as cloud server. To test
the HHMSP, two accounts were created with test data from PhysioNet’s AFDB and two accounts
were set up with measured data. Each account has two channels. The first channel, which is called
RR_interval_data, holds the measurement data. The content is updated when the heart health app
relays the HR signals. The second channel, which is called AF_detection_result, holds the machine
classification results. The result channel content is updated when the machine classification system
produces a new result.
3.4. Deep Learning Module
The deep learning module reads new entries from the RR_interval_data channel and writes the
classification outcomes to the AF_detection_result channel. The DL system was used because of itsInt. J. Environ. Res. Public Health 2020, 17, 6313 10 of 18
ability to detect the disease based on hidden information present in the HR signals. As such, DL does
not require feature engineering. This is a significant improvement compared to conventional machine
learning algorithms [10]. The absence of feature engineering makes DL robust when it classifies
samples from a larger data set. In a clinical setting, this robustness translates to high-quality diagnostic
support for patients using HR signals. Each disease requires a distinct DL model. Based on information
from the DB module (disease type), the deep learning module selects the appropriate model for the
HR to be analyzed.
The AF module was created by training the DL system using labeled HR data obtained
from PhysioNet’s AFDB (www.physionet.org/physiobank/database/afdb/). Based on data from
20 subjects, the system achieved an accuracy of 98.51% with 10-fold cross-validation [15]. The blindfold
classification performance, with 99.77% accuracy, indicates that the model is able to deliver high quality
diagnostic support for patients using HR signals.
3.5. Alert Module
The alert module prompts the physician to use the assigned physician support module.
That prompt is triggered when a specific condition is reached, usually when a disease is detected.
Sending the alert message can be facilitated with a range of communication channels, such as e-mail,
Twitter, and instant messaging.
For the AF monitoring service, the alert module is implemented on ThingSpeak. A monitor
program checks every DL result on the AF_detection_result channel. If the estimated AF probability
is above 0.5, the monitor program will send an alert message to the assigned physician via Twitter
and SMS.
3.6. Physician Support Module
The assigned physician has access to the HR data and DL diagnostic support through the HHMSP.
As such, HR signals are complex and their waveform resembles noise. Therefore, disease detection,
with the naked eye, is inefficient and error prone. Algorithm support is needed to extract relevant
information from the signal. The HHMSP physician support module incorporates algorithm support
in the form of DL results and features. The use case scenario for the module unfolds as follows.
The assigned physician receives an alert from the alert module with information about the patient
condition. Figure 1 shows an example where the physician received an alert message, because the
DL system detected an AF episode in the HR signal from one of the patients. By using the physician
support module, the assigned physician confirms or rejects the DL assessment and establishes a
diagnosis [72]. Then the diagnosis will be communicated to the patient and other stakeholders via the
feedback module, as discussed in the next section.
Figure 4 shows a screenshot of the prototype HHMSP physician support module with the AF
GUI. This module was developed by extending the Heart Rate Variability Analysis Software (HRVAS)
(https://github.com/jramshur/HRVAS). The drop-down list allows the assigned physician to select
a patient based on the patient ID, as provided by the DB module. The left-hand side of the figure
visualizes the automated decision support from the deep learning module. The right-hand side shows
the HRV signal features which were designed to help the assigned physician to validate the DL results.
In the example, shown in Figure 4, the patient with ID 08455 was selected, because of an alert
message. After pressing ”Fetch Data” the DL results are displayed as estimated AF probability over
time, in the upper left corner of the figure. In the timeline, the assigned physician can select a region of
interest. Once the region is identified, the support tool fetches the corresponding HR signal segment
and calculates a wide range of features from that segment. The feature extraction results are displayed
on the right side. Figure 4 shows the selected region of interest as a light red square in the timeline plot.
The square area encompasses a spike in estimated AF probability and a step edge. The estimated AF
probability is reflected in the color scheme of the HR graph shown in the lower left corner. The color
bar maps the estimated AF probability to a specific color, for example a low probability is blue andInt. J. Environ. Res. Public Health 2020, 17, 6313 11 of 18
a high probability is red. The small red region in the HR graph reflects the spike. Similarly, the red
region on the right of the HR graph reflects the step edge. The Poincaré plot [73], as well as features
SD1 and SD2, for the selected HR signal segment are displayed on the right side of Figure 4.
Figure 4. Physician support with the modified Heart Rate Variability Analysis Software (HRVAS)
program.
3.7. Feedback Module
Once the assigned physician has reached a diagnosis, the feedback module is used to communicate
with the patient. Social media, e-mail and personal phone calls can be used to provide feedback.
One way of providing feedback is with a simple traffic light system: Green—all is well. Yellow—take
predetermined precautionary action. Red—see your physician immediately.
3.8. Testing
The HHMSP was tested with the AF monitoring service. By doing that, we tested all common
modules for data handling and the specific modules which establish diagnostic support. To verify
all aspects of the AF monitoring service, we registered two healthy volunteers with the DB module.
Subsequently the volunteers were fitted with HR sensors and their data was communicated and
processed by the HHMSP. To be specific, their data was processed with the deep learning module
which executed the AF specific DL model. However, the DL results were not verified by a cardiologist.
Therefore, no diagnosis was established and the results have only an indicative character.
To validate both deep learning and physician support modules for the AF monitoring service,
we streamed benchmark data from PhysioNet’s MIT-BIH Atrial Fibrillation Database [74] to the data
acquisition module. Figure 4 shows a screenshot of the physician support module which details both
DL and feature extraction results for the benchmark data. Apart from visual inspection, enabled by
the physician support module, we also compared the deep learning module results for the benchmark
data with the results for the same benchmark data obtained by a previous study on the automated
detection of atrial fibrillation using a long short-term memory network with RR interval signals [15].
In that study, we used the same model as in the deep learning module. We established that the DL
results were the same. With that, we could validate both data acquisition and deep learning modules.
Furthermore, that validation confirmed that the AF monitoring service achieved 99.77% accuracy with
benchmark data.Int. J. Environ. Res. Public Health 2020, 17, 6313 12 of 18
4. Discussion
In this paper, we propose a practical and innovative application of IoT networks to tackle public
health problems caused by non-communicable diseases with a cost-effective service platform. Having
such a service platform leads to improved diagnosis and treatment monitoring processes. Currently,
CVD, AF, diabetes, and sleep disorders have distinct diagnosis and treatment monitoring processes.
Diabetes and sleep disorders are diagnosed based on measurements taken in a clinical environment.
Thus a patient must travel to the clinic whenever measurements are necessary. This process is
inconvenient for the patient and the cost is high. Furthermore, there is the possibility that patients are
symptom-free during the measurement. AF diagnosis is based on Holter monitoring [75] which is a
process to capture ECG signals in the patient environment. To start the process, a patient has to travel
to a medical facility where the Holter monitor fitted. After the measurement duration, usually 72 h,
the patient has to travel again to the medical facility to return the Holter monitor. The data analysis
can only start after the Holter monitor is returned, which delays the diagnosis. Furthermore, a 72 h
measurement duration might be insufficient to detect an AF period if the patient suffers from the
paroxysmal type of the disease. An AF monitoring service, based on the proposed service platform,
requires the patient to travel to the clinic only once for the initial fitting of the HR sensor. After that,
the HR data travels rather than the patient. Reduced patient traveling and prolonged measurement
duration are distinct advantages of the HHMSP based diagnostic and treatment monitoring process.
Less traveling makes the process more convenient for the patient. The prolonged measurement
duration means that more cases of a specific disease are detected, which improves patient outcome.
However, prerequisite for such a change in diagnosis and treatment monitoring processes are safety
considerations.
Our approach is safe, because we use a cascaded decision-making process. The service platform
is also practical, because state-of-the-art IoT technology is able to communicate, store and process HR
data in a cost-effective way. The service platform can be integrated into existing e-health solutions,
such as Electronic Patient Records (EPRs). The innovation, which sparked the idea for the HHMSP, is
DL. To be specific, DL is able to differentiate disease and non-disease classes accurately and in real
time. Indeed, DL makes the proposed multi-disease monitoring service platform feasible. Traditional
Computer-Aided Diagnosis (CAD) systems require feature engineering, which restricts the information
available to the machine learning algorithm. This is the reason why machine learning fails for big
data. Furthermore, a service platform, based on classical machine learning, would be more complex,
because each service would require a feature engineering module and a classification module. Neither
feature engineering nor classification modules are uniform. For example, the number and type of
features as well as machine learning algorithm for AF detection might be quite different from the
algorithms used for diabetes detection. In contrast, the architecture for the proposed service platform
is uniform—only the DL model changes, but the algorithm which executes that module stays the same.
The HR data is stored in the cloud server module, which allows real-time universal access to the data.
That access is important during the two-stage diagnostic process, which combines machine and human
decision-making. The two-stage diagnostic process offers three main advantages: (1) Safety through
human checks and balances, (2) significantly reduced physician workload, and (3) increased efficiency,
which enables real-time diagnosis.
In order to apply the service platform concept, we had to frame the public health problems in
terms of a market driven supply and demand scenario. Healthcare providers become customers
who have specific needs. These needs are identified through market analysis and subsequent market
segmentation. As it stands, each disease is a market segment and the needs of that market segment are
addressed by a specific health monitoring service. In terms of architecture, an individual service is
realized by combining common with distinct modules. The modular HHMSP has the capability to
extend the service offerings by adding new distinct modules for a newly identified market segment.
For example, the AF monitoring service uses all the common modules, together with the distinct AF
Model and AF GUI.Int. J. Environ. Res. Public Health 2020, 17, 6313 13 of 18
The fact that DL does not require feature engineering is significant, because that makes it
independent from human decision-making. In contrast, classical machine learning requires feature
engineering [73,76] and therefore it is not independent from human decision-making. From a human
perspective, HR signals are noise-like, and it is difficult, even for a skilled practitioner, to recognize the
underlying structure of the signal. Hence, human HR interpretation must be supported by features.
These features are similar to the features used for machine classification. Therefore, a mistake in the
feature engineering is likely to affect both classical machine learning and human decision-making.
From a safety perspective, having both decision systems depend on the feature extraction methods
constitutes a single point of failure. That means an error in the feature engineering might lead to
the same erroneous conclusion from a machine learning algorithm and a human practitioner. Such
an erroneous conclusion might harm patients, making the system less safe. In contrast, DL does
not require explicit feature engineering, that makes a DL result independent from any decision that
was based on feature engineering coupled with a decision-making process. Hence, there is a smaller
probability that errors overlap and both the human and DL algorithm come to the same erroneous
conclusion. Therefore, the combination of DL and human decision-making is safer when compared to
feature based machine learning and human decision-making.
4.1. Limitations
HR has a low data rate and a high information content. That is beneficial for data communication,
storage and processing. However, having high information content implies that the waveform is
noise-like. Hence, it is difficult for humans to interpret the signal. Unlike ECG based diagnosis, it is
difficult to predict a specific disease from the time domain HR waveform. Therefore, computer support
is needed to interpret HR signals. That computer support, for physician decision-making, comes in the
form of features. It takes trust and effort on the part of the medical practitioner to work with these
features.
4.2. Future Work
The service platform concept offers the flexibility needed to address diverse customer needs.
Individual diseases require customized services to address the different needs for diagnosis and
treatment monitoring. The generative innovation opportunities offered by the platform is potentially
significant. For example, we could link the HHMSP with existing Hospital Information Systems (HISs)
to enhance patience experience and improve outcomes.
The HHMSP was tested with benchmark data rather than with a medical expert who establishes
a diagnosis. Future work needs to address this shortcoming. To be specific, we propose to validate
the AF monitoring service with HR data measured from patients. In order to involve patients and
medical experts in the next validation step, we have to address shortcomings in the way the sensor
data is handled. To be specific, currently only standard protocols were used for the Data acquisition
module. These protocols follow no or only weak data security standards. Hence, the data is at
risk of being captured with negative consequences for the patient. This needs to be addressed with
end-to-end encryption from the sensor to the cloud server. Furthermore, for clinical studies involving
patients, the sensor and data handling technology should conform to health, safety, and environmental
protection standards. The sensors used to test the platform prototype fall short of the health protection
standard required for medical devices.
From the business perspective, the HHMSP customers, i.e., the healthcare providers,
offer professional support to the platform to ensure the services are consistent with the medical
standards of the country in which the heart health monitoring service is provided. In the future,
we need to address the mutual accountabilities of the platform owner and the healthcare provider.
Having a clear process which assigns accountability is a prerequisite to understand and subsequently
improve the systemic safety.Int. J. Environ. Res. Public Health 2020, 17, 6313 14 of 18
5. Conclusions
The proposed HHMSP is based on HR signals. There are two reasons for this type of design.
First and foremost, HR signals hold diagnostically relevant information about a wide range of diseases,
including, but not limited to CVD, sleep disorders, AF, and diabetes. The non-invasive nature
and easy measurement setup makes HR ideal for patient led data acquisition. The second factor is
the low data rate. The low data rate allows us to use low energy Bluetooth to connect the sensor,
which extends the battery life and/or enables the sensor to be smaller. Another positive aspect is
that data communication, storage, and processing is cheap. However, data interpretation is complex.
Physicians require computer support to make sense of the data. Even with computer support, it is
impossible for a physician to monitor the data in real time, because of the streaming nature of the data.
Therefore, we put forward DL for real-time data processing. Physicians are only involved to check
the machine classification results. These human checks and balances add another layer of safety, i.e.,
the diagnosis is only partially automated, and the responsibility still rests with the human decision
maker.
The proposed HHMSP architecture balances the commonality and distinctiveness, such that it is
possible to address a wide range of customer needs, and at the same time harvest the economies of
scale. The common modules establish the IoT functionality which is responsible for communicating
and storing the HR data. Distinct modules facilitate multi-disease diagnostic support through machine
classification and result dissemination. With the proposed architecture, we address the need of patients
with a specific disease through distinct modules, while at the same time harvesting the economies of
scale with common modules.
Author Contributions: O.F.—Investigation Methodology; O.F. Writing—original draft, Writing—review &
editing; N.L.—Methodology, review & editing; E.C.—Writing—review & editing; E.J.C.—Review & editing;
U.R.A.—Writing—review & editing. All authors have read and agreed to the published version of the manuscript.
Funding: This research received no external funding.
Conflicts of Interest: The authors declare no conflict of interest.
Abbreviations
The following abbreviations are used in this manuscript:
Acc Accuracy
AF Atrial Fibrillation
ANS Autonomic Nervous System
AI Artificial Intelligence
CAD Computer-Aided Diagnosis
CArD Coronary Artery Disease
CHF Congestive Heart Failure
CVD Cardiovascular Disease
DB Database
DL Deep Learning
ECG Electrocardiogram
EPR Electronic Patient Record
GUI Graphical User Interface
HHMSP Heart Health Monitoring Service Platform
HIS Hospital Information System
HR Heart Rate
HRV Heart Rate Variability
HRVAS Heart Rate Variability Analysis Software
IoT Internet of Things
K-NN K-Nearest Neighbour
NREM Non-Rapid Eye Movement
NSR Normal Sinus Rhythm
REM Rapid Eye Movement
SCD Sudden Cardiac Death
Sen Sensitivity
Spe Specificity
SVM Support Vector Machine
WHO World Health OrganizationInt. J. Environ. Res. Public Health 2020, 17, 6313 15 of 18
References
1. Chao, T.F.; Lip, G.Y.; Liu, C.J.; Lin, Y.J.; Chang, S.L.; Lo, L.W.; Hu, Y.F.; Tuan, T.C.; Liao, J.N.; Chung, F.P.
Relationship of aging and incident comorbidities to stroke risk in patients with atrial fibrillation. J. Am.
Coll. Cardiol. 2018, 71, 122–132. [CrossRef]
2. Pekkarinen, S.; Ulkuniemi, P. Modularity in developing business services by platform approach. Int. J.
Logist. Manag. 2008, 84–103. [CrossRef]
3. Lei, N.; Moon, S.K. A decision support system for market segment driven product design. In Proceedings of
the DS 75-9: 19th International Conference on Engineering Design (ICED13), Design for Harmonies, Vol. 9:
Design Methods and Tools, Seoul, Korea, 19–22 August 2013; pp. 177–186.
4. Acharya, U.R.; Joseph, K.P.; Kannathal, N.; Lim, C.M.; Suri, J.S. Heart rate variability: A review. Med. Biol.
Eng. Comput. 2006, 44, 1031–1051. [CrossRef]
5. Faust, O.; Yi, L.M.; Hua, L.M. Heart rate variability analysis for different age and gender. J. Med Imaging
Health Inform. 2013, 3, 395–400. [CrossRef]
6. Faust, O.; Ciaccio, E.J.; Acharya, U.R. A Review of Atrial Fibrillation Detection Methods as a Service. Int. J.
Environ. Res. Public Health 2020, 17, 3093. [CrossRef]
7. Steinberg, J.S. Atrial fibrillation: An emerging epidemic? Heart 2004, 90, 239–240. [CrossRef] [PubMed]
8. Bajpai, A.; Savelieva, I.; Camm, A. Epidemiology and economic burden of atrial fibrillation. US Cardiol.
2007, 4, 14–17.
9. Hagiwara, Y.; Fujita, H.; Oh, S.L.; Tan, J.H.; San Tan, R.; Ciaccio, E.J.; Acharya, U.R. Computer-aided
diagnosis of atrial fibrillation based on ECG signals: A review. Inf. Sci. 2018, 467, 99–114. [CrossRef]
10. Faust, O.; Hagiwara, Y.; Hong, T.J.; Lih, O.S.; Acharya, U.R. Deep learning for healthcare applications based
on physiological signals: A review. Comput. Methods Programs Biomed. 2018, 161, 1–13. [CrossRef] [PubMed]
11. Goldberger, A.L.; Amaral, L.A.N.; Glass, L.; Hausdorff, J.M.; Ivanov, P.C.; Mark, R.G.; Mietus, J.E.;
Moody, G.B.; Peng, C.K.; Stanley, H.E. PhysioBank, PhysioToolkit, and PhysioNet: Components of a
New Research Resource for Complex Physiologic Signals. Circulation 2000, 101, e215–e220. [CrossRef]
[PubMed]
12. Faust, O.; Kareem, M.; Shenfield, A.; Ali, A.; Acharya, U.R. Validating the robustness of an internet of things
based atrial fibrillation detection system. Pattern Recognit. Lett. 2020, 133, 55–61. [CrossRef]
13. Ivanovic, M.D.; Atanasoski, V.; Shvilkin, A.; Hadzievski, L.; Maluckov, A. Deep Learning Approach for
Highly Specific Atrial Fibrillation and Flutter Detection based on RR Intervals. In Proceedings of the 2019
41st Annual International Conference of the IEEE Engineering in Medicine and Biology Society (EMBC),
Berlin, Germany, 23–27 July 2019; IEEE: Piscataway, NJ, USA, 2019; pp. 1780–1783. [CrossRef]
14. Andersen, R.S.; Peimankar, A.; Puthusserypady, S. A deep learning approach for real-time detection of atrial
fibrillation. Expert Syst. Appl. 2019, 115, 465–473. [CrossRef]
15. Faust, O.; Shenfield, A.; Kareem, M.; San, T.R.; Fujita, H.; Acharya, U.R. Automated detection of atrial
fibrillation using long short-term memory network with RR interval signals. Comput. Biol. Med. 2018,
102, 327–335. [CrossRef] [PubMed]
16. Henzel, N.; Wróbel, J.; Horoba, K. Atrial fibrillation episodes detection based on classification of heart rate
derived features. In Proceedings of the Mixed Design of Integrated Circuits and Systems, 2017 MIXDES-24th
International Conference, Bydgoszcz, Poland, 22–24 June 2017; IEEE: Piscataway, NJ, USA, 2017; pp. 571–576.
[CrossRef]
17. Cui, X.; Chang, E.; Yang, W.H.; Jiang, B.; Yang, A.; Peng, C.K. Automated detection of paroxysmal atrial
fibrillation using an information based similarity approach. Entropy 2017, 19, 677. [CrossRef]
18. Islam, M.S.; Ammour, N.; Alajlan, N.; Aboalsamh, H. Rhythm based heartbeat duration normalization for
atrial fibrillation detection. Comput. Biol. Med. 2016, 72, 160–169. [CrossRef]
19. Faust, O.; Acharya, U.R.; Ng, E.; Fujita, H. A review of ECG based diagnosis support systems for obstructive
sleep apnea. J. Mech. Med. Biol. 2016, 16, 1640004. [CrossRef]
20. Faust, O.; Razaghi, H.; Barika, R.; Ciaccio, E.J.; Acharya, U.R. A review of automated sleep stage scoring
based on physiological signals for the new millennia. Comput. Methods Programs Biomed. 2019, 176, 81–91.
[CrossRef]
21. Ohayon, M.M. Epidemiology of insomnia: What we know and what we still need to learn. Sleep Med. Rev.
2002, 6, 97–111. [CrossRef]Int. J. Environ. Res. Public Health 2020, 17, 6313 16 of 18
22. Baldwin, C.M.; Griffith, K.A.; Nieto, F.J.; O’connor, G.T.; Walsleben, J.A.; Redline, S. The association of
sleep-disordered breathing and sleep symptoms with quality of life in the Sleep Heart Health Study. Sleep
2001, 24, 96–105. [CrossRef]
23. Willemen, T.; Van Deun, D.; Verhaert, V.; Vandekerckhove, M.; Exadaktylos, V.; Verbraecken, J.; Van Huffel, S.;
Haex, B.; Vander Sloten, J. An evaluation of cardiorespiratory and movement features with respect to
sleep-stage classification. IEEE J. Biomed. Health Informatics 2013, 18, 661–669. [CrossRef]
24. Ohayon, M.M.; Smirne, S. Prevalence and consequences of insomnia disorders in the general population of
Italy. Sleep Med. 2002, 3, 115–120. [CrossRef]
25. Wickwire, E.M.; Shaya, F.T.; Scharf, S.M. Health economics of insomnia treatments: The return on investment
for a good night’s sleep. Sleep Med. Rev. 2016, 30, 72–82. [CrossRef] [PubMed]
26. Ozminkowski, R.J.; Wang, S.; Walsh, J.K. The direct and indirect costs of untreated insomnia in adults in the
United States. Sleep 2007, 30, 263–273. [CrossRef] [PubMed]
27. Viswabhargav, C.S.; Tripathy, R.; Acharya, U.R. Automated detection of sleep apnea using sparse residual
entropy features with various dictionaries extracted from heart rate and EDR signals. Comput. Biol. Med.
2019, 108, 20–30. [CrossRef] [PubMed]
28. Acharya, U.R.; Chua, E.C.P.; Faust, O.; Lim, T.C.; Lim, L.F.B. Automated detection of sleep apnea from
electrocardiogram signals using nonlinear parameters. Physiol. Meas. 2011, 32, 287. [CrossRef]
29. Tripathy, R.; Gajbhiye, P.; Acharya, U.R. Automated sleep apnea detection from cardio-pulmonary signal
using bivariate fast and adaptive EMD coupled with cross time-frequency analysis. Comput. Biol. Med. 2020,
103769. [CrossRef]
30. Trinder, J.; Kleiman, J.; Carrington, M.; Smith, S.; Breen, S.; Tan, N.; Kim, Y. Autonomic activity during
human sleep as a function of time and sleep stage. J. Sleep Res. 2001, 10, 253–264. [CrossRef]
31. Penzel, T.; Kantelhardt, J.W.; Grote, L.; Peter, J.H.; Bunde, A. Comparison of detrended fluctuation analysis
and spectral analysis for heart rate variability in sleep and sleep apnea. IEEE Trans. Biomed. Eng. 2003,
50, 1143–1151. [CrossRef]
32. Yajima, Y.; Koyama, T.; Kobayashi, M.; Ichikawa, T.; Hoshino, S.; Abe, H. Continuous Positive Airway
Pressure Therapy Improves Heterogeneity of RR intervals in a Patient with Obstructive Sleep Apnea
Syndrome. Intern. Med. 2019, 58, 1279–1282. [CrossRef]
33. Tripathy, R.; Acharya, U.R. Use of features from RR-time series and EEG signals for automated classification
of sleep stages in deep neural network framework. Biocybern. Biomed. Eng. 2018, 38, 890–902. [CrossRef]
34. Yoon, H.; Hwang, S.H.; Choi, J.W.; Lee, Y.J.; Jeong, D.U.; Park, K.S. REM sleep estimation based on autonomic
dynamics using R–R intervals. Physiol. Meas. 2017, 38, 631. [CrossRef] [PubMed]
35. Liu, S.; Teng, J.; Qi, X.; Wei, S.; Liu, C. Comparison between heart rate variability and pulse rate variability
during different sleep stages for sleep apnea patients. Technol. Health Care 2017, 25, 435–445. [CrossRef]
[PubMed]
36. Roth, G.A.; Johnson, C.; Abajobir, A.; Abd-Allah, F.; Abera, S.F.; Abyu, G.; Ahmed, M.; Aksut, B.; Alam, T.;
Alam, K.; et al. Global, regional, and national burden of cardiovascular diseases for 10 causes, 1990 to 2015.
J. Am. Coll. Cardiol. 2017, 70, 1–25. [CrossRef] [PubMed]
37. Wilkins, E.; Wilson, L.; Wickramasinghe, K.; Bhatnagar, P.; Leal, J.; Luengo-Fernandez, R.; Burns, R.; Rayner,
M.; Townsend, N. European Cardiovascular Disease Statistics 2017; European Heart Network 1000: Bruxelles,
Belgium, 2017.
38. Sood, S.; Kumar, M.; Pachori, R.B.; Acharya, U.R. Application of empirical mode decomposition- based
features for analysis of normal and cad heart rate signals. J. Mech. Med. Biol. 2016, 16, 1640002. [CrossRef]
39. Mikael, L.d.R.; Paiva, A.M.G.d.; Gomes, M.M.; Sousa, A.L.L.; Jardim, P.C.B.V.; Vitorino, P.V.d.O.;
Euzébio, M.B.; Sousa, W.d.M.; Barroso, W.K.S. Vascular aging and arterial stiffness. Arq. Bras. Cardiol. 2017,
109, 253–258. [CrossRef]
40. Mozaffarian, D.; Wilson, P.W.; Kannel, W.B. Beyond established and novel risk factors: Lifestyle risk factors
for cardiovascular disease. Circulation 2008, 117, 3031–3038. [CrossRef]
41. Steptoe, A. Psychological Factors in Cardiovascular Disorders; Academic Press: London, UK, 1981.
42. Patidar, S.; Pachori, R.B.; Acharya, U.R. Automated diagnosis of coronary artery disease using tunable-Q
wavelet transform applied on heart rate signals. Knowl. Based Syst. 2015, 82, 1–10. [CrossRef]You can also read