Software tools for conducting bibliometric analysis in science: An up- to-date review
←
→
Page content transcription
If your browser does not render page correctly, please read the page content below
Software tools for conducting
   bibliometric analysis in science: An up-
   to-date review
   José A. Moral-Muñoz; Enrique Herrera-Viedma; Antonio Santisteban-Espejo;
   Manuel J. Cobo
   How to cite this article:
     Moral-Muñoz, José A.; Herrera-Viedma, Enrique; Santisteban-Espejo, Antonio; Cobo, Manuel J. (2020). “Sof-
     tware tools for conducting bibliometric analysis in science: An up-to-date review”. El profesional de la informa-
     ción, v. 29, n. 1, e290103.
     https://doi.org/10.3145/epi.2020.ene.03
                                                                                            Manuscript received on December, 3th 2019
                                                                                                    Accepted on December, 15th 2019

                      José A. Moral-Muñoz                                                 Enrique Herrera-Viedma
                      https://orcid.org/0000-0002-6465-982X                               https://orcid.org/0000-0002-7922-4984
                      University of Cadiz                                                 University of Granada
                      Institute of Research and Innovation in                             E.T.S. de Ingeniería Informática y de
                      Biomedical Sciences of the Province of                              Telecomunicación
                      Cadiz (INiBICA)                                                     Periodista Daniel Saucedo Aranda, s/n.
                      Cadiz, Spain                                                        18014 Granada, Spain
                      joseantonio.moral@uca.es                                            viedma@decsai.ugr.es

                      Antonio Santisteban-Espejo                                          Manuel J. Cobo *
                      https://orcid.org/0000-0002-0827-4263                               https://orcid.org/0000-0001-6575-803X
                      Puerta del Mar Hospital                                             University of Cadiz
                      Division of Hematology and                                          Department of Computer Science and
                      Hemotherapy                                                         Engineering
                      Cadiz, Spain                                                        Cadiz, Spain
                      antonio.santisteban.sspa@                                           manueljesus.cobo@uca.es
                             juntadeandalucia.es

Abstract
Bibliometrics has become an essential tool for assessing and analyzing the output of scientists, cooperation between
universities, the effect of state-owned science funding on national research and development performance and educa-
tional efficiency, among other applications. Therefore, professionals and scientists need a range of theoretical and prac-
tical tools to measure experimental data. This review aims to provide an up-to-date review of the various tools available
for conducting bibliometric and scientometric analyses, including the sources of data acquisition, performance analysis
and visualization tools. The included tools were divided into three categories: general bibliometric and performance
analysis, science mapping analysis, and libraries; a description of all of them is provided. A comparative analysis of the
database sources support, pre-processing capabilities, analysis and visualization options were also provided in order to
facilitate its understanding. Although there are numerous bibliometric databases to obtain data for bibliometric and
scientometric analysis, they have been developed for a different purpose. The number of exportable records is between
500 and 50,000 and the coverage of the different science fields is unequal in each database. Concerning the analyzed
tools, Bibliometrix contains the more extensive set of techniques and suitable for practitioners through Biblioshiny.
VOSviewer has a fantastic visualization and is capable of loading and exporting information from many sources. SciMAT
is the tool with a powerful pre-processing and export capability. In views of the variability of features, the users need to
decide the desired analysis output and chose the option that better fits into their aims.
Keywords
Bibliometrics; Scientometrics; Science mapping analysis; Tools; Bibliographic databases; Performance analysis; Softwa-
re; Libraries; R-package; Python-package; Software review.

 Financing
 This article has been possible thanks to Feder funds (TIN2016-75850-R).

e290103                                                    El profesional de la información, 2020, v. 29, n. 1. eISSN: 1699-2407   1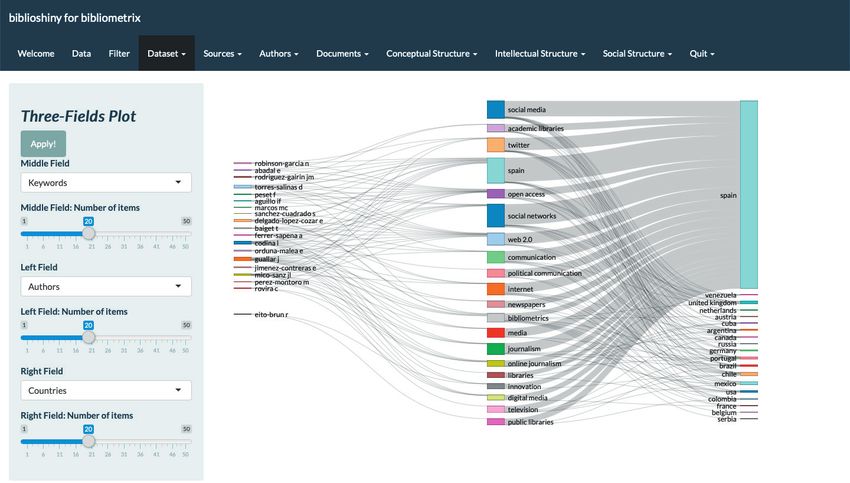
José A. Moral-Muñoz; Enrique Herrera-Viedma; Antonio Santisteban-Espejo; Manuel J. Cobo

1. Introduction
Science can be defined as a social activity oriented to characterize a field of knowledge through observation and measu-
rement, being performed by research communities and influenced by societal conditions (communication media, Gover-
nment policies and legal system). In accordance with Asi-
mov (2010), modern science emerged when nature was                    Researchers require a body of theoreti-
considered under the watchful eye of measurement me-                  cal and practical tools to quantify expe-
thods. Thus, professional and researchers require a body              rimental data
of theoretical and practical tools to quantify experimental
data. In this sense, Van-Raan (2004a) also discussed this topic when recorded the sentence attributed to Onnes: “Measu-
ring is knowing”. To measure is, then, the basis for the building of science. However, how science itself can be measured?
This view of the matter presides the methodical foundations of bibliometrics, that is, the quantitative study of produc-
tion, growth, maturation and consumption of scientific publications. In this sense, the term “bibliometrics” was origina-
lly coined by Pritchard (1969), replacing so the classical “statistical bibliographies”. Since then, bibliometrics has quickly
evolved and technically perfected alongside with the exponential growth of science. Presently, the massive amount of
data published on academic journals, books, patents, proceedings, etc. required to be stored and organized into bi-
bliographic databases. The information contained on these platforms (i.e. citations, keywords, titles, journals, authors,
institutions, etc.) provides a valuable sample to perform science evaluation research using bibliometric techniques (Gu-
tiérrez-Salcedo; Martínez; Moral-Muñoz; Herrera-Viedma; Cobo, 2018).
As a result, bibliometrics has become in contemporary context an essential tool for assessing and analyzing researcher’s
production (Ellegaard; Wallin, 2015), collaboration between institutions (Skute; Zalewska-Kurek; Hatak; de Weerd-Ne-
derhof, 2019), impact of state scientific investment in national R&D productivity (Fabregat-Aibar; Barberà-Mariné;
Terceño; Pié, 2019) and academic quality (Van-Raan, 1999), among other possibilities (Glänzel, 2012). Concerning to
bibliometrics, it can be divided in two major fields of study or subject areas: performance analysis and science mapping
analysis (SMA) (Noyons; Moed; Van-Raan, 1999; Cobo; López-Herrera; Herrera-Viedma; Herrera, 2011a). On the one
hand, performance analysis aims to evaluate different scientific actors (researchers, institutions, countries, etc.) through
bibliographic indexes based on publications and citations data (Narin; Hamilton, 1996). On the other hand, SMA lies on
the topological and temporal representation of the cognitive and social structure of a particular research field (Small,
1999; Cobo; López-Herrera; Herrera-Viedma; Herrera, 2011).
Concerning the current published documents, there are
several reviews about the tools available to perform bi-
                                                                     The information contained on biblio-
bliometric analyses. Moral-Muñoz, López-Herrera, He-                 graphical platforms provides samples to
rrera-Viedma & Cobo (2019) reviewed the freely availa-               perform science evaluation research
ble SMA software and allowing to perform the complete
analysis, without using external software to preprocess or visualize the analysis. Pan, Yan, Cui & Hua, (2018) evaluated
how the three SMA software (CiteSpace, HistCite and VOSviewer) is used, cited and diffused. Gutiérrez-Salcedo, Martí-
nez, Moral-Muñoz, Herrera-Viedma & Cobo, 2018) introduced the essential techniques and software tools to analyze
the impact of a research field and its scientific structure. Chen (2006; 2017; 2019) introduced CiteSpace, VOSviewer and
CitNetExplorer to perform an applied analysis using SMA. Pradhan (2016) described some of the commonly used softwa-
re tools to perform SMA analysis. Sangam & Mogali (2012) highlight the different capabilities of mapping and visualiza-
tion software tools. Finally, Cobo,López-Herrera, Herrera-Viedma & Herrera (2011b) performed an in-depth analysis of
the advantages, drawbacks and most important differenced among the SMA software tools. Nevertheless, those reviews
are conditioned for temporal factors . These tools have been improved, and new features have been incorporated; fur-
thermore, other described tools are no longer maintained, or there are powerful new options.
In this sense, the present review aims to offer an up-to-date review of the different tools available to perform bibliometric and
scientometric studies; including the data acquisition sources, performance analysis, science mapping and visualization tools.
For this purpose, the structure of the study is divided into three sections and organized as follows: Section 2) describes the
method and selection criteria. Section 3) shows the different databases from which to get the information. Section 4) presents
general bibliometric and performance analysis tools. Section 5) analyzes the main SMA software tools. Section 6) describes
and analyzes the available libraries. Finally, in Section 7) some discussion and concluding remarks are highlighted.

2. Methods – Selection criteria
In order to provide an adequate state-of-art of the available tools to perform bibliometric and scientometric analyses,
some inclusion criteria have been previously established:
- Database that allows downloading bibliographic data.
- General bibliometric software, or based on indexes and performance analysis.
- SMA tools.
- R and Python libraries.

e290103                                                    El profesional de la información, 2020, v. 29, n. 1. eISSN: 1699-2407   2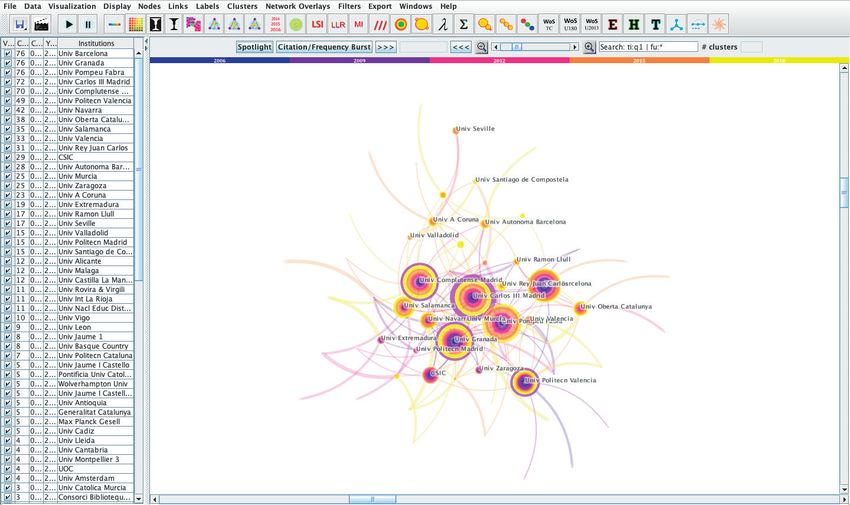
Software tools for conducting bibliometric analysis in science: An up-to-date review

All of these software and tools have to be in a final form                      Bibliometrics has become an essential
and with an evident up-to-date status. Furthermore, we
                                                                                tool for assessing and analyzing the pro-
only include those that are focused explicitly on the bi-
bliometrics, not general tools that could be employed in                        ductivity and impact of academics and
some of the processing stages.                                                  technology
3. Databases
In order to perform a bibliometric analysis, the first stage is to decide the best data source that fits with the scientific co-
verage of our research area. It is important to highlight that the number of bibliographic databases is high (e.g. PubMed,
EMbase, SpringerLink, etc.), but not all of them provide information that allows easily performing bibliometric analyses.
Thus, the present document shows the main bibliographic databases used in bibliometrics analysis: Web of Science
(WoS), Scopus, Google Scholar (GS), Microsoft Academic (MA) and Dimensions. In what follows, a short description of
each database is shown, and also, the main characteristics focusing on the bibliometric analyses are shown in Table 1.
Table 1. Characteristics of the databases

 Database           Subscription                 Data download         Records limit                 API         Formats
                                                                       500 records with a total of
 WoS                Yes                          Yes                                                 Yes         Plain text and tab-delimited
                                                                       100,000 per query
 Scopus             Yes                          Yes                   First 2,000 records           Yes         RIS and CSV
 GS                 Free                         No                    n/a                           No          n/a
 MA                 Free                         Using the API         n/a                           Yes         n/a
 Dimensions         Free or under subscription   Yes                   50,000                        Yes         CSV or Excel

- Web of Science: It is a website that provides access to multiple databases and citation data for 256 disciplines (science,
  social science, arts and humanities). The access is under subscription. The Institute for Scientific Information (ISI) was
  the original producer, after that, its intellectual property passed to Thomson Reuters, and now the maintenance is in
  charge of Clarivate Analytics. It covers different formats, such as full-text articles, reviews, editorials, chronologies,
  abstracts, proceedings (journals and book-based) and technical papers. The total number of records is beyond 90
  million. Its temporal coverage is from 1900 to the present.
- Scopus: It is a website that offers access to databases and citation data in life sciences, social sciences, physical sciences
  and health sciences. Elsevier provides access to Scopus, and a subscription is needed. It covers three types of sources:
  book series, journals and trade journals. Furthermore, the searches performed in Scopus also incorporate searches in
  patent databases. The number of records is around 69 million. The temporal coverage is from 2004 to present.
- Google Scholar: It is a freely available website, laun-
  ched in 2004, that indexes the full text or metadata of              The first stage is to decide the best data
  the scientific literature from the most peer-reviewed                source that fits with our research area
  online academic journals, books, conference papers,
  theses, preprints, abstracts, technical reports, court opinions and patents. Google does not provide the number of
  records, but (Gusenbauer, 2019) established an estimation of 389 million documents in 2018. It was launched in 2004.
  GS has been criticized for not ban the predatory journals (Ibba; Pani; Stockton; Barabino; Marchesi; Tigano, 2017;
  Chapman; Ellinger, 2019).
- Microsoft Academic: It was previously called as Microsoft Academic Search, but it was relaunched as a new service in
  2016, as MA. The supply and maintenance are in charge of Microsoft. It is offered as a free public web search engine.
  According to the information available on the webpage, it currently indexes over 230 million publications, 88 million
  are journal articles. The first studies suggest that it is a competitor of the main databases, GS, WoS and Scopus (Har-
  zing; Alakangas, 2017; Hug; Ochsner; Brändle, 2017; Haunschild; Hug; Brändle; Bornmann, 2018).
- Dimensions: It is a new database that, according to its available information, its goal is to provide “a more open and
  comprehensive data infrastructure that empowered users to explore connections between a wide range of research
  data”. It is supported by Digital Science & Research Solutions Inc. and has been considered as an alternative to WoS
  and Scopus (Orduña-Malea; Delgado-López-Cózar, 2018; Thelwall, 2018). Different products are available, with a free
  version option. It offers access to the traditional document types (articles, conference papers, books, etc.), but also
  includes links to grants, patents, clinical trials, datasets and policy papers. The number of records that contain Dimen-
  sions is higher than 102 million publications in 2019. It was launched in 2018. They follow the Open Access movement,
  arguing that the producers of the data should not develop the metrics.

4. Software tools for conducting performance bibliometric analysis
Once the data is obtained, the analyst could develop a performance analysis process. In this process, information about
the production and impact of a specific research area is obtained. Several indicators could be extracted from the publi-

e290103                                                            El profesional de la información, 2020, v. 29, n. 1. eISSN: 1699-2407    3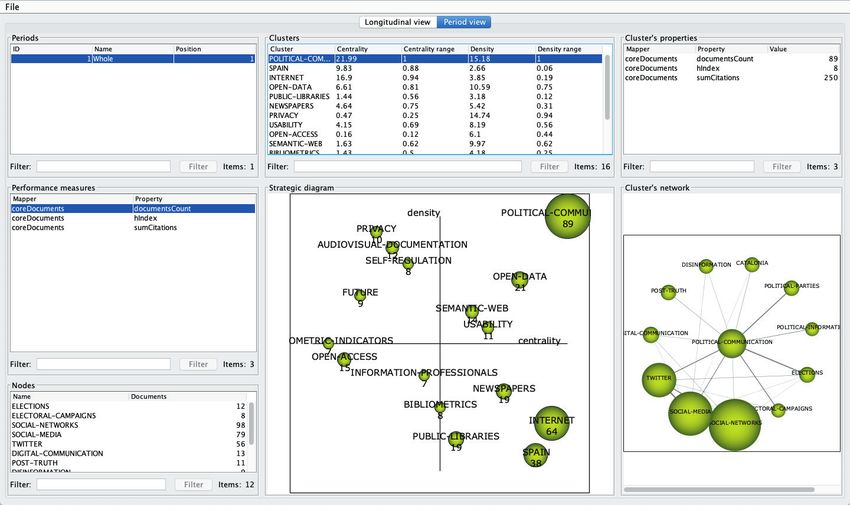
José A. Moral-Muñoz; Enrique Herrera-Viedma; Antonio Santisteban-Espejo; Manuel J. Cobo

cation core, such as number of publications, number of citations, highly cited publications, number of non-cited publica-
tions, research field classification and normalized citations. In that way, the software tools could offer the indicators that
the developer considers adequate to the scientific evaluation.
Recently, alternative metrics, also known as Altmetrics, have been developed to evaluate scientific impact at social me-
dia (Bornmann; Haunschild, 2018). This approach describes a web-based metric for the impact of publications and other
scholarly material by using data from social media platforms (i.e. Twitter, Facebook, Google+, blogs, Mendeley, CiteU-
Like, Reddit and Wikipedia, among others) (Veeranjaneyulu, 2017). The appearance of this type of measures is related
to the social media revolution; there are now different groups of the population, non-author professionals, which read
research articles and now also share them, and new types of academic outputs have appeared (Bornmann; Williams,
2013). Nonetheless, this kind of indicators is still under development and are not integrated into the existing software
tools. Probably, these new metrics will be included in future software tools.
Thus, under this category, the most relevant software tools that still available have been included in this review. We should
mention that in the past there were other important software tools focused on bibliometric performance analysis, but
currently are unmaintained, such for example, the software HisCite which was used to visualize the results of the searches
performed in the WoS, allowing to analyze and organize the results to obtain the topic’s structure, history and relationships.
Nevertheless, it was not included in the present reviews since Clarivate informed about no longer maintained.
In what follows, the description and main characteristics of these software tools are shown. Also, Table 1 shows the main
details. In this software tool category, we will focus on the data sources used, the kind of indicators and analysis available.
Table 2. Characteristics of the performance software

                      Analyzed
     Software                        Year               Developer            Operative System          Data source          User interface
                       version
                                               Hochschule für Telekommu-                          WoS, Scopus and
 CRExplorer          1.9           2018                                      Java                                         Desktop
                                               nikation Leipzig (HfTL)                            Crossref
                                               Melbourne-based Tarma                              WoS, Scopus, GS,
 Publish or Perish   7             2019                                      Win, Mac and Linux                           Desktop
                                               Research Software Pty Ltd.                         Crossref, MA
 ScientoPyUI         1.4.0         2019        University of Cauca           Python               WoS and Scopus          Web

The descriptions of the main performance analysis tools are here below:
- CRExplorer: It is indicated to the disambiguation and analysis of the cited references of a publication collection down-
  loaded from WoS database, Scopus or Crossref (Thor; Marx; Leydesdorff; Bornmann, 2016). It was developed for
  applying the Reference Publication Year Spectroscopy (RPYS), which allows identifying the publications with most sig-

Figure 1. Analysis of the EPI journal with CRExplorer

e290103                                                              El profesional de la información, 2020, v. 29, n. 1. eISSN: 1699-2407   4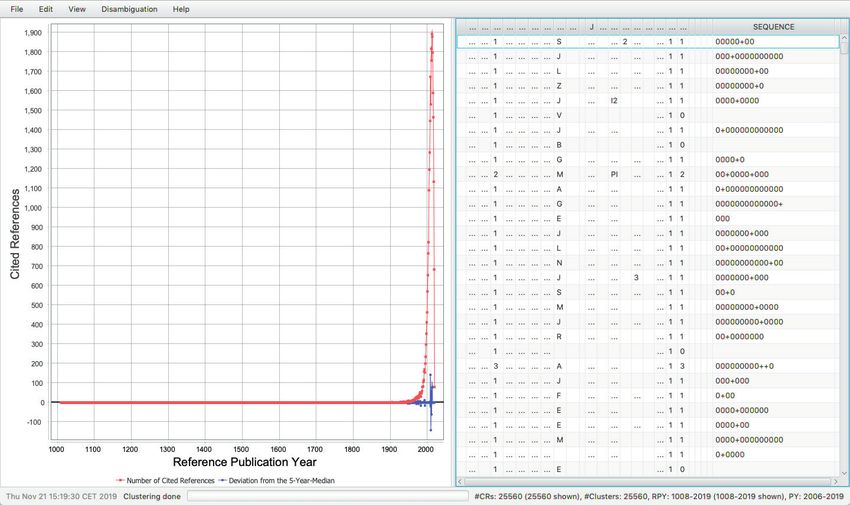
Software tools for conducting bibliometric analysis in science: An up-to-date review
nificant influence in a certain research area, topic, or in general, a set of documents. It is based on
“the analysis of the frequency with which references are cited in the publications of a specific research field in
terms of the publications years of these cited references” (Marx; Bornmann; Barth; Leydesdorff, 2014).
In short, CRExplorer shows the spectrogram of a topic,
cleans the cited references (disambiguation) and uses
Bibliometric libraries allow to develop a
a smoothing algorithm to correct the noise. Due to its specific analysis and workflow, but pro-
development using Java programming, it runs on most gramming skills are needed
hardware and operating system platforms. Further-
more, CRExplorer offers two options to run an analysis: Java Web Start and download a runnable JAR file. An interes-
ting feature is the analysis of sequences over time, where the citations are considered on average, above average and
below average for each year; it allows to identify sleeping beauty (Van-Raan, 2004b), constant performer, hot paper
and life cycle publications. Data output could be exported to WoS, Scopus or CSV (graph, cited references and/or citing
publications).
- Publish or Perish: It was primarily developed to generate the h-index from GS search results and was Anne-Wil Harzing
who initiated and guided the development of this software (Harzing, 2008; Harzing; Van-der-Wal, 2008). An interes-
ting feature is that we can perform searches directly to GS, WoS, Scopus, Crossref and MA. Furthermore, it allows to
import external data instead of performing the search. It provides a performance analysis of the core of documents
obtained from the indicated source. In that sense, it interesting to highlight the possibility of obtaining the h-index
average annual increase, age-weighted citation rate and authors per paper indicators. Furthermore, the output can be
exported to BibText, CSV, EndNote, ISI Export, JSON Export and RefMan/RIS; it is interesting to perform further analy-
ses in other tools, although it is limited to 1000 records.
Figure 2. Analysis of the EPI journal with Publish or Perish
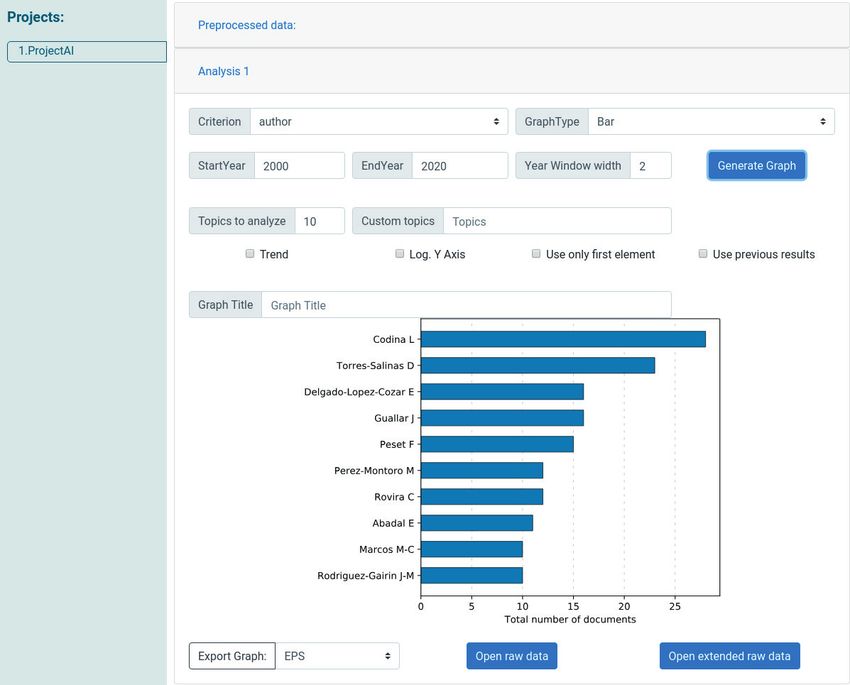
- ScientoPyUI: This is not a complete software, and it is needed to run it under Python. It is the graphical user interface
(GUI) for the ScientoPy (described in Section 6) (Ruiz-Rosero; Ramírez-González; Viveros-Delgado, 2019). Although
the characteristics of ScientoPy will be described below, some comments will be addressed. Thus, we can perform a
preprocessing stage, consisting on document type filtering, author’s name normalization, duplicate removal, times
cited and document’s country and institutions. Concerning the analysis options, it allows performing top and specific
topics evaluation and wildcard search. Furthermore,
ScientoPy adds some performance indicators to the There are substantial differences among
topics analyzed, such as average growth rate, average the exporting options of the databases
document per years and percentage of documents in
the last years. Although this tool does not provide sophisticated maps, the visualization options are: timeline, horizon-
tal bars, horizontal bars trends, evolution and word cloud. Graphs can be exported to EPS, SVG and PNG.
e290103 El profesional de la información, 2020, v. 29, n. 1. eISSN: 1699-2407 5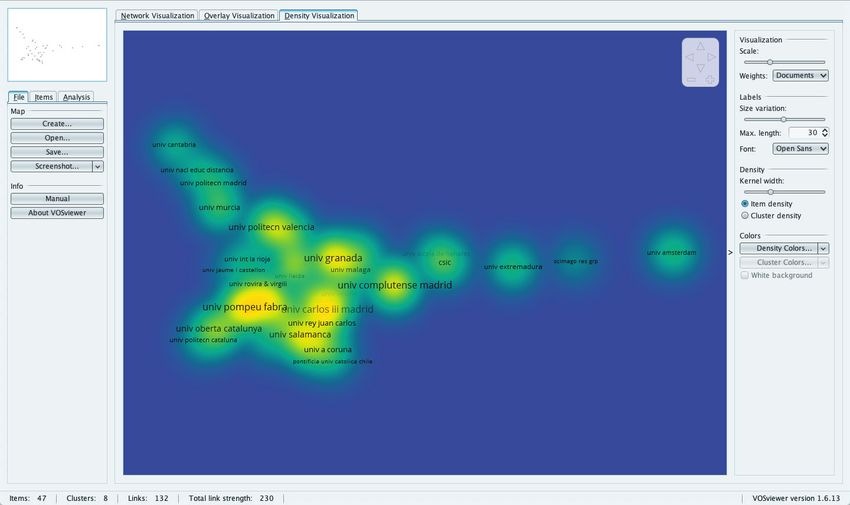
José A. Moral-Muñoz; Enrique Herrera-Viedma; Antonio Santisteban-Espejo; Manuel J. Cobo

Figure 3. Analysis of the EPI journal with ScientoPyUI

5. Software tools for conducting science mapping bibliometric analysis
The bibliometrics analysis could be enhanced with scientific maps representing the relationship among the different
actors (authors, institutions, countries, etc.). A map of science is, therefore, a spatial representation of how disciplines,
fields, specialties and individual papers or authors are related to one another as shown by their physical proximity and
relative locations (Small, 1999). In the last years, several reviews have analyzed the most relevant software (Cobo;
López-Herrera; Herrera-Viedma; Herrera, 2011; Sangam; Mogali, 2012; Pradhan, 2016; Chen, 2017), nonetheless, they
change over time, and some new appeared. Therefore, some updated characteristics of the main SMA software are
shown in Table 3:
Table 3. Characteristics of the SMA tools

        Tools           Analyzed version           Year                     Developer                  Operative System    User interface
 Bibexcel                      2017                2017     University of Umeå (Sweden)                Win                Desktop
 Biblioshiny                                       2019     University of Naples Federico II (Italy)   Runs in R          Web
 BiblioMaps                     3.2                2018     University of Lyon (France)                Runs in Python     Web
 CiteSpace                    5.5.R2               2019     Drexel University (USA)                    Win                Desktop
 CitNetExplorer                1.0.0               2014     Leiden University (The Netherlands)        Win, OSX, Linux    Desktop
 SciMAT                       1.1.04               2016     University of Granada (Spain)              Win, OSX, Linux    Desktop
                                                            Cyberinfrastructure for Network Science
 Sci2 Tool                      1.3                2018                                                Win, OSX, Linux    Desktop
                                                            Center (USA)
 VOSviewer                    1.6.13               2019     Leiden University (The Netherlands)        Win, OSX, Linux    Desktop

In what follows, a summarized description of the main characteristics of each software tool is provided. Moreover, for
each one, a small bibliometric analysis has been developed using a set of articles from EPI journal, showing an example
of screenshot.
- Bibexcel: It is intended to create data files that can be imported to Excel, or any program that takes tabbed data re-
  cords for further handling (Persson; Danell; Wiborg Schneider, 2009). It was developed by Olle Persson at University
  of Umeä (Sweden). This software incorporates various tools, some of them visible in the window and others hole up
  behind the menus. The main characteristic of this software is the flexibility, but for this reason, it could be initially
  perceived as challenging to use by new users. BibExcel can read information retrieved from various bibliographic
  sources, for example, WoS, Scopus, and the ProCite export format. Nevertheless, if the user learns the typical Bibexcel
  file structure, different types of document can be formatted in order to be analyzed. Different bibliometric networks

e290103                                                           El profesional de la información, 2020, v. 29, n. 1. eISSN: 1699-2407     6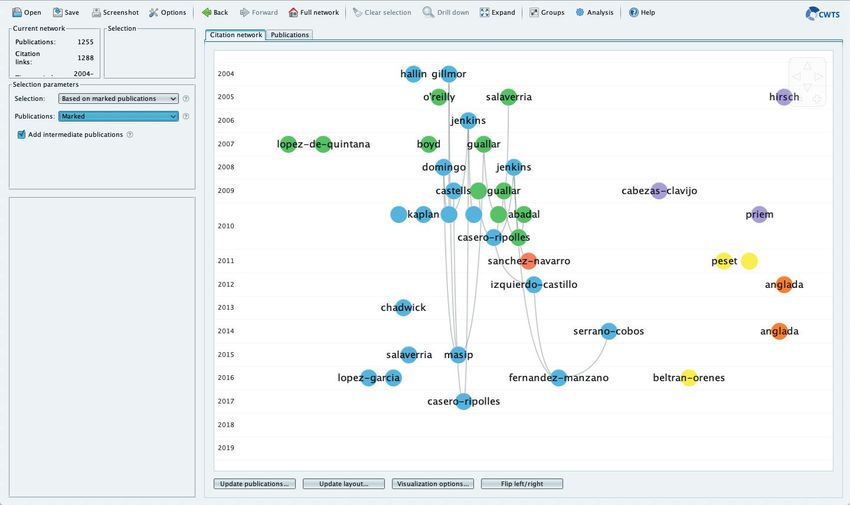
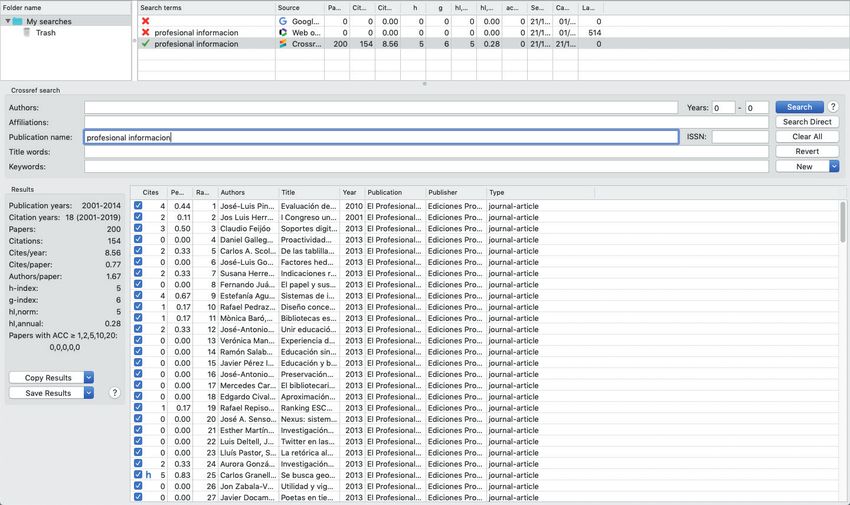
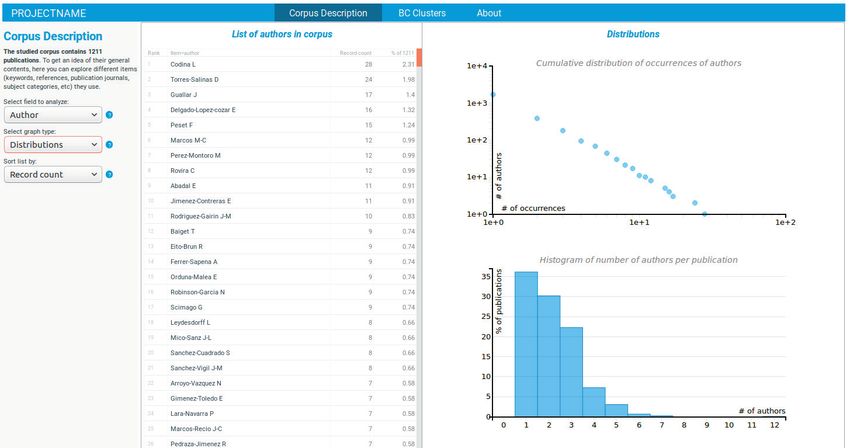
Software tools for conducting bibliometric analysis in science: An up-to-date review

Figure 4. Analysis of the EPI journal with Bibexcel

  can be obtained using the parameters offered by this tool. The main networks are: co-citation, bibliographic coupling,
  co-author, and co-word. Moreover, it is possible to create different co-occurrence matrices taking any document’s
  field, or combining some of them. Once the data is normalized, the user can apply a clustering algorithm or prepare
  a matrix to perform a Multidimensional Scaling (MDS), using an external tool. On the other hand, it allows submitting
  the textual data to different preprocessing tasks, such as an English word stemmer, documents deduplication and text
  transformation (keep author’s first initial, convert comma-delimited addresses, etc.). Besides, Bibexcel empowers the
  deletion of low recurrence items and keeps just the strongest links. Although it has not visualization option, it incorpo-
  rates different export options that allow visualizing the data using external software like Pajek (Batagelj; Mrvar, 2004),
  Ucinet (Borgatti; Everett; Freeman, 2002), SPSS or VOSviewer (Van-Eck; Waltman, 2010). The type of visualization
  selection will depend on the nature of the unit of analysis.
- Biblioshiny: Paraphrasing the own tool slogan, Biblioshiny is “bibliometrix for no coders”. It is powered by Bibliometrix
  (Aria; Cuccurullo, 2017) and is its web-based graphical interface. Although Bibliometrix will be described below, it
  was programmed in the R language in order to facilitate the interconnection with other R packages. It was developed
  by Massimo Aria and Corrado Cuccurullo from the University of Naples and University of Campania’s Luigi Vanvitelli
  (Italy). It mainly works with WoS, Scopus and Dimensions data. The interface is intuitive and well organized, and the

Figure 5. Analysis of the EPI journal with Biblioshiny

e290103                                                              El profesional de la información, 2020, v. 29, n. 1. eISSN: 1699-2407   7
José A. Moral-Muñoz; Enrique Herrera-Viedma; Antonio Santisteban-Espejo; Manuel J. Cobo

Figure 6. Analysis of the EPI journal with BiblioMaps

  developers have divided the main menu according to the SMA workflow. This menu incorporates analytics and graphs
  for three-level metrics (source, author and document) and three structures of knowledge (conceptual, intellectual and
  social). The analysis options are diverse and are subdivided into 7 categories, divided in the analytics and graphs stated
  before: 1) Overview, 2) Sources, 3) Authors, 4) Documents, 5) Conceptual structures, 6) Intellectual structure, and 7)
  Social structure. The graphs and performance analyses generated can be exported to several kinds of file formats;
  maps can be exported to Pajek and html, and tables can be copied to the clipboard or saved as Excel, pdf or printed.
- BiblioMaps: BiblioTools is a set of scripts to perform SMA based on bibliographic data (Grauwin; Jensen, 2011). Al-
  though these scripts run under Python, in an update in 2016-2017, the author, Sébastian Grauwin developed the web
  interface so-called BiblioMaps. This software is designed to not require knowledge about Python, but BiblioMaps
  makes this issue more manageable. Furthermore, the user can change the code to get different outputs. It can work
  with WoS and Scopus data. This set of scripts perform
  the following tasks: i) Data acquisition, ii) Data prepro-        Almost all software tools and libraries
  cessing, applying to parse and filtering to the raw data,         can import data downloaded from WoS
  iii) Data analysis, obtaining co-occurrence networks,
  bibliographic coupling and clusters, iv) Data visuali-
                                                                    and Scopus
  zation, the output can be visualized in BiblioMaps or
  exported to other software, and v) Data report, the analysis obtained can be exported to LaTeX format. BiblioMaps
  only offer the network as a visualization option, to obtain different maps external software is needed. Although the
  user can perform the analysis controlling each stage of the process, this tool offers the “all_in_one” script, allowing to
  perform all the analyses at once.
- CiteSpace: It allows the analysis and visualization of trends and patterns in a research area (Chen, 2006; Chen, 2019).
  The main goal of this tool is to facilitate the analysis of emerging trends in a knowledge domain. It was developed at
  Drexel University (USA). This tool offers several options to understand and interpret network and historical patterns,
  such as the growth of a topic area, the main citations in the knowledge base, the automatic labelling of the different
  clusters using terms from citing articles, geospatial collaboration network, and international collaboration. CiteSpace
  is able to work with different bibliographic databases, such as WoS, Scopus, and Chinese Social Science Citation Index
  (Cssci). Furthermore, it supports citation-based studies using open-access sources, such as Dimensions and Crossref.
  Other no citation-related platforms can be analyzed with a small set of visual analytics functions, such as PubMed,
  China National Knowledge Infrastructure (CNKI) and ProQuest Dissertations and Theses. Some other interesting fea-
  tures are incorporated, such as the direct download from Crossref. The CiteSpace workflow is briefly described in the
  following phases: i) Knowledge domain detection, ii) Data collection, iii) Extract research front terms, iv) Time slicing,
  v) Threshold selection, vi) Pruning and merging, vii) Visual inspection, and viii) Pivotal points verification. CiteSpace
  offers several possibilities to visualize and perform analysis from the built networks. The user obtains a visualization
  where the pivotal points are shown about their betweenness centrality. They are highlighted in the software window

e290103                                                          El profesional de la información, 2020, v. 29, n. 1. eISSN: 1699-2407   8
Software tools for conducting bibliometric analysis in science: An up-to-date review

Figure 7. Analysis of the EPI journal with CiteSpace

  with a purple ring surrounded by a tree ring. Finally, it is interesting to highlight the geographical visualization option.
  Authors’ geographic locations can be mapped as a geospatial map in KML. To obtain this representation, the Google
  Earth interface can be used. Then, it is possible to explore the authors’ locations and links to their collaborators, and
  also redirect to the original articles directly within Google Earth.
- CitNetExplorer: It is a software tool for visualizing and analyzing citation networks, based on the algorithmic historio-
  graphy designed by Garfield (Garfield; Pudovkin; Istomin, 2003). In the networks obtained by CitNetExplorer (Van-Eck;
  Waltman, 2014), each node represents a publication. Each edge represents a citation relation between two publications.
  It was developed by the Centre for Science and Technology Studies (CWTS) at Leiden University (The Netherlands). The

Figure 8. Analysis of the EPI journal with CitNetExplorer

e290103                                                             El profesional de la información, 2020, v. 29, n. 1. eISSN: 1699-2407   9
José A. Moral-Muñoz; Enrique Herrera-Viedma; Antonio Santisteban-Espejo; Manuel J. Cobo

  information to construct citation networks is collected             Bibliometrix and its Shiny platform con-
  uniquely from WoS data. Nevertheless, it is not restric-
                                                                      tain the more extensive set of techni-
  ted to this database; Scopus data could be analyzed
  equally. Once the citation network is formed, it can be             ques implemented
  exported into Pajek file format (Batagelj; Mrvar, 2004).
  CitNetExplorer uses two different approaches. One approach consists of providing both data from publications and data
  from citations relations among publications. The other approach is based on adding the data directly downloaded from
  WoS. It presents three remarkable functionalities: the capability of select publications, drill-down and expand functiona-
  lities and different algorithms to generate the network. Concerning the analysis options offered by CitNetExplorer, four
  different options are provided: extract connected components, cluster publications, identify core publications and find
  the shortest or the longest path from a publication to others. Furthermore, not only the direct citation relations are visi-
  ble, the visualization can be set to show higher-order indirect citation relations. An additional feature is the possibility of
  launch CitNetExplorer directly from the web page.
- SciMAT: It is an open-source (GPLv3) SMA software tool designed to assist all the steps in SMA workflow, incorporating
  all the necessary elements (methods, algorithms and measures) to obtain the different analyses and visualizations
  (Cobo; López-Herrera; Herrera-Viedma; Herrera, 2012). SciMAT was developed by the Secaba Lab at University of
  Granada (Spain), and it is now updated and maintained by the IntellSOK group at University of Cadiz (Spain). It incor-
  porates all modules to perform all the steps of the SMA workflow. It supports the analyst to carry out all the different
  steps, from the data loading to the visualization and interpretation of the output. The science maps obtained are
  enriched with bibliometric measures based on citations, such as the sum, maximum, minimum, and average citations.
  Moreover, it uses advanced bibliometric indexes such as the h-index (Hirsch, 2005; Alonso; Cabrerizo; Herrera-Vied-
  ma; Herrera, 2009), G-index (Egghe, 2006), HG-index (Alonso; Cabrerizo; Herrera-Viedma; Herrera, 2010) and q2-in-
  dex (Cabrerizo; Alonso; Herrera-Viedma; Herrera, 2010). SciMAT allows users to add files in WoS and RIS formats.
  Then, it incorporates a preprocessing module where de-duplicating (manual, by plural or by Levenshtein distance, or
  importing from an XML file), time-slicing, data reduction and network reduction can be performed. SciMAT divides the
  analysis process into four main stages: i) Dataset building, ii) Creation and normalization of the network, iii) Applica-
  tion of a clustering algorithm to get the map and its associated clusters or subnetworks, and iv) network, performan-
  ce, and longitudinal analyses. Different visualization techniques are available in SciMAT, such as a strategic diagram,
  cluster network, evolution map, and overlapping map. Finally, it is interesting to remark that the visualization module
  can build a report in html or LaTeX format. The images (strategic diagrams, overlapping-items map, etc.) are exported
  in PNG and SVG formats so the user can easily edit them. Furthermore, the cluster networks and evolution maps are
  exported in Pajek format (Batagelj; Mrvar, 2004).

Figure 9. Analysis of the EPI journal with SciMAT

e290103                                                         El profesional de la información, 2020, v. 29, n. 1. eISSN: 1699-2407   10
Software tools for conducting bibliometric analysis in science: An up-to-date review
Figure 10. Analysis of the EPI journal with Sci2 Tool
- Sci2 Tool: It is a modular toolset particularly intended to play out the research of science (Sci2 Team, 2009). It supports
temporal, geospatial, topical, and network analysis and the representation of datasets at the micro (individual), meso
(local), and macro (global) levels. It was developed by Cyberinfrastructure for Network Science Center at Indiana Uni-
versity (USA). It read several bibliographic data formats, such as WoS, Scopus, GS, Bitext and the exportation data
format of EndNote. Furthermore, it can analyze data information from social media like Facebook, research funding
from the National Science Foundation and National Institutes of Health, as well as other academic data in CSV format.
As can be observed, this tool supports a wide variety of information sources. The Sci2 Tool workflow is based on the
typical science study (Börner; Chen; Boyack, 2003): Data acquisition and processing, Data analysis, Modeling, and
Layout. It allows extracting different types of networks, performing several analyses (temporal, geospatial, textual
and networks). Mainly, this tool obtains the following bibliometric networks: co-author, co-PI (Principal Investigator),
documents co-citation, journals co-citation, authors co-citation, bibliographic coupling, author bibliographic coupling
and journals bibliographic coupling. Likewise, this tool allows building direct link networks, such as author-referen-
ces, document-references, journals-references and author-documents networks. In order to represent the networks
obtained, different visualization can be obtained: i) Temporal visualization, ii) Geospatial visualization, iii) Choropleth
map, iv) Proportional symbol map, v) Topical visualization, and vi) Network visualization. This tool offers a great and
adequate number of possibilities in order to represent the different aspects of science.
- VOSviewer: It is a software tool designed for constructing and visualizing bibliometric networks, with journals, resear-
chers, or individual publications as actors, and based on co-citation, bibliographic coupling, or co-authorship relations
(Van-Eck; Waltman, 2010). It also offers the possibility of building co-occurrence networks of important terms extrac-
ted from a corpus of scientific literature, using a text mining functionality. It was developed by the Centre for Science
and Technology Studies (CWTS) at Leiden University (The Netherlands). It can extract bibliographic networks (co-au-
thorship, co-occurrence and citation-based) from bi-
VOSViewer offers a great visualization
bliographic data. This data is added from files down-
loaded from WoS, Scopus, Dimensions, PubMed, and and can load and import data from many
RIS format. Moreover, the API of Crossref, Europe PMC sources
and MA can be queried interactively in VOSviewer; if
we have a set of DOIs, the data can be obtained from the APIs of Semantic Scholar, Open Citations, and WikiData.
VOSviewer constructs the map based on a co-occurrence matrix in three steps (Van-Eck; Waltman, 2010): i) Similarity
matrix, to apply the VOS mapping technique (Waltman; Van-Eck; Noyons, 2010), using the association strength (Van-
Eck; Waltman, 2007); ii) VOS mapping technique, to construct a map reflecting the similarity measure between items;
and iii) Translation, rotation, and reflection, to correct the optimization problem described in the literature (O’Connell;
Borg; Groenen, 1999). About visualization capabilities, this software provides three visualization options: i) network,
ii) overlay and iii) density. It is remarkable that the zoom and scroll functionality and smart labelling algorithm to
prevent labels overlapping. VOSviewer incorporates the zoom and scroll option in order to facilitate a detailed exami-
nation of the map generated. Finally, all the visualizations generated can be saved in different graphical file formats,
e290103 El profesional de la información, 2020, v. 29, n. 1. eISSN: 1699-2407 11José A. Moral-Muñoz; Enrique Herrera-Viedma; Antonio Santisteban-Espejo; Manuel J. Cobo
Figure 11. Analysis of the EPI journal with VOSviewer
such as bitmap or vectors. This option makes it easy to include the analysis output in any format, digital or printed.
Furthermore, VOSviewer can be launched directly from the web page.
6. Libraries
The last category established as tools for bibliometric or scientometric analyses is composed of libraries. This is a con-
cept well-known in the computing area. Computer programs are developed using code, but this code is organized to be
used only within this specific software. Conversely, libraries are code that could be used by multiple programs that have
no connections to each other. This characteristic makes this kind of tools an interesting option when the user is looking
for flexibility and versatility. For example, the analysis of the co-occurrence network could be performed using a library
and the visualization is obtained with a different one. Nonetheless, they generally need some knowledge about the
language program of the environment that support this code, so it is not a good choice for amateur bibliometricians /
scientometricians with any programming knowledge.
Table 4. Characteristics of the libraries
Software Analyzed version Year Developer Programming language
Bibliometrix R-3.6.1 2019 University of Naples Federico II R
BiblioTools 3.2 2018 University of Lyon Python
Citan 2015.12-1 2015 Deakin University R
Metaknowledge - 2017 University of Waterloo Python
ScientoPy 1.4.0 2019 University of Cauca Python
scientoText 0.1 2016 South Asian University R
In that way, a review of the main R and Python libraries is performed in the present manuscript:
- Bibliometrix: It is an open source R package for performing comprehensive SMA (Aria; Cuccurullo, 2017). The stages
to perform the analysis are based on de SMA workflow (Cobo; López-Herrera; Herrera-Viedma; Herrera, 2011). As
stated above, it empowers the Biblioshiny tool and was developed by Massimo Aria and Corrado Cuccurullo from the
University of Naples (Italy). It mainly works with WoS, Scopus and Dimensions data. It incorporates several analysis
options and they are subdivided in 7 categories: 1) Overview, 2) Sources, 3) Authors, 4) Documents, 5) Conceptual
structures, 6) Intellectual structure, and 7) Social structure. It is a powerful library that can performs complete biblio-
metric and scientometric analysis. Furthermore, it allows to obtain multiple types of graphs; feature not common in
other libraries.
e290103 El profesional de la información, 2020, v. 29, n. 1. eISSN: 1699-2407 12Software tools for conducting bibliometric analysis in science: An up-to-date review
-BiblioTools: It is a Python library that contains a set of SciMAT has great preprocessing and ex-
scripts to perform SMA through bibliographic data
porting capabilities and its visualisations
(Grauwin; Jensen, 2011). As stated in SMA tools sec-
tion, BiblioTools is the base of the BiblioMaps tools. allow the analyst to focus deeply on the
It is offered as a user-friendly Python tool, since no research topic
knowledge about previous programming skills are
needed. WoS and Scopus files are used as dataset. The following tasks can be performed using BiblioTools: i) Data
acquisition, ii) Data preprocessing, applying parsing and filtering to the raw data, iii) Data analysis, obtaining co-occu-
rrence networks, bibliographic coupling and clusters, iv) Data visualization, the output can be visualized in BiblioMaps
or exported to other software, and v) Data report, the analysis obtained can be exported to LaTeX format.
- CITation Analysis (Citan): This library is a tool pack that allows to perform performance analysis from Scopus data into
a SQLite database (Gagolewski, 2011). It works under this kind of database since the user can execute codes to modify
the information, such as merge documents or authors, delete duplicates or an specific document or author. Generally,
Citan obtain performance analyses through the different actors; it can calculate the h-index, g-index, rp-index, Ip-index
and other general impact indicators. Furthermore, it provides descriptive graphs with the calculated indicators.
- Metaknowledge: It is a Python package for performing bibliometric/scientometric analyses based on performance
analysis or SMA (McLevey; McIlroy-Young, 2017). It mainly works with WoS, PubMed, Scopus and ProQuest Disserta-
tion and Theses data. Concerning the analysis options, it performs longitudinal analysis, standard and multi reference
publication year spectroscopy, computational text analysis (such as topic modeling or burst analysis) and network
analysis. An interesting feature is the estimating researcher gender; Metaknowledge downloads the Global Name
Dataset from Open Gender Tracker’s Github repository and matches authors and coauthors’ names with the possible
gender. Nonetheless, it is not yet a worldwide dataset, so this function has several limitations in global analyses. Mo-
reover, it uses mkD3 package (Bostock; Ogievetsky; Heer, 2011) to visualize the performance and network outputs.
Network data can be exported to be visualized in external software.
- ScientoPy: As stated in Section 4, ScientoPy is am open source Python script useful to perform temporal scientometric
analysis (Ruiz-Rosero; Ramírez-González; Viveros-Delgado, 2019). It mainly works with WoS and Scopus data. Once
the data is extracted, we can perform a preprocessing stage, consisting on document type filtering, author’s name
normalization, duplicate removal, times cited and document’s country and institutions. It allows performing top and
specific topics evaluation and wildcard search. Wildcard search is useful to find topics that come in plural and singular
or start with an specific root. Furthermore, ScientoPy add some performance indicators to the topics analyzed, such
as average growth rate, average document per years and percentage of documents in last years. Several visualization
options are allowed, such as time line, horizontal bars, horizontal bars trends, evolution and wordcloud. The graphical
oput can be exported to EPS, SVG and PNG formats.
- scientoText: It is a R package to perform some bibliometric/scientometric analysis from bibliographic data based on
indicators (Uddin; Bhoosreddy; Tiwari; Singh, 2016). It works with WoS and Scopus data. It is able to obtain different
analyses, such as co-authorship matrix, top authors/countries/institutions with their g and h indexes and citations,
highly cited actors, international collaboration and term frequency. Generally, scientoText offers some bibliometric
outputs to characterize an author, institution or country.
7. Comparative features
Once the description of the main bibliometric/scientometric tools was carried out, some information about the features
of each tool will be addressed. In that way, the features have been subdivided in: a) database sources, b) pre-processing
capabilities and c) analysis and visualization options. All the included tools are characterized in Tables 5-7 for a compre-
hensive understanding.
Table 5 shows the main bibliographic data sources supported by the analyzed tools. It is interesting to remark that all of
them incorporate the analysis of WoS and Scopus. Others, such as Bibliometrix / Biblioshiny, CiteSpace and VOSviewer
incorporate the analysis of Dimensions, that has expressed its willingness in facilitate the open science. Moreover, Publi-
sh or Perish, CiteSpace and VOSviewer include the promising database MA.
e290103 El profesional de la información, 2020, v. 29, n. 1. eISSN: 1699-2407 13José A. Moral-Muñoz; Enrique Herrera-Viedma; Antonio Santisteban-Espejo; Manuel J. Cobo
Table 5. Comparative of the databases supported by the reviewed tools
Dimensions
PubMed
Crossref
Scopus
WoS
MA
Tools Others
GS
General bibliometric and performance analysis
CRExplorer X X X
Publish or Perish X X X X X
ScientoPyUI X X
Science mapping analysis tools
Bibexcel X X ProCite, Bibexcel
BiblioShiny X X X
BiblioMaps X X
CiteSpace X X X X X X ADS, arXiv, CNKI, Cssci, Derwent Patents, NSF, ProQuest, Fulltext, CSV
CitNetExplorer X X
SciMAT X X CSV
Sci2 Tool X X X BibText, EndNote
VOSviewer X X X X X RIS, PMC, Semantic Scholar, Open Citation, WikiData
Libraries
Bibliometrix X X X
BiblioTools X X
Citan X
Metaknowledge X X X ProQuest
sciento-Text X X
ScientoPy X X
Table 6 presents the pre-processing options that the analysed tools incorporate. In that sense, SciMAT is the one offering
the widest type of tasks. Almost all the tools include some filters and the second and third features most incorporated
are the time slice and the duplicated documents removement. Generally, the pre-processing stage is the unfinished
business of the bibliometric/scientometric tools.
Table 6. Comparative of the pre-processing option of the reviewed tools
Duplicate Plurals / String De-duplica- Data
Tools Time slice Stop words Filters
documents Singulars distance tion* edition**
General bibliometric and performance analysis
CRExplorer X
ScientoPyUI X X
Science mapping analysis tools
Bibexcel X
BiblioShiny X X
BiblioMaps X X
CiteSpace X X
CitNetExplorer X
SciMAT X X X X X X X
Sci2 Tool X X (stemming) X X X
VOSviewer X
Libraries
Bibliometrix X X
BiblioTools X X
Citan X X X
Metaknowledge X X X
ScientoPy X X
Some tools were excluded since they do not incorporate any feature.
Excluded: Publish or Perish and scientoText
* The tool allows joining several items (e.g. synonyms, acronyms with full form, authors, etc.)
** Data can be modified into the tool, so no external software is needed to perform this task.
e290103 El profesional de la información, 2020, v. 29, n. 1. eISSN: 1699-2407 14Software tools for conducting bibliometric analysis in science: An up-to-date review
Concerning Table 7, the different analysis options of the tools included are specified. Furthermore, a column with the
visualization options was added to know how the analysis output can be displayed.
Table 7. Comparative of the analysis and visualization options of the reviewed tools
Reference network
Thematic network
Author network
Other networks
Burst detection
Spectrogram
Visualization
Performance
Tools
Geospatial
Evolution
General bibliometric and performance analysis
CRExplorer X Spectrogram
ScientoPyUI X X Timeline graph, bar graph, evolution graph and word cloud
Publish or Perish X
Science mapping analysis tools
Bibexcel X X X X X X External software
Network, three-fields plot, wordcloud, tree map, historiograph,
BiblioShiny X X X X X X X X X
strategic diagram, evolution map and world map
BiblioMaps X X X X X X Network
CiteSpace X X X X X X X Tree ring, geospatial map
CitNetExplorer X Network
Strategic diagram, cluster network, overlapping map, evolution
SciMAT X X X X X X
map
Sci2 Tool X X X X X X Temporal, geospatial map, topical, network
VOSviewer X X X X X Network, overlay, density
Libraries
Network, three-fields plot, wordcloud, tree map, historiograph,
Bibliometrix X X X X X X X X X
strategic diagram, evolution map and world map
BiblioTools X X X X X X Network
Citan X Bars, box plots and pie chart
Metaknowledge X X X X X X Timeline graph, spectrogram and network
scientoText X X
ScientoPy X X Timeline graph, bar graph, evolution graph and word cloud
Some tools were excluded since they do not incorporate any feature.
Excluded: Publish or Perish
8. Discussion and conclusions
In this article, a thorough analysis of the most important bibliometric/scientometric tools and software has been develo-
ped, highlighting their most important characteristics, and making a global comparative analysis. To do that, the analysis
has been focused on four main tools:
a) bibliometric databases (WoS, Scopus, GS, MA and Dimensions),
b) general bibliometric and performance analysis (CRExplorer, ScientoPyUI and Publish or Perish),
c) SMA (Bibexcel, BiblioShiny, BiblioMaps, CiteSpace, CitNetExplorer, SciMAT, Sci2 Tool, VOSviewer), and
d) Python and R libraries (Bibliometrix, BiblioTools, Citan, Metaknowledge, scientoText, ScientoPy).
Although there are different bibliometric databases able to be used as a data source for bibliometric analysis, they
have different characteristics and have been developed with a different purpose. One of the most important aspects is
the scientific coverage, which has been analyzed and discussed in several studies. Mongeon and Paul-Hus (2016) de-
termined that the Social Sciences and Arts and Humanities are underrepresented in WoS, and the strong influence of
English-language is high. Furthermore, although Scopus presents slightly more extensive coverage, it has similar biases
than WoS. MA seems to be an alternative for citation analysis, but although it covers life sciences and sciences correctly,
engineering, social sciences and humanities are underrepresented in comparison with GS (Harzing; Alakangas, 2017). In
that way, according to recent publications (Martín-Martín; Orduña-Malea; Harzing; Delgado-López-Cózar, 2017; Mar-
tín-Martín; Orduña-Malea; Delgado-López-Cózar, 2018), GS seems to do a better coverage of some areas of research
than WoS (Humanities, Literature & Arts, Social Sciences, Engineering & Computer Science, and Economics & Manage-
e290103 El profesional de la información, 2020, v. 29, n. 1. eISSN: 1699-2407 15José A. Moral-Muñoz; Enrique Herrera-Viedma; Antonio Santisteban-Espejo; Manuel J. Cobo ment) and Scopus (Humanities, Literature & Arts, and Social Sciences), but it has some drawbacks; such as lack of detai- led metadata or difficulty to extract data. To our knowledge, there is no information about the coverage of Dimensions. Then, the data source should be chosen with caution and taking into account the research area where the bibliometric analysis will be performed. Regarding the exporting options of the databases, there are substantially differences among them. WoS allows to export data in 500 records slots that could be concatenated (500 by 500) with a total limit of 100,000 records per query. It has different export formats, but the most suitable for the bibliometric purpose are plain text or tab-delimited. Scopus allows to download more data in a single petition, but the total records retrieved is limited to the first 2,000 records of the query. Although there are different format options for data exporting, the only one available for bibliometric pur- pose is the RIS or CSV formats. It is necessary to mention that Scopus allows to download the first 20,000 records of a query in CSV format but limiting the output to only citation data. GS does not bring the possibility of data download, so researcher should employ crawler method (Martín-Martín; Orduña-Malea; Harzing; Delgado-López-Cózar, 2017; Martín-Martín; Orduña-Malea; Delgado-López-Cózar, 2018), or use software tools that integrate the crawling method such as Publish or Perish (see Section 4). The MA search website does not allow data retrieval for bibliometric purpose. However, it offers his data through the Academic Knowledge API or indeed, it allows to access to the different snapshot of the whole dataset through the Open Academic Graph. It should be taken into account that the access to the API is li- mited to 10,000 requests per month in the free license option. Finally, Dimensions allow retrieving a maximum of 50,000 records per query using a CSV or excel formats. In fact, Dimensions provide a so-called “export for bibliometric mapping”, but it is just a specific CSV file. As was pointed in Section 6, the software tools and libraries were compared according to three groups of features: a) database sources, b) pre-processing options, and c) analysis and visualization options. Regarding the data sources, almost all the software tools and libraries can import data downloaded from WoS and Sco- pus, since both databases are the most important and therefore, most of the analyses are based on them. Moreover, Biblioshiny / Bibliometrix, CiteSpace and VOSviewer allow importing data from Dimensions. Publish or Perish, CiteSpace and VOSviewer allow to retrieve data from MA directly from its API. Taking into account GS, Publish or Perish and Sci2 Tool are the only tools able to work with it. Finally, we should point out that some software tools stand out due to the great number of compatibilities with different data sources. In that sense, we should remark the general bibliometric software tool Publish or Perish, and the SMA software tools CiteSpace and VOSviewer, which are able to work with the most common databases, and also, they allow to work directly with open databases such as Crossref, among others, using their API. In the bibliometric analysis, the data preprocessing and cleaning is an important and daunting task, that should be per- formed as the first step. In that sense, the compared software tools and libraries contain a great variety of preprocessing methods and algorithms. First, with the exception of Bibexcel, all the software tools can filter the data in different ways. Additionally, time slicing is allowed by the majority of them (Bibliometrix / Biblioshiny, BiblioMaps / BiblioTool, CiteSpa- ce, SciMAT, Sci2 Tool). Duplicate documents removal is also allowed by ScientoPyUI / ScienctoPy, Bibexcel, Sci2 Tool, Citan and Metaknowledge. It is important to note that the Publish or Perish and the R library scientoTex do not incorporate any preprocessing method. Finally, regarding the preprocessing capabilities, SciMAT stands out as the most powerful software since it incorporates methods to apply a de-duplication process (manually or using plural / distance, or string distance), time slicing, stop words, and data edition. We should remark that taking into account the analysis options, Bibliometrix and its user interface Biblioshiny stand out since they incorporate a great variety of different analyses. In practice, since it is recent, most of the analysis developed by the previous software tools have been incorporated in Bibliometrix / Biblioshiby. For instance, it allows to extract and analyze a bibliometric network (thematic, authors and references, among others), performs an evolution analysis, deve- lops a performance analysis based on different indicators, applies a burst detection, draws a spectrogram, and show the geospatial component. On the other hand, taking into account the bibliometric networks, most of the SMA can work with the most common (thematic, authors, and references). Also, Bibexcel, SciMAT and Biblioshiny / Bibliometrix can work with another kind of bibliometric networks. Regarding the R and Python libraries, Metaknowledge can work with a great variety of networks, and also scientoText can work with authors networks. CRExplorer, Bibliometrix / Biblioshiny and metaknowled- ge can build a spectrogram. The development of an evolution analysis is only available on Bibliometrix / Biblioshiny, SciMAT and ScientoPy / ScientoPyUI. Also, performance analysis (using different measures and indicators) can be developed using the majority of the software tools with the exception of CRExplorer, Sci2 Tool and Metaknowledge. The burst detection is allowed by CiteSpace, Sci2 Tool, Metaknowledge and Bibliometrix / Biblioshiny. Finally, a geospatial analysis could be deve- loped using Bibexcel, Bibliometrix / Biblioshiny, BiblioTools / Bibliomaps, CiteSpace and Sci2 Tool. As a final conclusion, we should remark that each of the analyzed software tools have their advantages and drawbac- ks, and therefore the analyst should choose the adequate software for each specific analysis. At this moment, maybe Bibliometrix and its Shiny platform contain the more extensive set of techniques implemented, and together with the e290103 El profesional de la información, 2020, v. 29, n. 1. eISSN: 1699-2407 16
You can also read