Unsub Extender: a Python-based web application for visualizing Unsub data
←
→
Page content transcription
If your browser does not render page correctly, please read the page content below
Unsub Extender: a Python-based web application
                                                  for visualizing Unsub data
arXiv:2109.00468v1 [cs.DL] 1 Sep 2021

                                                                      Eric Schares
                                                      Engineering & Collection Analysis Librarian
                                                                 Iowa State University
                                                                  eschares@iastate.edu

                                        1    Abstract
                                        This article introduces Unsub Extender, a free tool to help libraries analyze
                                        their Unsub data export files.
                                            Unsub is a collection development dashboard that gathers and forecasts
                                        journal-level usage metrics to provide academic libraries with deeper measure-
                                        ments than traditional cost-per-use. Unsub gives libraries richer and more nu-
                                        anced data to analyze their subscriptions, but it does not include a way to easily
                                        visualize the complex and interrelated data points it provides.
                                            Unsub Extender (https://unsubextender.lib.iastate.edu) is a free
                                        Python-based web application that takes an Unsub export file and automates
                                        the creation of interactive plots and visualizations. The tool loads with example
                                        data to explore, and users upload their specific Unsub file to quickly populate
                                        the pre-made plots with actual data.
                                            Graphs are interactive, live-updating, and support zoom, click-and-drag,
                                        and hover. Filters are specified through sliders to model scenarios and focus on
                                        areas of interest. A drop-down menu allows users to change a journal’s decision
                                        status, and graphs update automatically. After evaluating journals, users can
                                        export the modified dataset to save their decisions.
                                            Unsub Extender proposes best practice in analyzing the increasingly common
                                        Unsub export file. It simplifies the analysis, eliminates duplication of effort, and
                                        enables libraries worldwide to make better, more data-driven decisions.

                                        2    Introduction
                                        A core mission of the academic library is to provide patrons with access to schol-
                                        arly materials. This is often accomplished through journal subscriptions with
                                        academic publishers which cost millions of dollars per year. Scientific journals
                                        are critical to support the research and teaching missions of the university and
                                        provide an avenue for researchers to communicate their own findings, advancing
                                        scientific knowledge and their career progression.

                                                                                 1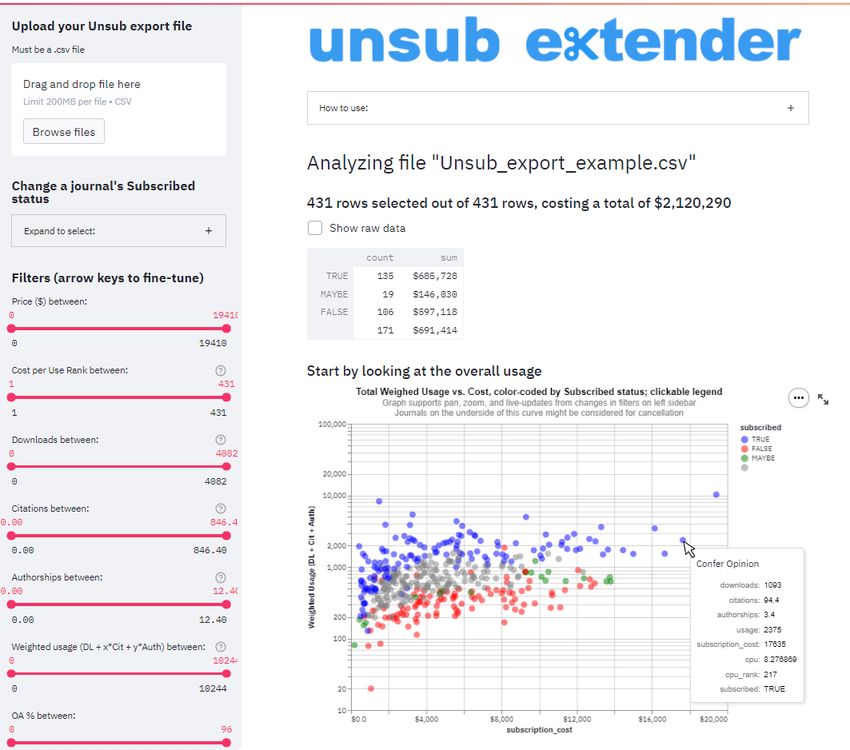
The ever-increasing price of journal subscriptions, coupled with library ac-
quisition budgets that rise modestly year over year (if at all), has led to a
“serials crisis” in the profession. This community-termed realization dates back
to at least the late-eighties (Hamaker, 1988; Douglas, 1990; Roth, 1990; Pan-
itch and Michalak, 2005). Journal subscription prices increased over 550% from
1986 to 2018 (most recent data available), far outpacing inflation which rose
130% during that same period. Total library expenditures rose 220% over that
time, though this category includes not only serials budgets but also salaries,
operating expenses, monograph purchasing, and other expenses (Kyrillidou and
Young, 2006; Association of Research Libraries, 2019). These runaway journal
price increases occurred even as journals were moving to an electronic format
where the marginal production costs drop to near zero (Noorden, 2013).
    The average single-year increase over this 32-year time period was 6.1% per
year for journal prices, 3.5% per year for total library expenditures, and 2.65%
per year for inflation. Focusing only on the past 10 years (2009-2018), library
budgets have remained flat or decreased seven times, while journal prices have
continued to climb at 2.5x the rate of inflation during that time (3.36% journal
prices vs. 1.38% inflation vs. 0.76% library total expenditures). This constant
pressure on library budgets has caused libraries to look very critically at their
journal subscription practices.

2.1    Big Deal
The term “Big Deal” was coined in the mid-1990’s by Kenneth Frazier (Frazier,
2001) and refers to the practice of publishers bundling hundreds of electronic
journal subscriptions together into one large package for a single price. Libraries
pay a lower fee than they would by subscribing to each journal in a publisher’s
list individually, but they are also locked into agreements to pay for titles they
may not need or want (Poynder, 2011). Introduced as a solution to the problem
of ever-increasing journal prices, initial Big Deal bundle pricing was generally
based on a library’s current print subscription spend with the publisher, plus
an extra 5-15% to enable access to non-subscribed journals in the publisher’s
portfolio and a 6% inflationary increase per year (Bergstrom et al., 2014).
     Several studies have thoroughly investigated the value (or lack thereof) li-
braries get from Big Deals. Shu et al. (2018) studied journal subscription data
from 34 University Libraries and used references to each journal from scholars
affiliated with the universities as an indicator of their actual use. The paper
found the value of the Big Deal investment to be low, as the university commu-
nity cited only a fraction of the journals purchased by their institution through
the bundle. More journals does not necessarily mean more value if the extra
journals are not being used, and the ratio of cited journals to all subscribed
journals decreased by 61% between 2000 to 2011. Big Deal pricing is also not
transparent or easily comparable among universities. Bergstrom et al. (2014)
submitted Freedom of Information Act (FOIA) requests to reveal Big Deal pric-
ing that had been confidentially negotiated with each library individually. The
study found little consistency in what academic publishers charge universities,

                                        2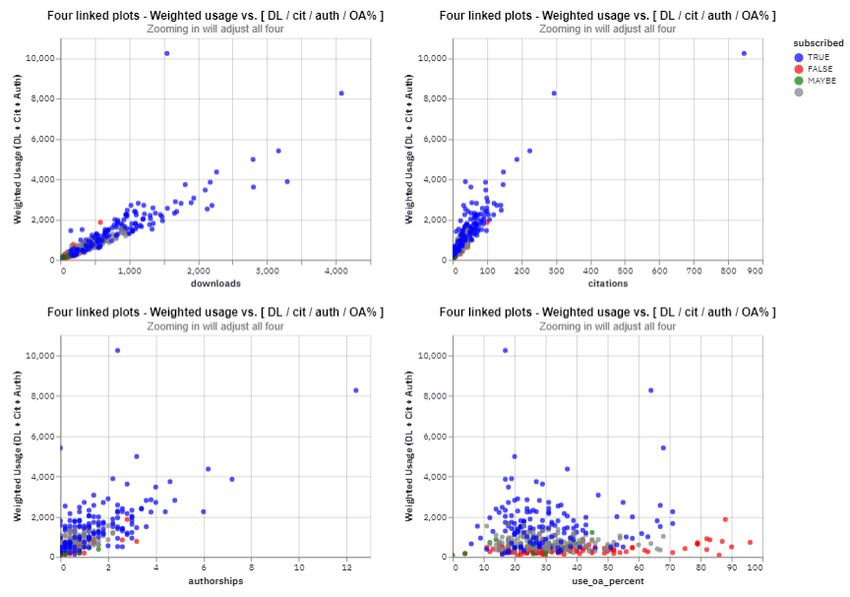
and found commercial publisher prices were between 3-10 times higher than
corresponding prices from nonprofit publishers.
     Commercial academic publishing is a tremendously profitable business. RELX,
the parent company of the world’s largest academic publisher, Elsevier, reported
profit margins of in excess of 30% from 2016-2019, with 2020 dipping slightly to
29.2% (RELX Group, 2021). Much has been written about the unusual working
relationship between researchers, universities, and publishers - scientists conduct
research, write articles, and give it to publishers for free, provide peer-review
to validate other scientists’ papers, only for publishers to turn around and then
sell the articles back to the university for millions of dollars (Noorden, 2013;
Buranyi, 2017).
     The top publishers continue to increase their share of scholarly output. Lar-
ivière et al. (2015) report that over 50% of all journal articles published in 2013
and indexed by the Web of Science database were published by only five com-
panies: Elsevier, Wiley, Springer Nature, Taylor & Francis, and SAGE. This
consolidation is a result of the creation of new journals each year and the ever
expanding acquisitions of existing journals by these publishers (Larivière et al.,
2015; Edlin and Rubinfeld, 2004). Shu et al. (2018) used economic theory to ex-
plain publishers’ motivation to launch new journals each year, noting “academic
publishers increase sales volume and profits by selling additional journals with
no use or little use at the maximum price libraries are willing to pay.” Indeed,
Edlin and Rubinfeld (2004) looked at journal publishers as monopolies with an
eye toward antitrust law, concluding “substantive antitrust issues” were present
with Big Deal bundling.

2.2    Unbundling the Big Deal
As a result of yearly price increases and the realization of dubious value, some
libraries have moved to cancel their Big Deal and opted instead for an a-la-
carte model, selecting and paying for each individual journal separately. This
practice of breaking up, or unbundling, the Big Deal is becoming more common;
SPARC, the Scholarly Publishing and Academic Resources Coalition, maintains
a database of libraries worldwide who have broken up their Big Deal (SPARC,
2021). The self-reported tracking tool reports 80 such events back to 2004,
with 33 occurring between 2019 and August 2021 (institutions may be counted
in more than one event if they report multiple Big Deal breakups). While
unbundling ensures a library pays only for content they have selected, it does
impose costs both in terms of higher prices per journal (as the library is now
paying the “list price” and not spreading the cost of the journal across an overall
subscription package) and in terms of staff time and effort to curate, assess, and
decide on the list of chosen journals on a yearly basis.
    The literature contains many case studies of universities who have unbun-
dled. Ivanov et al. (2020) take a theoretical approach to studying the evaluation
and decisions made when unbundling a Big Deal package, and Sjoberg (2017)
provided a practical review of several papers which deal with cancellation and
renewal decisions. The study looked at criteria used in breaking up Big Deals,

                                        3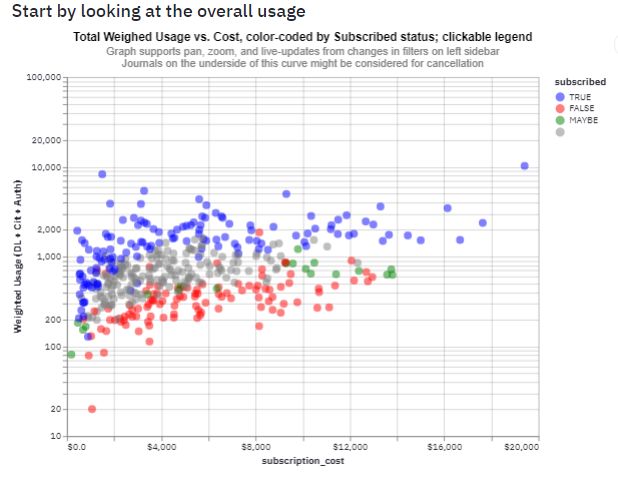
decision strategies, and impacts of cancellation projects. It found dwindling
support for Big Deal packages, with cost-per-use, download statistics, overlap
analysis, subject specialist input, and citation analysis found to be present in
many of the papers included in the review. Ohler et al. (2019) describe the
process, data, and communication strategies of breaking up the Big Deal at
three R1 Universities, while Pedersen et al. (2014) detail the breaking up of the
Springer Big Deal at Iowa State University. Toni (2012) describes the Italian
National Institute of Health’s experience in unbundling with Elsevier. They
found that cutting 90% of titles in the package led to only a 22% reduction in
downloads, with half the remaining downloads occurring in 25% of journals and
the top 10 titles (5%) responsible for 20% of the downloads.
    In practice, most collection analysis takes place in a homegrown tracking
sheet or database, with large, unwieldy files that can be difficult keep up to
date short of massive data refresh effort each year. These local spreadsheets
require manual research and loading of relevant data points such as citations or
authorships, but in practice this extended data may only be added for targeted
titles in a package and not all titles. Serial decisions at Virginia Tech were made
with the help of the “Big Ugly Database” or BUD (Lener and Stovall, 2012),
a spreadsheet with 90,000 rows of journal titles to make cancellation decisions.
Sjoberg (2017)’s review also found metrics were commonly fed into a rubric or
decision grid that had to be maintained and cleaned, something that takes an
extensive amount of staff time. More detailed usage data is often acknowledged
to be useful, but the difficulty in looking up each journal title individually
and adding a single number to the main tracking spreadsheet makes it very
cumbersome to do in practice.

2.3    Unsub.org
In order to assist libraries in their evaluation and possible cancellation of Big
Deal packages, it needs to be easier to assemble data and see the value of
individual titles and the package as a whole. Unsub.org (OurResearch, 2020) is a
collection analysis dashboard that helps academic libraries more deeply analyze
their journal subscription packages and Big Deals. Launched in November 2019,
the tool has seen rapid uptake in the academic library community and is now
used by over 500 libraries on six continents, including national consortia in the
UK, Canada, and Australia (Priem and Piwowar, 2020).
    Unsub goes beyond traditional cost-per-use metrics and brings in other mea-
sures of demand, such as citations (how often have researchers from an insti-
tution cited each journal) and authorship (how often have researchers from an
institution published in each journal). Users upload COUNTER-compliant elec-
tronic usage information, and Unsub uses Microsoft Academic to search, collect,
and project the citation and authorship data for the institution over each of the
next 5 years (Priem, 2021).
    A Weighted Usage measure then combines downloads, citations, and author-
ships from the specific institution to a given journal title (A) into one number.

                                        4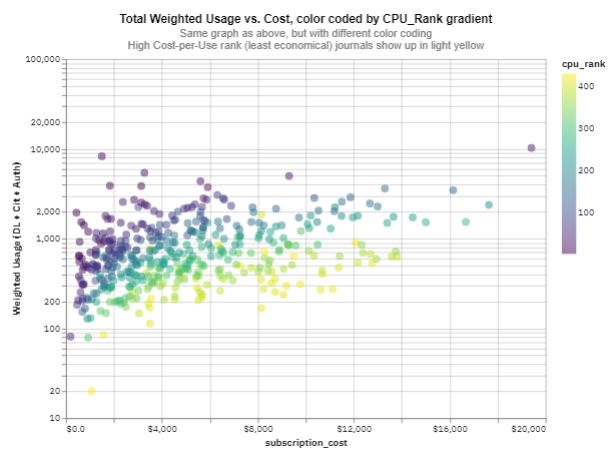
The weights can be customized within Unsub, with the default weights set as:

 W eightedU sageA = downloadsA + 10 ∗ citationsA + 100 ∗ authorshipsA (1)

    This reflects the fact that publishing an article in an academic research
journal is a more time- and resource-intensive effort than simply downloading
an electronic copy of a paper from that journal. Choosing which journal to
publish in reflects careful consideration by researchers and as such, authorships
are weighted as equal to 100 downloads. Citations are also a valuable signal of
usage, and as such are weighted between downloads and authorships, worth 10
downloads a piece.
    The default relative weightings assigned by Unsub are similar to an approach
taken by 1Science (Science-Metrix Inc., 2019), another collection analysis tool
that was bought by Elsevier and discontinued (Elsevier, 2021). 1Science used a
dynamic weighting scheme that reflected the comparative statistics for a given
journal compared to all titles in the package, with the weighting for authorships
equal to the ratio of all downloads to all authorships and the weighting for ci-
tations equal to the ratio of all downloads to all citations. This approach led to
higher absolute weighting numbers, and a larger relative weighting ratio. In a
limited analysis where the two approaches were compared directly on a sample
data set, 1Science weightings came out to 16 and 550 for citations and author-
ships, respectively. These factors result in higher overall “usage” numbers, but
the relative performance of each journal within the package was still roughly
equivalent to that of Unsub.
    In addition to demand (Weighted Usage), Unsub also models alternative
modes of instant fulfillment, such as Open Access availability (papers published
free to read) and backfile or post-termination retention rights (older content a
library has already paid for and will retain even without a current year’s sub-
scription). Together, these modes show how much of the institution’s usage can
be met even without a current year’s subscription to the journal, which goes
beyond traditional cost-per-use analysis and gives a more nuanced assessment
of the cost-effectiveness of the title. Unsub then projects usage five years into
the future to give a sense of what to expect for each journal title. The usage, ci-
tation, and authorship numbers are modeled as demand, and Interlibrary Loan,
Open Access, and backfile are modeled as modes of fulfillment. Bringing these
disparate data points together into one unified dashboard illuminates the actual
value of a journal’s subscription and helps libraries make decisions on what to
keep and what to cancel.
    Unsub supports analysis of the five largest publishers: Elsevier, Wiley,
Springer Nature, Taylor & Francis, and SAGE, the same five publishers that
accounted for half of 2013’s output in Web of Science as found in Larivière et al.
(2015). Since its launch in 2019, Unsub has garnered positive attention and use
cases from the library collection development community, and it continues to
make news as libraries use this data to break up Big Deals and unsubscribe to
large journal packages (Hardaway, 2020; Chawla, 2020; SPARC, 2020).

                                        5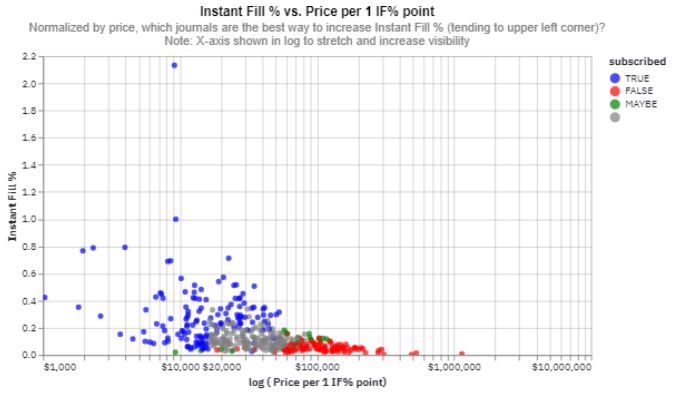
2.4    Software Citation
Unsub and bibliometric analysis tools are examples of how critical software
development is becoming across disciplines. Orduña-Malea and Costas (2021)
argue that the rising importance of “scientific-purpose software” justify it being
recognized as a research product of its own, while Li et al. (2016) write that
“scientific software is as important to scientific studies as raw data.” However,
the actual practices of tracking, referencing, and citing software contributions
remain unclear.
    The literature contains studies to investigate the many ways scientific soft-
ware is applied. Online mentions, uses, citations, data reuse, data citation, and
metadata elements are common. Orduña-Malea and Costas (2021) tracked the
online mentions of the bibliometric software VOSviewer as a case study to an-
alyze the impact of scientific software. Further, Li et al. (2016) tracked reuse
information for LLAMPS, a materials science simulation software, in research
papers and found inconsistent applications and the need for standardization to
enable consistent use and tracking.
    Despite calls for greater recognition of software as a scientific contribution,
the question of how to disseminate and cite software through its many versions
is still relatively unsettled. GitHub recently added built-in citation support
for its repositories through a .cff file to enable researchers to cite and ac-
knowledge code contributions (Smith, 2021; Druskat, 2021) while still enabling
a “preferred citation” to a more traditional peer-reviewed paper if desired, and
Zenodo (CERN, 2021) makes software citable by minting a DOI to refer to a sta-
ble software version. In practice, a combination of research papers announcing
new software (van Eck and Waltman, 2010), source code repositories (Druskat,
2021; Smith, 2021; Fenner, 2021), deployed applications (OurResearch, 2020),
and official documentation all play a part in constructing a consistent record of
research software as a scholarly contribution.

3     Significance of this Project
So far, we have seen that libraries are motivated to break up their Big Deals, and
in many cases have no choice due to continually rising prices, but are confronted
with difficult data collection and analysis workflows. Unsub was then developed
to provide a way for libraries to more easily analyze their subscription packages
and investigate which journals are providing value for their patrons, bringing
multiple modes of demand and projections of fulfillment together into one place.
    Unsub’s strength is that it supplies libraries with very rich data on the in-
dividual journal level to help them analyze the value of subscriptions, but its
weakness is that it does not help users easily understand the many complex and
interrelated data points it provides. In fact, Unsub only includes one visual-
ization: a high-level summary at the overall package level (Figure 1). In this
graph, each small square box is an individual journal title the user can select
and toggle to subscription status on or off; blue squares are marked as titles

                                        6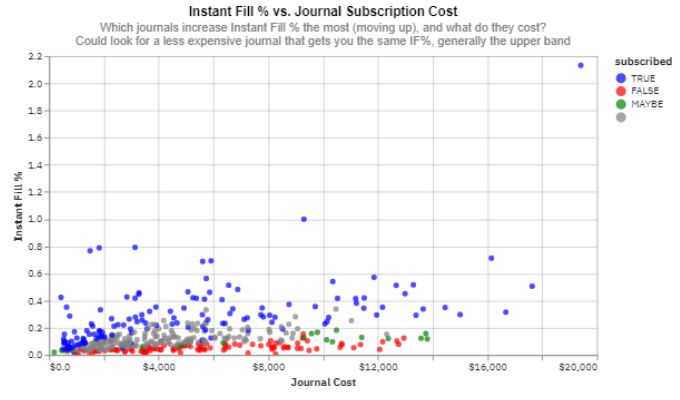
to keep, gray squares are those that will not be renewed. This graph useful to
glean an overall summary of a publisher’s Big Deal package as a whole, but it
does not help the user make a decision on any individual title in particular.

                 Figure 1: Summary graph provided by Unsub

    Clicking on a journal title square brings up a display box with more data
about the title, but it is difficult to compare numbers among similar journals or
decide where a cutoff should be applied. Furthermore, it is not clear to see the
underlying data which is driving the location of the square along the x-axis - the
title may have many downloads but few authorships, or may be cited frequently
but not published in often (see Equation 1). Unsub does provides an alternative
to the graph it calls “Table View” which shows some information on multiple
journals at once, but it is limited in size, requires lateral scrolling, and cannot
display all the collected data on each journal title.
    The graph in Figure 1 shows Iowa State University’s actual decisions on
a large commercial publisher’s subscription package that was analyzed with
Unsub. It is clear that all retained (blue) journals do not form a continuous
group; in practice, some are located along the x-axis toward high “Adjusted
Cost-per-Use” but were still kept due to local reasons (traditional strengths,
support of a small department, strategic university emphasis area, etc). The
scattering of decisions along this metric demonstrates a need for deeper analysis
and systematic thinking about which journals to keep than Unsub has provided.
Therefore, a new tool called Unsub Extender was developed and is formally
introduced here.

3.1    Unsub Extender
Unsub Extender is a Python-based web application which takes a standard
Unsub .csv export file as input and automates the creation of interactive

                                        7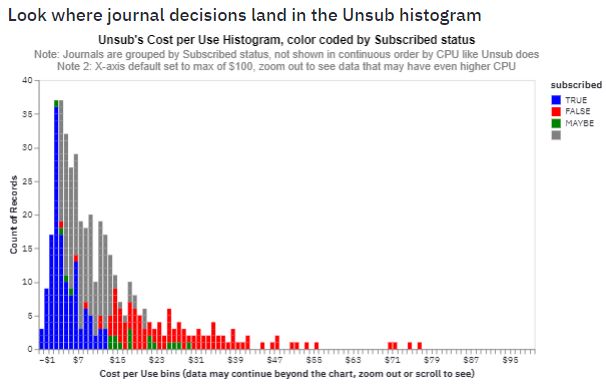
plots and data visualizations to help libraries better understand their Unsub
data (Schares, 2021a). It is freely available at https://unsubextender.lib.
iastate.edu, and the source code is posted on GitHub (Schares, 2021b).
    The tool launches with a sample Unsub dataset so users can explore the set
of twelve pre-made standard plots, or they may upload an actual data file to
quickly populate the graphs with their live data. Figure 2 shows a screenshot
of the main landing page of the site, with the logo, summary data table, left-
hand filtering sidebar, and scatter plot of Weighted Usage (from Equation 1)
vs. subscription cost for each journal.
    All graphs are interactive, live-updating, and support zoom, pan, and click-
and-drag. Hovering over a data point shows more information about the journal
title; for example, Figure 2 shows the hover box with Unsub’s detailed informa-
tion for the fictional journal, “Confer Opinion,” including number of downloads,
citations, authorships, usage, cost, and more. The graph makes it clear to see
the overall trends and groupings of titles to keep or cancel that emerge (more
detailed discussion of the available graphs will occur in the next section).

                    Figure 2: Unsub Extender main screen

   A summary data table above the graph shows the running total of decisions

                                       8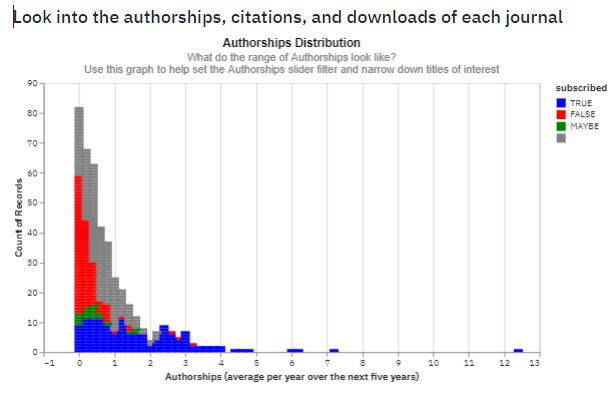
so far. It includes both the absolute number of titles and the cumulative dollar
amount in each Subscription category of TRUE, MAYBE, FALSE, or -blank-,
making it easy to see where the analysis stands at any given time, how different
scenarios would play out, or how close a package is to a desired dollar amount
goal. Filters for various criteria are specified through sliders on the left panel to
help model different scenarios and focus on areas of interest, and a drop-down
menu allows users to change a journal’s “Subscribed” decision status and the
graphs will then update accordingly.

3.2    Contribution
Unsub Extender aims to solve the problem of understanding the rich data Un-
sub provides, enabling better collection development decisions to be made more
quickly. The motivation for creating this tool came from the author’s job re-
sponsibilities, which include running the Unsub tool, understanding the report,
summarizing it, and communicating the conclusions to the collection manage-
ment team. It took a substantial amount of work to internalize the various
aspects of the detailed Unsub data, experimenting with columns to plot against
each other, calculating custom extended measures, and deciding how to color-
code and present the graphs. Eventually, through trial-and-error the collections
team arrived at a satisfactory set of graphs that helped decide which journals
to retain and which to cancel, but the question remained: if we were having
this much trouble understanding and digesting the Unsub data, what about the
other 500 libraries around the world that also subscribe to this tool?
    Unsub data files are becoming more widespread as academic libraries look to
unbundle their journal subscription packages, but a standardized way to analyze
the Unsub export file has not yet been proposed. Unsub Extender is intended
to encode the author’s expertise and assist other libraries with their journal
analysis procedures. Using the pre-made graphs that have already proven useful
speeds up others’ analysis and enables the wider library community to more
quickly gain understanding of the overall journal package value, as well as that
of each individual journal. By proposing best practice in how to analyze the
increasingly common Unsub data file, the tool shares what we have learned
locally, enables peer libraries to benefit from our work, eliminates duplication
of effort, and allows more informed decisions to be made more quickly.

4     Functionality
To demonstrate the functionality of Unsub Extender, sample data is pre-loaded
in the application and automatically populates upon visiting the site. This
sample data set is based upon a real publisher package and its subsequent per-
formance at Iowa State University, but with identifying details such as ISSN
stripped out, possible identifying data such as price and usage slightly modi-
fied, and journal titles changed to invented, fictional names. Using a genuine
data set as the starting point helps demonstrate what actually happens when

                                         9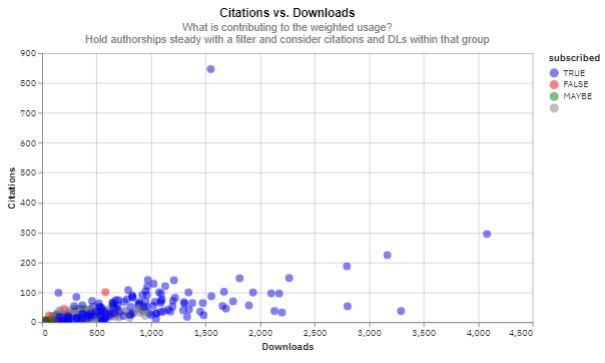
Unsub Extender is used on an authentic Unsub data export file and models
where the trends and bands of decisions begin to emerge.
    A key aspect enabling the creation of this project is Unsub’s support of
“Open Infrastructure,” meaning it is very easy to export the dataset from Unsub
once it has been calculated. Figure 3 shows an example of the raw exported
Unsub .csv file, with each row containing a range of calculated metrics for
an individual journal title. While this detailed data is very interesting, it is
difficult to grasp the meaning behind all 35 columns of data for each journal
title. Unsub provides a summary to explain the columns (Piwowar, 2021), but
the overwhelming amount of data presented in this format makes it difficult to
use in making decisions.

                  Figure 3: Sample exported Unsub .csv file

    Uploading the exported data to Unsub Extender populates the twelve graphs
that are coded and running in the site, designed to show different angles of the
underlying figures. Using the predictable and standardized Unsub export file
format means the site can be assured of the incoming data structure, what
heading names are used, and what columns contain which data types. Arriving
at the same conclusion when looking at a data set through multiple graphs
provides confidence that the decisions are sound and can be defended. It can
also illuminate mistakes or inconsistencies in the treatment of data points, as a
journal marked for cancellation that is surrounded by other journals of similar
performance being kept will raise the question of why that journal is treated
differently from its neighbors.
    A brief overview and explanation of the graphs will now be provided.

4.1    Weighted Usage vs. Cost
The first two graphs that display when loading Unsub Extender show Weighted
Usage vs. Subscription Cost (Figures 4 and 5). These visualizations quickly
emerged as the central decision making bodies in actual journal cancellation
projects, as they provide a suitable balance between detailed information and
a high-level summary. The first two graphs actually plot the same data points
but use different color codings: one is by Subscribed status (Figure 4), the other
reflects each journal’s relative cost-per-use (CPU) strength among all titles in
the package (Figure 5).
    Looking first at Figure 4, it becomes clear that decision bands and patterns
have emerged in the data. Journal titles appearing on the underside of the
curve were targeted for cancellation (red) since their price does not support
their usage. These titles have a low value compared to others in the package;

                                       10
Figure 4: Color-coded by Subscribed status
alternatives can offer more usage for the same amount of money (looking up
vertically), or less money for the same amount of usage (looking left horizon-
tally). Titles which appear on the top of the curve have been marked as blue for
renewal. These titles do provide value for the subscription cost, as the Weighted
Usage is among the highest in the package and cancellation would be unlikely.
Sharp-eyed readers may notice a red data point among the middle of the blue
band at $8,000 and 2,000 Weighted Usage; more will be said about this journal
(named “Science Advance”) and the reasons for its decision later in Section 6.
A few green dots are scattered throughout the middle band of Figure 4.
These are points that were marginal, on the border between cancellation and
retention. They were set as “MAYBE” in Unsub Extender’s terms, intended
to be marked for conversation at a later date when coming back to the data.
They may be the first to be considered for cancellation should additional cuts
be needed to meet a budget goal, or scrutinized further with a different set
of stakeholders and perspectives. Finally, the remaining journals have had no
decision made about them, and these appear in background gray.
Figure 5 is useful to compare journals to others within the package. The
color-coding is instead by gradient of CPU rank, something Unsub calculates
and orders from 1 to “number of journals in the set” (431 in this case). Again
we see that the least economical journals (highest CPU rank) tend to appear
11Figure 5: Color-coded by CPU rank
on the bottom of the curve, this time displaying in light yellow. Darker shades
of purple and blue represent the lowest CPU journals, or most economical, with
the general trend of dark to light following the trend of blue to red in Figure 4.
4.2 Individual demand metrics
With a basic understanding of the overall distribution and shape of the dataset,
the next set of graphs take the user deeper into investigating each component
of Weighted Usage individually (Equation 1).
Figure 6 isolates authorship data and displays the histogram distribution
for the entire journal package. Authorship data is the most heavily weighted
component of Weighted Usage, but it is often very skewed. In this dataset, most
journals are projected to have three or fewer authorships per year for the next
five years, but about 4% of the titles project to have more than 3, and one high
outlier title has over 12. A high authorship number is often reason enough to
keep a journal, as cancellations of low Weighted Usage titles will by definition
have a low number of authorships.
Figure 7 focuses on the other two components of Weighted Usage, citations
and downloads, and plots one against the other in a scatter plot. There is a
weak positive relationship between the two; as downloads tend to rise, so too
do citations. One clear outlier in this dataset is the journal title with many
12Figure 6: Authorship count distribution
more citations than would otherwise be expected at over 800 (shown near the
top middle of Figure 7). This title, “Citing Practice,” is projected to be heavily
cited by the research institution, and as such, may be interesting to investigate
further. Low usage journals in the lower-left hand corner are generally marked
for cancellation, though they can be hard to difficult in this static screenshot.
The live tool would allow the user to zoom and pan to investigate further if
desired.
Moving further, Figure 8 shows the Weighted Usage calculation plotted
against each of its three components individually, as well as introduces a new
measurement. The four plots in Figure 8 are linked to each other, which means
that zooming in or panning around on one plot will execute the same action on
the other three connected plots. Breaking out the Weighted Usage calculation
and plotting separately against each of its components allow for users to more
deeply understand what is driving this summary metric. For example, it be-
comes evident that the outlier data point up around 10,000 Weighted Usage, the
highly cited title “Citing Practice,” is not driven by many downloads, or even
a large amount of authorships, but by the largest number of citations in this
group of journals by far. This then translates to the highest overall Weighted
Usage in this set of 431 journals.
The bottom-right plot in Figure 8 shows Weighted Usage vs. Open Access
percentage. This OA% measurement is one of several fulfillment methods pro-
vided by Unsub to estimate how much content in each journal is freely available
even a paid subscription. Unsub’s help files define OA% as an estimation of “the
percentage of usage that can be fulfilled via Green, Hybrid, or Bronze Open Ac-
13Figure 7: Citations vs. Downloads
Figure 8: Four linked plots: Weighted Usage vs. downloads, citations,
authorships, and Open Access percentage
14cess” (Piwowar, 2021). Unsub also notes that users can choose to exclude some
of these access types in their dashboard projections if they wish; Bronze OA, for
example, may be considered an unreliable mode of access for some institutions
as it can be removed by the publisher at any time. (More information on the
definitions of Open Access colors can be found at the Unpaywall website (Jason
Priem, 2021)).
In this example, most journals with very low Weighted Usage continue to
be marked for cancellation, but those with OA% over 70% are also marked to
cancel even as Usage begins to rise. In that region, Usage may be rising but
Open Access availability rises as well. Making decisions on this criteria does
require more work to understand exactly how the journal is providing Open
Access content, and an institution must make sure they are comfortable with
relying on that mode of fulfillment before they mark the title for cancellation.
4.3 Instant Fill Percentage
The Instant Fill percentage (IF%) is an advanced measure of how much value
a journal’s current year subscription actually holds. Unsub refers to this im-
portant IF% in passing, but it is not explicitly calculated and provided to the
user in the exported .csv file. An example of Unsub’s use can be seen earlier in
Figure 1, where it shows a 95% Instant Fulfillment (“Access”) rate even with the
decision to cancel 25% of the journals in the package at a savings of $450,000.
Some portion of researcher demand can still be met even without a current
subscription to that particular title. IF% takes this into account by considering
other routes of access such as Open Access availability or backfile access to
older issues of that journal the library purchased in previous years. If demand
for a journal can be satisfied by Open copies or through older years’ material,
a current year’s subscription is less cost-effective. In other words, IF% is a
measure of how much usage can only be met by having a current subscription
and how much each individual journal contributes to the current year’s usage
of the package as a whole.
Unsub Extender calculates the IF% for each journal individually to see which
titles contribute most to the overall package-level IF% rate. To calculate In-
stant Fill percentage for a given Journal A, we first find the percentage of
that journal’s usage which requires a current year subscription (Equation 2).
Once the current year’s usage for Journal A is found, it is divided by the
total weighted usage, the sum of all journals’ Weighted Usage in the package
(Equation 3):
100 − (OA%A + Backf ile%A )
CurrentY earA = ∗ U sageA (2)
100
CurrentY earA
IF %A = (3)
total weighted usage
Figure 9 shows the calculated IF% contributions for each journal title vs.
that title’s subscription cost. Individual journal titles contribute IF% values
15Figure 9: Raw Instant Fill % vs. Cost
Figure 10: Normalized Instant Fill % vs. Cost
in the range of 2% or less for the example package of 431 titles; that is, one
particular journal is responsible for 2% of an entire Big Deal’s current year
demand (the aforementioned very highly cited journal shown in the top right
corner of Figure 9). Journals to consider for cancellation are those that appear
on the bottom edge of the data, low on the y-axis (low IF% contributions).
If given a choice between two journals that are vertically separated, the title
higher on the y-axis would be a better choice, buying more IF% points for the
same amount of money.
To look at another angle of the data, Figure 10 normalizes the IF% for
16all journal titles to show how much it would cost for that journal to “buy”
1% point of contribution. For example, if the top journal contributes 2.1 IF%
points and costs nearly $20,000, it would normalize to $10,000 for one IF%
point. This approach is intended to enable comparisons among titles which cost
widely different prices and contribute widely different amounts of IF%. Under-
performing journals on this plot appear in the lower-right hand corner, meaning
their cost is high (to the right on the x-axis) for a small amount of benefit.
(Note: the x-axis on Figure 10 is shown in log(price) to stretch the axis and
increase visibility).
4.4 Histogram and Subject Areas
The last set of graphs are intended to serve as a final check once cancellation de-
cisions have been made. First, there is an approximate reproduction of Unsub’s
summary graph which shows journal titles as boxes color-coded by Subscrip-
tion decision status (Figure 11). This is intended to provide continuity back to
the Unsub tool, but offers more granularity in supported color-coding and fine-
tuning for various cancellation scenarios. Red cancelled titles tend to appear in
higher Cost per Use bins, though there are some exceptions.
Figure 11: Histogram of titles by CPU, similar to Unsub’s provided graph
Finally, special care needs to be taken to ensure that cancellation decisions
are not disproportionately impacting a certain subject area or discipline. Figure
12 shows the journal titles in the package graphed by CPU rank and subject
area, color-coded by Subscription decision status. These broad-level subject
area assignments are provided by Unsub and use the codes assigned to each
journal by the organization Excellence in Research for Australia (ERA) (Aus-
17tralian Research Council, 2018). (Previously, the subject codes were assigned
by Elsevier, and for the sake of presenting a consistent dataset throughout this
paper, Figure 12 uses those older subject codes.)
Figure 12: Journals by subject area
As with any attempt to classify journals into specific disciplines, it is impor-
tant to recognize that interdisciplinary titles are difficult to classify, and there
is always the possibility of overlap among several subjects that do not get com-
pletely captured in the encoding. The newer ERA assignments will classify a
single journal into multiple categories, though it will still be non-exhaustive.
In that case, Unsub Extender will display the same journal in multiple subject
area assignments. In Figure 12, we can see that four journals in this package
are classified as Mathematics, with two of them being marked for cancellation
and a third marked as MAYBE. Viewing the data from this angle may nudge
the green dot back to safety to avoid impacting a specific discipline too harshly.
Looking strictly at usage vs cost graphs or making decisions on data points
because they appear in a certain area of the chart is an attractive but simpli-
fied and reductive view of the complex procedures involved in collection anal-
ysis. Treating data as simple points on a graph can be useful for an initial
18high level look, but it is key to remember the critical importance of applying
subject-matter expertise in cancellation activities and not depending solely on
numbers. Applying human judgement to consider other data not represented
such as department size, understaffed or emerging research areas, or intangibles
like strategic initiatives to the university can help avoid mistakes in cancelling
journal titles. After all the hard number crunching and pattern detecting is
done, there is still no substitute for an actual human using their expertise and
experience for one final look.
5 Left Hand Panel
The left side of Unsub Extender consists of fly-out panel with control features
that include the Upload button, Subscribed status editor, sliders to filter the
data, and Export button.
5.1 Upload
Unsub subscribers can export their own unique .csv data file and choose the
Browse files button in the top left corner to actually upload their real data.
All graphs and tables will then automatically overwrite and update to reflect the
real Unsub measurements, automating the analysis and clearly showing which
journal titles may be considered for cancellation.
5.2 Subscribed
The Subscribed column within the exported .csv file is where decisions about
the renewal status of each journal are recorded. Unsub Extender uses that
information to color-code the data points in many graphs, and the definitions
that it supports are:
• TRUE (blue): a journal to continue subscribing to
• FALSE (red): a journal to cancel
• MAYBE (green): a journal to highlight or mark to think about later
• ::blank:: (gray), a journal with no decision assigned yet
The first two categories are consistent with Unsub’s internal structure and
follow those conventions, while the second two choices are added by Unsub
Extender itself for further flexibility. As users explore the Unsub data, it is
possible to dynamically change the Subscribed status of a journal using the
editor in the left-hand panel. Opening the Expand attribute reveals a text box
to search for a journal name, and the radio buttons below allow a choice of
status to move to. Figure 13 shows the journal “Scholar Trends” being changed
to a MAYBE.
19Figure 13: Subscribed status editor
5.3 Sliders
After an overview of the graphs, a user may want to filter the data to more
deeply focus on a certain area of interest.
Dual-sided sliders can be seen in pink on the left-hand side of Figure 2 and
allow for easy investigation and filtering based on measures such as price, cost-
per-use rank, downloads, citations, authorships, weighted usage, Open Access
percentage, and Subscribed status. Changing any of the criteria will automati-
cally update all graphs and tables as well, with only those data points matching
the specified criteria included in subsequent analysis.
5.4 Export
After users explore, decide, and modify journal subscription states, the Export
option will create a new copy of the data file with decisions saved and updated.
This can then be used for further analysis, to re-upload to Unsub Extender
in the future, or to save for decision records. The button will generate a link
underneath, which the user then clicks to download a randomly-named file.
6 Demonstration of Unsub Extender
To demonstrate how Unsub Extender facilitates the exploration of Unsub data,
let us follow a single journal title through the process of evaluation with the
provided graphs. The fictional title “Science Advance” was briefly referred to
earlier in the paper (Section 4.1) as a title that had been marked for cancellation,
even though its calculated measurements placed it among other titles that were
being renewed.
Figure 4 shows this red dot in a sea of blue, located at $8,000 subscription
cost and 2,000 Weighted Usage. Hovering over the data point on the actual
Unsub Extender site would show modest downloads and fairly strong citations
20and authorships, consistent with a healthy Weighted Usage number. However,
we would see the CPU rank assigned by Unsub to be 405 out of 431, meaning
it is in the bottom 6% of all journals in the package in terms of total cost
effectiveness.
(One tip to follow a single title through the set of graphs is to use the
Subscribed status editor (Figure 13) to temporarily mark the title as MAYBE;
this turns the data point to green in all the visualizations and makes it easier
to track from chart to chart.)
The linked plot showing Weighted Usage vs. OA% (Figure 8) reveals the
reason for its inefficiency. This journal has an estimated Open Access avail-
ability of 88%, meaning nearly 9 in 10 projected “uses” could be filled for free
even without a current year’s subscription. The Instant Fill Percentage graphs
also demonstrate this title is located among others that have been marked for
cancellation, as it contributes only 0.06% to IF and has a very high Normalized
IF% at $134,000 per 1 IF%.
This example shows why solely using the traditional cost-per-use, or even
the more sophisticated Weighted Usage, is not always enough to make informed
decisions. Bringing in alternate modes of fulfillment provides additional context
and clarity and completes the picture to help a library understand if really needs
to continue subscribing to this journal.
6.1 Python Libraries and Hosting
Finally, a few details on the technical aspects of Unsub Extender are provided.
Unsub Extender is written in Python, which offers thousands of open source
libraries to extend its built-in functionality. The tool uses the Python libraries
Altair and Streamlit for its structure.
Data visualization is an active area of Python development with hundreds of
plotting libraries to choose from (PyViz, 2021), and it was a non-trivial process
to narrow down the many libraries to arrive at a graphing library that would
support the vision of this project. Altair is a “declarative statistical visualiza-
tion library for Python, based on Vega and Vega-Lite” (Altair Developers, 2021)
and provides the underlying code for all the graphs. Altair supports interac-
tivity (zoom, pan, hover) and builds on top of the simple Vega-Lite declarative
calls, with a clear grammar and many worked examples to build from. The
interactivity was a crucial component, as other common libraries such as Mat-
plotlib render as static images and therefore would not support the interactivity
that was required to enable hover, pan, and zoom.
Streamlit is a library that “turns data scripts into shareable web apps”
(Streamlit Inc., 2021). Streamlit provides the structure to turn Unsub Exten-
der’s Python script into an actual web application and enables the addition of
filters, sliders, and file uploading. Streamlit offers free basic web hosting for
initial projects, but the capacity was quickly overrun with demand when even a
few people accessed the site simultaneously. Therefore, hosting is now provided
by Iowa State University’s College of Liberal Arts and Sciences Information
Technology Department.
217 Conclusion
This paper has formally introduced the tool Unsub Extender and demon-
strated how it can assist libraries in analyzing journal subscription data pro-
vided by the collection analysis tool, Unsub. Exploring the rich Unsub data can
be intimidating, but Unsub Extender allows an academic institution to simply
upload their exported data to fill in the pre-made graphs for a plug-and-play
experience. The tool quickly provides insight into the many complex and in-
terrelated data points from Unsub, and it guides users through the analysis to
quickly arrive at consistent and understandable conclusions.
Unsub Extender proposes best practice in analyzing the increasingly common
Unsub data file, and it is intended to assist libraries around the world in making
informed collection development decisions and extracting maximum value from
their read-access journal subscriptions. In short, Unsub provides data that can
help libraries break up their Big Deal, and Unsub Extender helps translate that
data into graphs to make the analysis more easily digestible to see how breaking
up the Big Deal may affect the institution.
7.1 Reception
Launched in May 2021, Unsub Extender has seen over 1,000 hits from 32 coun-
tries in its first three months. The majority of overall traffic has come from
the United States, but the most recent month has seen a shift in traffic to a
majority from outside the United States, with a large amount of usage from the
UK. So far, feedback from users has been limited but positive.
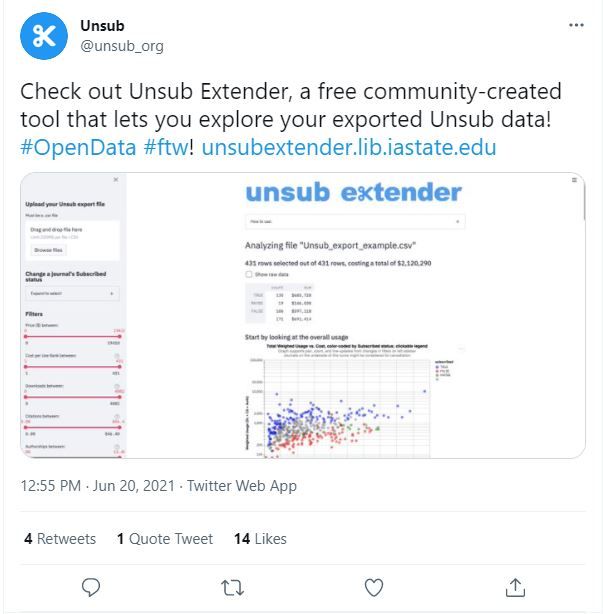
Unsub and the team at OurResearch have been enthusiastic supporters of
Unsub Extender, promoting the tool in a Tweet (Figure 14) and providing a
link to the site directly from the Unsub Export tab itself. The author delivered
a joint presentation with Unsub co-founder Heather Piwowar at NASIG 2021
(Piwowar et al., 2021) on case studies of how Unsub is used in real life, and it
served as first announcement of Unsub Extender to the academic community.
7.2 Limitations and Future Work
Unsub’s release is stable, and new or upgraded features form the basis of future
work. Enabling analysis of multiple supported publisher packages at once cur-
rently works by uploading one combined Unsub file, but the resulting analysis is
complicated as there is no way to segment by publisher that would also support
a single-publisher use. Adding a layer of data point encoding to the graphs in
addition to color is also under consideration. A symbol type (such as x, o, +)
would provide an additional layer of detail for those who may not easily perceive
color changes.
Feedback on the tool is always welcome. If users develop a new type of
graph that proves useful at their institution, more graphs could be coded and
added to the site fairly easily. Learning which graphs are proving useful to
actual users and how other libraries use their Unsub data would be helpful.
22Figure 14: Unsub Tweet
Testing has been done on data sets from the author’s institution, but at this
time it is unknown how well Unsub Extender would scale when packages become
very large (1,000s of journals at once). Soliciting more users, sample data, and
feedback would help test the effectiveness of the tool and may reveal better or
more straightforward ways of doing things.
Finally, the author hopes that future work will simply involve Unsub Ex-
tender being used to assist libraries in freeing up money in their acquisition
budgets away from under-performing journals in large commercial packages and
re-purposing toward more sustainable Open publishing models, thereby accel-
erating the transition toward Open Access.
7.3 Acknowledgements
The author wishes to thank Unsub and the team at OurResearch for being
supportive of the development of Unsub Extender, as well as Nick Booher and
the Iowa State University College of Liberal Arts and Sciences Information
Technology Department for providing robust web hosting.
7.4 Conflicts of Interest
The author declares no conflict of interest.
237.5 Data Availability
The source code for Unsub Extender and the sample dataset used to demon-
strate the functionality are available on GitHub (Schares, 2021b).
References
Altair Developers (2021). Altair: Declarative visualizations in Python. https:
//altair-viz.github.io/. Accessed: 2021-08-06.
Association of Research Libraries (2019). Graph 4: Expenditure trends in
ARL university libraries, 1998-2018. https://www.arl.org/wp-content/
uploads/2019/10/expenditure-trends.pdf. Accessed: 2021-08-16.
Australian Research Council (2018). ERA 2018 Journal List. https://www.
arc.gov.au/excellence-research-australia/era-2018-journal-list.
Accessed: 2021-08-26.
Bergstrom, T. C., Courant, P. N., McAfee, R. P., and Williams, M. A. (2014).
Evaluating big deal journal bundles. Proceedings of the National Academy of
Sciences of the United States of America, 111(26):9425–9430.
Buranyi, S. (2017). Is the staggeringly profitable business of scientific publishing
bad for science? https://www.theguardian.com/science/2017/jun/27/
profitable-business-scientific-publishing-bad-for-science. The
Guardian, Accessed: 2021-08-16.
CERN (2021). Zenodo. https://zenodo.org/.
Chawla, D. S. (2020). This tool is saving universities millions of dollars in
journal subscriptions. Science.
Douglas, K. (1990). The serials crisis. The Serials Librarian, 18(1-2):111–121.
Druskat, S. (2021). Citation File Format (CFF). https://
citation-file-format.github.io/. Accessed: 2021-08-04.
Edlin, A. and Rubinfeld, D. (2004). Exclution or efficient pricing: The “big
deal” bundling of academic journals. Antitrust Law Journal, 72.
Elsevier (2021). 1Science.com home. http://1science.com. Accessed: 2021-
08-26.
Fenner, M. (2021). A step forward for software citation: Github’s enhanced
software citation support. https://blog.front-matter.io/mfenner/
step-forward-for-software-citation.
Frazier, K. (2001). The librarians’ dilemma: Contemplating the costs of the
“big deal”. D-Lib Magazine, 7.
24Hamaker, C. (1988). Serials costs and the carrying ability of serials budgets
1987. The Serials Librarian, 13(2-3):129–134.
Hardaway, G. (2020). Unsub. The Charleston Advisor, 22(2):55–58.
Ivanov, A. O., Johnson, C. A., and Cassady, S. (2020). Unbundling practice: the
unbundling of big deal journal packages as an information practice. Journal
of Documentation.
Jason Priem (2021). What do the types of oa status
(green, gold, hybrid, and bronze) mean? https:
//support.unpaywall.org/support/solutions/articles/
44001777288-what-do-the-types-of-oa-status-green-gold-hybrid-and-bronze-mean-.
Accessed: 2021-08-30.
Kyrillidou, M. and Young, M. (2006). ARL statistics, 2004-05. Technical report,
Association of Research Libraries, Washington, D.C., USA.
Larivière, V., Haustein, S., and Mongeon, P. (2015). The oligopoly of academic
publishers in the digital era. PLOS ONE, 10(6):e0127502.
Lener, E. and Stovall, C. (2012). Never let a serials crisis go to waste: Building
support for library collections at virginia tech. In Necessity is the Mother of
Invention, pages 62–68.
Li, K., Greenberg, J., and Lin, X. (2016). Software citation reuse and metadata
considerations an exploratory study examining LLAMPS. ASIST.
Noorden, R. V. (2013). Open access: the true cost of science publishing. Nature,
495.
Ohler, L. A., DePope, L. A., Rupp-Serrano, K., and Pitts, J. (2019). Canceling
the big deal: Three R1 libraries compare data, communicaton, and strategies.
In Proceedings of the Charleston Library Conference, pages 195–200.
Orduña-Malea, E. and Costas, R. (2021). Link-based approach to study scien-
tific software usage: the case of vosviewer. Scientometrics.
OurResearch (2020). Unsub. https://unsub.org. Accessed: 2021-06-16.
Panitch, J. M. and Michalak, S. (2005). The serials crisis. Technical report,
University of North Carolina-Chapel Hill.
Pedersen, W. A., Arcand, J., and Forbis, M. (2014). The big deal, interlibrary
loan, and building the user-centered journal collection: A case study. Serials
Review, 40(4):242–250.
Piwowar, H. (2021). What are the columns in download
as spreadsheet? http://help.unsub.org/en/articles/
4246610-what-are-the-columns-in-download-as-spreadsheet. Ac-
cessed: 2021-08-25.
25Piwowar, H., Harris, J., and Schares, E. (2021). Unsub in real life: using Unsub
as part of serials decisions and negotiations. Presented at NASIG 2021 Virtual
Conference.
Poynder, R. (2011). The big deal: Not price but cost. Information Today, 28.
Priem, J. (2021). Where do we get your faculty’s citation
and authorship data? http://help.unsub.org/en/articles/
4055293-where-do-we-get-your-faculty-s-citation-and-authorship-data.
Accessed: 2021-08-26.
Priem, J. and Piwowar, H. (2020). Grant: Suite of interconnected OurRe-
search tools. https://www.ogrants.org/grants/piwowar_heather_2020.
Accessed: 2021-06-16.
PyViz (2021). Overviews. https://pyviz.org/overviews/index.html. Ac-
cessed: 2021-08-10.
RELX Group (2021). Key financial data. https://www.relx.com/investors/
key-financial-data. Adjusted operating margin, Accessed: 2021-08-19.
Roth, D. L. (1990). The serials crisis revisited. The Serials Librarian, 18(1-
2):123–129.
Schares, E. (2021a). Unsub Extender. https://unsubextender.lib.iastate.
edu. https://doi.org/10.5281/zenodo.5167934.
Schares, E. (2021b). Unsub Extender. https://github.com/eschares/unsub_
extender. GitHub repository.
Science-Metrix Inc. (2019). 1figr report: Instructions & Methods. Internal
report.
Shu, F., Mongeon, P., Haustein, S., Siler, K., Alperin, J. P., and Larivière, V.
(2018). Is it such a big deal? on the cost of journal use in the digital era.
College & Research Libraries.
Sjoberg, C. (2017). E-journals and the big deal: A review of the literature.
Information Student Research Journal, 6.
Smith, A. (2021). Enhanced support for citations on github. https:
//github.blog/2021-08-19-enhanced-support-citations-github/. Ac-
cessed: 2021-08-25.
SPARC (2020). Unsub gives libraries powerful evidence to walk away from big
deals. SPARCOpen.
SPARC (2021). Big deal cancellation tracking. https://sparcopen.org/
our-work/big-deal-cancellation-tracking/.
26Streamlit Inc. (2021). Welcome to Streamlit. https://docs.streamlit.io/
en/stable/. Accessed: 2021-08-04.
Toni, F. (2012). Leaving elsevier’s ”big deal”: an evaluation of the italian na-
tional institute of health experience inside the bibliosan consortium. 4th In-
ternational Conference on Qualitative and Quantitative Methods in Libraries.
van Eck, N. J. and Waltman, L. (2010). Software survey: VOSviewer, a com-
puter program for bibliometric mapping. Scientometrics, 84.
27You can also read