A cross-study analysis of drug response prediction in cancer cell lines
←
→
Page content transcription
If your browser does not render page correctly, please read the page content below
Journal Title Here, 2021, 1–12
                                                                                                                                                      doi: DOI HERE
                                                                                                                    Advance Access Publication Date: Day Month Year
                                                                                                                                                             Preprint

                                            A cross-study analysis of drug response prediction in
                                            cancer cell lines
                                            Fangfang Xia,1 Jonathan Allen,2 Prasanna Balaprakash,1 Thomas Brettin,1
                                            Cristina Garcia-Cardona,3 Austin Clyde,1,5 Judith Cohn,3 James Doroshow,4
arXiv:2104.08961v1 [q-bio.QM] 18 Apr 2021

                                            Xiaotian Duan,5 Veronika Dubinkina,6 Yvonne Evrard,7 Ya Ju Fan,2
                                            Jason Gans,3 Stewart He,2 Pinyi Lu,7 Sergei Maslov,6 Alexander Partin,1
                                            Maulik Shukla,1 Eric Stahlberg,7 Justin M. Wozniak,1 Hyunseung Yoo,1
                                            George Zaki,7 Yitan Zhu1 and Rick Stevens1,5
                                            1
                                              Argonne National Laboratory, 2 Lawrence Livermore National Laboratory, 3 Los Alamos National Laboratory,
                                            4
                                              National Cancer Institute, 5 University of Chicago, 6 University of Illinois at Urbana-Champaign and
                                            7
                                              Frederick National Laboratory for Cancer Research

                                            FOR PUBLISHER ONLY Received on Date Month Year; revised on Date Month Year; accepted on Date Month Year

                                            Abstract
                                            To enable personalized cancer treatment, machine learning models have been developed to predict drug
                                            response as a function of tumor and drug features. However, most algorithm development efforts have relied
                                            on cross validation within a single study to assess model accuracy. While an essential first step, cross validation
                                            within a biological data set typically provides an overly optimistic estimate of the prediction performance
                                            on independent test sets. To provide a more rigorous assessment of model generalizability between different
                                            studies, we use machine learning to analyze five publicly available cell line-based data sets: NCI60, CTRP,
                                            GDSC, CCLE and gCSI. Based on observed experimental variability across studies, we explore estimates
                                            of prediction upper bounds. We report performance results of a variety of machine learning models, with
                                            a multitasking deep neural network achieving the best cross-study generalizability. By multiple measures,
                                            models trained on CTRP yield the most accurate predictions on the remaining testing data, and gCSI is
                                            the most predictable among the cell line data sets included in this study. With these experiments and
                                            further simulations on partial data, two lessons emerge: (1) differences in viability assays can limit model
                                            generalizability across studies, and (2) drug diversity, more than tumor diversity, is crucial for raising model
                                            generalizability in preclinical screening.

                                            Key words: drug response prediction, deep learning, drug sensitivity, precision oncology

                                            Introduction                                                                   mimic patient drug response with varying fidelity. Second, deep
                                            Precision oncology aims at delivering treatments tailored to                   learning has emerged as a natural technique to capitalize on the
                                            the specific characteristics of a patient’s tumor. This goal                   data. Compared with traditional statistical models, the high
                                            is premised on the idea that, with more data and better                        capacity of neural networks enable them to better capture the
                                            computational models, we will be able to predict drug response                 complex interactions among molecular and drug features.
                                            with increasing accuracy. Indeed, two recent trends support this                  The confluence of these factors has ushered in a new
                                            premise. First, high-throughput technologies have dramatically                 generation of computational models for predicting drug
                                            increased the amount of pharmacogenomic data. A multitude                      response. In the following, we provide a brief summary of recent
                                            of omic types such as gene expression and mutation profiles                    work in this field, with a focus on representative studies using
                                            can now be examined for potential drug response predictors.                    cancer cell line data.
                                            On the prediction target side, while clinical outcomes are still                  The NCI60 human tumor cell line database [1] was one
                                            limited, screening results abound in preclinical models that                   of the earliest resources for anticancer drug screen. Its rich

                                            © The Author 2021. Published by Oxford University Press. All rights reserved. For permissions, please e-mail: journals.permissions@oup.com    1
2 Xia et al.
Table 1. Characteristics of drug response data sets included in the cross-study analysis
Data Set Cells Drugs Dose Response Samples Drug Response Groups1 Viability Assay
NCI60 60 52,671 18,862,308 3,780,148 Sulforhodamine B stain
CTRP 887 544 6,171,005 395,263 CellTiter Glo
CCLE 504 24 93,251 11,670 CellTiter Glo
GDSC 1,075 249 1,894,212 225,480 Syto60
gCSI 409 16 58,094 6,455 CellTiter Glo
1
We define a response group as the set of dose response samples corresponding to a particular pair of drug and cell line.
molecular characterization data have allowed researchers to line or drug data. This information will be essential for future
compare the predictive power of different assays. For example, studies to prioritize screening experiments.
gene expression, protein, and microRNA abundance have been In this study, we seek to provide a rigorous assessment
shown to be effective feature types for predicting both single of the performance range for drug response prediction given
and paired drug response [2, 3]. In the last decade, new the current publicly available data sets. Focusing on five cell
resources including Cancer Cell Line Encyclopedia (CCLE) line screening studies, we first estimate within- and cross-
[4, 5], Genomics of Drug Sensitivity in Cancer (GDSC) [6], study prediction upper bounds based on observed response
and Cancer Therapeutics Response Portal (CTRP) [7, 8], have variability. After integrating different drug response metrics, we
significantly expanded the number of screened cancer cell lines. then apply machine learning to quantify how models trained
Drug response prediction has moved beyond per-drug or per- on a given data source generalize to others. These experiments
cell line analysis [9, 10] to include integrative models that take provide insights on the data sets that are more predictable
both drug and cell line as input features. Community challenges or contain more predictive value. To understand the value of
have further inspired computational approaches [11, 12]. A wide new experimental data, we further use simulations to study the
range of new machine learning techniques have been explored, relative importance of cell line versus drug diversity and how
including recommendation systems [13], ranking methods [14, their addition may impact model generalizability.
15], generative models [10, 16], ensemble models [17, 18, 19,
20, 21], and deep learning approaches [22, 23, 24, 25, 26], with
some incorporating novel design ideas such as attention [27] Data integration
and visual representation of genomic features [28]. A number
of excellent review articles have recently been published on the Pan-cancer screening studies have been comprehensively
topic of drug response prediction, with substantial overlap and reviewed by Baptista et al. [35]. In this study, we focus
special emphases on data integration [29], feature selection [30], on single-drug response prediction and include five public
experimental comparison [31], machine learning methods [32], data sets: NCI60, CTRP, GDSC, CCLE, and gCSI. The
systematic benchmarking [33], combination therapy [34], deep characteristics of the drug response portion of these studies
learning results [35], and meta-review [36]. are summarized in Table 1. These data sets are among the
Despite the tremendous progress in drug response prediction, largest in response sample size of the nine data sources reviewed
significant challenges remain: (1) Inconsistencies across studies and, therefore, have been frequently used by machine learning
in genomic and response profiling have long been documented studies. Together, they also capture a good representation of
[37, 38, 39, 40]. The Genentech Cell Line Screening Initiative the diversity in viability assay for response profiling.
(gCSI) [41] was specifically designed to investigate the
discordance between CCLE and GDSC by an independent Data acquisition and selection
party. While harmonization practices help [42, 43, 44], a
significant level of data variability will likely remain in the Of the five drug response data sets included in this study,
foreseeable future due to the complexity in cell subtypes NCI60 was downloaded directly from the NCI FTP, and the
and experimental standardization. (2) The cross-study data remaining four were from PharmacoDB [42]. We use GDSC and
inconsistencies suggest that a predictive model trained on CTRP to denote the GDSC1000 and CTRPv2 data collections
one data source may not perform as well on another. Yet, in PharmacoDB, respectively.
most algorithm development efforts have relied on cross The different experimental designs of these studies resulted
validations within a single study, which likely overestimate in differential coverage of cell lines and drugs. While NCI60
the prediction performance. Even within a single study, screened the largest compound library on a limited number
validation R2 (explained variance) rarely exceeds 0.8 when of cell lines, CCLE and gCSI focused on a small library of
strict data partition is used [35], indicating difficulty in model established drugs with wider cell line panels. The remaining two
generalization. (3) Without a single study that is sufficiently studies, CTRP and GDSC, had more even coverage of hundreds
large, a natural next step is to pool multiple data sets to learn of cell lines and drugs.
a joint model. Multiple efforts have started in this direction, There is considerable overalap in cell lines and drugs covered
although the gains to date from transfer learning or combined by the five data sets. A naive partitioning of the samples by
learning have been modest [45, 46, 47]. (4) It is also unclear how identifier would thus lead to leakage of training data into the
model generalization improves with increasing amounts of cell test set by different aliases. Thanks to PharmacoDB’s curation
and integration effort, such alias relationships can be clearly
identified through name mapping.Cross study analysis of drug response prediction 3
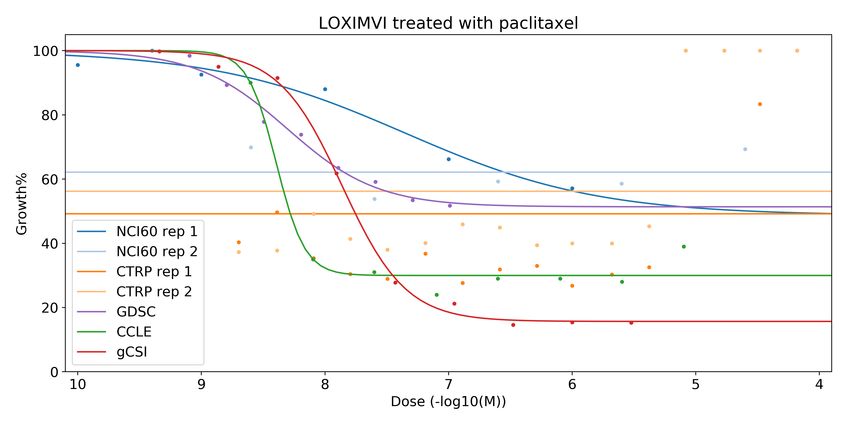
Fig. 1: Fitted dose response curves from multiple studies. This example shows the dose response of the LOXIMVI melanoma
cell line treated with paclitaxel. Curves have been consistently fitted across the studies. Experimental measurements from multiple
sources and replicates are not in complete agreement.
To create a working collection of samples, we first defined a two metrics were directly borrowed from PharmacoDB, but
cell line set and a drug set. Our cell line selection is the union they had to be recomputed in this study because PharmacoDB
of all cell lines covered by the five studies. For drugs, however, does not cover NCI60. We used the same Hill Slope model
NCI60 screened a collection of over 50,000 drugs that would be with three bounded parameters [42] to fit the dose response
too computationally expensive for iterative analysis. Therefore, curves. We also added another dose-independent metric, AUC,
we selected a subset of 1,006 drugs from NCI60, favoring FDA- to capture the area under the curve for a fixed concentration
approved drugs and those representative of diverse drug classes. range ([10−10 , 10−4 ]µM ). AUC can be viewed as the average
From the remaining four studies, we included all the drugs. This growth and can be compared across studies.
resulted in a combined set of 1,801 drugs.
Results
Drug response integration
Response prediction upper bounds
For cell line-based anticancer screening, drug sensitivity is
quantified by dose response values that measure the ratio of Despite the integration efforts, significant differences in
surviving treated to untreated cells after exposure to a drug measured drug response remain. Fig. 1 illustrates this
treatment at a given concentration. The dose response values heterogeneity across replicates as well as studies in an example
can be further summarized, for a particular cell-drug pair, to cell line-drug combination. Given the degree of variability in
form dose-independent metrics of drug response. drug response measurements, it is natural to ask what’s the
All five studies provided dose response data, but with best prediction models could do with infinite data. We explored
different ranges. To facilitate comparison across studies, dose this question based on within- and cross-study replicates.
response values were linearly rescaled to share a common range
from −100 to 100. Within-study response variability among replicates
Dose-independent metrics were more complicated. For Three of the studies (NCI60, CTRP, GDSC) contained replicate
example, whereas GDSC used IC50 (dose of 50% inhibition of samples where the same pair of drug and cell line were assayed
cell viability), NCI60 used GI50 (dose at which 50% of the multiple times. This data allowed us to estimate within-study
maximum growth inhibition is observed). Given the lack of response variability as summarized in Table 2. The fact that
consensus, we adopted PharmacoDB’s practice to recompute these studies used three different viability assays was also an
the aggregated dose-independent metrics for each study from opportunity to sample the associations between variability level
the individual dose response values, removing inconsistencies in and assay technology.
calculation and curve fitting [42]. Overall, NCI60 had the lowest standard deviation in dose
Among these summary statistics, AAC is the area above response at 0.145 for an average replicate group after rescaling
the dose response curve for the tested drug concentrations, response values linearly in all three studies to a common range.
and DSS (drug sensitivity score) is a more robust metric To establish a ceiling for the performance of machine learning
normalized against dose range [48]. The definitions of these models, we computed how well the mean dose response of a4 Xia et al.
Table 2. Dose response variability among replicates in the same study
Study Samples with Replicates Mean Response R2 Explaining Response R2 for Samples with
Replicates per Group S.D. in Group with Group Mean Replicates
NCI60 41.56% 2.62 14.5 0.959 0.931
CTRP 4.09% 2.05 18.8 0.996 0.862
GDSC 2.62% 2.00 21.9 0.996 0.810
Table 3. Dose-independent response variability in identical cell-drug pairs across studies
Source Study Target Study Overlapping Cell-Drug Groups R2 on AUC1 R2 on AAC R2 on DSS2
CTRP CCLE 2,338 0.5944 0.6408 0.6347
CTRP GDSC 17,259 0.3016 0.0186 0.0062
1
AUC (area under drug response curve) is not a direct complement of AAC (area above drug response curve). They are defined on
different concentration ranges: AUC for a fixed range ([10−10 , 10−4 ]µM ), and AAC for study-specific, tested concentration ranges.
2
DSS (drug sensitivity score) is a normalized variation of AAC defined by Yadav et al. [48].
replicate group would predict individual response values. This reviewed in the introduction section have offered wide-ranging
resulted in an R2 score of 0.959 for NCI60. The equivalent values configurations on these two factors. Most of these models,
for CTRP and GDSC were much higher, but only for the fact however, stopped at evaluation by cross-validation within a
that they had much lower fractions of samples with replicates. single study. Given the cross-study variability observed, such
When we confined the analysis to just non-singleton replicate evaluation likely overestimated the utility of drug response
groups, the R2 scores dropped significantly with GDSC being models for practical scenarios involving more than one data sets.
the lowest at 0.81. While it’s unclear how well these replicate To test how well models trained on one data set could
groups represent the entire study, we should expect machine generalize to another, we went beyond study boundaries
learning models to not exceed the R2 score in cross validation. and tested all combinations of source and target sets. This
introduced a third factor impacting model performance was
Cross-study response variability brought into play, i.e., the distribution shift between the source
For comparing drug response across different studies, dose- and target data sets. To provide a rigorous assessment of
dependent metrics are less useful, because each study generally cross-study prediction performance, we applied three machine
has its own experimental concentrations. Instead, we opted for learning models of increasing complexity. The first two, Random
the three aforementioned dose-independent response metrics: Forest [49] and LightGBM [50], were used as baseline models.
AUC, AAC, and DSS. A key difference between AUC and The third one, designed in-house, represented our best effort at
AAC is that AUC is based on a fixed dose range while AAC a deep learning solution.
is calculated for the drug-specific dose window screened in a
particular study. DSS is another metric that integrates both
drug efficacy and potency, with evidence of more differentiating
Baseline machine learning performance
power in understanding drug functional groups [48].
The first baseline performance using Random Forest is shown
Using these three metrics, we analyzed cross-study response
in Table 4. Each cell in the matrix represents a learning and
consistency in identical cell line and drug pairs. Table 3
evaluation experiment involving a source study for training and
summarizes two representative cases. In the first scenario,
a target study for testing. The prediction accuracy for dose
we used response values from CTRP to directly predict the
response was assessed using both R2 score and mean absolute
corresponding metrics in CCLE. In this case, the source and
error (MAE). Again, the range for drug response values was
target studies shared a common viability assay. Yet, R2 on all
unified across studies to be from −100 to 100.
three metrics were only around 0.6, with AAC being the highest.
As expected, the diagonal cells have relatively high scores for
In the second scenario, where the target study GDSC used a
they represent cross validation done on the same data set. We
different viability assay, the response projections were markedly
are more interested in the non-diagonal values because they are
worse: the best R2 score was slightly above 0.3 achieved on
less likely to be an artifact of overfitting. The non-diagonal cells
AUC, and the other two scores were close to zero. Again, these
of the matrix are color coded as follows: green for R2 > 0.1,
numbers only gave rough estimates based on partial data; they
red for R2 < −0.1, and yellow otherwise. As we mentioned
nevertheless calibrated what we could expect from machine
in the data setup, since each cross-study validation experiment
learning models performing cross-study prediction.
involved training multiple models and filling out a matrix of
inference results, we limited ourselves to a subset of drugs from
Cross-study prediction of drug response NCI60. For the remaining five studies, all cell lines and drugs
We applied machine learning models to predict dose response. were included. As for input features, we used cell line gene
When evaluated in the context of a single data set, the expression profiles, drug chemical descriptors and molecular
prediction performance is dependent on two general factors: fingerprints. For details on feature processing, see the Methods
the input features and the model complexity. The models we section.Cross study analysis of drug response prediction 5
Table 4. Baseline cross-study validation results with Random Forest
Testing Set
Training Set NCI60 CTRP GDSC CCLE gCSI
R2 = 0.45 R2 = 0.23 R2 = 0.15 R2 = 0.29 R2 = 0.14
NCI60
MAE = 30.4 MAE = 34.6 MAE = 37.3 MAE = 34.3 MAE = 54.0
R2 = 0.41 R2 = 0.30 R2 = 0.15 R2 = 0.45 R2 = 0.17
CTRP
MAE = 31.7 MAE = 35.0 MAE = 37.4 MAE = 29.0 MAE = 39.6
R2 = 0.33 R2 = 0.14 R2 = 0.13 R2 = 0.17 R2 = 0.08
GDSC
MAE = 36.0 MAE = 41.5 MAE = 40.4 MAE = 42.4 MAE = 43.0
R2 = 0.12 R2 = -0.03 R2 = -0.11 R2 = 0.17 R2 = 0.32
CCLE
MAE = 42.6 MAE = 48.9 MAE = 47.1 MAE = 42.4 MAE = 38.5
R2 = -0.38 R2 = -0.51 R2 = -0.59 R2 = -0.09 R2 = 0.25
gCSI
MAE = 55.0 MAE = 59.0 MAE = 58.7 MAE = 48.6 MAE = 39.9
Table 5. Cross-study validation results with LightGBM
Testing Set
Training Set NCI60 CTRP GDSC CCLE gCSI
R2 = 0.80 R2 = 0.36 R2 = 0.21 R2 = 0.45 R2 = 0.42
NCI60
MAE = 18.0 MAE = 32.9 MAE = 34.6 MAE = 34.6 MAE = 35.6
R2 = 0.39 R2 = 0.67 R2 = 0.19 R2 = 0.58 R2 = 0.56
CTRP
MAE = 31.3 MAE = 23.3 MAE = 35.4 MAE = 29.4 MAE = 29.3
R2 = 0.31 R2 = 0.23 R2 = 0.52 R2 = 0.51 R2 = 0.57
GDSC
MAE = 35.0 MAE = 36.9 MAE = 27.6 MAE = 32.6 MAE = 30.0
R2 = -0.03 R2 = 0.00 R2 = -0.04 R2 = 0.67 R2 = 0.46
CCLE
MAE = 46.0 MAE = 44.8 MAE = 43.6 MAE = 25.6 MAE = 33.5
R2 = -0.07 R2 = -0.11 R2 = -0.06 R2 = 0.30 R2 = 0.78
gCSI
MAE = 46.0 MAE = 45.6 MAE = 45.7 MAE = 39.9 MAE = 20.0
Table 6. Cross-study validation results with a multitasking deep learning model
Testing Set
Training Set NCI60 CTRP GDSC CCLE gCSI
R2 = 0.81 R2 = 0.38 R2 = 0.24 R2 = 0.48 R2 = 0.46
NCI60
MAE = 17.1 MAE = 32.2 MAE = 35.3 MAE = 33.4 MAE = 33.4
R2 = 0.44 R2 = 0.68 R2 = 0.23 R2 = 0.61 R2 = 0.60
CTRP
MAE = 29.8 MAE = 22.7 MAE = 34.4 MAE = 28.3 MAE = 28.5
R2 = 0.32 R2 = 0.25 R2 = 0.53 R2 = 0.50 R2 = 0.60
GDSC
MAE = 34.0 MAE = 36.7 MAE = 27.2 MAE = 32.6 MAE = 29.2
R2 = 0.27 R2 = 0.20 R2 = 0.11 R2 = 0.68 R2 = 0.39
CCLE
MAE = 36.9 MAE = 39.2 MAE = 38.9 MAE = 25.4 MAE = 34.2
R2 = 0.00 R2 = 0.11 R2 = 0.05 R2 = 0.33 R2 = 0.80
gCSI
MAE = 44.9 MAE = 43.1 MAE = 42.8 MAE = 40.6 MAE = 19.26 Xia et al.
Random Forest models trained on CTRP, NCI60 and GDSC How model generalizability improves with more data
achieved moderate cross-study prediction accuracy. CTRP- Experimental screening data are expensive to acquire. It is thus
trained models performed the best, scoring the highest cross- critical to understand, from a machine learning perspective, how
study R2 of 0.45 when CCLE was used as the testing set. additional cell line or drug data impact model generalizability.
CCLE-trained models had less generalization value, and the Data scaling within a single study have been previous explored
ones trained on gCSI did not generalize at all. This was not [51]. In our cross-study machine learning predictions, we
surprising as gCSI had the smallest number of drugs and thus observed that the models with poor generalizability tended to
prone to overfitting. have been trained on a small number of drugs (CCLE and
LightGBM is a gradient boosting version of tree based gCSI). To study the relative importance of cell line versus
learning algorithm and is generally considered superior to drug diversity, we conducted simulations on CTRP, the most
Random Forest. Here, the LightGBM models outperformed predictive dataset of the five. We varied the fraction of randomly
Random Forest for most of the cells (Table 5). However, in selected cell lines and kept all the drugs, and vice versa. The
the Random Forest matrix, the diagonal values were generally results are plotted in Fig. 2.
comparable to other cells, suggesting there was little overfitting Models trained on a small fraction of cell lines but all drugs
(with the exception the gCSI row). In contrast, each diagonal could still quickly approach the full model performance, whereas
cell in the LightGBM matrix was better than other cells in models trained on limited drug data suffered from low accuracy
their row or column. This was consistent with the view that and high uncertainty. In either case, it was far more difficult to
cross validation within a study was an easier task than cross- predict response in a target dataset using a different viability
study generalization. Overall, the average improvement in R2 assay (GDSC) than one with the same assay (CCLE). Inferred
for corresponding cells between Random Forest and LightGBM upper bounds (dotted lines) were loosely extrapolated from
models was 0.43 for the diagonal values and 0.19 for the direct mapping results based on data intersection using the best
cross-study comparisons. dose-independent metric from Table 3.
Deep learning performance
Deep learning models generally performed on par or slightly Methods
better than LightGBM. We experimented with a variety of Feature selection and processing
neural network model architectures, and our best prediction
accuracy was achieved by a multitasking model that we called Drug response is modeled as a function of cell line features
UnoMT. Fig. 3 shows an example configuration of the UnoMT and drug properties. We used three basic types of features in
model where, in addition to the central task of predicting drug this study: RNAseq gene expression profiles, drug descriptors,
response, the model also tried to perform a variety of auxiliary and drug fingerprints. Drug concentration information was
classification and regression tasks (see Methods for details). also needed for dose response prediction. The gene expression
These multitasking options allowed the model to use additional values were the batch-corrected RNA-seq measurements from
labeled data to improve its understanding of cell line and drug the NCI60, GDSC, and CCLE. Because CTRP and gCSI
properties. data sets did not provide RNA-seq data, these data sets
The best performance achieved by deep learning is shown in were assigned gene expression values from NCI60, GDSC and
Table 6 with three additional prediction tasks turned on: cell CCLE based on cell line name matching. Log transformation
line category (normal vs tumor), site, and type. On average, was used to process FPKM-UQ normalized gene expression
the cross-study R2 improved 0.11 over LightGBM models, and profiles [52]. Batch correction was performed using a simple
the model did nearly perfectly on the additional tasks such linear transformation of the gene expression values such that
as cancer type prediction (not shown). On models trained the per-dataset mean and variance was the same for all data
on CCLE data, deep learnining offered the most pronounced sets [47]. To reduce the training time, only the expression
improvement. While the within-study R2 was nearly identical values of the LINCS1000 (Library of Integrated Network-based
to that of LightGBM, the models were able to, for the first time, Cellular Signatures) landmark genes [53] were used as features.
generalize to NCI60, CTRP, and GDSC to a moderate degree. Drug features included 3,838 molecular descriptors and 1,024
The improved cells in Table 6 compared to both Tables 4 and 5 path fingerprints generated by the Dragon software package
are highlighted in bold. (version 7.0) [54]. Drug features/fingerprints were computed
from 2D molecular structures downloaded from PubChem [55]
and protonated using OpenBabel [56].
Predictive and predictable cell line datasets
Used as training sets, each of the five cell line studies was ranked
by how predictive they were of the remaining four cell line Machine learning
studies. Used as testing sets, each of the five cell lines studies Three different machine learning algorithms were evaluated
were ranked by how predictable they were, using the other four in this study: Random Forest, LightGBM and deep neural
cell line studies as training sets. By multiple measures (average, networks. The cell line prediction error for all methods was
median and minimum R2 ), machine learning algorithms trained assessed using the mean absolute error (MAE) and Scikit-learn
on CTRP yield the most accurate predictions on the remaining [57] definition of R2 value, which is equal to the fractional
testing data sets. This ranking was consistent across the results improvement in mean squared error (MSE) of the method
from all three machine learning models. By average and median compared to the MSE of the prediction method that outputs
R2 on deep learning results, the gCSI data set was the most the average response of the test set, independent of dose,
predictable cell line dataset, and CCLE was a close second. gene expression and drug features. In the diagonal cells inCross study analysis of drug response prediction 7
Fig. 2: Impact of cell line or drug diversity on model generalizability. Models trained on partial CTRP data are tested on
CCLE and GDSC. Shades indicate the standard deviation of the cross-study R2 . A. Models trained with all CTRP drugs and a
fraction of cell lines. B. Models trained with all CTRP cell lines and a fraction of drugs.
the matrices (Tables 4, 5, and 6), mean values of 5-fold cross This architecture was extended from a previously developed
validation partitioned on cell lines are reported. For cross-study neural network called “Combo” [3] to simultaneously optimize
analysis, the entire selected set of source study data were used to for feature encoding and response prediction. Cell line and
train the model, and the non-diagonal cells report test metrics drug features first pass through their separate feature encoder
on the whole target data set. The Random Forest models were subnetworks before being concatenated with drug concentration
trained using the default Scikit-learn implementation (version to predict dose response through a second level of subnetwork.
0.22). The LightGBM models were trained using the Scikit-learn In the multitasking configuration of the network (UnoMT), the
implementation with the number of trees set to be proportional output layers of molecular and drug feature encoders are further
to the number of drugs included in the training set. connected with additional subnetworks to predict auxiliary
properties. All subnetworks have residual connections between
neighboring layers [58]. The multitasking targets include drug-
Deep learning likeness score (QED [59]) and target family for drugs, and
The reported deep neural network is based on a unified model tissue category (normal vs. tumor), type, site, and gene
architecture, termed Uno, for single and paired drug treatment. expression profile reconstruction for molecular samples. Not8 Xia et al.
phenomenon has been discussed by numerous previous studies
[37, 38, 39, 40] from a statistical consistency perspective. In
this study, we approached it from a machine learning angle.
Using the best available integrative metrics, we compared dose-
independent response values across different studies. We arrived
at rough upper bounds for how well models trained on one data
source could be expected to perform in another. These numbers
depended on whether the source and target studies used the
same cell viability assay. In the case of identical assay, the R2
ceiling was estimated to be 0.65 between CTRP and CCLE.
In the case of different assays, it was markedly lower, at 0.31,
between CTRP and GDSC.
These estimates put the recent progress in machine learning
Fig. 3: An example configuration of the multitasking based drug response prediction into perspective. We suggest
drug response prediction network (UnoMT). The that cross-study evaluation be used as an additional tool for
network predicts a number of cell line properties (tissue benchmarking model performance; without it, it’s difficult to
category, tumor site, cancer type, gene expression autoencoder) know how much of the model improvement is generalizable.
as well as drug properties (target family, drug-likeness score) in We illustrated this point with systematic characterization of
addition to drug response. cross-study performance using three different machine learning
approaches. For example, going from a simple Random Forest
model to LightGBM trained on CTRP, accuracy improved
over 220% judging by cross validation R2 . However, the
all labels were available for all samples. In particular, tissue improvement on model generalization to CCLE was only 29%.
category and site applied only to the Cancer Genome Atlas In some cases, extrapolation error actually increased as within-
(TCGA [60]) samples but not the cell line studies. We included study performance improved. For an opposite example, the
them, nonetheless, to boost the model’s understanding of deep learning models made only marginal improvement over
gene expression profiles (data downloaded from the NCI’s LightGBM in within-study performance, but the cross-study
Genomic Data Commons [61]). The drug target information improvement, averaged 0.11 in R2 , was much more appreciable.
was obtained through ID mapping and SMILES string search in This may be somewhat counterintuitive since neural networks
ChEMBL [62], BindingDB [63], and PubChem databases. The are known to be overparameterized and prone to overfitting.
binding targets curated by these sites were then mapped to the However, as we have demonstrated with a multitasking model,
PANTHER gene ontology [64]. 326 out of the 1,801 combined the high capacity of deep learning models could be put to work
compounds had known targets for the exact SMILES match. with additional labeled data in auxiliary tasks.
A Python data generator was used to join the cell line and Drug screening experiments are costly. How should we
drug features, the response value, and other labels on the fly. prioritize the acquisition of new data? A recent study showed
For multitasking learning, the multiple partially labeled data with leave-one-out experiments that drug response models had
collections were trained jointly in a round-robin fashion for each much higher error when extrapolating to new drugs than new
target, similar to how generative adversarial networks (GANs) cell lines [23]. This is consistent with our finding. The models
[65] take turns to optimize loss functions for generators and that did not generalize well tended to have been trained on
discriminators. data sets with fewer drugs (CCLE and gCSI). Further, when
we withheld samples from training drug response models, we
found that the loss of drug data was significantly more crippling
Discussion than that of cell lines. This suggests that it would be beneficial
In this study, we sought to understand the performance of for future screening studies to prioritize drug diversity. Given
drug response prediction models in a broader context. We the vast design space of potentially active chemical compounds,
hypothesized that the observed R2 score barrier of 0.8 [35] estimated to be in the order of 1060 [66], intelligent methods
might partly be a result of variability in drug response assay. that can reason about molecule classes are needed.
Indeed, we found that the measured dose response values
differed considerably among replicates in a single study. In the
case of GDSC, this variability in terms of standard deviation was Conclusion
more than 10% of the entire drug response range. Practically, Precision oncology requires precision data. In this article, we
this meant that, if we used one response value as prediction for reviewed five cancer cell line screening data sets, with a focus
another from the same cell-drug-dose combination, we would on drug response variabilities within and across studies. We
only obtain an average R2 of 0.81. The cause for this variability demonstrated that these variabilities put constraints on the
is not well understood, but experimental protocol likely plays a performance of machine learning models, in a way not obvious
big role, as evidenced by the lower variability observed among to traditional cross validation within a single study. Through
NCI60 replicates. Standardization in experimental design will systematic analysis, we compared how models trained on one
be key to maximizing the value of screening data for joint data set extrapolated to another, revealing a wide range in
learning. predictive power of both study data and machine learning
When we moved beyond single studies to compare drug methods. While deep learning results are promising, future
response values across studies, the variability increased. This success of drug response prediction will rely on the improvementCross study analysis of drug response prediction 9
of model generalizability. Experimental standardization and enables predictive modelling of anticancer drug sensitivity.
prioritization in drug diversity will also be key to maximizing Nature, 483(7391):603–607, 2012.
the value of screening data for integrative learning. 5. Mahmoud Ghandi, Franklin W Huang, Judit Jané-
Valbuena, Gregory V Kryukov, Christopher C Lo, E Robert
McDonald, Jordi Barretina, Ellen T Gelfand, Craig M
Key Points Bielski, Haoxin Li, et al. Next-generation characterization
of the cancer cell line encyclopedia. Nature, 569(7757):503–
• Cross validation in a single study overestimates
508, 2019.
the accuracy of drug response prediction
6. Wanjuan Yang, Jorge Soares, Patricia Greninger, Elena J
models, and differences in response assay can
Edelman, Howard Lightfoot, Simon Forbes, Nidhi Bindal,
limit model generalizability across studies.
Dave Beare, James A Smith, I Richard Thompson, et al.
• Different machine learning models have varying
Genomics of Drug Sensitivity in Cancer (GDSC): a resource
performance in cross-study generalization, but
for therapeutic biomarker discovery in cancer cells. Nucleic
they generally agree that models trained on
Acids Research, 41(D1):D955–D961, 2012.
CTRP are the most predictive and gCSI is the
7. Amrita Basu, Nicole E Bodycombe, Jaime H Cheah,
most predictable.
Edmund V Price, Ke Liu, Giannina I Schaefer, Richard Y
• Based on simulated experiments, drug diversity,
Ebright, Michelle L Stewart, Daisuke Ito, Stephanie Wang,
more than tumor diversity, is crucial for raising
et al. An interactive resource to identify cancer genetic
model generalizability in preclinical screening.
and lineage dependencies targeted by small molecules. Cell,
154(5):1151–1161, 2013.
8. Brinton Seashore-Ludlow, Matthew G Rees, Jaime H
Acknowledgments Cheah, Murat Cokol, Edmund V Price, Matthew E Coletti,
This work has been supported in part by the Joint Design Victor Jones, Nicole E Bodycombe, Christian K Soule,
of Advanced Computing Solutions for Cancer (JDACS4C) Joshua Gould, et al. Harnessing connectivity in a large-
program established by the U.S. Department of Energy (DOE) scale small-molecule sensitivity dataset. Cancer Discovery,
and the National Cancer Institute (NCI) of the National 5(11):1210–1223, 2015.
Institutes of Health. This work was performed under the 9. Michael Q Ding, Lujia Chen, Gregory F Cooper,
auspices of the U.S. Department of Energy by Argonne National Jonathan D Young, and Xinghua Lu. Precision oncology
Laboratory under Contract DE-AC02-06-CH11357, Lawrence beyond targeted therapy: combining omics data with
Livermore National Laboratory under Contract DE-AC52- machine learning matches the majority of cancer cells
07NA27344, Los Alamos National Laboratory under Contract to effective therapeutics. Molecular Cancer Research,
DE-AC5206NA25396, and Oak Ridge National Laboratory 16(2):269–278, 2018.
under Contract DE-AC05-00OR22725. This project has also 10. Ladislav Rampášek, Daniel Hidru, Petr Smirnov, Benjamin
been funded in whole or in part with federal funds from Haibe-Kains, and Anna Goldenberg. Dr.VAE: improving
the National Cancer Institute, National Institutes of Health, drug response prediction via modeling of drug perturbation
under Contract No. HHSN261200800001E. The content of this effects. Bioinformatics, 35(19):3743–3751, 2019.
publication does not necessarily reflect the views or policies 11. Michael P Menden, Dennis Wang, Mike J Mason,
of the Department of Health and Human Services, nor does Bence Szalai, Krishna C Bulusu, Yuanfang Guan,
mention of trade names, commercial products, or organizations Thomas Yu, Jaewoo Kang, Minji Jeon, Russ
imply endorsement by the U.S. Government. Wolfinger, et al. Community assessment to advance
computational prediction of cancer drug combinations
in a pharmacogenomic screen. Nature Communications,
References 10(1):1–17, 2019.
1. Robert H Shoemaker. The NCI60 human tumour cell line 12. Eugene F Douglass, Robert J Allaway, Bence Szalai,
anticancer drug screen. Nature Reviews Cancer, 6(10):813– Wenyu Wang, Tingzhong Tian, Adrià Fernández-Torras,
823, 2006. Ron Realubit, Charles Karan, Shuyu Zheng, Alberto Pessia,
2. Isidro Cortés-Ciriano, Gerard JP van Westen, Guillaume et al. A community challenge for pancancer drug mechanism
Bouvier, Michael Nilges, John P Overington, Andreas of action inference from perturbational profile data. bioRxiv,
Bender, and Thérèse E Malliavin. Improved large-scale 2020.
prediction of growth inhibition patterns using the NCI60 13. Chayaporn Suphavilai, Denis Bertrand, and Niranjan
cancer cell line panel. Bioinformatics, 32(1):85–95, 2016. Nagarajan. Predicting cancer drug response using a
3. Fangfang Xia, Maulik Shukla, Thomas Brettin, Cristina recommender system. Bioinformatics, 34(22):3907–3914,
Garcia-Cardona, Judith Cohn, Jonathan E Allen, Sergei 2018.
Maslov, Susan L Holbeck, James H Doroshow, Yvonne A 14. Henry Gerdes, Pedro Casado, Arran Dokal, Maruan Hijazi,
Evrard, et al. Predicting tumor cell line response to drug Nosheen Akhtar, Ruth Osuntola, Vinothini Rajeeve, Jude
pairs with deep learning. BMC Bioinformatics, 19(18):486, Fitzgibbon, Jon Travers, David Britton, et al. Drug ranking
2018. using machine learning systematically predicts the efficacy
4. Jordi Barretina, Giordano Caponigro, Nicolas Stransky, of anti-cancer drugs. Nature Communications, 12(1):1–15,
Kavitha Venkatesan, Adam A Margolin, Sungjoon Kim, 2021.
Christopher J Wilson, Joseph Lehár, Gregory V Kryukov, 15. Salma Daoud, Afef Mdhaffar, Mohamed Jmaiel, and
Dmitriy Sonkin, et al. The cancer cell line encyclopedia Bernd Freisleben. Q-rank: Reinforcement learning for10 Xia et al.
recommending algorithms to predict drug sensitivity to 29. Yifeng Li, Fang-Xiang Wu, and Alioune Ngom. A review on
cancer therapy. IEEE Journal of Biomedical and Health machine learning principles for multi-view biological data
Informatics, 24(11):3154–3161, 2020. integration. Briefings in Bioinformatics, 19(2):325–340,
16. Artur Kadurin, Alexander Aliper, Andrey Kazennov, Polina 2018.
Mamoshina, Quentin Vanhaelen, Kuzma Khrabrov, and 30. Mehreen Ali and Tero Aittokallio. Machine learning and
Alex Zhavoronkov. The cornucopia of meaningful leads: feature selection for drug response prediction in precision
Applying deep adversarial autoencoders for new molecule oncology applications. Biophysical Reviews, 11(1):31–39,
development in oncology. Oncotarget, 8(7):10883, 2017. 2019.
17. Ran Su, Xinyi Liu, Leyi Wei, and Quan Zou. Deep-resp- 31. Bettina M Pucher, Oana A Zeleznik, and Gerhard G
forest: A deep forest model to predict anti-cancer drug Thallinger. Comparison and evaluation of integrative
response. Methods, 166:91–102, 2019. methods for the analysis of multilevel omics data: a study
18. Raziur Rahman, Saugato Rahman Dhruba, Souparno based on simulated and experimental cancer data. Briefings
Ghosh, and Ranadip Pal. Functional random forest in Bioinformatics, 20(2):671–681, 2019.
with applications in dose-response predictions. Scientific 32. George Adam, Ladislav Rampášek, Zhaleh Safikhani, Petr
Reports, 9(1):1–14, 2019. Smirnov, Benjamin Haibe-Kains, and Anna Goldenberg.
19. Alexandra Bomane, Anthony Gonçalves, and Pedro J Machine learning approaches to drug response prediction:
Ballester. Paclitaxel response can be predicted with challenges and recent progress. NPJ Precision Oncology,
interpretable multi-variate classifiers exploiting dna- 4(1):1–10, 2020.
methylation and mirna data. Frontiers in Genetics, 33. Jinyu Chen and Louxin Zhang. A survey and systematic
10:1041, 2019. assessment of computational methods for drug response
20. Pavel Sidorov, Stefan Naulaerts, Jérémy Ariey-Bonnet, prediction. Briefings in Bioinformatics, 22(1):232–246,
Eddy Pasquier, and Pedro J Ballester. Predicting 2021.
synergism of cancer drug combinations using nci-almanac 34. Ziyan Wang, Hongyang Li, and Yuanfang Guan.
data. Frontiers in Chemistry, 7:509, 2019. Machine learning for cancer drug combination. Clinical
21. Ran Su, Xinyi Liu, Guobao Xiao, and Leyi Wei. Pharmacology & Therapeutics, 107(4):749–752, 2020.
Meta-GDBP: a high-level stacked regression model to 35. Delora Baptista, Pedro G Ferreira, and Miguel Rocha. Deep
improve anticancer drug response prediction. Briefings in learning for drug response prediction in cancer. Briefings in
Bioinformatics, 21(3):996–1005, 2020. Bioinformatics, 22(1):360–379, 2021.
22. Xiangxiang Zeng, Siyi Zhu, Xiangrong Liu, Yadi Zhou, 36. Betül Güvenç Paltun, Hiroshi Mamitsuka, and Samuel
Ruth Nussinov, and Feixiong Cheng. deepDR: a network- Kaski. Improving drug response prediction by integrating
based deep learning approach to in silico drug repositioning. multiple data sources: matrix factorization, kernel and
Bioinformatics, 35(24):5191–5198, 2019. network-based approaches. Briefings in Bioinformatics,
23. Min Li, Yake Wang, Ruiqing Zheng, Xinghua Shi, 22(1):346–359, 2021.
Fangxiang Wu, Jianxin Wang, et al. DeepDSC: a deep 37. Benjamin Haibe-Kains, Nehme El-Hachem, Nicolai Juul
learning method to predict drug sensitivity of cancer cell Birkbak, Andrew C Jin, Andrew H Beck, Hugo JWL
lines. IEEE/ACM Transactions on Computational Biology Aerts, and John Quackenbush. Inconsistency in large
and Bioinformatics, 2019. pharmacogenomic studies. Nature, 504(7480):389–393,
24. Fei Zhang, Minghui Wang, Jianing Xi, Jianghong Yang, 2013.
and Ao Li. A novel heterogeneous network-based method 38. John Patrick Mpindi, Bhagwan Yadav, Päivi Östling, Prson
for drug response prediction in cancer cell lines. Scientific Gautam, Disha Malani, Astrid Murumägi, Akira Hirasawa,
Reports, 8(1):1–9, 2018. Sara Kangaspeska, Krister Wennerberg, Olli Kallioniemi,
25. Yoosup Chang, Hyejin Park, Hyun-Jin Yang, Seungju Lee, et al. Consistency in drug response profiling. Nature,
Kwee-Yum Lee, Tae Soon Kim, Jongsun Jung, and Jae-Min 540(7631):E5–E6, 2016.
Shin. Cancer drug response profile scan (CDRscan): a deep 39. Zhaleh Safikhani, Petr Smirnov, Mark Freeman, Nehme El-
learning model that predicts drug effectiveness from cancer Hachem, Adrian She, Quevedo Rene, Anna Goldenberg,
genomic signature. Scientific Reports, 8(1):1–11, 2018. Nicolai J Birkbak, Christos Hatzis, Leming Shi, et al.
26. Pengfei Liu, Hongjian Li, Shuai Li, and Kwong-Sak Revisiting inconsistency in large pharmacogenomic studies.
Leung. Improving prediction of phenotypic drug response F1000Research, 5, 2016.
on cancer cell lines using deep convolutional network. BMC 40. Benjamin Sadacca, Anne-Sophie Hamy, Cécile Laurent,
Bioinformatics, 20(1):1–14, 2019. Pierre Gestraud, Hélène Bonsang-Kitzis, Alice Pinheiro,
27. Ali Oskooei, Jannis Born, Matteo Manica, Vigneshwari Judith Abecassis, Pierre Neuvial, and Fabien Reyal.
Subramanian, Julio Sáez-Rodrı́guez, and Marı́a Rodrı́guez New insight for pharmacogenomics studies from the
Martı́nez. PaccMann: Prediction of anticancer compound transcriptional analysis of two large-scale cancer cell line
sensitivity with multi-modal attention-based neural panels. Scientific Reports, 7(1):1–12, 2017.
networks. arXiv preprint arXiv:1811.06802, 2018. 41. Peter M Haverty, Eva Lin, Jenille Tan, Yihong Yu, Billy
28. Omid Bazgir, Ruibo Zhang, Saugato Rahman Dhruba, Lam, Steve Lianoglou, Richard M Neve, Scott Martin,
Raziur Rahman, Souparno Ghosh, and Ranadip Pal. Jeff Settleman, Robert L Yauch, et al. Reproducible
Representation of features as images with neighborhood pharmacogenomic profiling of cancer cell line panels.
dependencies for compatibility with convolutional neural Nature, 533(7603):333–337, 2016.
networks. Nature Communications, 11(1):1–13, 2020.Cross study analysis of drug response prediction 11
42. Petr Smirnov, Victor Kofia, Alexander Maru, Mark 55. Sunghwan Kim, Jie Chen, Tiejun Cheng, Asta Gindulyte,
Freeman, Chantal Ho, Nehme El-Hachem, George- Jia He, Siqian He, Qingliang Li, Benjamin A Shoemaker,
Alexandru Adam, Wail Ba-alawi, Zhaleh Safikhani, and Paul A Thiessen, Bo Yu, et al. PubChem 2019 update:
Benjamin Haibe-Kains. Pharmacodb: an integrative improved access to chemical data. Nucleic Acids Research,
database for mining in vitro anticancer drug screening 47(D1):D1102–D1109, 2019.
studies. Nucleic Acids Research, 46(D1):D994–D1002, 2017. 56. Noel M O’Boyle, Michael Banck, Craig A James, Chris
43. Raziur Rahman, Saugato Rahman Dhruba, Kevin Matlock, Morley, Tim Vandermeersch, and Geoffrey R Hutchison.
Carlos De-Niz, Souparno Ghosh, and Ranadip Pal. Open Babel: An open chemical toolbox. Journal of
Evaluating the consistency of large-scale pharmacogenomic Cheminformatics, 3(1):1–14, 2011.
studies. Briefings in Bioinformatics, 20(5):1734–1753, 2019. 57. F. Pedregosa, G. Varoquaux, A. Gramfort, V. Michel,
44. Abhishekh Gupta, Prson Gautam, Krister Wennerberg, B. Thirion, O. Grisel, M. Blondel, P. Prettenhofer, R. Weiss,
and Tero Aittokallio. A normalized drug response V. Dubourg, J. Vanderplas, A. Passos, D. Cournapeau,
metric improves accuracy and consistency of anticancer M. Brucher, M. Perrot, and E. Duchesnay. Scikit-learn:
drug sensitivity quantification in cell-based screening. Machine learning in Python. Journal of Machine Learning
Communications Biology, 3(1):1–12, 2020. Research, 12:2825–2830, 2011.
45. Saugato Rahman Dhruba, Raziur Rahman, Kevin Matlock, 58. Kaiming He, Xiangyu Zhang, Shaoqing Ren, and Jian Sun.
Souparno Ghosh, and Ranadip Pal. Application of transfer Deep residual learning for image recognition. In Proceedings
learning for cancer drug sensitivity prediction. BMC of the IEEE conference on computer vision and pattern
Bioinformatics, 19(17):51–63, 2018. recognition, pages 770–778, 2016.
46. Yitan Zhu, Thomas Brettin, Yvonne A Evrard, Alexander 59. G Richard Bickerton, Gaia V Paolini, Jérémy Besnard, Sorel
Partin, Fangfang Xia, Maulik Shukla, Hyunseung Yoo, Muresan, and Andrew L Hopkins. Quantifying the chemical
James H Doroshow, and Rick L Stevens. Ensemble transfer beauty of drugs. Nature Chemistry, 4(2):90, 2012.
learning for the prediction of anti-cancer drug response. 60. Katarzyna Tomczak, Patrycja Czerwińska, and Maciej
Scientific Reports, 10(1):1–11, 2020. Wiznerowicz. The Cancer Genome Atlas (TCGA):
47. Austin Clyde, Tom Brettin, Alexander Partin, Maulik an immeasurable source of knowledge. Contemporary
Shaulik, Hyunseung Yoo, Yvonne Evrard, Yitan Zhu, Oncology, 19(1A):A68, 2015.
Fangfang Xia, and Rick Stevens. A systematic approach 61. Mark A Jensen, Vincent Ferretti, Robert L Grossman, and
to featurization for cancer drug sensitivity predictions with Louis M Staudt. The NCI genomic data commons as an
deep learning. arXiv preprint arXiv:2005.00095, 2020. engine for precision medicine. Blood, 130(4):453–459, 2017.
48. Bhagwan Yadav, Tea Pemovska, Agnieszka Szwajda, 62. Anna Gaulton, Louisa J Bellis, A Patricia Bento, Jon
Evgeny Kulesskiy, Mika Kontro, Riikka Karjalainen, Chambers, Mark Davies, Anne Hersey, Yvonne Light,
Muntasir Mamun Majumder, Disha Malani, Astrid Shaun McGlinchey, David Michalovich, Bissan Al-Lazikani,
Murumägi, Jonathan Knowles, et al. Quantitative scoring et al. ChEMBL: a large-scale bioactivity database for drug
of differential drug sensitivity for individually optimized discovery. Nucleic Acids Research, 40(D1):D1100–D1107,
anticancer therapies. Scientific Reports, 4:5193, 2014. 2012.
49. Leo Breiman. Random forests. Machine Learning, 45(1):5– 63. Michael K Gilson, Tiqing Liu, Michael Baitaluk, George
32, 2001. Nicola, Linda Hwang, and Jenny Chong. BindingDB
50. Guolin Ke, Qi Meng, Thomas Finley, Taifeng Wang, Wei in 2015: a public database for medicinal chemistry,
Chen, Weidong Ma, Qiwei Ye, and Tie-Yan Liu. LightGBM: computational chemistry and systems pharmacology.
A highly efficient gradient boosting decision tree. In Nucleic Acids Research, 44(D1):D1045–D1053, 2016.
Advances in Neural Information Processing Systems, pages 64. Huaiyu Mi, Anushya Muruganujan, John T Casagrande,
3146–3154, 2017. and Paul D Thomas. Large-scale gene function analysis
51. Alexander Partin, Thomas Brettin, Yvonne A Evrard, with the panther classification system. Nature Protocols,
Yitan Zhu, Hyunseung Yoo, Fangfang Xia, Songhao Jiang, 8(8):1551–1566, 2013.
Austin Clyde, Maulik Shukla, Michael Fonstein, et al. 65. Ian Goodfellow, Jean Pouget-Abadie, Mehdi Mirza, Bing
Learning curves for drug response prediction in cancer cell Xu, David Warde-Farley, Sherjil Ozair, Aaron Courville,
lines. arXiv preprint arXiv:2011.12466, 2020. and Yoshua Bengio. Generative adversarial nets. In
52. Leili Shahriyari. Effect of normalization methods on the Advances in Neural Information Processing Systems, pages
performance of supervised learning algorithms applied to 2672–2680, 2014.
HTSeq-FPKM-UQ data sets: 7SK RNA expression as a 66. Regine S Bohacek, Colin McMartin, and Wayne C Guida.
predictor of survival in patients with colon adenocarcinoma. The art and practice of structure-based drug design:
Briefings in Bioinformatics, 20(3):985–994, 2019. a molecular modeling perspective. Medicinal Research
53. Amar Koleti, Raymond Terryn, Vasileios Stathias, Caty Reviews, 16(1):3–50, 1996.
Chung, Daniel J Cooper, John P Turner, Dušica Vidović,
Michele Forlin, Tanya T Kelley, Alessandro D’Urso, et al.
Data Portal for the Library of Integrated Network-based
Cellular Signatures (LINCS) program: integrated access
to diverse large-scale cellular perturbation response data.
Nucleic Acids Research, 46(D1):D558–D566, 2018.
54. Kode srl. Dragon (software for molecular descriptor
calculation), 2016.12 Xia et al. Fangfang Xia is a Computer Scientist in Data Science and Technical Staff Member at Los Alamos National Laboratory. Learning Division at Argonne National Laboratory. Jonathan Stewart He is a Data Scientist at Lawrence Livermore National Allen is a Bioinformatics Scientist at Lawrence Livermore Laboratory. Pinyi Lu is a Bioinformatics Analyst at Frederick National Laboratory. Marian Anghel is a Technical Staff National Laboratory for Cancer Research. Sergei Maslov is Member at Los Alamos National Laboratory. Prasanna a Professor and Bliss Faculty Scholar in Department of Balaprakash is a Computer Scientist in Mathematics and Bioengineering and Physics at the University of Illinois at Computer Science Division at Argonne National Laboratory. Urbana-Champaign and holds joint appointment at Argonne Thomas Brettin is a Strategic Program Manager in Computing, National Laboratory. Alexander Partin is a Computational Environment and Life Sciences at Argonne National Laboratory. Scientist in Data Science and Learning Division at Argonne Cristina Garcia-Cardona is a Scientist at Los Alamos National National Laboratory. Maulik Shukla is a Project Lead and Laboratory. Austin Clyde is a Computational Scientist at Computer Scientist in Data Science and Learning Division at Argonne National Laboratory and a PhD student in Computer Argonne National Laboratory. Eric Stahlberg is the Director Science at University of Chicago. Judith Cohn is a Research of Biomedical Informatics and Data Science at the Frederick Scientist at Los Alamos National Laboratory. James Doroshow National Laboratory for Cancer Research. Justin M. Wozniak is the Director of Division of Cancer Treatment and Diagnosis is a Computer Scientist in Data Science and Learning Division at National Cancer Institute. Xiaotian Duan is a PhD student at Argonne National Laboratory. Hyunseung Yoo is a Software in Computer Science at University of Chicago. Veronika Engineer in Data Science and Learning Division at Argonne Dubinkina is a PhD student in Department of Bioengineering National Laboratory. George Zaki is a Bioinformatics Manager at University of Illinois at Urbana-Champaign. Yvonne Evrard at Frederick National Laboratory for Cancer Research. Yitan is an Operations and Program Manager at Frederick National Zhu a Computational Scientist in Data Science and Learning Laboratory for Cancer Research. Ya Ju Fan is a Computational Division at Argonne National Laboratory. Rick Stevens is an Scientist in Center for Applied Scientific Computing at Associate Laboratory Director at Argonne National Laboratory Lawrence Livermore National Laboratory. Jason Gans is a and a Professor in Computer Science at University of Chicago.
You can also read