Combining cues to judge distance and direction in an immersive virtual reality environment - Semantic Scholar
←
→
Page content transcription
If your browser does not render page correctly, please read the page content below
Journal of Vision (2021) 21(4):10, 1–25                                                                                                                              1

Combining cues to judge distance and direction in an
immersive virtual reality environment
Peter Scarfe                                                                       University of Reading, Earley Gate, Reading, UK

Andrew Glennerster                                                                 University of Reading, Earley Gate, Reading, UK

When we move, the visual direction of objects in the                                         most psychophysical experiments, the estimation of
environment can change substantially. Compared with                                          visual direction seems simpler and less to do with the
our understanding of depth perception, the problem the                                       representation of the 3D world around us. However,
visual system faces in computing this change is relatively                                   for a moving observer in a static world, or a static
poorly understood. Here, we tested the extent to which                                       observer viewing moving objects, the situation is quite
participants’ judgments of visual direction could be                                         different (Wexler et al., 2001). Objects change both
predicted by standard cue combination rules.                                                 their depth and their visual direction and, in both cases,
Participants were tested in virtual reality using a                                          if an observer is to perceive a stable 3D world, they
head-mounted display. In a simulated room, they judged                                       must take account of changes in the visual direction of
the position of an object at one location, before walking                                    objects just as much as they do for changes in object
to another location in the room and judging, in a second                                     depth.
interval, whether an object was at the expected visual                                          There is good evidence that people are able to update
direction of the first. By manipulating the scale of the
                                                                                             their estimate of the visual direction of previously
room across intervals, which was subjectively invisible
to observers, we put two classes of cue into conflict, one                                    viewed objects when they move to a new location (Foo
that depends only on visual information and one that                                         et al., 2005; Klatzky et al., 2003; Klier et al., 2008;
uses proprioceptive information to scale any                                                 Loomis et al., 1998; Medendorp, 2011; Rieser & Rider,
reconstruction of the scene. We find that the sensitivity                                     1991; Siegle et al., 2009; Thompson et al., 2004). To do
to changes in one class of cue while keeping the other                                       this accurately requires two things: first, an estimate of
constant provides a good prediction of performance                                           the translation of the observer, which may come from a
when both cues vary, consistent with the standard cue                                        range of cues in addition to vision, including audition,
combination framework. Nevertheless, by comparing                                            proprioception, and somatosensory information, all
judgments of visual direction with those of distance, we                                     of which must be integrated together (Mayne, 1974;
show that judgments of visual direction and distance are                                     Siegle et al., 2009); second, it requires an ability to use
mutually inconsistent. We discuss why there is no need                                       this information appropriately to update the observer’s
for any contradiction between these two conclusions.                                         representation of the scene and the observer’s location
                                                                                             in it (whatever form that representation might take).
                                                                                             Loomis et al. describe this as updating a “spatial image”
                                                                                             (Giudice et al., 2011; Loomis et al., 2007).
 Introduction                                                                                   Here, we focus on the role of two quite distinct
                                                                                             potential signals about visual direction that might
Three-dimensional representation in a moving                                                 contribute to the spatial updating process. One is purely
observer                                                                                     visual and the other involves information about the
                                                                                             distance between the optic center of the eye/camera in
   The coordinates of three-dimensional (3D) vision                                          two or more locations. First, we describe what we call
can seem misleadingly simple. Two coordinates define                                         physical-based cues. In the field of photogrammetry
the visual direction of a point as viewed, for example,                                      (Hartley & Zisserman, 2000; Shapiro et al., 1995), in
by the cyclopean eye, the third defines the distance of                                      which the 3D layout of a static scene is recovered from
the point along that line of sight. Most research in the                                     a series of images as a camera moves through the scene,
field of 3D vision focuses on the cues that contribute                                       the 3D structure of the scene can be reconstructed but
to the estimation of distance and depth presumably                                           only up to scale. In other words, the metric or Euclidean
because, for a static observer, such as is typical for                                       structure of the scene can be recovered from the images

Citation: Scarfe, P., & Glennerster, A. (2021). Combining cues to judge distance and direction in an immersive virtual reality
environment. Journal of Vision, 21(4):10, 1–25, https://doi.org/10.1167/jov.21.4.10.
https://doi.org/10.1167/jov.21.4.10                  Received October 17, 2019; published April 26, 2021                      ISSN 1534-7362 Copyright 2021 The Authors

                                      This work is licensed under a Creative Commons Attribution 4.0 International License.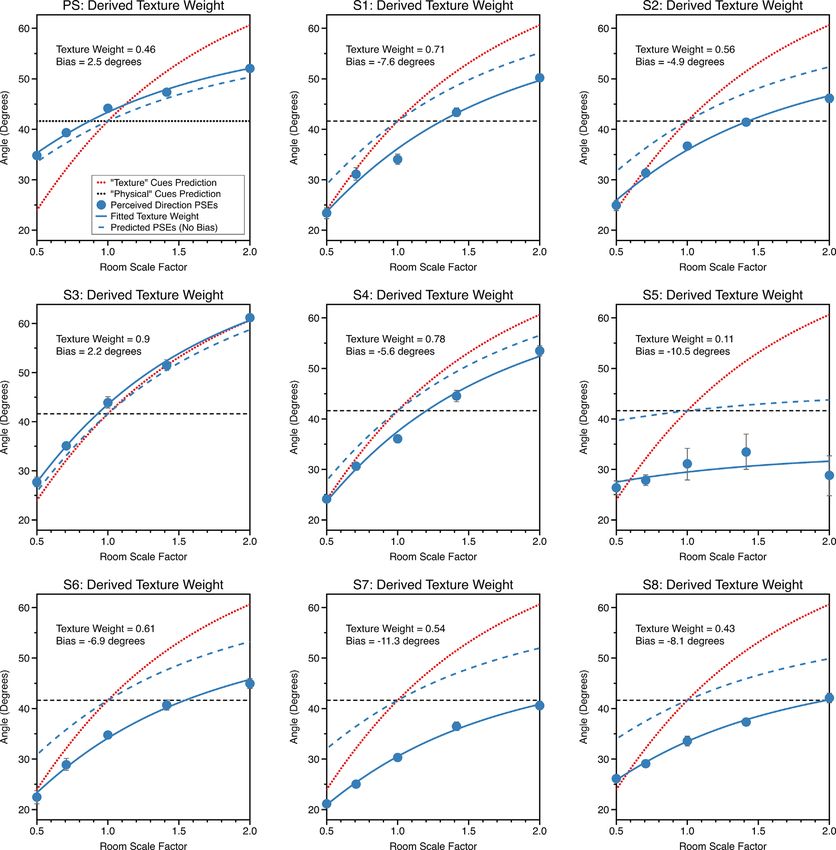
Journal of Vision (2021) 21(4):10, 1–25              Scarfe & Glennerster                                                  2

alone, but it is not possible to make any comment about           entirely based on these, not the physical size of the
the overall scale of the reconstruction until information         room.
is provided about the distance between two or more                   The distinction between scaled and unscaled
optic centers along the path of the camera/eye. Such              reconstruction of a scene has some similarities to the
information could come from proprioception; for                   distinction between absolute and relative disparities,
example, information from the leg muscles indicating              although it is not identical. The absolute disparity
that the observer had walked a meter or, equivalently,            of a point is the binocular disparity between it and
information about the interocular separation that,                the location where the two eyes are fixated, whereas
in combination with vergence information, indicates               the relative disparity between two points is the
fixation distance (Backus & Matza-Brown, 2003;                    difference between their absolute disparities and so
Brenner & van Damme, 1998; Howard, 2008; Mon-                     is independent of the vergence angle of the eyes
Williams et al., 2000; Richards & Miller, 1969; Swenson,          (Harris, 2004; Howard & Rogers, 2002). However,
1932; Tresilian & Mon-Williams, 2000; Tresilian et al.,           doubling interocular separation (or, equivalently in this
1999).                                                            experiment, shrinking the scene by a factor of two
   It is this scaling information that is missing from            around the cyclopean point) doubles both the absolute
a purely visual, photogrammetric reconstruction. If               disparities and the relative disparities of points but it
people build a scaled reconstruction of the scene,                only affects physical-based cues, not texture-based cues,
including the location of a target that they have to track,       so the absolute/relative distinction does not map onto
and if we assume that they have access to proprioceptive          the two cues we have described. The distinction between
information about how far they have walked then, in               scaled and unscaled reconstruction is important in
theory, a participant with this information could close           photogrammetry and it clarifies the information that
their eyes and continually judge the direction of the             is available to the visuomotor system under different
target as they moved in the environment (Frissen et               assumptions.
al., 2011; Loomis et al., 1992; Loomis & Philbeck,                   When judging visual direction, if the scene expands
2008; Siegle et al., 2009). We describe this strategy as          or contracts about the cyclopean point between 1) the
using physical-based cues, because it is entirely based           moment when the participant initially sees the target
on a scaled reconstruction of both the scene and of               and 2) the moment when they have to make a judgment
the participant’s location in that reconstruction. These          about the visual direction of the previously viewed
two factors together determine the physical-based                 target (after having walked to a new location), then
direction of the target. Although many separate factors           physical-based and texture-based cues will conflict, but
may contribute to this estimate, we treat them as all             crucially they both provide estimates in the same units
contributing to a single cue. This practice is consistent         (visual angle) and so can be combined.
with the standard definition of a cue as “any sensory                Previously, we have investigated the effect of these
information that gives rise to a sensory estimate” (Ernst         two types of cue to distance using an immersive virtual
& Bulthoff, 2004, p. 163).                                        reality environment where the scene can expand or
   The second set of cues we consider (and, again, we             contract around the observer’s cyclopean point. In
group these together and consider them as a single                those experiments, we have demonstrated how these
entity), are what we call texture-based cues. At the              cues could be combined according to the widely
opposite extreme from physical-based cues, we can                 accepted rules of cue combination (Glennerster et al.,
assume that people use only the images that arrive                2006; Rauschecker et al., 2006; Svarverud et al., 2012;
that the eye to reconstruct their environment, as in              Svarverud et al., 2010). However, in these instances we
unscaled photogrammetry. In this case, if the entire              have always examined them in relation to the perception
scene is doubled in size about the cyclopean point (so            of depth. In the current work, we extend this analysis to
everything gets larger and further away) and if there is          the perception of visual direction and, to anticipate our
no information available to the system about the length           results, we show again that performance in combined
of the baseline (that is, distance between the camera/eye         cue situations for visual direction follows the pattern
locations, e.g. interocular separation), then there is            expected by standard cue combination rules, just as it
no way for the system to detect that the scene has                did for perceived depth.
changed size. Participants can still navigate; they can              Here, we also compare judgments of direction
still tell where they are in the unscaled photogrammetric         and distance from the two classes of cue, because
reconstruction, and they can still judge the visual               there are clear ways in which both types of judgment
direction of remembered objects in that reconstruction.           could adhere to standard cue combination rules
We describe this estimate as texture-based because,               yet produce perceptual estimates that are mutually
when the room expands, so do all the textures (the                inconsistent. First, observers might differentially weight
bricks on the wall, the tiles on the floor) and a                 the available cues when making each type of judgment.
person’s judgment of the target visual direction is               Second, judgments of direction and distance might
Journal of Vision (2021) 21(4):10, 1–25             Scarfe & Glennerster                                                  3

be differentially biased. By bias, we are referring to a         General methods
discrepancy between 1) the value of a property of the
external world (real or simulated) and 2) the person’s              Observers viewed the virtual scene binocularly using
estimate of that property. Elsewhere, this concept has           a NVIS SX111 head-mounted display (HMD). This
been termed external accuracy (Burge et al., 2010). A            had a vertical field of view of 72°, horizontal field of
similar conclusion about perceptual inconsistencies has          view of 102°, and 50° of horizontal binocular overlap.
been advocated on the basis of evidence showing that             The displays for each eye had a resolution of 1,280 ×
the integration of sensory cues does not necessarily             1,024 pixels and a refresh rate of 60 Hz. The position
lead to the calibration of those same cues (Smeets et al.,       and orientation of the HMD was tracked using a
2006).                                                           14 camera Vicon tracking system (MX3 and T20S
                                                                 cameras). The HMD was calibrated such that the left
                                                                 and right eyes viewing frustums could be calculated
                                                                 from the six degrees of freedom tracking data. This
Aims of the current study                                        allowed geometrically correct perspective projection of
                                                                 the 3D scene as the observer moved through the virtual
   The current study had two aims. First, we examine             environment (Gilson et al., 2011). The HMD was
whether judgments of visual direction in freely moving           driven by two computers connected directly by gigabit
observers could be predicted using a simple weighted             Ethernet, one for running the tracking software and one
averaging of the two types of cue we have described              for generating the simulated environment. The tracking
(physical-based and texture-based), as has been                  computer had a quad core Intel Xeon 3.6GHz CPU,
shown for judgments of distance (Svarverud et al.,               NVidia Quadro K2000 graphics and 8 GB of RAM.
2010). We adopt the most widely accepted framework               This ran Vicon Tracker 2.0.1 software that outputted
for considering sensory cue combination (weighted                the coordinates of the HMD at 240 Hz. The graphics
averaging) for this purpose (Landy et al., 1995; Maloney         computer had an eight core AMD Opteron 6212 CPU,
& Landy, 1989). This posits that the goal of combining           dual NVidia GeForce GTX 590 Graphics cards and 16
sensory cues is to maximize the precision of the                 GB RAM. This polled the coordinates of the HMD at
combined cues estimate and construct a single unified            60 Hz using the Vicon DataStream SDK for Matlab
internal representation of the scene in units such as            (R2013b).
depth (Landy et al., 1995). Second, we explore the                  Stimuli were rendered online in OpenGL using
possibility that judgments of distance and direction             Matlab and the Psychophysics toolbox extensions
could be mutually inconsistent. Using immersive                  (Brainard, 1997; Kleiner et al., 2007; Pelli, 1997). The
virtual reality allows us to examine these aims in a             dual displays of the HMD were driven from a single
naturalistic spatial updating task, while parametrically         graphics card port using a Matrox multidisplay adaptor
controlling the cues available to the observer (Scarfe &         (“TripleHead2Go”) to ensure the two eyes images were
Glennerster, 2015, 2019). Spatial updating has generally         updated synchronously, without tearing. This created a
been discussed in terms of a geometric representations           single virtual 2,560 × 1,024 screen (left half mirrored to
of space and an observer’s location in that space rather         the left eyes HMD display, and the right half the right
than the weighted combination of conflicting estimates           mirrored to the eyes HMD display). Observer responses
of visual direction (e.g., Klatzky et al., 1998), although       were recorded with a handheld wireless button box
see Nardini et al. (2008) for a similar approach to              connected to the graphics computer via Bluetooth.
weighting visual-only or proprioceptive-based cues but
applied to a homing task.

                                                                 Visual direction: Stimulus and task
                                                                   The experiment took place in a virtual room
 Methods                                                         (Figure 1) with brick textured walls and a black and
                                                                 white checkerboard textured floor (24 × 24 tiles). The
Participants                                                     checkerboard was created procedurally in Matlab and
                                                                 the brick texture was loaded in from a photo. The photo
   Nine observers took part in experiments, including            was tiled, resized, and filtered in Adobe Photoshop
one author (P.S.). The experiments were reviewed and             CS6 to create a single image with no visible seams
approved by the University of Reading Research Ethics            between the edges of the tiled image. Both images were
Committee. Observers were paid £10 per hour to take              converted to OpenGL textures for rendering.
part. Participants ranged in age from 18 to 33. All had            Each trial began with the observer in a simulated
normal or corrected-to-normal vision (Snellen acuity of          room with rendered physical dimensions of 8 m ×
6/6 or better).                                                  8 m × 3 m (width, depth, and height). The floor of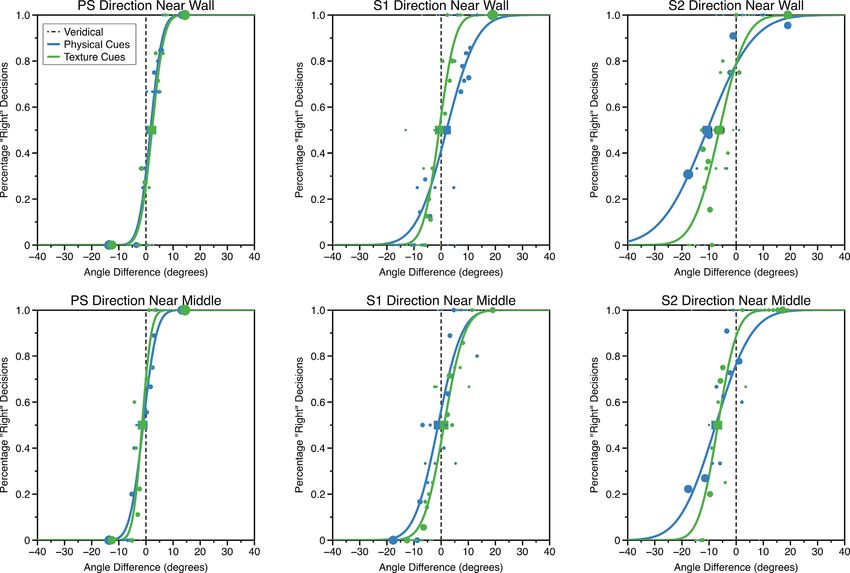
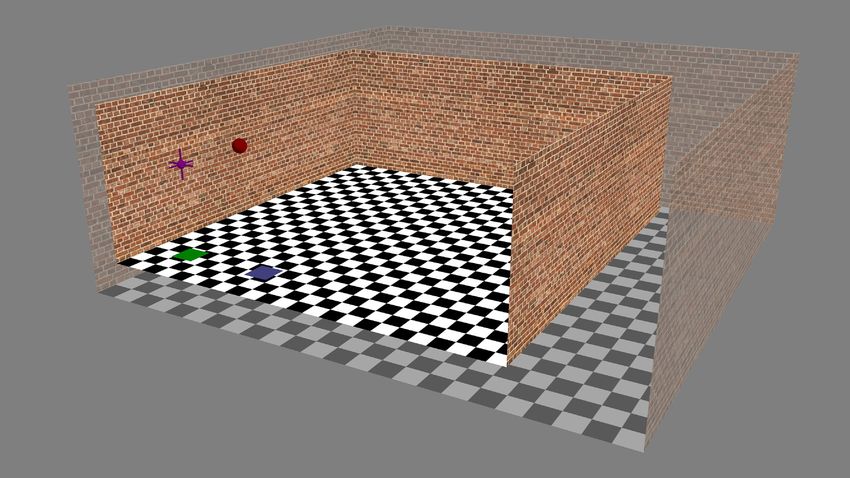
Journal of Vision (2021) 21(4):10, 1–25                    Scarfe & Glennerster                                                       4

Figure 1. Rendering of the virtual room, with the back wall removed. The green square indicates the position of view zone 1 (where
the observer stood in interval 1) and the blue square the position of view zone 2 (where the observer stood in interval 2), in the “near
wall” condition (colored squares were not present in the simulated VR environment). During the experiment observers judged the
distance and visual direction of a red sphere rendered in front of view zone 1. The purple fiducial marker above view zone 1
represents the cyclopean position of the observer. During the experiment the room could dynamically expand or contact around the
observers’ cyclopean point (semi-opaque room shows an example of expansion). When the room expanded the bricks on the wall
and tiles on the floor scaled in size such that from the cyclopean point the room looked identical before and after it changed in size.
This allowed “texture-based” and “physical-based” cues to conflict with one another (see main text for details). Supplementary Movie
1 shows a dynamic version of this figure.

the rendered room was concordant with the physical                      ball would always be directly in front of view zone 1
floor of the laboratory. Interval 1 was initiated when                  before starting the experiment. The sphere was matt,
the participants entered an invisible 50-cm square view                 red in color, and lit by a white light source providing
zone on the left side of the simulated room (view zone                  ambient and diffuse illumination positioned 2 m above
1). View zone 1 was always 1 m from the back wall but                   and 2 m to its right. The rest of the room was unaffected
could be either 0.9 m or 2.75 m from the left-hand side                 by this light source.
simulated wall (Figure 2). We label these conditions                       The sphere was viewable continuously, so long as
"near wall" and "near middle," respectively. These two                  the X and Z coordinates of the observer’s cyclopean
conditions were used because previous research has                      point remained in the view zone. If the observer moved
shown that, in an environment such as this, proximity                   out of the view zone, the ball disappeared, but it
to the wall modulates the weighting observers assign                    reappeared as soon as they reentered. Observers were
to visual cues such as disparity, motion, and texture                   instructed to get a good idea of the position of the
(Svarverud et al., 2012).                                               ball and were encouraged to move relative to the ball
   Upon entering view zone 1 a red target sphere (30 cm                 to aid this process, for example, by rocking side to
in diameter) appeared at 1.6 m directly in front of the                 side laterally. Once they were confident of the position
view zone. The height of the sphere was set to that of                  of the ball, they pressed a button on the button box.
the observer’s cyclopean eye, which was recorded at the                 This action triggered the HMD screens to go blank
moment they entered the view zone. The coordinates of                   for 0.5 seconds, after which time the rendered room
the cyclopean eye were computed directly from the left                  reappeared, without the red sphere. When the room
and right eye OpenGL model view matrices on each                        reappeared, it could have a different size (either smaller
refresh cycle (60 Hz). Observers were informed that the                 or larger) to that in the first interval. When the room
Journal of Vision (2021) 21(4):10, 1–25                     Scarfe & Glennerster                                                     5

                                                                            Once the room reappeared, observers walked
                                                                         rightwards across the room 1.8 m to view zone 2 (also
                                                                         1 m from the back wall). A physical bar 1 m in height,
                                                                         not rendered in the virtual environment, straddled the
                                                                         diameter of the laboratory at right angles to the walls
                                                                         and provided a guide for walking. The positions of
                                                                         both view zones were marked on the bar with physical
                                                                         markers so that observers could feel when to stop
                                                                         walking by touch. The distance walked was always
                                                                         1.8 m and observers rapidly became accustomed to this
                                                                         movement distance. This also meant that on different
                                                                         trials observers walked across different proportions of
                                                                         the simulated room. All observers were debriefed at the
                                                                         end of the experiment and, consistent with previous
                                                                         research (Glennerster et al., 2006), none reported being
                                                                         aware that the room scaled in size, or that they were
                                                                         traversing different proportions of the simulated room.
                                                                         At best, the only thing observers noticed was that on
                                                                         some trials they felt as if they were moving faster or
                                                                         slower than others.
                                                                            When observers entered view zone 2, a new ball
                                                                         appeared in the room (interval 2). This ball was also
Figure 2. Schematic view of a portion of the room from above.            directly in front of view zone 1; however, its distance
The position of the view zones and red sphere are shown                  from view zone 1 (in the Z direction) was generally
relative to the left and back walls of the room. In interval 1,          different from that in interval 1 (the full psychophysical
observers remembered the position of the sphere from view                procedure for this is described further elsewhere in this
zone 1. They then walked across the room to view zone 2,                 article). The observers’ task was to judge whether, in
where they saw a second sphere that could be in the same                 terms of visual direction, the second ball was to the left
physical location or translated along the line joining the center        or the right of the first ball. In Figure 2, this corresponds
of zone 1 and the center of the sphere in interval 1 (dashed             to whether θ was smaller or greater than that in interval
circles). The task was to judge whether the visual direction of          1. Before the beginning of the experiment, the task was
the second sphere was to the “left” or “right” of the original           explained clearly to observers with the aid of diagrams
sphere.                                                                  and each observer completed practice blocks until they
                                                                         were confident in the task. With a short period of
                                                                         practice, observers became very proficient in the task,
changed size between intervals, it uniformly scaled in                   finding it quick and intuitive to perform. We consider
size around the cyclopean point of the observer (Figure                  that a task in which the target disappears and then
1, Supplementary Movie 1).                                               participants judge the location of a probe relative to
   As a result, the checkerboard and brick textures                      the remembered location is the cleanest way to measure
scaled with the room so that there were the same number                  their representation of perceived location. When the
of bricks on the walls and tiles on the floor when                       target can be seen continuously, biases are introduced
the room changed size. The textures were magnified                       relative to participants’ perception in a static scene
using bilinear sampling and minified using a tri-linear                  (Tcheang et al., 2005; Wallach et al., 1974).
sampling (multiresolution mipmap pyramid), both with                        The size of the ball in interval 2 was scaled relative to
16× anisotropic filtering. This ensured that there was                   the room so that observers would be unable to identify
no visual texture aliasing or excessive blur at different                the physical scale of the room simply by judging the
scales, even when viewing the textures at very shallow                   size of the ball relative to the room across intervals.
viewing angles. In addition to this, the whole scene was                 In addition to this, the ball’s size was jittered by a
anti-aliased using full screen multisampling with eight                  random value drawn from a uniform distribution of
samples per image pixel. Thus, the cyclopean viewpoint                   ±15%. This prevented participants from using the
when the room reappeared was identical to that at the                    angular size of the ball as an accurate proxy for viewing
end of the first interval, except for any small movement                 distance, although we note that this does not completely
the observer made during the short blank period. When                    eliminate angular size as a potential cue to viewing
a room is scaled in this way, people remain consciously                  distance. Observers were informed that the ball’s size
unaware that the room has changed size, even though                      would vary randomly across trials, but regardless of
this size change can be dramatic (Glennerster et al.,                    the ball’s size, the task was always to judge its visual
2006; Svarverud et al., 2010).                                           direction. If participants had misattributed some of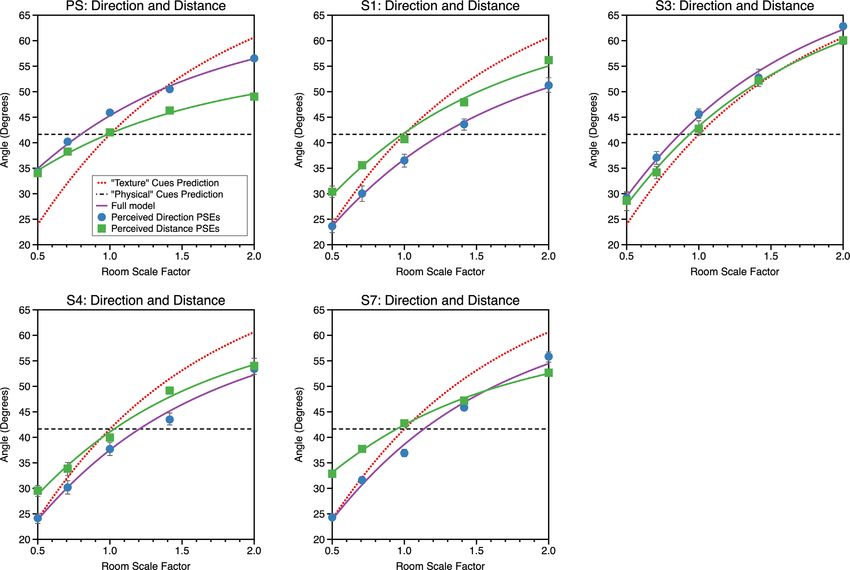
Journal of Vision (2021) 21(4):10, 1–25                 Scarfe & Glennerster                                                    6

the change in ball size to a change in viewing distance              threshold, the ball remain at the same physical position
(e.g., 50%), this would be equivalent to carrying out the            in front of zone 1 (i.e., a different position relative to
experiment at a different viewing distance. Assuming,                the room compared with interval 1). By varying the
as we do throughout, that participants remember this                 magnitude of room scaling between intervals 1 and
viewing distance from interval 1, and use it in their                2, we were able to map out a psychometric function
estimation of viewing distance or direction in interval              for each type of cue, for each position in the room:
2, then there is only a very small effect of this potential          1) texture cues near wall, 2) physical cues near wall,
misattribution on the quantities we compute later on.                3) texture cues near middle, and 4) physical cues near
Specifically, the maximum possible effect will be for                middle. Whereas in previous research observers were
trials that have the largest jitter. For these extreme trials,       instructed to pay explicit attention to the type of cue
the estimated ratio of reliabilities for texture-based and           being varied (Svarverud et al., 2010), in the present
physical-based cues would change by 5% from the ratio                study we gave no instructions in this regard, so as to
that would have been computed otherwise. Overall,                    measure observers’ natural propensity to use each type
the mean effect across all trials would be zero and the              of cue in each condition.
standard deviation of the change in ratio would be                      There are clearly many different components that
0.2%.                                                                contribute to the overall sensitivity to a cue, including
   Upon recording their response with a button press,                the variability in measuring the distance walked,
the rendering of the room was extinguished. This cued                variability in remembering the distance of the target in
the observer to walk back to view zone 1. When they                  interval 1, and variability in the process of computing
got half-way between view zones 1 and 2, they reentered              an angle from these two distances. This is true for a
the simulated room of interval 1 for the next trial of the           large range of studies in this area (see Hillis et al., 2004
experiment.                                                          for a discussion). When we fit a cumulative Gaussian
                                                                     to the psychometric function for one of these tasks,
                                                                     we are assuming that a number of sources of noise
Visual direction: Single cue sensitivities                           sum together (variances add, for independent noise
                                                                     sources) to give a total noise for all the components
   To test the weighted averaging model, we first                    contributing to performance. For both physical-based
measured single cue sensitivities to changes in visual               and texture-based cues, variability in measuring the
direction. We did this using a paradigm in which one                 viewing distance, measuring the distance walked, or
cue, either physical-based or texture-based was varied,              computing an angle from these distances are all likely
and the other one was constant. We did this both when                sources of noise. The key aim is to see, under these
the participant was near the wall and near the middle                common assumptions, how well weighted averaging can
of the room. As described elsewhere in this article,                 account for the data.
physical-based cues refer to information from stereo                    For each of the four functions, the scale factor
and motion parallax that is scaled by an estimate of the             of the room in the second interval was determined
baseline between views (such as interocular separation               by the psi-marginal adaptive method (Prins, 2013),
or distance walked), which can potentially signal the                implemented in the Palamedes toolbox for Matlab
position of the sphere independent of other aspects                  (Prins & Kingdom, 2009). The psi-marginal method
of the room. Texture-based cues, in contrast, signal                 is based on the psi method (Kontsevich & Tyler,
the position of the ball relative to other aspects of                1999), but allows the experimenter to label the four
the room, for example, the tiled floor and brick walls.              parameters of the psychometric function as parameters
Disparity and motion parallax can also contribute to                 of interest or nuisance parameters. The psi-marginal
these, for example, the ratio of two relative disparities            method marginalizes over the nuisance parameters
is independent of any estimate of the interocular                    so that stimulus placement only gathers information
separation. Single cue sensitivities were measured by                about these if they provide information about the
holding one cue constant while letting the other vary                parameters of interest (for a full description, see Prins,
when the room scaled in size across intervals 1 and 2.               2013). Because we were primarily interested in the
Elsewhere in this article, we detail how we can infer                point of subjective equality (PSE) and slope of the
single cue sensitivities from measurements with both                 psychometric function these were set as parameters of
cues present. For both classes of cue, in interval 1 the             interest, whereas the lapse and guess rate were set as
ball was always positioned 1.6m directly in front of                 nuisance parameters. As such, the PSE and slope of the
view zone 1. However, in interval 2 the positioning of               psychometric function were set as our free parameters
the ball differed.                                                   when psychometric functions were fit (as discussed
   When measuring a physical threshold, the position                 elsewhere in this article).
of the ball in front of zone 1 remained the same relative               The minimum and maximum room scale factors
to the room (i.e., a different physical position compared            from which the psi-marginal could be selected were set
with interval 1). In contrast, when measuring a texture              at 0.35 and 3.95. Collecting data at values high and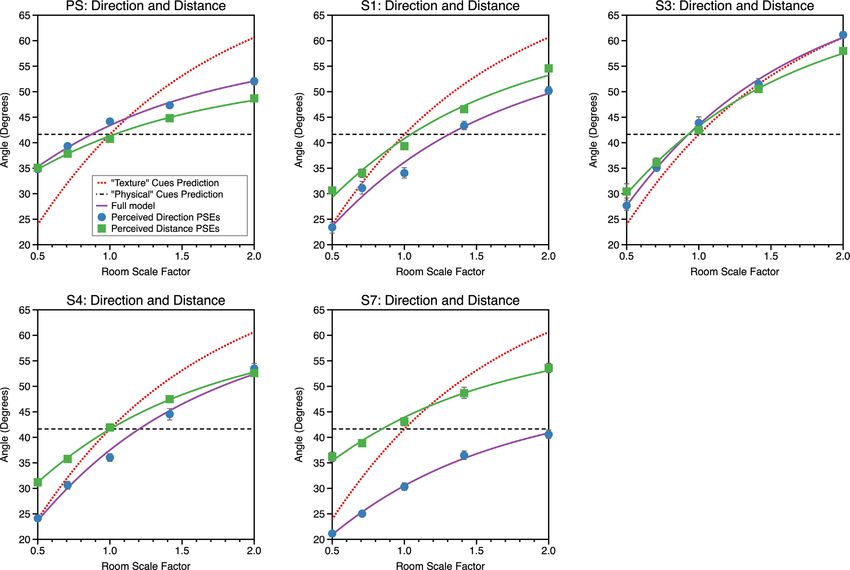
Journal of Vision (2021) 21(4):10, 1–25               Scarfe & Glennerster                                                     7

low on the psychometric function is key for gaining                the distance to the red sphere in front of them (distance
well-fit, unbiased, functions (Prins, 2013; Wichmann               being the Z dimension shown Figure 2). Once they
& Hill, 2001a, 2001b). We chose these values because               were confident, they pressed a button that triggered the
they had resulted in near asymptotic behavior and well             HMD screens to go blank for 0.5 seconds, after which
fit functions during piloting. Trials for each for the             the rendered room reappeared, with a new red sphere.
four psychometric functions were randomly interleaved              The observer’s task was to judge whether the red sphere
and completed in blocks of 40 (10 trials per function              in the second interval was closer or further from them
per block). There were 5 blocks, giving a total of 150             in the Z dimension compared with the red sphere in
trials per psychometric function. Observers took breaks            interval 1.
between blocks, but typically completed two blocks                     As with the direction task, the room could scale
back to back. The experiment could be completed over               in size around the cyclopean point between intervals
multiple days or weeks, depending on the availability of           and the red ball scaled in size relative to the room with
the observer.                                                      an additional jitter of value drawn from a uniform
                                                                   distribution ±15%. In addition to this, the ball in the
                                                                   second interval was jittered laterally in the X dimension
Visual direction: Measuring perceived visual                       by a value drawn from a uniform distribution ±25.43
                                                                   cm. This was equivalent to ±9° at the 1.6 m distance of
direction when both cues vary                                      the ball in interval 1. This lateral jitter was introduced so
                                                                   as to disrupt the use of monocular cues to complete the
   Next, we measured perceived visual direction when               task. Observers were informed of this random lateral
both classes of cue could vary between intervals 1 and             jitter and told that, regardless of the jitter value, the
2. If the weighted averaging model holds, we should                task was always to judge distance in the Z dimension.
be able to predict cue weighting in the combined-cue                   As with the judgments of direction, there were
case from single cue sensitivities. For this part of               two parts. In the first part, we measured single cue
the experiment we used five scale factors with equal               sensitivities for distance by holding target distance (as
logarithmic spacing (2−1 , 2−0.5 , 20 , 20.5 , and 21 ),           defined by one cue) constant while the distance of the
corresponding with scale factors of 0.5, 0.71, 1.0, 1.41,          target as defined by the other cue was varied. As before,
and 2.0. The values were chosen to lie well within the             the room scale factor between intervals 1 and 2 was
scale factors used for measuring single cue sensitivities,         determined adaptively by the psi-marginal method.
so as to not be extrapolating beyond the range in which            In the second part, we measured perceived distance
cue weights were measured. For each scale factor, we               with the same five room expansion factors. Here the
collected a separate psychometric function using the               psi-marginal method was used to measure the distance
psi-marginal adaptive method. Here, the psi-marginal               of the ball from view zone 1 in the Z dimension.
method was used to vary the depth of the sphere in                 Observers were given practice trials until they were
interval 2. This had the effect of altering the visual angle       familiar with the task and confident in carrying it out
θ for both cues concurrently (Figure 2). All five of these         before beginning the experiment. All other aspects
psychometric functions were run randomly interleaved               of the procedure were identical to the direction
within blocks. Each block consisted of 50 trials, 10 per           task.
function. There were in total 15 experimental blocks,
giving a total of 150 trials per psychometric function,
that is, the same number of trials per function as when            Definition of cues for perceived visual direction
measuring single cue sensitivities. All other aspects of
the task were identical to that described elsewhere in                In measuring single cue sensitivities for physical
this article.                                                      and texture cues to visual direction, we parametrically
                                                                   varied the scale of the room between intervals 1 and 2,
                                                                   as has been done previously for judgments of distance
Perceived distance: Stimulus and task                              (Svarverud et al., 2010). However, room scale factor
                                                                   has a nonlinear relationship with the property that
   The aim of the second part of the experiment was to             the observer was asked to estimate, namely, whether
obtain estimates of the perceived distance of the target           the visual direction of the ball had changed between
sphere in the same experimental conditions with as with            intervals 1 and 2. For single cue sensitivities to be
judgments of visual direction. Five observers also made            correctly measured there must be a linear relationship
distance judgments (in subsequent figures: PS, S1, S3,             between 1) the property being estimated and 2) the
S4, and S5) based on their availability to take part. The          property being manipulated. There is currently active
stimulus and methodology were largely identical to                 debate surrounding the cues observers use to complete
judgments of visual direction, so we just describe the             a given task and whether or not they are linearly related
differences here. In the first interval, observers judged          to the judgment that an observer is making (Hillis et al.,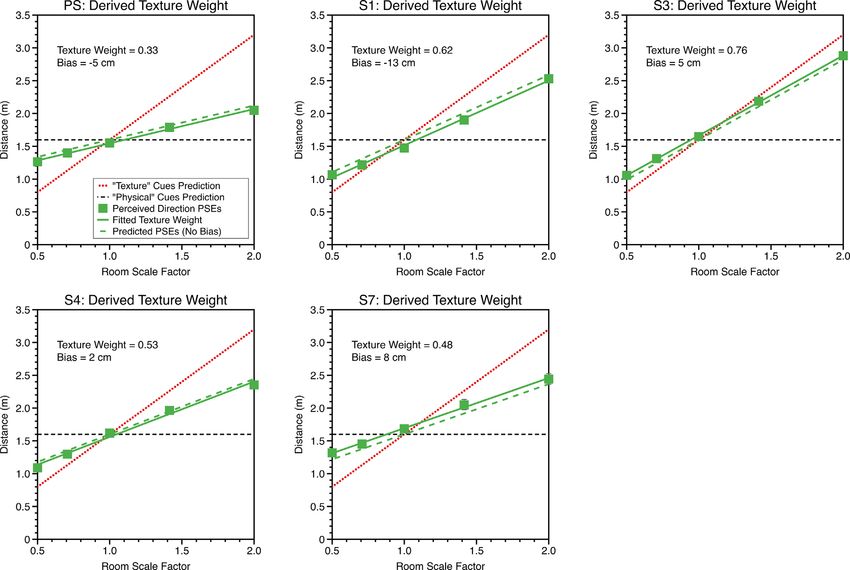
Journal of Vision (2021) 21(4):10, 1–25             Scarfe & Glennerster                                                                               8

2004; Rosas et al., 2004; Saunders & Chen, 2015; Todd,           intervals. Here we describe what this would look like
2015; Todd et al., 2010). Often, this remains an open            to an observer who relied 100% on texture cues. In
question (Rosas et al., 2004). With this aim in mind,            interval 1, the observer estimates the distance to the
before fitting psychometric functions to the data, we            ball (D) relative to a distance that is defined in terms
converted the room scale factor into a change in visual          of the room (R), which can refer to any property of
direction for each class of cue. In the following, we            the room, for example, the size of one of the square
describe this process and in doing so the predictions            tiles on the floor or the distance from the observer
that would follow if an observer relied entirely on either       to the back wall since these all covary. Thus, D/R is
class of cue.                                                    unitless and gives a measure of the distance of the
   In measuring a threshold for physical cues, when the          target that remains independent of the overall scaling
room scale between intervals 1 and 2, the ball remained          of the room. In interval 2, the observer walks across the
in the same position relative to the room. As a result,          room by distance B to view zone 2, again judging this
the ball’s physical position changed between intervals.          distance relative to the same property of the room. The
Here, we describe what that would look like to an                observer’s expectation of the ball’s visual direction at
observer who relied 100% on physical cues. In interval           view zone 2 is therefore given by:
1, the observer estimates the distance to the ball D from
view zone 1. In interval 2, they walk across the room
                                                                                          −1       D/R                −1       D
by distance B to view zone 2. The room has scaled in                       θ1Tex   = tan                      = tan                     (6)
size by a factor of Si between intervals 1 and 2 (where                                            B/R                         B
Si varies between trials and 0.5 < Si < 2), but because
the observer relies 100% on physical cues, they ignore              Because the ball remains in the same physical
this scaling and expect that the visual direction of the         position when the room scales, its distance relative
ball in view zone 2 will be:                                     to view zone 1 changes inversely to the rooms scale
                                                               (D/R)/Si .
                      D
      θ1Phy = tan−1          (3)
                      B
                                                                                     −1
                                                                                              (D/R) ∗    1
                                                                                                         Si                −1         D
                                                                    θ2Tex   = tan                                 = tan                          (7)
                                                                                                B/R                                 B ∗ Si
Thus, even though the observer in interval 1 is at zone 1,
with the target in front of them, Equation 3 refers to the
expectation of the angle θ to the target sphere as viewed          The difference in angle between intervals 1 and 2 for
from zone 2, but under the stimulus conditions present           an observer who relied 100% on texture cues would
in interval 1. However, in interval 2, room scaling causes       therefore be:
the ball’s physical distance from view zone 1 to change
                                                                                                −1     D
from D to D*Si . Thus, when the ball reappears, its angle             θ = θ2 − θ1 = tan
                                                                         Tex    Tex    Tex
from physical cues is given by                                                                       B ∗ Si

                                                                                       D
                      −1       D ∗ Si                                          − tan−1                        (8)
       θ2Phy   = tan                        (4)                                          B
                                 B
                                                                    Note that, if an observer relied 100% on physical
  The difference in angle between intervals 1 and 2 for          cues, we would be unable to measure a threshold for
an observer who relied 100% on physical cues would               texture cues because each trial would look identical
therefore be:                                                    to the observer (D and B are both unchanged across
                                                               trials). It is also important to note that θ2Tex refers to
                                      D ∗ Si
     θ Phy = θ2Phy − θ1Phy = tan−1                              the angle at which the observer would see the ball from
                                        B                        zone 2, if zone 2 had been scaled with the room (hence
                                                               B/R on the denominator is not multiplied by S1i in the
                          D
              − tan−1                          (5)               same way that D is, so that D remains fixed in physical
                          B
                                                                 coordinates). It does not matter that the visual direction
  Note that, if an observer relied 100% on texture               judgment takes place from a physically different place
cues, we would be unable to measure a threshold for              (namely, zone 2 at distance B from zone 1). The idea
physical cues because each trial would look identical to         is that, as the observer walks from zone 1 to zone 2
the observer.                                                    with a constant place in mind where they think that the
  In measuring a threshold for texture cues, when                ball was in interval 1, there should be some measure
the room scales between intervals 1 and 2, the ball              to describe that constant location, even though its
remains in the same physical position. As a result, the          visual direction changes as the observer walks. We have
ball’s position relative to the room changes between             chosen, for the sake of convenience, the visual direction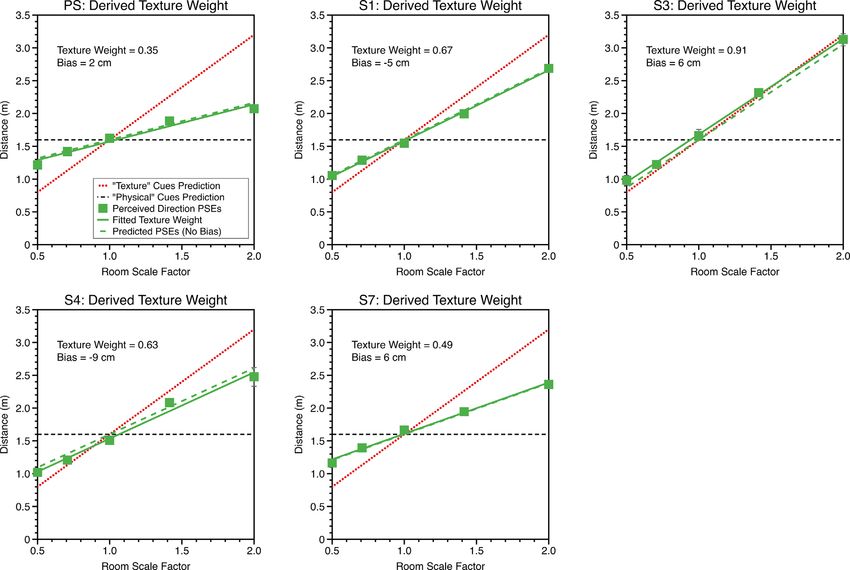
Journal of Vision (2021) 21(4):10, 1–25              Scarfe & Glennerster                                                        9

of that location as seen from zone 2, if zone 2 had been          2, the target distance relative to view zone 1 changes
scaled with the room, hence Equation 7.                           inversely to the room’s scale (while its physical distance
                                                                  remains constant):

Definition of cues for perceived distance                                               D
                                                                            DTex
                                                                             2   =           (13)
                                                                                       Si
   In measuring a threshold for physical cues for
distance, when the room scale changed between                       Hence, for an observer who relied only on texture
intervals 1 and 2, the ball remained in the same position         cues, the magnitude of the distance signal (the difference
relative to the room. As a result, the ball’s physical            between intervals 1 and 2) would be:
position changed between intervals. Here we describe
what that would look like to an observer who relied
                                                                                                                   1
100% on physical cues. In interval 1, the observer                          D   Tex
                                                                                       =   DTex
                                                                                            2     −   DTex
                                                                                                       1     =D 1−        (14)
estimates the distance D to the ball from view zone                                                                Si
1. In interval 2 they again estimate distance, but in a
room that has scaled in by a factor of Si . Because the
observer relies 100% on physical cues, they ignore this
scaling. Thus, their estimate of distance in interval 1 is         Results
assumed to be:
                                                                  Perceived direction: Single cues
       DPhy
        1   =D          (9)
                                                                      After conversion, cumulative Gaussian functions
and in interval 2 room scaling causes the ball’s physical         were fitted to observers’ data by maximum likelihood
distance from view zone 1 to change from D to D*Si :              in Matlab using the Palamedes software package with
                                                                  the mean and slope of the function as free parameters.
       DPhy = D ∗ Si           (10)                               These parameters correspond to the parameters of
        2
                                                                  interest set in the psi-marginal adaptive procedure
  So, the difference in estimated distance of the target          (Prins & Kingdom, 2009). The point of subjective
between intervals 1 and 2 for an observer who relied              equality (mean of the fitted cumulative Gaussian) and
100% on physical cues would therefore be:                         slope of the fitted function were estimated with 95%
                                                                  confidence intervals (CIs) computed via parametric
                                                                  bootstrapping (1,000 bootstrap samples). The standard
       DPhy = DPhy
                2   − DPhy
                       1   = D (1 − Si )      (11)                deviation of the cumulative Gaussian is given by the
                                                                  inverse of the slope. The standard deviation of the
   These equations are similar to Equations 3 through 5           fitted cumulative Gaussian is useful for determining the
earlier, but they refer only to the distance part (the            sensitivity of observers to that cue. We explain how we
left-hand edge of the triangle shown in Figure 2), rather         use this value to obtain an estimate of the reliability of
than θ . Just as in the case of direction judgments, if           the cue elsewhere in this article (Equations 17–20).
an observer relied 100% on texture cues, they would                   Psychometric functions for the three representative
be unable to detect any change between intervals 1                observers are shown in Figure 3. The observers shown
and 2 whatever the value of Si and hence we could not             in Figure 3 have different levels of experience. PS is one
measure a threshold in this experiment.                           of the authors, S1 is an experienced psychophysical
   As for direction thresholds, measuring a distance              observer naïve to the purposes of the experiment, and
threshold for texture cues requires that, when the room           S2 a naïve observer with little to no experience of
scales between intervals 1 and 2, the ball remains in the         psychophysical experiments.
same physical position. Consequently, the ball’s position             Clearly, it is only possible to fit functions to
relative to the room changes between intervals. Here we           observers’ data if they give some weighting to the cue
describe what this would look like to an observer who             that is being varied. If not, observers’ responses will
relied 100% on texture cues. In interval 1, the observer          not be related to changes in that cue’s value, making it
estimates the distance to the ball (D). In interval 2, the        impossible to fit a function. There were three observers
observer’s judgment of distance is given by:                      where we were unable to fit a function to one or more
                                                                  conditions due to them performing at chance across the
       DTex
        1   =D          (12)                                      whole stimulus range. For observer S3, we were unable
                                                                  to fit a function to measure physical cue thresholds for
   This is similar to Equation 6, which applied to                either position in the room (near wall or near middle),
direction but here only refers to distance (the left-hand         for S4 we were unable to fit a physical cue function
edge of the triangle shown in Figure 2). In interval              for the near middle condition, and for S5 we were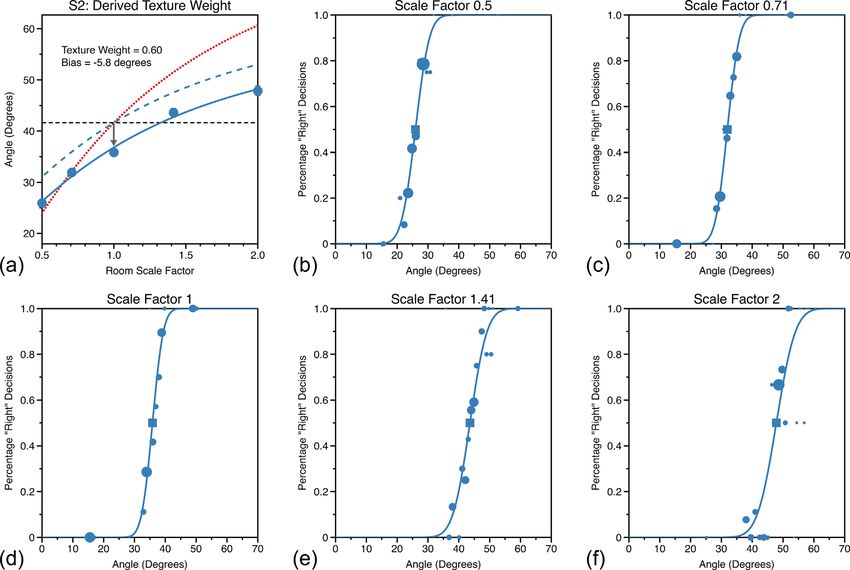
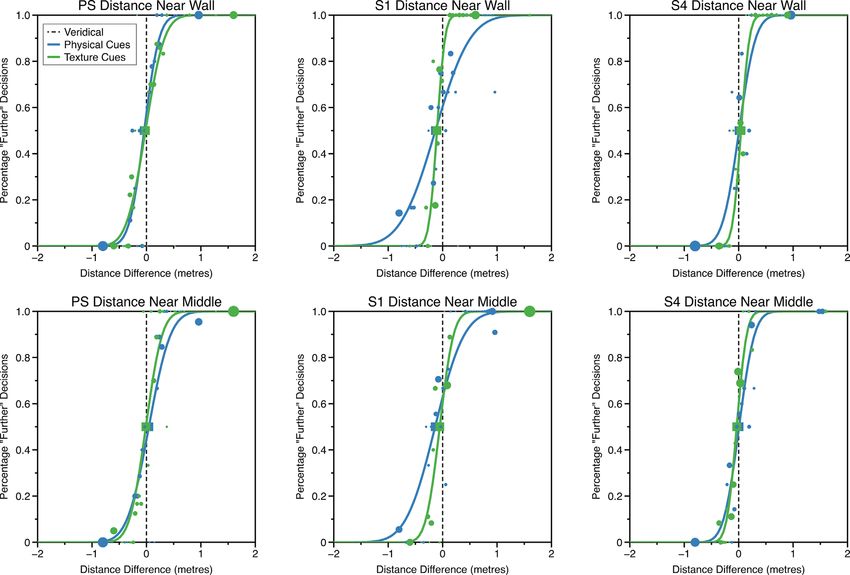
Journal of Vision (2021) 21(4):10, 1–25                    Scarfe & Glennerster                                                      10

Figure 3. Example psychometric functions for physical and texture cues for judgments of visual direction (upper row “near wall”
condition, lower row “near middle” condition). The area of the circular markers is proportional to the number of trials at that stimulus
level, as determined by the psi-marginal adaptive procedure. The squares represent the point of subjective equality (mean of the
psychometric function). Error bars around the PSE show bootstrapped 95% confidence intervals (where these are not visible, they are
smaller than the size of the marker). The vertical black dashed line shows “veridical” performance; the PSEs of the psychometric
functions would fall on this line if the observer was unbiased in judging visual direction.

unable to fit a texture cue function for the near middle                Visual direction: When both cues vary
condition. Therefore, in subsequent calculations, we
set cue weight to zero in these conditions for these                       Psychometric functions for perceived visual direction
participants.                                                           for each of the five room scale factors were fitted
   Potentially, we could have altered the scale of the                  using the same procedure as described above. Example
room over a wider range to map out a psychometric                       psychometric functions for each scale factor, for
function, but we chose not to do this for two reasons.                  observer S2 in the near wall condition are shown
First, we could not shrink the room any further without                 in Figure 4b–f. To estimate the weight given to texture
the physical position of view zone 2 lying beyond the                   when making visual direction judgments we fitted the
right-hand side wall of the scaled room. This would have                PSEs, from the different room scale factors with a linear
resulted in subjects walking through the wall and out of                model (Equation 15).
the room if it shrunk further. Second, the maximum
scale factor we were using already produces a room
with over double the floor area of a basketball court;                            A = kT + c   (15)
thus, it seemed unlikely that these observers would be
able give weight to the cues with further increases. A                  Here, T is the texture cue prediction of visual direction
more plausible explanation was that observers were                      so both A and T are vectors with five elements for
simply not giving any weight to the visual information                  the five scale factors we used. The multiplicative free
contributing to that particular threshold.                              parameter k represents the texture weight, whereas c is
Journal of Vision (2021) 21(4):10, 1–25 Scarfe & Glennerster 11
Figure 4. Example psychometric functions for judgments of visual direction while varying both classes of cue and for each of the five
room scale factors (b–f). In each of these plots, the area of the circular data points is proportional to the number of trials presented at
the that stimulus level (as determined by the psi-marginal adaptive procedure). Function PSEs are shown as squares, with error-bars
showing bootstrapped 95% confidence intervals (where these cannot be seen they are smaller than the symbol size). In (a) these PSEs
are plotted against room scale factor along with a fit of Equation 15 (blue dots and line), which was used to determine relative cue
weighting (k) and level of perceptual bias (inset text). The horizontal dashed black line shows the prediction if an observer gave zero
weight to texture-based cues, the dotted red line shows the prediction if the observer gave zero weight to physical cues (where both
predictions assume no bias in perceptual estimates). The dashed blue line shows the predicted perceived visual angle if the observer
weighted the cues as they did in the experiment but exhibited no perceptual bias (bias shown as dark grey arrow).
an additive parameter of the linear model incorporating Here, θiTex is the texture cue prediction of θ and varies
any bias. The solid line in Figure 4a shows an example with room scale factor Si , B is physical distance to the
fit for observer S1 for the near wall condition. This target ball, and D the physical distance from view zone
observer preferentially weights texture when making 1 to 2. The dashed blue line in Figure 4a shows the
judgments of visual direction. The dotted red line predicted performance if the observer weighted cues
shows the predicted visual direction if the observer by the same amount to that found, but exhibited no
gave full weight to texture cues while the black dashed perceptual bias.
line shows predicted visual direction if the observer Comparable plots for all observers are shown
gave full weight to physical cues. The physical cue in Figures 5 and 6 for the near wall and near middle
prediction is simply the physically correct angle, conditions. Observers tended to weight texture-based
θ Phy = 41.6◦ , whereas the texture cue prediction is cues more highly in both room positions. The
given by average weighting for texture-based cues was 0.71
near wall and 0.57 in the near middle. This differed
−1 B
θi = tan
Tex
(16) significantly from equal cue weighting in the near
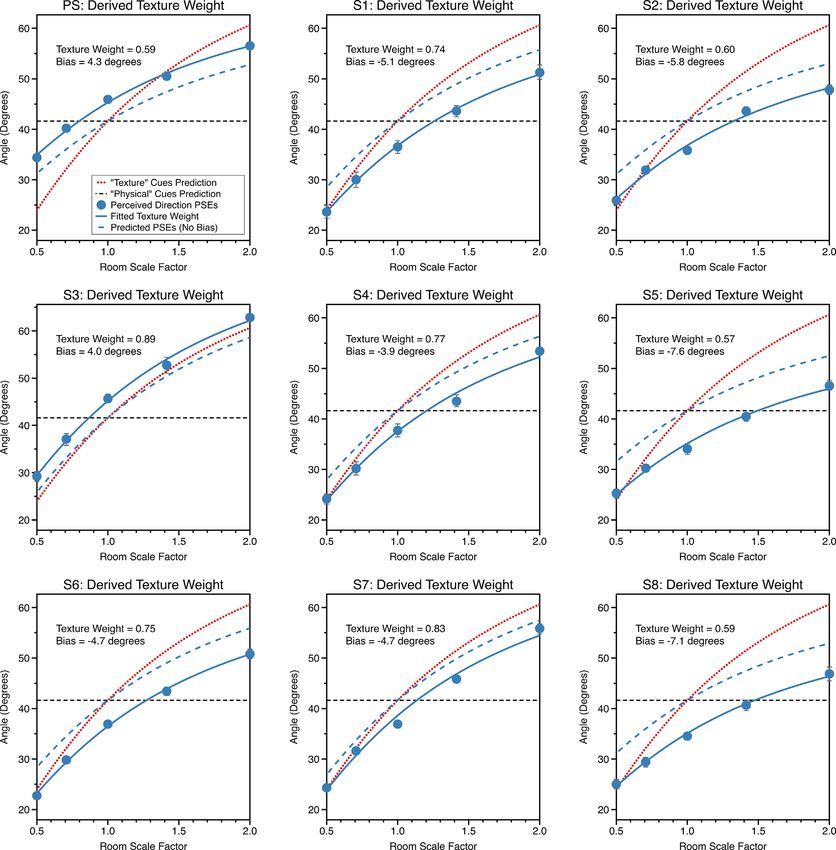
D/Si wall condition, t = 5.1, df = 8, 95% CI = 0.61–0.80,Journal of Vision (2021) 21(4):10, 1–25 Scarfe & Glennerster 12 Figure 5. PSEs are plotted against room scale factor for the “near wall” condition when both cues were varied, for each of the nine observers. Plots are formatted as described for Figure 4a. p = 9.32 × 10⁻⁴ , but not in the “near middle” Overall, when visual direction from both cues varied condition, t = 0.9, df = 8, 95% CI = 0.39–0.74, p = observers tended to underestimate visual angle. Seven of 0.4. In the section “Visual direction: Do observers nine observers underestimated visual direction in both optimally combine texture-based and physical-based room positions, whereas two observers overestimated cues?”, we examine whether the relative reliabilities of visual direction in both room positions. The average texture-based and physical-based cues can predict these bias was −3.40° near wall and −5.57° near middle. responses. This bias was significantly different from zero both in
Journal of Vision (2021) 21(4):10, 1–25                   Scarfe & Glennerster                                                     13

Figure 6. PSEs are plotted against room scale factor for the “near middle” condition when both cues were varied, for each of the nine
observers. Plots are formatted as described for Figure 4a.

the near wall condition, t = −2.30, df = 8, 95% CI =                   Visual direction: Do observers optimally
−6.81 to 0.01, p = 0.05, and near middle conditions, t                 combine texture-based and physical-based
= −3.37, df = 8, 95% CI = −9.37 to −1.75, p = 0.01.                    cues?
There was a significant linear relationship between the
bias observers exhibited in each room position, F(1, 7) =               Given the assumptions of the weighted averaging
36.69, p < 0.001 (Figure 7).                                           model, it should be possible to predict the weighting
Journal of Vision (2021) 21(4):10, 1–25                     Scarfe & Glennerster                                                  14

                                                                         magnitude of the static cue (zero in this case) and D̂C is
                                                                         the combined perceptual estimate (Landy et al., 1995).
                                                                         wA is the weight given to the changing signal cue and
                                                                         wB the weight given to the static cue. Thus, the presence
                                                                         of D̂B will have the effect of pulling D̂C toward zero on
                                                                         every trial, always by the same proportion.

                                                                                   D̂C = wA D̂A + wB D̂B   (17)

                                                                            As a result, the experimentally measured standard
                                                                         deviation, σ̂A , is overestimated relative to the true
                                                                         underlying standard deviation σ A . It is overestimated
                                                                         rather than underestimated because a higher value of
                                                                         D̂A needs to be presented than would otherwise be the
                                                                         case if the static cue D̂B were not presented to give rise
                                                                         to the same internal response (i.e., reach the same value
                                                                         on a fitted cumulative Gaussian curve). The magnitude
                                                                         of this overestimation is w1A . A derivation of this is
                                                                         given in Scarfe (2020, pp. 49–53). So, if each individual
                                                                         point on a psychometric function is shifted toward the
                                                                         mean (PSE) by the same proportion (e.g., 50%) then
                                                                         the standard deviation of the cumulative Gaussian fit
Figure 7. The bias in judgments of visual direction observed for         through the shifted data will reduce (by 50% in this
the “near wall” and “near middle” conditions, when both cues             example) but the mean (PSE) will not change. As a
varied (as in Figures 5 and 6). If observers exhibited no                consequence, the measured standard deviation σ̂A is
perceptual bias, all data would fall at the intersection of the          given by:
vertical and horizontal dashed lines. The pink line shows a linear
                                                                                           σA
fit to the data with associated 95% confidence bounds (R2 value                      σ̂A =        (18)
of the fit shown in text inset). Negative values in the lower left                          wA
quadrant indicate an underestimation of visual direction.
                                                                         Since

                                                                                   wA  σ2
of texture-based and physical-based cues based on the                                 = B2      (19)
                                                                                   wB  σA
single cue sensitivities we have measured (Equation 10).
However, we cannot simply use the standard deviation
of the cumulative Gaussian measured in the single cue                    the ratio of observed standard deviations for the two
sensitivity experiments (Figure 3) as an estimate of the                 cues from the sensitivity experiments is given by
reliability of each cue, 1/σ 2 . This is because both cues
were present during these measurements of sensitivity,                             σ̂A   σA wB  σ3
                                                                                       =       = A3    (20)
one signaling zero change from intervals 1 to 2, the                               σ̂B   σB wA  σB
other providing a signal that changed across intervals
and allowed the participant to carry out the task.                       This means that the underlying ratio of reliabilities,
Assuming cue combination occurs, the zero-change                         σA2
                                                                             , will be closer to unity than the ratio measured using
cue will still affect performance as, on every trial, it                 σB2
will decrease the perceived perturbation of the target                   the standard deviations     of the cumulative Gaussians
                                                                                                σ̂ 2
relative to the perturbation of the signal or changing                   shown in Figure 3, σ̂A2 . A number of papers which have
                                                                                                  B
cue that the experimenter has added (i.e., the values                    measured cue sensitivities whilst holding a conflicting
plotted on the x-axis of the psychometric functions                      cue constant would need to apply this correction to
in Figure 3). The extent of this reduction in the effective              accurately estimate cue reliabilities (Svarverud, et al.
magnitude of the signal cue is determined as follows.                    2012; Murphy et al., 2013). For an extended discussion
   First, we can see how the weights of the two                          see Scarfe (2020).
cues affects the measured standard deviation of                              Figure 8 shows the predicted and observed texture
the cumulative Gaussian in the comparison task.                          weights for the ‘near wall’ and ‘near middle’ conditions
Specifically, for any given trial, D̂A is the magnitude of               using σ A and σ B derived from Equation 20. If the
the changing or signal cue in the experiment, D̂B is the                 weighted averaging model perfectly predicted observers’
Journal of Vision (2021) 21(4):10, 1–25 Scarfe & Glennerster 15
Figure 8. Predicted and observed texture weights for judgments of visual direction in the (a) “near wall” and (b) “near middle”
conditions. Predicted weights are calculated from single cue sensitivities, observed weights from the data where both cues varied. If
the combined cues data were perfectly predicted from the weighted averaging model, the data would fall on the solid black diagonal
line in each plot. If the combined cue data were unrelated to single cue sensitivities, the data would fall (on average) along the dashed
black line in each plot. The blue line in each plot shows a linear fit to the data with associated 95% confidence bounds (R2 value of the
fit shown in text inset).
performance, all the data points should lie along the to estimate the cue weighting that participants used
black diagonal line with a slope of one and intercept for their distance judgments when both cues varied
of zero. We fitted a linear model to the data by least (Equation 15). Figure 10 shows fits for the near wall
squares. There was a significant linear relationship condition and Figure 11 for the near middle condition.
between predicted and observed texture cue weights for Consistent with the single cue threshold data, biases
both the near wall, R2 = 0.64, F(1, 7) = 12.4, p = 0.01, were universally small.
and near middle conditions, R2 = 0.79, F(1, 7) = 26.0, Figure 12 shows predicted and observed texture
p = 0.001. weights for the distance judgments made near the wall
(left) and near the middle of the room (right). There
was a significant linear relationship between predicted
Perceived distance: Single cues and observed texture cue weights for both the near wall,
R2 = 0.95, F(1, 3) = 56.6, p = 0.005, and near middle
After converting changes in room scale factor conditions, R2 = 0.78, F(1, 3) = 10.9, p = 0.045.
between intervals 1 and 2 into differences in ball
distance, from each class of cue, cumulative Gaussian
functions were fitted in the same way as described Are estimates of distance and direction
elsewhere in this article. Example functions for three consistent with one another?
representative observers are shown in Figure 9. The
observers are the same as in Figure 3, except for S2 To see whether observers’ judgments of direction
who did not take part in the distance experiment. S2 and distance are mutually consistent, they need to be in
has been replaced by S4, who is also an observer naïve common units (either distance or direction). Therefore,
to the purposes of the experiment, with little or no for the following we have converted observers’ distance
experience of psychophysical experiments. judgments (and the standard deviation around these
values) into units of visual angle. For each room scale
factor this angle is calculated as the visual direction
Perceived distance: Do observers optimally observers would perceive the ball to be in from view
zone 2, if it were at the position defined by the PSE in
combine texture-based and physical-based the distance judgment (see Figure 2).
cues?
Psychometric functions for perceived distance for
each of the five room scale factors were fitted using the −1 DPSE
θdist = tan (21)
same procedure as described and a linear model fitting DwalkedYou can also read