White matter integrity in young medication naïve bipolar II depressed adults - Nature
←
→
Page content transcription
If your browser does not render page correctly, please read the page content below
www.nature.com/scientificreports
OPEN White matter integrity in young
medication‑naïve bipolar II
depressed adults
Arthur Dun Ping Mak1*, Owen Ngo Wang Leung1, Idy Wing Yi Chou1, Sheila Lok Yiu Wong1,
Winnie Chiu‑wing Chu2, David Yeung3, Suzanne Ho‑wai So4, Suk Ling Ma1,
Linda Chiu Wah Lam1, Chi Ming Leung1 & Sing Lee1
It is unknown if young medication-naïve bipolar II (BPII) depressed patients have increased white
matter (WM) disruptions. 27 each of young (average 23 years) and treatment-naïve BPII depressed,
unipolar depressed (UD) patients and age–sex–education matched healthy controls (HC) underwent
3 T MRIs with diffusion tensor imaging. Diagnostic ratings included Structured Clinical Interview
for DSM Disorders (SCID), Montgomery-Åsberg Depression Rating Scale (MADRS), Young Mania
Rating Scale (YMRS) and Hamilton Anxiety Rating Scale (HAM-A). Patients were clinically depressed
(MADRS-BPII: 26.15 [SD9.25], UD: 25.56 [5.24], p = 0.86). Compared to UD, BPII had increased
family bipolarity (BPII 13.6% vs UD 2.5%, p = 0.01, φc = 0.28), hypomanic symptoms (YMRS-BPII:
4.22 [4.24], UD: 1.33 [2], p = 0.02, d = 0.87), lifetime number of depressive episodes (BPII: 2.37 [1.23],
UD: 1.44 [0.75], p = 0.02, d = 0.91), lifetime and current-year number of episodes (lifetime BPII: 50.85
[95.47], UD: 1.7 [1.03]; current-year BPII: 9.93 [16.29], UD: 1.11 [0.32], ps = 0.04, ds = 0.73–0.77) and
longer illness duration (BPII: 4.96 years [3.96], UD: 2.99 [3.33], p = 0.15, d = 0.54). BPII showed no
increased WM disruptions vs UD or HC in any of the 15 a priori WM tracts. UD had lower right superior
longitudinal fasciculus (SLF) (temporal) axial diffusivity (AD) (1.14 vs 1.17 (BPII), 1.16 (HC); F = 6.93,
95% CI of FB: 0.00073, 5.22, ηp2 = 0.15). Principal component analysis followed by exploratory linear
discriminant analysis showed that increased R-SLF (temporal) AD, YMRS and family bipolarity
distinguished BPII from UD (81.5% sensitivity, 85.2% specificity) independent of episode number and
frequency. Young, medication-naïve adults with BPII depression did not show the WM disruptions
distinguishing more chronically ill BP patients from UD. These WM disruptions may therefore be partly
attributable to illness chronicity. Longitudinal studies should examine the trajectory of WM changes in
BPII and UD and predictive validity of these baseline clinical and imaging parameters.
Bipolar II disorder (BPII) is the commonest subtype of bipolar disorders1. Depression dominates the course of
BPII and is the commonest mode of clinical presentation of the disorder. This phenomenological overlap with
unipolar depression (UD) belies important clinical differences—poorer response to antidepressants, younger
onset, higher recurrence, atypical features, cognitive impairment and increased suicide rates compared with
UD2–5. Understanding the neurobiological differences between BPII depression and UD should yield important
insights into the core etiological mechanisms differentiating between bipolar and unipolar illnesses and guide
therapeutic development.
Diffusion tensor imaging (DTI) studies on bipolar disorders have found white matter (WM) connectivity
disruption, consistent with a model of emotional dysregulation, in the fronto-limbic circuitry (cingulum, unci-
nate fasciculus), inter-hemispheric circuitry (corpus callosum), the fronto-parieto-temporal long associative
fibers, and frontal and temporal regions, compared to healthy subjects6–9, with more widespread disruptions
compared to UD7,10–12. There has been a paucity of direct comparisons between UD and BPII, and the findings
above were mostly based on bipolar I (BPI) samples. Findings from the few studies pertaining to BPII were
also less consistent. One study reported increased fiber alterations in temporal and inferior prefrontal region
in BPII13. while others found sparing of WM disruption in uncinate fasciculus14 and the corpus callosum9. It
1
Department of Psychiatry, G/F Multicentre, Tai Po Hospital, The Chinese University of Hong Kong, Tai Po,
Hong Kong, SAR, China. 2Department of Imaging and Interventional Radiology, The Chinese University of Hong
Kong, Hong Kong, SAR, China. 3Department of Clinical Oncology, Prince of Wales Hospital, Hong Kong, SAR,
China. 4Department of Psychology, The Chinese University of Hong Kong, Hong Kong, SAR, China. *email:
arthurdpmak@cuhk.edu.hk
Scientific Reports | (2021) 11:1816 | https://doi.org/10.1038/s41598-021-81355-9 1
Vol.:(0123456789)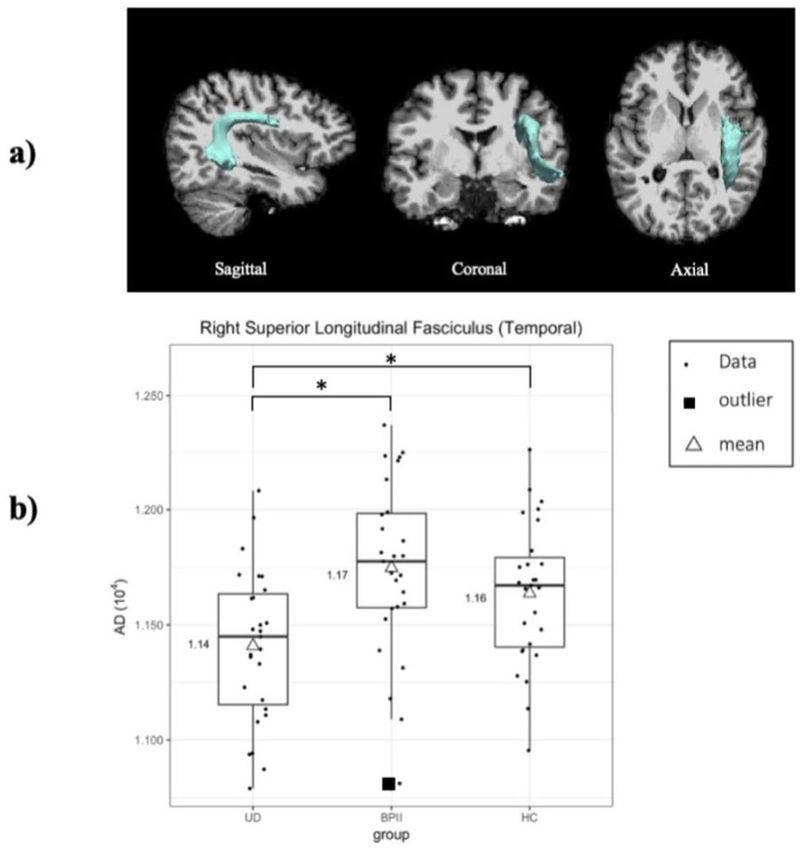
www.nature.com/scientificreports/
Measure UD (N = 27) BPII (N = 27) HC (N = 27) DOF F 95% CI of FB ηp2
a a a
FA 0.48 (0.02) 0.48 (0.02) 0.48 (0.02) 2, 78 0.78 0.00075, 40.89 0.02
AD 10.14 (0.03)a,b 10.17 (0.03)a,b 10.16 (0.03)a,b 2, 78 60.93c 0.00073, 50.22 0.15
RD 0.52 (0.02)a,b 0.53 (0.02)a,b 0.53 (0.03)a,b 2, 78 0.68 0.00115, 40.94 0.02
MD 0.73 (0.02)a,b 0.75 (0.02)a,b 0.74 (0.02)a,b 2, 78 30.65 0.00152, 40.84 0.09
Post-hoc
UD vs. BPII UD vs. HC BPII vs. HC
DOF t 95% CI of tB Cohen’s D DOF t 95% CI of tB Cohen’s D DOF t 95% CI of tB Cohen’s d
AD 52 3.50c − 1.93, 2.03 1 52 2.62c − 2.06, 2.12 0.67 52 − 1.17 − 1.92, 1.93 0.33
Table 1. DTI measures at right superior longitudinal fasciculus and ANOVA results. CI confidence interval,
FB bootstrapped F statistics, DOF degrees of freedom, tB bootstrapped t statistic, UD Unipolar Depression, BPII
Bipolar II Disorder, HC healthy control, FA fractional anisotropy, AD axial diffusivity, RD radial diffusivity,
MD mean diffusivity. a Mean (SD). b Multiply by 10–3. c Statistically significant, where the observed statistics was
not within the 95% CIs of the bootstrapped statistics.
is also uncertain whether the contradicting findings were attributable to heterogeneity in illness chronicity
(7.3–18.8 years)7–10,13. In fact, while WM disruptions has been proposed as an endophenotypic/trait marker
of bipolarity15, oxidative stress from longer illnesses with more illness episodes may result in increased myelin
disruption in bipolar d isorders16. Heterogeneity in illness chronicity in the samples may therefore potentially
contribute to the inconsistent findings. In addition, exposure to medications such as lithium17, antipsychotics17,
anticonvulsants18, antidepressants19 in Bipolar Disorder (BD) has been known to result in changes in WM integ-
rity that may further add heterogeneity to the results. This may be especially relevant to UD vs BPII comparisons
in view of the considerable difference in medications prescribed for these two conditions. We therefore set out to
examine WM abnormalities in treatment-naïve BPII subjects relatively close to onset, in comparison with UD
and healthy controls (HC). DTI derived indices of WM integrity (fractional anisotropy [FA], mean diffusivity
[MD], radial diffusivity [RD], and axial diffusivity [AD]) are obtained for 15 a priori, well-characterized white
matter tracts implicated in B D18,20. The between-group differences are examined with a multi-variate statistical
model to differentiate BPII from UD.
Results
Demographics. Twenty-seven each of BPII, UD and HC subjects were included in the analyses. There was
no significant difference of age (F[2,78] = 0.79, p = 0.46), gender (X2[2, N = 81] = 1.5, p = 0.47), and years of educa-
tion (X2[4, N = 81] = 5.12, p = 0.28) amongst the three groups (Supplementary Table S1).
Clinical characteristics in BPII and UD patients. All patients were currently in a major depressive
episode (MDE), as defined in the text revision of the fourth edition of the Diagnostic and Statistical Manual
of Mental Disorders (DSM-IV-TR), of at least moderate severity. UD and BPII patients had no significant
between-group difference in Montgomery–Åsberg Depression Rating Scale (MADRS) scores (t[52] = 0.29,
p = 0.86) or functional impairment (Short-form-36 health survey physical component summary [SF-36 PCS]
t[52] = − 0.2, p = 0.89; mental component summary [MCS] t[52] = 0.68, p = 0.73), but mean current Young Mania
Rating Scale (YMRS) score (t[52] = 3.2, p = 0.02, Cohen’s d = 0.87) was significantly higher in BPII. The bipolar
patients have had on average 5 years since first depressive onset, numerically but not significantly longer than
UD (t[52] = 1.97, p = 0.15). BPII patients had larger lifetime number of depressive episodes (t[52] = 2.41, p = 0.02,
Cohen’s d = 0.91), number of episodes in the past year (t[52] = 2.81, p = 0.04, Cohen’s d = 0.77), lifetime num-
ber of episodes (t[52] = 2.64, p = 0.04, Cohen’s d = 0.73), family history of hypomania (HM)(X2[1, N = 81] = 6.48,
p = 0.01, φc = 0.28), and bipolarity Index (t[52] = 6.54, p < 0.001, Cohen’s d = 1.78) than UD. HC had significantly
higher estimated IQ score than BPII (p = 0.03) and UD (p = 0.01) patients (F[2,77] = 5.07, p = 0.009, ηp2 = 0.12)
(Supplementary Table S1).
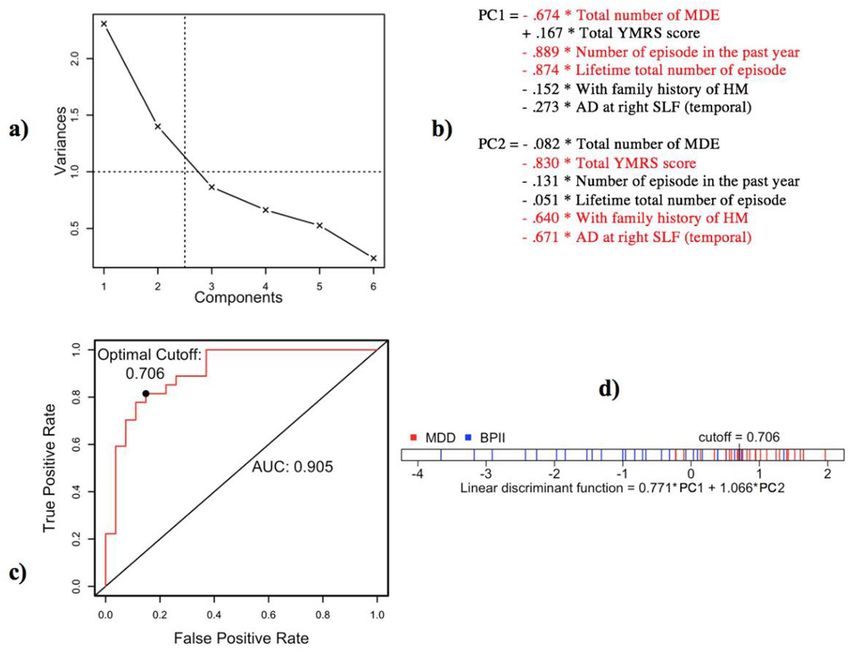
Group differences of white matter measures. TRACULA. Bootstrapped ANOVA was done on each
DTI measure at each tract with 1000 iterations and the bootstrapped FB were extracted. Significant difference
was found only for AD at the right superior longitudinal fasciculus (SLF) (temporal) (1.14 (UD), 1.17 (BPII),
1.16 (HC); F[2,78] = 6.93, 95% confidence interval (CI) of FB: 0.00073, 5.22; ηp2 = 0.15). No significant group dif-
ferences of DTI measures were found in any of the remaining tracts (ps > 0.05; observed F fell within the 95% CIs
of FB). Post-hoc t-tests indicated significantly lower AD at the right SLF (temporal) in UD compared to BPII and
HC (t statistic not within 95% CIs of bootstrapped t statistic, Cohen’s d vs BPII = 1; Cohen’s d vs HC = 0.67), but
no significant difference between BPII and HC (Table 1 and Fig. 1).
To explore the effect of age on the DTI measures in each diagnostic group, group-by-age ANOVA with boot-
strapping was conducted (Supplementary Table S2). Results revealed significant interaction between group and
age on MD at the right inferior longitudinal fasciculus (ILF) (7.73 × 10⁻⁴ (UD), 7.82 × 10⁻⁴ (BPII), 7.74 × 10⁻⁴
(HC); F = 5.28, 95% CI of FB 0.001, 5.02). Post-hoc one-way ANOVA showed significant effect of age in BPII
only (F = 5.28, 95% CI of FB 0.001, 5.02), but not UD and HC (observed F fell within 95% CI of bootstrapped FB).
Scientific Reports | (2021) 11:1816 | https://doi.org/10.1038/s41598-021-81355-9 2
Vol:.(1234567890)www.nature.com/scientificreports/
TBSS. Permutation tests with threshold-free cluster enhancement (TFCE) revealed no significant between-
group voxel-wise difference of FA, AD and RD (ps > 0.05), adjusted for age, sex and education level.
Correlations between TRACULA and clinical data. No significant correlation between clinical and
DTI variables were found when data of both patient groups were combined (observed r fell within the 95% CIs
of rB). Correlation was also examined for each patient group separately. In the UD group, AD at right superior
longitudinal fasciculus (SLF; temporal) correlated negatively with family history of major depressive disorder
(MDD; r = − 0.307, 95% CI of rB − 0.196, 0.204). In BPII, AD of right SLF (temporal) positively correlated with
family history of MDD (r = 0.203, 95% CI of rB − 0.169, 0.136), and negatively with Bipolarity Index (r = − 0.121,
95% CI of rB − 0.109,0.585). Correlations between AD at right SLF and other clinical variables were not signifi-
cant (ps > 0.05; observed r fell within the 95% CIs of rB) (Table 2).
Predictive models. Principal component analysis (PCA) results are illustrated in Fig. 2a,b. To understand
the relationship between imaging and clinical variables, we first included five clinical and one DTI variables with
significant differences between UD and BPII in the PCA: (1) total number of Major Depressive Episodes, (2)
number of episodes in the past year, (3) total YMRS score, (4) lifetime total number of episodes, (5) family his-
tory of HM, and (6) AD at right SLF (temporal). Bipolarity Index was not included in the analysis as its inherent
multi-dimensional nature would make it difficult to interpret in the multivariate model.
According to the scree plot, two components were found to account for 61.9% of variance in our data (Fig. 2a).
Component 1 (PC1): Episodic recurrence. Component 1 included three variables of medium-to-high negative
loadings, namely lifetime total number of MDE, lifetime total number of episodes and the number of episodes
in the past year.
Component 2 (PC2): WM integrity and family history/severity of hypomania. Component 2 included three
medium-to-high negative loadings for right SLF (temporal) axial diffusivity, current YMRS score and family
history of bipolar disorder.
These two components were then entered into linear discriminant analysis (LDA, which resulted in a linear
discriminant function: 0.771 × PC1 + 1.066 × PC2, with 81.5% sensitivity and 85.2% specificity (Fig. 2c,d). Value
above the cut-off at 0.706 indicated UD, whereas value below the cut-off indicated BPII.
A second PCA was then run with only clinical variables ((1) to (5)) to clarify the effect of inclusion of right SLF
(temporal) AD in the model (Supplementary Figure S1). Results revealed a grossly similar component structure,
where two components of episodic recurrence and family history/hypomania severity explained 67.6% of vari-
ance in the data, and the LDA classified patient groups with 69.2% sensitivity and 92.6% specificity.
Discussion
We did not find evidence of increased white matter disruption in our sample of young and treatment-naïve
depressed bipolar II patients, in comparison with age/sex/education matched unipolar depressed and healthy
subjects. To our knowledge, this is the only neuroimaging study comparing treatment-naïve patients with bipolar
II depression and unipolar depression.
Our findings stand in contrast to existing reports of widespread WM loss that were summarised in a recent
ENIGMA meta-analysis of DTI studies on 1482 BD patients, which reported widespread WM abnormalities in
BD, with no significant difference between the two subtypes9,18. This discrepancy could ensue from a few salient
features in our sample.
Firstly, before we disregard the potential impact of WM in the bipolar subtypes, we need to consider firstly,
that the lack of a BPI group precluded direct comparison with BPII subjects in our study, while two previous
studies did report relative sparing of WM changes in uncinate fasciculus and corpus callosum in BPII compared
to BPI and unaffected s iblings9,14, which is consistent with the absence of WM loss in this BPII sample, and our
earlier report of relatively preserved cognitive functioning of young treatment-naïve BPII patients21. These three
studies all suffered from relatively small sample sizes (32, 58 and 20 BD, respectively), Further studies including
probands and unaffected siblings of both BPI and BPII for comparison would be needed.
Secondly, our sample was medication-naïve. It is premature to conclude if the absence of WM disruption in
our BPII sample was attributable to medication naivety. To begin with, structural and functional changes have
been shown to commence in BD before receiving any medication22,23, and continued to be seen after medications
were stopped for > 2 months24,25. On the other hand, studies on the effect of medications on brain structure in BD
are conflicting. An earlier review suggested that medications generally did not contribute to structural differences
between BD and HC, and where the effect was present, it was usually normalizing26. However, the authors also
noted that many of the comparisons between medicated and unmedicated subjects were underpowered (sample
sizes as small as n = 2), and a recent meta-analysis identified reduced FA in patients receiving antipsychotics and
anticonvulsants in multiple regions of i nterest18. Multiple lines of evidences support the neuroprotective effects of
mood stabilizers and l ithium18,26–28, although one study did observe reduced FA only in lithium-treated but not
lithium-free BD versus H C29. Clarifying the effects of different drugs in medicated samples requires overcoming
numerous challenges in sample size limitations, variations in medication load, combinations and adherence,
the common occurrence of polypharmacy managing bipolarity, and also complex symptomatic differences that
influence choice of medication use.
Unfortunately, examination of unmedicated samples have been rare. One study of unmedicated (eight of the
18 patients were treatment-naïve) pediatric BP-I patients did not find any WM disruptions30, but reduced FA
in superior frontal regions was reported in a small sample of medication-naïve adolescent BP-I patients in their
Scientific Reports | (2021) 11:1816 | https://doi.org/10.1038/s41598-021-81355-9 3
Vol.:(0123456789)www.nature.com/scientificreports/
Figure 1. (a) Right superior longitudinal fasciculus (temporal) overlaid on the T1-weighted MR images (in
native space) of a representative subject. Pathway was retrieved from the 4D volume provided by TRACULA.
(b) Box plots of axial diffusivity at the right superior longitudinal fasciculus (temporal).
UD + BPII (N = 54) UD only (N = 27) BPII only (N = 27)
Clinical variable r 95% CI of rB r 95% CI of rB r 95% CI of rB
MADRS − 0.027 − 0.315, 0.207 − 0.160 − 0.400, 0.373 0.004 − 0.400, 0.394
YMRS 0.351 0.135, 0.522 0.049 0.039, 0.633 0.292 − 0.109, 0.503
HAM-A − 0.309 − 0.483, 0.066 − 0.114 − 0.572, 0.164 − 0.515 − 0.561, 0.171
Year since depressive onset 0.159 − 0.074, 0.384 0.011 − 0.169, 0.508 0.080 − 0.194, 0.456
Total number of MDE 0.204 − 0.084, 0.448 − 0.046 − 0.209, 0.539 0.070 − 0.213, 0.547
Number of episodes in the past year 0.285 − 0.036, 0.475 0.055 − 0.123, 0.552 0.200 − 0.126, 0.565
Lifetime total number of episodes 0.215 0.043, 0.407 − 0.106 − 0.077, 0.517 0.102 − 0.060, 0.496
Bipolarity Index 0.252 − 0.007, 0.477 0.040 − 0.097, 0.518 − 0.121* − 0.109, 0.585
Lifetime number of comorbid disorders 0.113 − 0.105, 0.352 0.286 − 0.205, 0.496 0.134 − 0.230, 0.418
Lifetime number of anxiety disorders 0.105 − 0.163, 0.350 0.281 − 0.285, 0.500 0.108 − 0.289, 0.390
Family history of MDD − 0.007 − 0.128, .113 − 0.307* − 0.196, .204 .203* − 0.169, .136
Family history of HM .200 − 0.045, .417 − 0.085 − 0.171, .580 .093 − 0.341, .325
SF-36 PCS 0.011 − 0.238, 0.287 − 0.043 − 0.370, 0.414 0.081 − 0.358, 0.430
SF-36 MCS 0.125 − 0.140, 0.379 0.058 − 0.275, 0.485 0.118 − 0.281, 0.455
Table 2. Correlations between clinical variables and AD at the right SLF (temporal). MADRS Montgomery–
Åsberg Depression Rating Scale, YMRS Young Mania Rating Scale, HAM-A Hamilton Anxiety Rating Scale,
MDE Major Depressive Episode, HME Hypomanic Episode, SF-36 36-Item Short Form Survey, PCS Physical
component summary, MCS Mental component summary, CI confidence interval, rB Bootstrapped Pearson
correlation coefficient. *Statistically significant, where the observed statistics was not within the 95% CIs of the
bootstrapped statistics.
Scientific Reports | (2021) 11:1816 | https://doi.org/10.1038/s41598-021-81355-9 4
Vol:.(1234567890)www.nature.com/scientificreports/
Figure 2. (a) Scree plots showing the amount of variance explained by each component in the principal
component analysis. (b) Principal component analysis loadings. (c) Receiver operating curve of the function. (d)
Linear Discriminant Function.
first manic episode (n = 11)31. While medications are not expected to entirely explain the heterogeneity of the
WM findings as noted above, examination of treatment-naïve samples should allow better comparability and
removal of its confounding effects especially in the comparison of structural connectivity measures between
bipolar and unipolar samples.
Alternatively, the paucity of white matter disruption in these young (average age 23), treatment-naïve bipolar
II patients with an average of 5 years of illness may suggest that the wide spread WM disruptions summarised in
the ENIGMA meta-analysis, with average age of 39.6 and on average 15.47 years since illness onset9,18, could be
attributable to neuroprogression. Neuroprogression in bipolar disorder refers to the accumulation of biological
disruptions, such as increase in pro-inflammatory cytokines and reduction in neurotrophins, following acute
mood instability which progressively increase patients’ vulnerability to subsequent affective e pisodes32. This is
consistent with previously reported correlations of illness chronicity with impaired WM i ntegrity6,33, although
WM disruptions had also been found in samples with shorter illness durations (0.2–5.6 years)9, individuals at
high familial risk of BD who have not experienced any affective episodes6, and changes in brain volume and
functional connectivity have been shown in first-episode BD patients22,34. Late onset and short disease duration
were also found in the ENIGMA meta-analysis to be correlated with higher FA in multiple R OIs18. In fact, our
observation of significant group-by-age interaction in MD, with age affecting MD in the right ILF specifically
in BPII (but not UD and HC) appears consistent with existing evidence of neuroprogression leading to WM
damage as a specific phenomenon in bipolar disorder.
The significant reduction in UD patients, compared to BPII and HC, of AD in the right SLF, may reflect
increased WM d isruption35 in medication-naïve UD but not individuals with BPII. Decreased AD has previ-
ously been reported in first-episode treatment-naïve UD patients, but in left rather than right SLF36. The lack of
between-group difference in RD with reduced axial diffusivity suggested that impaired axonal integrity, instead
of myelin loss, explained the reduction of MD, which is a scalar estimate of mean water diffusivity perpendicular
and parallel to the tract37. The difference was unlikely related to clinical severity or chronicity effects, as UD and
BPII groups had similar depressive and anxiety severity scores, number of comorbid disorders and significantly
fewer affective episodes in UD. The two groups’ similar percentages of patients with family depressive history
also did not suggest stronger biological loading in the UD group.
The negative correlation between family history of MDD and AD in the right SLF UD group may suggest a
link of heritable susceptibility to depressive disorder to impaired axonal integrity in UD. Indeed, altered WM
Scientific Reports | (2021) 11:1816 | https://doi.org/10.1038/s41598-021-81355-9 5
Vol.:(0123456789)www.nature.com/scientificreports/
integrity in multiple ROIs including bilateral SLF, has been shown in healthy adolescents at familial risk for
affective disorders38. Interestingly, in the BPII group, AD in right SLF correlated negatively with bipolarity index,
suggesting a potential relationship between inherent and manifest bipolarity and axonal damage, but given the
multidimensional nature of this i ndex39, it would require larger samples to elucidate whether it was the family
bipolarity, course or symptom characteristics that explained the correlation. The positive correlation of family
history of MDD with AD in right SLF in the BPII group is in conflict with the negative correlation observed in
the UD sample. Although consistent with our ANOVA result that BPII group has increased AD in right SLF,
this finding suggests that familial risk of depressive disorder may relate to increased axonal integrity in patients
with bipolar disorder. This finding needs to be further examined in larger samples, which could benefit from
combined analysis of comparable samples in multi-centre studies.
WM disruption in the SLF had been reported in medication-free patients with UD40 to be associated with
depressive symptoms and a possible trait marker for late-life depression. For right SLF (temporal) integrity (AD)
to co-vary only with trait (family bipolarity) and symptom (hypomanic) markers of bipolarity in the PCA results
in the present study, and to discriminate UD from BPII with good sensitivity and specificity in LDA among
the depressed patients, along with a separate component that indicates episodic recurrence (known marker for
bipolarity), in fact suggested right SLF (temporal) integrity to be a potential discriminant marker for bipolar
II vs unipolar depression that is independent of course characteristics. However, the sensitivity and specificity
in this exploratory LDA was likely inflated by the application of this model on the same samples from which
the measures were chosen based on one-way ANOVAs to differentiate the two samples. To compensate for this
shortcoming, we performed another LDA with leave-one-out cross-validation and found similar prediction
accuracies (see Supplementary Table S3), which ensured that the accuracy of the selected training sample for
deriving discriminant scores was optimistic. Nonetheless, these factors should be further tested on samples
recruited de novo, which would greatly benefit from multi-centre collaboration.
There are other limitations that need to be considered in interpreting the findings here. Firstly, WM integrity is
only one of many factors affecting DTI indices41. Even though the 15 a priori WM tracts are well-characterised42,
there are still likely crossing fibres present in some of the tracts to affect water diffusion. Any such group differ-
ences in tissue fibre architecture, as well as axon diameter and packing density are all potential confounds that
could have obscured WM disruptions in BD. Secondly, our sample may have excluded more severely depressed
or suicidal patients, who would have required immediate inpatient treatment, which may render brain scan in
a treatment-naïve state risky and ethically questionable. To the extent that these such patients may be expected
to have greater biological disturbances, our findings may have underestimated WM disruptions in BD and UD.
Thirdly, a larger sample size, or meta-analyses may enhance power that is needed to detect smaller white matter
changes and examine the effects of clinical bipolar correlates of possibly smaller effect size, such as family loading
and age of onset. Fourth, the lack of a BPI comparison group precludes direct comparison with our BPII patients.
As mentioned, it is therefore uncertain if the observed differences (or lack thereof) between UD and BPII were
specific to BPII or applicable to BPI as well. Fifth, the exclusion of psychosis or substance use has allowed us to
conduct a more homogeneous investigation, but may have also limited us from accessing a fuller spectrum of
bipolarity which would be associated with these two conditions. Lastly, we do not have data on the subjects’ body
mass index, which were reported to be associated with WM a bnormalities43. Although none of our young and
medication-naïve patients reported metabolic syndromes, general medical illnesses frequently comorbid with
BD such as obesity, hypertension and diabetes44, may confound the WM disruptions observed in DTI studies
and should be included in further research.
The imaging and DTI processing approaches adopted in our study may have shortcomings compared to
those used in the Human Connectome Project (HCP). The global probabilistic tractography used in this study
(TRACULA) enabled fast and automated quantification of WM tracts in individual subject’s space, eliminating
the inaccuracies caused by inter-subject registration. However, with this approach, a single FA (and other DTI
indices) was used to quantify the diffusion asymmetry of the entire tract, which might have diluted any WM
abnormalities that were not present universally along the tract. Also, tractography was performed for the 15 WM
tracts pre-defined by the toolbox only, which may overlook the possibility of other tracts and brain areas that
relate to the psychopathological conditions of interest. Alternatively, TBSS enabled voxel-wise comparison of WM
tracts between different groups of participants, but reliability has been proven to depend heavily on the specific
DTI-derived measure and the pre-processing steps (e.g. warping subjects to a common individual template,
smoothing DTI data, etc.)45. On the one hand, these methods allow automated and straightforward processing
of DTI data, which is best suited for exploratory analyses. On the other hand, more advanced imaging and pro-
cessing approaches are useful for characterizing the structural, as well as functional, connectivity in bipolar II
disorder holistically. Indeed, the state-of-the-art HCP has enabled advances in imaging and processing pipelines
that improve efficiency and accuracy of MRI data analysis46. For example, the ‘multi-band’ pulse sequences47 and
customized scanners with increased maximum gradient strength benefit diffusion MRI by enhancing spatial
resolution (1.25 mm)48, which facilitates identification of cross-fibers. Scanners with increased diffusion gradi-
ent directions have also been developed to improve sensitivity of tractography and support more sophisticated
models49,50. An increasing body of research has used probabilistic tractography to build connection matrix that
summarizes the macroscopic connectivity of every brain area. In addition, whole brain connectomics analysis
of this dataset is under way, which is hoped to shed light on differences in the network characteristics of these
BPII and UD patients. Further efforts will also benefit from alignment with the state-of-the-art HCP pipelines
in image acquisition and pre-processing.
In summary, in this first DTI study comparing young and treatment-naïve BPII and UD patients, we could
not find evidence of increased WM disruption in BPII disorder. Whether this represents a contemporaneous
subtype difference between BPI and BPII merits direct, treatment-naïve, comparison. The discrepancy of our
findings from previous BPII studies also belies the methodological salience in examining patients stratified
Scientific Reports | (2021) 11:1816 | https://doi.org/10.1038/s41598-021-81355-9 6
Vol:.(1234567890)www.nature.com/scientificreports/
by medication status and illness chronicity. Nonetheless, that we could not find evidence of WM disruption
in medication-naïve young adults with on average 5 years of illness history suggest that the WM disruptions
otherwise found in more chronically ill bipolar patients may be substantially attributable to effects of illness
chronicity. The findings also encourage longitudinal examination for the specific effects of accumulated illness
and recurrence in BPII disorder, which would help establish the biological underpinning of bipolarity to the
extent that it is observable versus BPI and UD.
Methods
Participants and recruitment. Treatment-naïve, currently depressed subjects were recruited from indi-
viduals presenting to either of three specialist psychiatric clinics during the years 2014–2018 for scheduling a
new appointment. Inclusion criteria were (1) aged 18–30, (2) currently satisfying the criteria for DSM-IV-TR
Major Depressive Episode, (3) either meeting DSM-IV-TR criteria for Major Depressive Disorder, with no his-
tory of hypomanic episodes (for UD), or meeting research diagnostic criteria (RDC) for Bipolar II Disorder
(BPII) (DSM-IV-TR MDE with history of hypomanic episodes of at least 2-day duration)51, and (4) no prior
exposure to any psychotropic drug treatment in their life time. Exclusion criteria included: (1) current and
lifetime histories of psychoses, (2) substance misuse, (3) organic brain syndromes, and/or (4) evidence of intel-
lectual disability. Healthy volunteers without personal or family history of any mental disorders were recruited
from online advertisements and a public health centre.
Written informed consent was obtained from all subjects/patients. The authors assert that all procedures
contributing to this work comply with the ethical standards of the relevant national and institutional commit-
tees on human experimentation and with the Helsinki Declaration of 1975, as revised in 2008. All procedures
involving human subjects/patients were approved by the New Territories East Cluster—Chinese University of
Hong Kong Clinical Research Ethics Committee (CREC Ref. No.: 2014.168).
Clinical assessments. Diagnostic assessments were conducted by trained interviewers using the Chinese
bilingual version of the Structured Clinical Interview for DSM-IV Axis I Disorders (SCID-I), adapted to facili-
tate diagnosis of current and lifetime hypomanic episodes under the supervision of an experienced clinician aca-
demic psychiatrist51–53. All lifetime affective episodes were enquired year by year from the first onset of depres-
sion using a modified life-chart method based on SCID-I. Repeated interviews were conducted to enhance
detection of past hypomanic episodes.
Current-week affective symptoms were rated by trained clinician interviewers using the interviewer-admin-
istered MADRS54, YMRS55, and HAM-A56. Current health-related quality of life was evaluated with the SF-3657,
validated for Chinese s ettings58. Medication history was directly enquired with participants and caregivers, and
checked against the territory-wide public hospital computer registry. We also assessed for the Bipolarity Index, a
clinician-rated scale across five domains: signs and symptoms, age of onset, course of illness, responses to treat-
ment and family history denoting bipolarity as a dimensional construct39. General intelligence was measured
with the three-subtest short form of Wechsler Adult Intelligence Scale-III (WAIS-III)59,60.
MRI acquisition. MR images were acquired using 3-T MRI scanner (Achieva TX series, Philips Healthcare,
Best, Netherlands) using a standard 8-channel head coil for signal reception. High resolution structural images
of the whole brain were acquired using a 3D T1-weighted sequence (TR: 7.4 ms, TE: 3.4 ms, field of view:
250′250 mm2, 285 contiguous slices, sagittal plane, 0.6 mm R-L thickness, reconstruction matrix: 240′240, flip
angle: 8°). To minimize the effects of patient motion to the quality of our raw data, padding was applied around
to the participant’s head to minimize motion during signal acquisition. At the end of each imaging sequence,
image quality checks were made to ensure no gross motion artifacts were visible on the images.
Diffusion-weighted imaging was performed using a single-shot echo planar imaging sequence (TR: 8912 ms,
TE: 60 ms, field of view = 224′224 mm2, 70 continuous axial slices, 2 mm slice thickness, no gap, acquisition
matrix = 112′112, flip angle: 90°). Diffusion sensitizing gradients were applied along 32 non-linear directions
with b = 1000 s/mm2, together with an acquisition without diffusion weighting (b = 0 s/mm2). A parallel imaging
acceleration factor of 2.5 was used to reduce scan time.
Image pre‑processing. Image registration was performed to account for motion artifacts arising from
patient motion and to realign image datasets before further post-processing. The anatomical images and dif-
fusion weighted images were pre-processed using FSL61 and FreeSurfer 6.062. The anatomical images were cor-
rected for intensity non-uniformity63 in pursuance of segmentation. After removing the skull and neck, the brain
images were registered to MNI-305 template, with a series of linear and non-linear transformations, for tract
fitting. The brain surfaces were also constructed from brain images in individual native space.
The diffusion-weighted images (DWI) were pre-processed using Freesurfer, with the trac-all command. The
DWI were first registered to the b0 images of the volume via affine transformation to correct for eddy-current
and echo-planar imaging distortion and head motion, where the b-vectors were rotated to account for motion
corrections. Individual DWI were then rigidly registered to individual anatomical images with aid of brain
surface reconstruction cost function from anatomical image pre-processing. Cortical and white-matter masks
were created, followed by tensor fitting for extraction of tensor-based measures (FA, MD, RD and AD). Lastly,
the anatomical priors for 15 white-matter pathways (see below) were computed for TRACULA.
TRACULA. TRACULA (TRActs Constrained by UnderLying Anatomy)42, an automated toolbox within
Freesurfer, was applied to reconstruct the global probabilistic distribution of 15 a priori, well-characterized
white matter tracts implicated in bipolar disorder18,20, including the anterior thalamic radiations (ATR), the
Scientific Reports | (2021) 11:1816 | https://doi.org/10.1038/s41598-021-81355-9 7
Vol.:(0123456789)www.nature.com/scientificreports/
cingulum cingulate gyrus (CING), the cingulum angular bundle (CAB), the inferior longitudinal fasciculus
(ILF), the parietal part of the SLF, the temporal part of the SLF, the uncinate fasciculus (UNC), all bilaterally; and
the forceps minor of the corpus callosum (CC). To assure validity of findings, we also included three tracts with
no reported bipolar association as control, namely forceps major and bilateral corticospinal tracts. Specifically,
diffusion distributions were estimated by applying the ball-and-stick model, using “bedpostX” of FSL, followed
by fitting the shape of each white-matter pathway to the results of the ball-and-stick model of diffusion and the
anatomical priors for white-matter pathways computed during the pre-processing stage. Subsequently, we exam-
ined DTI-derived connectivity indices, including FA, MD, RD and AD (see below).
TBSS. Tract-based spatial statistics (TBSS) was conducted using FSL for voxel-wise analysis of white matter
tracts. FA, AD and RD images created using Freesurfer’s trac-all (see above) were projected onto the mean FA
skeleton that represents the centre of white-matter tracts, thresholded at FA = 0.2.
Statistical analysis. Statistical tests for demographic, clinical and imaging (TRACULA) data were per-
formed using R Statistical Software64. Group differences of demographic and cognitive variables were ana-
lysed using one-way ANOVA for continuous variables and Chi-Squared test for categorical variables. Post-hoc
group comparisons were performed with false discovery rate (FDR) correction. Differences of clinical measures
between UD and BPII patients were analysed by means of independent t-tests for continuous variables, and Chi-
Square test for categorical variables. Where unequal variances existed between groups, Welch’s tests were used.
Group differences of FA, MD, RD and AD of unilateral tracts were analysed using one-way ANOVA, with
WAIS-III IQ scores included in the model as covariate. In view of the small sample size and unequal variances
of DTI data across groups, we performed data resampling by bootstrapping with 1000 iterations. With each
bootstrap sample, we conducted a one-way ANOVA and extracted the bootstrapped FB . For each DTI measure
at each tract, we identified the 2.5th and 97.5th percentiles (i.e. 95% confidence intervals) of all FB and compared
it with the observed F. Group differences were considered statistically significant where the observed F was not
within the 95% CIs of FB. Post-hoc t-tests were conducted with FDR correction. Using the same bootstrap sam-
ples (with 1000 iterations), the bootstrapped tB were extracted and the 2.5th and 97.5th percentiles (i.e. the 95%
confidence intervals) of all tB were obtained. Significant group differences were identified where the observed
t exceeded the 95% CIs of tB . In addition to the main ANOVA, we conducted a supplementary group-by-age
analysis to examine the effect of age on the DTI measures using the same ANOVA and bootstrapping methods.
Results are reported in Supplementary Table S2. For TBSS, voxel-wise permutation analysis on the skeletonized
data (FA, AD and RD) were performed using FSL’s PALM with 5000 permutations, using threshold-free cluster
enhancement (TFCE), corrected for age, sex and education level.
We examined the correlations between the DTI and clinical data in our patient samples by calculating the
Pearson’s r. Correlation was tested for each patient group separately and also with both groups combined. For all
correlation tests, bootstrapping was conducted with 1000 iterations. Specifically, with each bootstrap sample, we
extracted the rB and identified the 95% confidence intervals, which equalled to the 2.5th and 97.5th percentiles
of all rB . Significant correlation was indicated by which the observed r was not within the 95% CIs of rB.
In view of multicollinearity in the clinical and imaging measures, principal components analysis (PCA) was
performed, instead of linear regression, to assess the multivariate linear relationships among the clinical and DTI
measures in the UD and BPII groups, on DTI measures and clinical variables with significant group differences.
Varimax rotation was applied to the component loadings. We examined the scree plot and extracted components
with eigenvalue greater than 1 to identify the number of components sufficient to explain the variance in the
data. The components obtained from the PCA were then entered into a linear discriminant analysis (LDA) to
examine the classification between UD and BPII groups based on the DTI and clinical variables. A maximum
likelihood method was used, assuming the variables were continuous and normally distributed. To compensate
for the relatively small sample size, we performed an LDA with leave-one-out cross-validation and found similar
prediction accuracies (see Supplementary Table S3), which ensured that the accuracy of the selected training
sample for deriving discriminant scores was optimistic. Since only DTI and clinical measures differentiating
our UD and BPII samples were included in the PCA-LDA, the specificity and sensitivity in differentiating UD
from BPII here is likely stronger here than would be found in the population. Thus, this analysis is exploratory
in nature. In addition, PCA and LDA were performed again to examine the model without the DTI variable, i.e.
AD in right SLF (temporal) to explore the effect of the imaging variable on the model.
Data availability
The datasets analysed during the current study are available from the corresponding author on reasonable request.
Received: 21 September 2020; Accepted: 6 January 2021
References
1. Bauer, M. & Pfennig, A. Epidemiology of bipolar disorders. Epilepsia 46, 8–13 (2005).
2. Dervic, K. et al. Bipolar I and II versus unipolar depression: Clinical differences and impulsivity/aggression traits. Eur. Psychiatry
30, 106–113. https://doi.org/10.1016/j.eurpsy.2014.06.005 (2015).
3. Sole, B. et al. Cognitive variability in bipolar II disorder: Who is cognitively impaired and who is preserved. Bipolar Disord. 18,
288–299. https://doi.org/10.1111/bdi.12385 (2016).
4. Ghaemi, S. N. et al. Antidepressant treatment in bipolar versus unipolar depression. Am. J. Psychiatry 161, 163–165. https://doi.
org/10.1176/appi.ajp.161.1.163 (2004).
Scientific Reports | (2021) 11:1816 | https://doi.org/10.1038/s41598-021-81355-9 8
Vol:.(1234567890)www.nature.com/scientificreports/
5. Tondo, L., Lepri, B. & Baldessarini, R. J. Suicidal risks among 2826 Sardinian major affective disorder patients. Acta Psychiatr.
Scand. 116, 419–428. https://doi.org/10.1111/j.1600-0447.2007.01066.x (2007).
6. Sprooten, E. et al. Reduced white matter integrity in sibling pairs discordant for bipolar disorder. Am. J. Psychiatry 170, 1317–1325.
https://doi.org/10.1176/appi.ajp.2013.12111462 (2013).
7. Benedetti, F. et al. Tract-specific white matter structural disruption in patients with bipolar disorder. Bipolar Disord. 13, 414–424.
https://doi.org/10.1111/j.1399-5618.2011.00938.x (2011).
8. McIntosh, A. M. et al. White matter tractography in bipolar disorder and schizophrenia. Biol. Psychiatry 64, 1088–1092. https://
doi.org/10.1016/j.biopsych.2008.07.026 (2008).
9. Lagopoulos, J. et al. Microstructural white matter changes in the corpus callosum of young people with Bipolar Disorder: A dif-
fusion tensor imaging study. PLoS ONE 8, e59108. https://doi.org/10.1371/journal.pone.0059108 (2013).
10. Versace, A. et al. Right orbitofrontal corticolimbic and left corticocortical white matter connectivity differentiate bipolar and
unipolar depression. Biol. Psychiatry 68, 560–567. https://doi.org/10.1016/j.biopsych.2010.04.036 (2010).
11. Han, K. M., De Berardis, D., Fornaro, M. & Kim, Y. K. Differentiating between bipolar and unipolar depression in functional
and structural MRI studies. Prog. Neuropsychopharmacol. Biol. Psychiatry 91, 20–27. https://doi.org/10.1016/j.pnpbp.2018.03.022
(2019).
12. Repple, J. et al. A voxel-based diffusion tensor imaging study in unipolar and bipolar depression. Bipolar Disord. 19, 23–31. https
://doi.org/10.1111/bdi.12465(2017).
13. Liu, J. X. et al. Differences in white matter abnormalities between bipolar I and II disorders. J. Affect Disord. 127, 309–315. https
://doi.org/10.1016/j.jad.2010.05.026 (2010).
14. Foley, S. F. et al. Fractional anisotropy of the uncinate fasciculus and cingulum in bipolar disorder type I, type II, unaffected siblings
and healthy controls. Br. J. Psychiatry 213, 548–554. https://doi.org/10.1192/bjp.2018.101 (2018).
15. Borgwardt, S. & Fusar-Poli, P. White matter pathology—An endophenotype for bipolar disorder?. BMC Psychiatry 12, 138. https
://doi.org/10.1186/1471-244X-12-138 (2012).
16. Berk, M. et al. Pathways underlying neuroprogression in bipolar disorder: Focus on inflammation, oxidative stress and neurotrophic
factors. Neurosci. Biobehav. Rev. 35, 804–817. https://doi.org/10.1016/j.neubiorev.2010.10.001 (2011).
17. Abramovic, L. et al. White matter disruptions in patients with bipolar disorder. Eur. Neuropsychopharmacol. 28, 743–751. https://
doi.org/10.1016/j.euroneuro.2018.01.001 (2018).
18. Favre, P. et al. Widespread white matter microstructural abnormalities in bipolar disorder: Evidence from mega- and meta-analyses
across 3033 individuals. Neuropsychopharmacology 44, 2285–2293. https://doi.org/10.1038/s41386-019-0485-6 (2019).
19. Mamah, D., Ji, A., Rutlin, J. & Shimony, J. S. White matter integrity in schizophrenia and bipolar disorder: Tract- and voxel-based
analyses of diffusion data from the Connectom scanner. Neuroimage Clin. 21, 101649. https://doi.org/10.1016/j.nicl.2018.101649
(2019).
20. Versace, A. et al. Elevated serum measures of lipid peroxidation and abnormal prefrontal white matter in euthymic bipolar adults:
Toward peripheral biomarkers of bipolar disorder. Mol. Psychiatry 19, 200–208. https://doi.org/10.1038/mp.2012.188 (2014).
21. Mak, A. D. P. et al. Cognitive impairment in treatment-naive bipolar II and unipolar depression. Sci. Rep. 8, 1905. https://doi.
org/10.1038/s41598-018-20295-3 (2018).
22. Atmaca, M., Ozdemir, H. & Yildirim, H. Corpus callosum areas in first-episode patients with bipolar disorder. Psychol. Med. 37,
699–704. https://doi.org/10.1017/S0033291706009743 (2007).
23. Jiang, X. et al. Structural and functional alterations in untreated patients with major depressive disorder and bipolar disorder
experiencing first depressive episode: A magnetic resonance imaging study combined with follow-up. J. Affect Disord. 279, 324–333.
https://doi.org/10.1016/j.jad.2020.09.133 (2021).
24. Savitz, J. B. et al. Habenula volume in bipolar disorder and major depressive disorder: A high-resolution magnetic resonance
imaging study. Biol. Psychiatry 69, 336–343. https://doi.org/10.1016/j.biopsych.2010.09.027 (2011).
25. Rive, M. M. et al. Distinguishing medication-free subjects with unipolar disorder from subjects with bipolar disorder: state matters.
Bipolar Disord. 18, 612–623. https://doi.org/10.1111/bdi.12446 (2016).
26. Hafeman, D. M., Chang, K. D., Garrett, A. S., Sanders, E. M. & Phillips, M. L. Effects of medication on neuroimaging findings in
bipolar disorder: An updated review. Bipolar Disord. 14, 375–410. https://doi.org/10.1111/j.1399-5618.2012.01023.x (2012).
27. Versace, A. et al. Elevated left and reduced right orbitomedial prefrontal fractional anisotropy in adults with bipolar disorder
revealed by tract-based spatial statistics. Arch. Gen. Psychiatry 65, 1041–1052. https://doi.org/10.1001/archpsyc.65.9.1041 (2008).
28. Atmaca, M., Yildirim, H., Ozdemir, H., Ogur, E. & Tezcan, E. Hippocampal 1H MRS in patients with bipolar disorder taking
valproate versus valproate plus quetiapine. Psychol. Med. 37, 121–129. https://doi.org/10.1017/S0033291706008968 (2007).
29. Benedetti, F. et al. Disruption of white matter integrity in bipolar depression as a possible structural marker of illness. Biol. Psy-
chiatry 69, 309–317. https://doi.org/10.1016/j.biopsych.2010.07.028 (2011).
30. Teixeira, A. M. et al. Preserved white matter in unmedicated pediatric bipolar disorder. Neurosci. Lett. 579, 41–45. https://doi.
org/10.1016/j.neulet.2014.06.061 (2014).
31. Adler, C. M. et al. Evidence of white matter pathology in bipolar disorder adolescents experiencing their first episode of mania: A
diffusion tensor imaging study. Am. J. Psychiatry 163, 322–324. https://doi.org/10.1176/appi.ajp.163.2.322 (2006).
32. Grande, I., Magalhaes, P. V., Kunz, M., Vieta, E. & Kapczinski, F. Mediators of allostasis and systemic toxicity in bipolar disorder.
Physiol. Behav. 106, 46–50. https://doi.org/10.1016/j.physbeh.2011.10.029 (2012).
33. Zanetti, M. V. et al. State-dependent microstructural white matter changes in bipolar I depression. Eur. Arch. Psychiatry Clin.
Neurosci. 259, 316–328. https://doi.org/10.1007/s00406-009-0002-8 (2009).
34. Yin, Z. et al. Decreased functional connectivity in insular subregions in depressive episodes of bipolar disorder and major depres-
sive disorder. Front. Neurosci. 12, 842. https://doi.org/10.3389/fnins.2018.00842 (2018).
35. Aung, W. Y., Mar, S. & Benzinger, T. L. Diffusion tensor MRI as a biomarker in axonal and myelin damage. Imaging Med. 5, 427–440.
https://doi.org/10.2217/iim.13.49 (2013).
36. Lai, C. H. & Wu, Y. T. Alterations in white matter micro-integrity of the superior longitudinal fasciculus and anterior thalamic
radiation of young adult patients with depression. Psychol. Med. 44, 2825–2832. https://doi.org/10.1017/S0033291714000440
(2014).
37. Winklewski, P. J. et al. Understanding the physiopathology behind axial and radial diffusivity changes—What do we know?. Front.
Neurol. https://doi.org/10.3389/fneur.2018.00092 (2018).
38. Huang, H., Fan, X. Williamson, D. E., & Rao, U. White matter changes in healthy adolescents at familial risk for unipolar depres-
sion: A diffusion tensor imaging study. Neuropsychopharmacology 36, 684–691. https://doi.org/10.1038/npp.2010.199 (2011).
39. Aiken, C. B., Weisler, R. H. & Sachs, G. S. The Bipolarity Index: A clinician-rated measure of diagnostic confidence. J. Affect. Disord.
177, 59–64 (2015).
40. Jiang, J. et al. Microstructural brain abnormalities in medication-free patients with major depressive disorder: A systematic review
and meta-analysis of diffusion tensor imaging. J. Psychiatry Neurosci. JPN 42, 150–163. https://doi.org/10.1503/jpn.150341 (2017).
41. Jones, D. K., Knosche, T. R. & Turner, R. White matter integrity, fiber count, and other fallacies: The do’s and don’ts of diffusion
MRI. Neuroimage 73, 239–254. https://doi.org/10.1016/j.neuroimage.2012.06.081 (2013).
42. Yendiki, A. et al. Automated probabilistic reconstruction of white-matter pathways in health and disease using an atlas of the
underlying anatomy. Front. Neuroinform. 5, 23. https://doi.org/10.3389/fninf.2011.00023 (2011).
Scientific Reports | (2021) 11:1816 | https://doi.org/10.1038/s41598-021-81355-9 9
Vol.:(0123456789)www.nature.com/scientificreports/
43. Gunde, E., Blagdon, R. & Hajek, T. White matter hyperintensities: From medical comorbidities to bipolar disorders and back. Ann.
Med. 43, 571–580. https://doi.org/10.3109/07853890.2011.595733 (2011).
44. Fiedorowicz, J. G., Palagummi, N. M., Forman-Hoffman, V. L., Miller, D. D. & Haynes, W. G. Elevated prevalence of obe-
sity, metabolic syndrome, and cardiovascular risk factors in bipolar disorder. Ann. Clin. Psychiatry 20, 131–137. https://doi.
org/10.1080/10401230802177722 (2008).
45. Madhyastha, T. et al. Longitudinal reliability of tract-based spatial statistics in diffusion tensor imaging. Hum. Brain Mapp. 35,
4544–4555 (2014).
46. Van Essen, D. C. et al. The WU-Minn human connectome project: An overview. Neuroimage 80, 62–79. https://doi.org/10.1016/j.
neuroimage.2013.05.041 (2013).
47. Ugurbil, K. et al. Pushing spatial and temporal resolution for functional and diffusion MRI in the Human Connectome Project.
Neuroimage 80, 80–104. https://doi.org/10.1016/j.neuroimage.2013.05.012 (2013).
48. Sotiropoulos, S. N. et al. Advances in diffusion MRI acquisition and processing in the Human Connectome Project. Neuroimage
80, 125–143. https://doi.org/10.1016/j.neuroimage.2013.05.057 (2013).
49. Shi, Y. & Toga, A. W. Connectome imaging for mapping human brain pathways. Mol. Psychiatry 22, 1230–1240 (2017).
50. Andersson, J. L. R. & Sotiropoulos, S. N. Non-parametric representation and prediction of single- and multi-shell diffusion-
weighted MRI data using Gaussian processes. NeuroImage 122, 166–176 (2015).
51. Benazzi, F. & Akiskal, H. S. Refining the evaluation of bipolar II: Beyond the strict SCID-CV guidelines for hypomania. J. Affect.
Disord. 73, 33–38 (2003).
52. Mak, A. D. P. Prevalence and correlates of bipolar II disorder in major depressive patients at a psychiatric outpatient clinic in Hong
Kong. J. Affect. Disord. 112, 201–205 (2009).
53. So, E. et al. The Chinese-bilingual SCID-I/P Project: Stage 1—Reliability for mood disorders and schizophrenia. Hong Kong J.
Psychiatry 13, 7–18 (2003).
54. Montgomery, S. A., & Asberg, M. A new depression scale designed to be sensitive to change. Br. J. Psychiatry J. Mental Sci. 134,
382–389. https://doi.org/10.1192/bjp.134.4.382 (1979).
55. Young, R. C., Biggs, J. T., Zieger, V. E., & Meyer, D. A. A rating scale for mania: reliability, validity and sensitivity. Br. J. Psychiatry
J. Mental Sci. 133, 429–435. https://doi.org/10.1192/bjp.133.5.429 (1978).
56. Hamilton, M. The assessment of anxiety states by rating. Br. J. Med. Psychol. 32, 50–55 (1959).
57. Brazier, J. E. et al. Validating the SF-36 health survey questionnaire: New outcome measure for primary care. BMJ 305, 160–164
(1992).
58. Lam, C. L., Tse, E. Y., Gandek, B. & Fong, D. Y. The SF-36 summary scales were valid, reliable, and equivalent in a Chinese popula-
tion. J. Clin. Epidemiol. 58, 815–822 (2005).
59. Wechsler, D. Wechsler Memory Scale-Revised Manual (Psychological Corporation, San Antonio, 1987).
60. Chan, E. L. S., Chen, E. Y. H. & Chan, R. C. K. Three-subtest short form of the wechsler adult intelligence scale-III for patients
with psychotic disorders: A preliminary report. Hong Kong J. Psychiatry 15, 39–42 (2005).
61. Jenkinson, M., Bechmann, C. F., Behrens, T. E., Woolrich, M. W. & Smith, S. M. FSL. Neuroimage 62, 782–790 (2012).
62. Reuter, M., Schmansky, N. J., Rosas, H. D. & Fischl, B. Within-subject template estimation for unbiased longitudinal image analysis.
Neuroimage 61, 1402–1418 (2012).
63. Zheng, W., Chee, M. W. & Zagorodnov, V. Improvement of brain segmentation accuracy by optimizing non-uniformity correction
using N3. Neuroimage 48, 73–83. https://doi.org/10.1016/j.neuroimage.2009.06.039 (2009).
64. R Core Team. R: A language and environment for statistical computing. R Foundation for Statistical Computing, Vienna, Austria.
(2017).
Acknowledgements
This project was supported by an Early Career Scheme Grant from the Research Grants Council (Ref no.
24100114).
Author contributions
Conceived and designed the study: M.A.D.P. Analysed the data: C.I.W.Y. and W.S.L.Y. Interpreted the findings:
all authors. Wrote the original draft: M.A.D.P. and L.O.N.W. Critically reviewed the draft manuscript: C.W.C.,
Y.D., S.S.H., M.S.L., L.L.C.W., L.C.M., L.S. All authors approved the final version.
Competing interests
The authors declare no competing interests.
Additional information
Supplementary Information The online version contains supplementary material available at https://doi.
org/10.1038/s41598-021-81355-9.
Correspondence and requests for materials should be addressed to A.D.P.M.
Reprints and permissions information is available at www.nature.com/reprints.
Publisher’s note Springer Nature remains neutral with regard to jurisdictional claims in published maps and
institutional affiliations.
Open Access This article is licensed under a Creative Commons Attribution 4.0 International
License, which permits use, sharing, adaptation, distribution and reproduction in any medium or
format, as long as you give appropriate credit to the original author(s) and the source, provide a link to the
Creative Commons licence, and indicate if changes were made. The images or other third party material in this
article are included in the article’s Creative Commons licence, unless indicated otherwise in a credit line to the
material. If material is not included in the article’s Creative Commons licence and your intended use is not
permitted by statutory regulation or exceeds the permitted use, you will need to obtain permission directly from
the copyright holder. To view a copy of this licence, visit http://creativecommons.org/licenses/by/4.0/.
© The Author(s) 2021
Scientific Reports | (2021) 11:1816 | https://doi.org/10.1038/s41598-021-81355-9 10
Vol:.(1234567890)You can also read