Water vapor induced self assembly of islands/honeycomb structure by secondary phase separation in polystyrene solution with bimodal molecular ...
←
→
Page content transcription
If your browser does not render page correctly, please read the page content below
www.nature.com/scientificreports

                OPEN              Water vapor induced self‑assembly
                                  of islands/honeycomb structure
                                  by secondary phase separation
                                  in polystyrene solution
                                  with bimodal molecular weight
                                  distribution
                                                        1,3*
                                  Maciej Łojkowski          , Adrian Chlanda1,2, Emilia Choińska1 & Wojciech Swieszkowski             1*

                                  The formation of complex structures in thin films is of interest in many fields. Segregation of
                                  polymer chains of different molecular weights is a well-known process. However, here, polystyrene
                                  with bimodal molecular weight distribution, but no additional chemical modification was used.
                                  It was proven that at certain conditions, the phase separation occurred between two fractions of
                                  bimodal polystyrene/methyl ethyl ketone solution. The films were prepared by spin-coating, and the
                                  segregation between polystyrene phases was investigated by force spectroscopy. Next, water vapour
                                  induced secondary phase separation was investigated. The introduction of moist airflow induced the
                                  self-assembly of the lower molecular weight into islands and the heavier fraction into a honeycomb.
                                  As a result, an easy, fast, and effective method of obtaining island/honeycomb morphologies was
                                  demonstrated. The possible mechanisms of the formation of such structures were discussed.

                                  Abbreviations
                                  AFM	Atomic force microscopy
                                  Bimodal	Polymer with two nodes in molecular weight distribution
                                  Coating	Final polymer coating
                                  CA	Contact angle
                                  E	Elastic modulus
                                  Film	Liquid film of solution spread on the substrate
                                  FS	Force spectroscopy
                                  FTIR	Fourier transform IR
                                  GPC	Gel permeation chromatography
                                  Initial solution	Solution at the start of spin-coating
                                  MEK	Methyl ethyl ketone
                                  Mw	Molecular weight
                                  [Mw]	Weight average molecular weight
                                  [Mn]	Number average molecular weight
                                  MWD	Molecular weight distribution
                                  PDI	Polydispersity index
                                  PTF	Polymer thin film
                                  PS	Polystyrene
                                  Rh%	Relative humidity in %

                                  1
                                   Faculty of Material Sciences and Engineering, Warsaw University of Technology, Wołoska 141, 02‑507 Warsaw,
                                  Poland. 2Department of Chemical Synthesis and Flake Graphene, Łukasiewicz Research Network - Institute of
                                  Microelectronics and Photonics, Aleja Lotników 32/46, 02‑668 Warsaw, Poland. 3Centre for Advanced Materials
                                  and Technology CEZAMAT, Warsaw University of Technology, Warsaw, Poland. *email: 00183042@pw.edu.pl;
                                  wojciech.swieszkowski@pw.edu.pl

Scientific Reports |   (2021) 11:13299              | https://doi.org/10.1038/s41598-021-92594-1                                           1

                                                                                                                                       Vol.:(0123456789)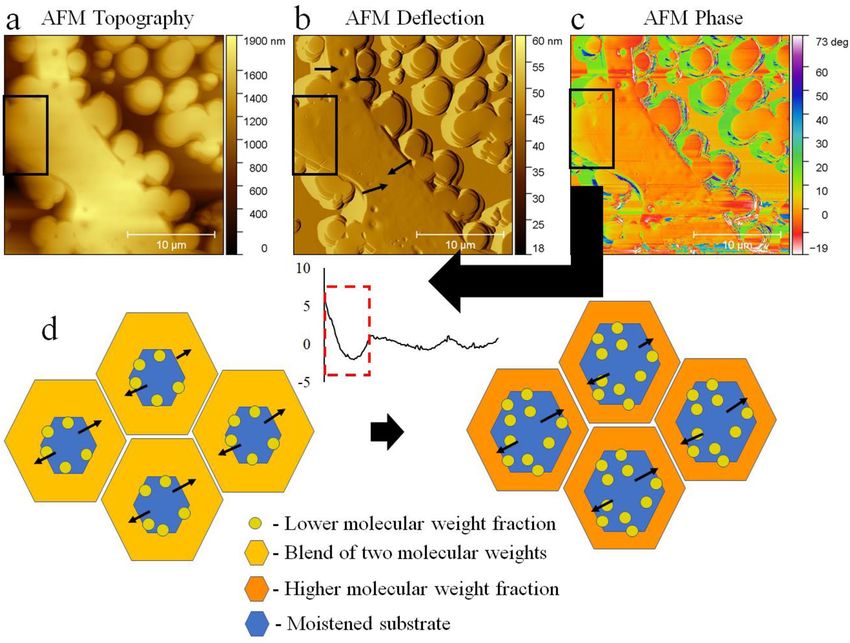
www.nature.com/scientificreports/
RMS Root mean square roughness
Uniform Polymer with one node in molecular weight distribution
Complex morphologies compromising micro-islands and especially micropillars have gained attention due to
their wide range of possible applications, such as their special wetting p roperties1,2, application in studying
3 4
biofilm formation , or controlling stem cell d ifferentiation . Two widespread methods that allow the creation of
a broad range of structures of polymer thin films (PTFs) are spin-coating5 and breath fi gures6. These methods
7
were applied for manufacturing organic ferroelectric switches , light-emitting d evices , sensors9,10, drug delivery
8
systems11,12, biologically active s urfaces13,14, functional nanostructured s urfaces15,16, and m
embranes17. These pro-
cesses rely heavily on the interaction dynamics between the solvent, the polymer, and the vapours in the vicinity
of the surface. During spin-coating, a droplet of a mixture of a solvent and one or two polymers is dropped onto
the substrate. Subsequently, the substrate is rotated very quickly to cover it uniformly with the solution’s liquid
film. As a result, the solvent evaporates. Thus, solvent and temperature quench occurs. The spin coating can be
divided into time regions. First, the liquid solution droplet is spread hydrodynamically over the substrate. This
regime is often referred to as hydrodynamic thinning. Later, when a flat layer of the solution was obtained, the
evaporation of the solvent was responsible for further thinning of this layer18. Changes in the solvent volume
fraction and temperature often lead to unintentional or intentional liquid–liquid phase separation19. It has been
argued that such phase separation often starts in the early stages of the regime controlled by evaporation19,20.
Further spinning of the solution leads to gel formation, which eventually slows down the diffusion inside the
film. As a result, the morphology becomes frozen in time before reaching equilibrium. The time necessary for
the morphology to stop evolving depended on the solvent evaporation rate, solution viscosity, spinning rate,
and substrate thermal properties21–23. During coating formation, a range of events attributed to the local thermal
instabilities takes place: heat transfer between the bottom and top layers of the film; heat transfer from the air
above the layer; heating the substrate by the surrounding air; and local lateral temperature variance due to the
thermal conductivity and heat capacity of the substrate23. These events may lead to the unnecessary or intended
waviness of the coating profile. This undulation is often attributed to two interconnected phenomena. One is the
flow of the liquid due to thermal convection. The second is the surface tension gradient due to local composition
differences, which manifests in solvent-rich or solvent-depleted a reas18. The solvent-depleted areas have higher
surface tension and thus pull the liquid towards these areas and up, while the solvent-rich areas sink, forming
valleys. High centrifugal force during spin-coating is often a cause of elongation of the mentioned structures.
As a result, long stripes extending from the centre of the sample are observed. Using solvents with low surface
tension, the addition of a surfactant or using a mixture of solvents can suppress the formation of these features.
Furthermore, decreasing the amount of heat can suppress the formation of convection cells and allow smooth
coating preparation.
In the second technique mentioned above, breath figures appear on the liquid film’s surface when the humid
airflow accelerates the evaporation rate. Successively, the temperature decreases, which results in nucleation and
growth of water droplets. These droplets create a regular honeycomb array of cavities in the film. The tempera-
ture increased to that of the surroundings, and the droplets evaporated, leaving a porous surface. After most of
the solvent had evaporated, the start of droplet nucleation was governed by the onset time related to the solvent
evaporation rate, solution concentration, and airflow24.
The location and width of the MWD can affect solid thin polymeric film formation to achieve unique
properties25. Wu et al. studied the effect of MWD on the self-assembly of end-functionalized polystyrenes. They
proposed a new way of controlling the morphology of PTF obtained via breath figures by changing the MWD
width. As a result, a porous membrane with higher robustness was obtained26. The width of the MWD can be
tailored either within the polymerization p rocess27,28 or by mixing two polymer species with a very narrow
29
MWD . Heitmiller et al. reported that a heterogeneous melt of polyethylene had a higher flow index than a
homogeneous melt30. The investigation performed by Koningsveld et al. has shown that the bimodal MWD has
a significant effect on the liquid–liquid binodal curve of polymers in s olution31. Phase regions characterise such
solutions, and liquid–liquid phase separation between polymer- and solvent-rich fractions can occur. Zeman
et al. demonstrated that the critical concentration enabling phase separation in a solution of two polymer species
decreases with an increase in the molecular weight M w32. Moreover, even when the polymer–polymer interactions
are athermal, i.e. Flory–Huggins interaction parameter χ equals zero, and phase separation can occur due to the
large difference in entropy between long and short chains, which act as separate entities and influence the viscos-
ity of bimodal s olutions33. The evaporation of the solvent followed by temperature quenching can be responsible
for phase separation, as the Flory–Huggins parameter is temperature dependent and decreases with temperature.
The quenched mixture can turn from the one-phase state to an unstable state. Interestingly, Henderson et al.
investigated a two-step process in which the first temperature quench forces phase separation and the spinodal
structures are allowed to coarsen; next, even deeper quenching is enacted34. This two-step quench led to the
formation of small well-dispersed domains within the primary domains. Intriguingly, the combined spin-coating
and breath figure methods would lead to two quenching and heating events. First, solvent evaporation would
decrease the temperature. Second, water condensation would increase the temperature, and finally, evaporating
water would again decrease the temperature. Another interesting theory is “viscoelastic phase separation”. Phase
separation occurs due to an imbalance of the viscoelastic properties of the components35. Polymer melts with
bimodal molecular weights show nonlinear rheology. A rheological investigation by Hengeller et al. reported
two regimes of stress relaxation in such a melt, where either the only short or only long chains underwent stress
relaxation, depending on the time scale36. Harris et al. found that the viscosity of the blend of bimodal polysty-
rene can be considered a sum of c omponents37. It has been discussed that blending polystyrenes with different
molecular weights mixed the entanglement types between polymer chains. The polymer concentration in the
Scientific Reports | (2021) 11:13299 | https://doi.org/10.1038/s41598-021-92594-1 2
Vol:.(1234567890)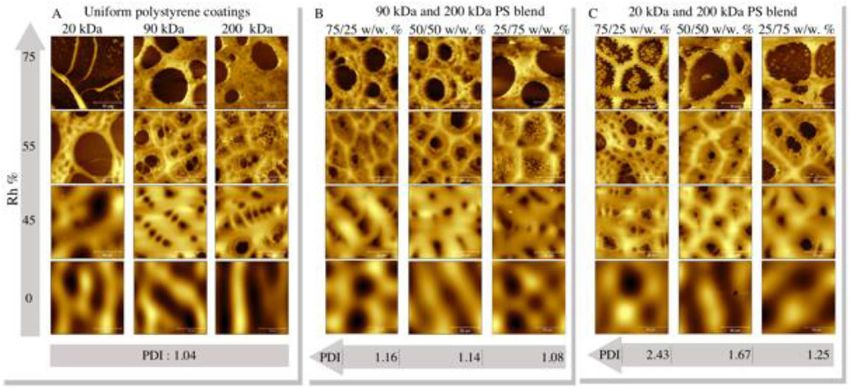
www.nature.com/scientificreports/
Figure 1. Exemplary GPC experiment results of bimodal and uniform MWD polystyrene; (A) narrow uniform
MWD, Mw = 91 kDa, PDI 1.04; (B) bimodal MWD, blend of Mw = 91 kDa, PDI = 1.04 and Mw = 200 kDa,
PDI = 1.04.
solvent changes how the polymer chains interact. Two polymer chains act as separate entities, provided that the
concentration is below the overlap concentration (C*). However, once the overlap concentration occurs, the
polymer’s cooperative motion starts, and the behaviour of the solution c hanges38,39.
Successive research has focused on studying how polymer chains of varying lengths segregate in PTFs. Hari-
haran et al. investigated the effect of the entropy of spin-coated and annealed bimodal PTFs on polymer chain
segregation40. It was shown that higher entropy of shorter chains led to their segregation on the PTF surface, while
the longer chains’ lower entropy promoted their segregation in bulk. Tanaka et al., in turn, studied spin-coated
polystyrene blends with low and high M w with narrow MWD utilizing toluene as a solvent. They reported that
PTFs consisting of polystyrenes with a low molecular weight demonstrated surface segregation after thermal
treatment29. Several other recent studies have illustrated the segregation of lower molecular mass elements
towards the surface during annealing41–45.
On the other hand, it has been shown that deuterated polymer segregation can change the surface roughness
after annealing the c oating46–49.
In the present study, to modify the coating morphology, we decided to explore the phase separation between
two kinds of polystyrene with low and high molecular weights mixed in a solvent. We changed the polydis-
persity, and we used uniform polystyrene standards as a reference. The solvent methyl ethyl ketone MEK was
chosen because of its suitability for spin-coating50. However, for most, its hygroscopic properties, as we planned
to perform spin-coating in humid conditions. MEK is considered a marginal solvent for PS, while it is more
hygroscopic than typically used solvents for polystyrene51,52.
For our study, we established the following assumptions. The mixture with sufficiently high polydispersity will
phase separate during spin-coating, even if these species are chemically identical. The study will be performed
in the regime where thermocapillary effects cause undulations to make any morphological changes clearer to
observe. The breath figure technique will be combined with spin-coating to induce additional motion caused
by the surface tension of water.
The study is organized in the following order. First, the effect of the bimodal weight distribution on the
viscosity of the solutions is discussed. Next, the morphology of the coatings spun at the most negligible pos-
sible humidity is compared by analysis of atomic force microscopy and optical microscopy images. Then, force
spectroscopy was used to identify the different polystyrene phases. In situ reflectometry was used to measure
the evaporation time of the solutions. Finally, the coatings spun at different humidity levels were investigated by
optical and atomic force microscopy.
It was found that at a relative humidity of 75%, a solution concentration of 80 mg/ml and polystyrene molecu-
lar weights of 20 kDa and 200 kDa mixed in a 75/25 w/w% ratio, the two phases formed islands (lower M w frac-
tion) embedded inside of the honeycomb (higher M w fraction).
Although spin-coating was chosen for its ease of controlling the evaporation rate, we believe that the proposed
method can be extended to other techniques, such as dip-coating or ink-jet printing. The presented results can
also be treated as a starting point for other interesting experiments.
Result and discussion
The solutions with bimodal MWD were prepared so that the two nodes in the distribution were clearly separated.
The GPC molecular weight distribution of a single node MWD (uniform) is presented in Fig. 1A, which illus-
trates the MWD of 91 kDa polystyrene with a narrow distribution (PDI = 1.04). In contrast, Fig. 1B illustrates
the MWD with two nodes of a blend of 91 kDa PS with 200 kDa PS, both with narrow distributions (PDI = 1.04).
Scientific Reports | (2021) 11:13299 | https://doi.org/10.1038/s41598-021-92594-1 3
Vol.:(0123456789)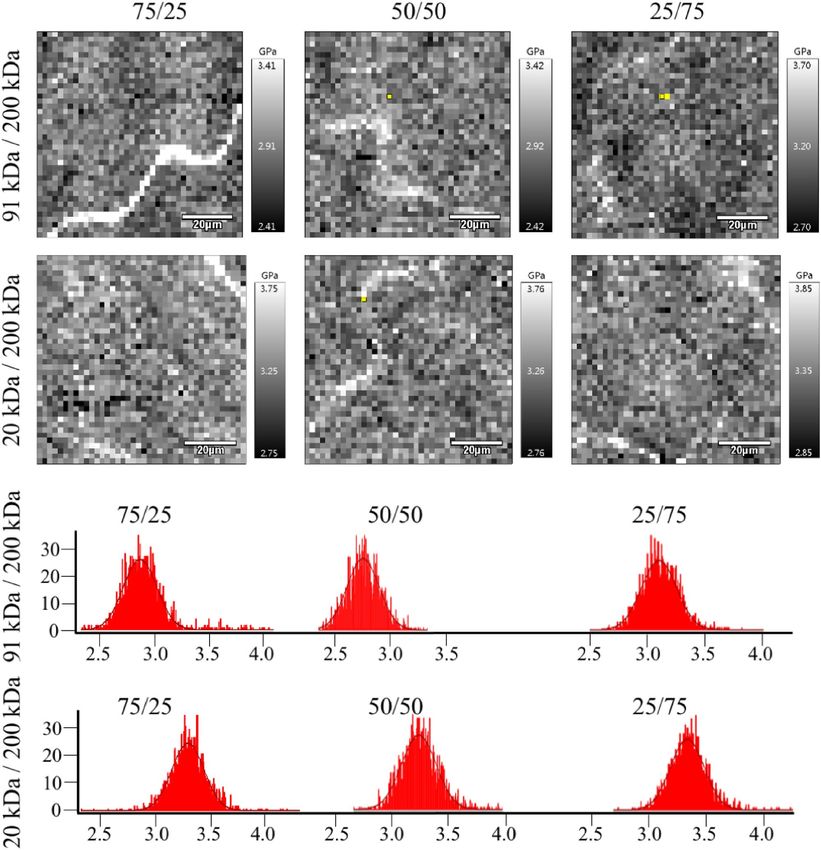
www.nature.com/scientificreports/
Figure 2. Reduced viscosity ηr/C of the solutions, (A) ηr/C plotted against the solution’s concentration. Curves
represent fits for Eq. 1; (B) ηr/C plotted as a function of the number average molecular weight function. Curves
represent the Mark-Houwink equation fit (Eq. 2), [Mn] = f1Mw1 + f2Mw2, where f is w/w % ratio of polymers.
Evaluation of solution viscosities. The viscosity measurement (Fig. 2) can be used to assess not only the
final coating thickness and the solvent evaporation time prediction but also the characteristics of polymer chain
interactions. The measurement result is presented as reduced viscosity ηr/C, where C represents the concentra-
tion in mg/ml. Here, ηr = η−η ηs , where η is the dynamic viscosity of the solution and ηs is the viscosity of the
s
solvent. In Fig. 2A, the viscosity is plotted as a function of the concentration.
The general dependence of viscosity on concentration can be described in the form of a power s eries53:
K[η]C 2 K[η]C 3
ηr
= [η] 1 + K[η]C + + (1)
C 2 6
where [η] is the intrinsic viscosity at infinite dilution. The coefficients are summarised in Table S1 in SI. The
intrinsic viscosity [η] was lower for bimodal blends. The overlap concertation is defined as the concentration at
which the polymer chains start to overlap with each o ther54. The overlap concertation was estimated according
to C* = 1/[η]. The overlap concentration for 20 kDa was 83 mg/ml and for 200 kDa was 19 mg/ml. Notably, in
the case of the 80 mg/ml solution, the 20 kDa species were in the semidilute regime, while the 200 kDa species
were in the concentrated regime.
The viscosity of the bimodal solutions increased faster with increasing concentration than in the case of
uniform solutions. The K parameter was particularly high for 75/25 blends: 1.36 for 90 kDa and 200 kDa and
1.01 for 20 kDa and 200 kDa. In comparison, K for uniform 200 kDa was 0.36. Thus, it can be assumed that the
number of entanglements attributed to the 200 kDa fraction rises at higher concentrations. Figure 2B presents
the viscosity in relation to the number molecular weight [Mn]. The relation between viscosity and molecular
weight can be described in the form of the Mark-Houwink equation53:
ηr
= lnK + aln[Mn ] (2)
C
The K and [η] values are summarised in SI, Table S2. The uniform solutions were visibly more viscous than their
bimodal counterparts of similar molecular weights at concentrations below 20 mg/ml. It could be expected that
the bimodal solutions will change their behaviour more severely when solvent evaporation would quench them
towards more concentrated regimes.
Evaporation of the solvent during spin‑coating. As presented in Fig. 3, the evaporation rate R depends
on the viscosity of the solutions. The evaporation of the 20 kDa, 91 kDa and 200 kDa samples differs for the same
concentration. These differences became more transparent at a concentration of 80 mg/ml.
Investigation of the thickness and morphology of the coatings spun at a relative humidity of
0%. The coatings spun at Rh 0% were chosen as a starting point for the investigation. We decided to look for
phase separation if no humidity was applied, affecting the investigated solvent-polymer system. The convection
Marangoni flow, solvent evaporation, and phase separation events alter the coating surface morphology. As a
result, the occurrence of wrinkles or arrays of islands on the coating surface was r eported48,55–57.
The coatings were investigated via AFM and optical imaging to determine the effect of bimodal MWD on
coating morphology. Significant differences between blend types occurred (Fig. 4A). The solution concentration
of 80 mg/ml was chosen. As we expected from the tests mentioned earlier, the bimodal distribution role would
be the highest. Moreover, we wanted to avoid the influence of the substrate on our force spectroscopy experi-
ment. For that, we needed the thickest coating. As illustrated in Fig. 4B, the thickness of the coatings in the case
Scientific Reports | (2021) 11:13299 | https://doi.org/10.1038/s41598-021-92594-1 4
Vol:.(1234567890)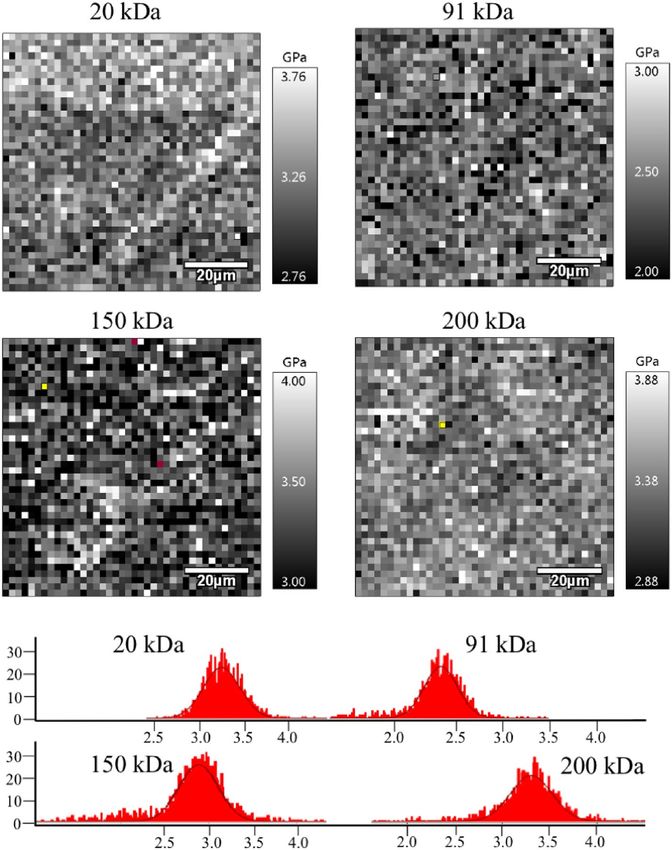
www.nature.com/scientificreports/
Figure 3. The relation between the evaporation rate of solution and the reduced viscosity of solution for
polymer concentrations: (A) 20 mg/ml, (B) 40 mg/ml, and (C) 80 mg/ml. The curves represent the Padé
approximation trend line.
Figure 4. (A) Thickness of the coatings with respect to the composition and the concentration. The
plot presents data for uniform and 91 kDa/200 kDa solutions. (B) Thickness of the coating for 80 mg/ml
concentration in the blend’s molecular weight function. *Blends of 91 kDa and 200 kDa polystyrene; **blend of
20 kDa and 200 kDa polystyrene; x/x – w/w% ratio of blended homogeneous polystyrenes. The number average
molecular weight [Mn] = f1Mw1 + f2Mw2, where f w/w. % ratio of polymers. (C) RMS roughness of the coatings
spun from 80 mg/ml concentration.
of 80 mg/ml scaled linearly with the blends’ average molecular weight. No correlation between the thickness
and roughness was found. (Fig. 4C).
To represent the morphology of the material quantitatively, one can apply the Minkowski parameters58. The
images (Fig. 5A) used for analysis come from the central part of the image to exclude the high shear rate effect
on the coating morphology. The scale bar was 50 µm. Based on this description, it can be concluded that the
morphology of the uniform coatings is characterised by separate islands surrounded by a bicontinuous phase.
In contrast, the bimodal coatings are characterised by a bicontinuous phase separated by interconnected islands.
Figure 5B presents connectivity. Connectivity C(ν) can be used to describe the bicontinuous or island mor-
phology of the coating with respect to the given binarization threshold ν. A negative value of connectivity cor-
responds to bicontinuous morphology, while a positive value corresponds to island morphology. The threshold
was normalized to 1. Based on the connectivity, the bimodal coatings had different morphologies than the
uniform coatings when the starting conditions (Rh 0%) were considered. With the exclusion of the 75/25 20 kDa
200 kDa coating, the coatings were characterized by peaks related to continuous structures and two peaks related
to islands.
In contrast, the uniform coatings had one set of continuous structures and two peaks related to islands.
In connection with the images, it can be assumed that these two kinds of islands are one on top of another. In
the case of bimodal blends, the presented situation describes a set of interconnected islands on top of another
interconnected structure.
Investigation of coating phase composition by means of AFM force spectroscopy. The AFM
force spectroscopy method allows the visualization and quantification of surface areas differing in mechanical
Scientific Reports | (2021) 11:13299 | https://doi.org/10.1038/s41598-021-92594-1 5
Vol.:(0123456789)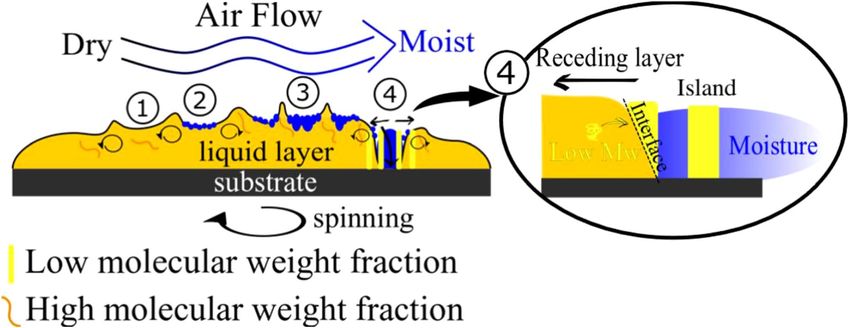
www.nature.com/scientificreports/
Figure 5. (A) Optical images of coatings spun from 80 mg/ml. The (B) Minkowski connectivity C(ν) of the
coatings spun from 80 mg/ml, where ν represents the threshold for image binarization. The values on the axis
were normalized to 1.
properties59. The coatings spun from the solutions with 80 mg/ml concentration were studied. The resulting
elastic modulus of the coatings was calculated (Fig. 6).
The obtained results are similar to those found in the literature60. The uniform 91 kDa coating and the 75/25
and 50/50 blends of 91 kDa and 200 kDa had significantly lower elastic moduli than the rest of the tested groups.
The dependence between the molecular weight and the elastic modulus of the polymer has been repeatedly
proven61,62. However, we did not find significant differences between the other groups. The uniform 20 kDa
coating had an elastic modulus similar to that of the 200 kDa coating in our investigation. The 20 kDa coating
was the thinnest; thus, the substrate could influence the result. We performed a linear regression test (SI, Force
Spectroscopy, Fig. S4) between the thickness of the 80 mg/ml coatings and the elastic modulus, which proved
no relationship between the thickness of the coatings and the elastic modulus, while the 20 kDa coating was an
outlier (SI, Force Spectroscopy, Table S14).
Interestingly, it was possible to record local differences in the coating surface stiffness (Fig. 7). The maps were
gathered for bimodal coatings. White spinodal-like areas are characterized by higher stiffness. The differences
are more clearly visible in the case of 90 kDa and 200 kDa blends, in agreement with Fig. 6.
Scientific Reports | (2021) 11:13299 | https://doi.org/10.1038/s41598-021-92594-1 6
Vol:.(1234567890)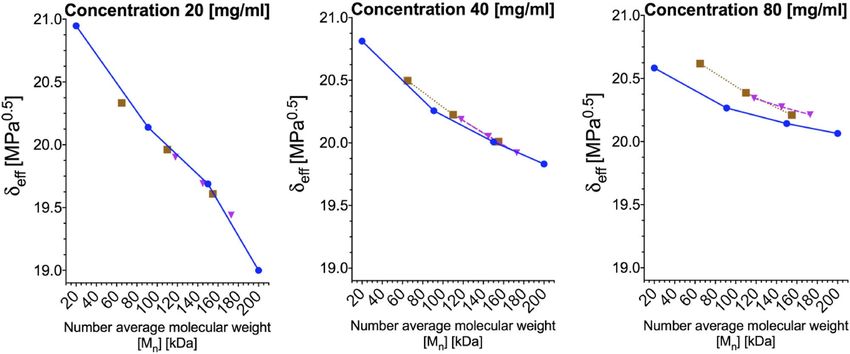
www.nature.com/scientificreports/
Figure 6. Average elastic modulus obtained based on the FS method for coatings made from a solution
of 80 mg/ml. Uniform—coatings were made from homogeneous solutions; bimodal—coatings made from
solutions with bimodal MWD; *blends of 91 kDa and 200 kDa polystyrene; **blend of 20 kDa and 200 kDa
polystyrene; x/x – w/w% ratio of blended homogeneous polystyrenes. [Mn] = f1Mw1 + f2Mw2, where f w/w % ratio
of polymers. ***means are significantly different (one-way ANOVA, p < 0.05).
For comparison, Fig. 8 illustrates the FS maps of the uniform coatings. We analysed the skewness of the maps’
elastic modulus distribution (SI, Force Spectroscopy, Table S15). The skewness in the case of uniform coatings
was significantly lower (p < 0.05) than that in the case of bimodal coatings (Fig. 9). The distribution of the elastic
modulus of the uniform coatings was more homogeneous.
Therefore, it was concluded that force spectroscopy revealed phase separation in the bimodal coatings. The
most noteworthy phase separation was found for the 75/25 blends of both kinds of bimodal coatings. Here, the
phase of lower concentration formed long, spinodal-like forms. For the 25/75 blends, the separate phases were
scattered.
Solubility of polystyrenes with respect to the molecular weight distribution. The phase separa-
tion mentioned above could be explained by solubility investigation. It was shown that the viscosity of the poly-
meric solution could be utilised by the application of the Mangaraj method to retract several polymer–solvent
arameter63. We utilised the Mangaraj equation (Eq. 3) to investigate the
parameters, i.e. the Flory interaction p
miscibility gap between the lower- and higher-molecular-weight p olystyrenes64.
η
2
(3)
ln = − δs − δeff
ηmax
The effective miscibility parameter δeff was calculated with respect to a solution of 200 kDa with a concentra-
tion of 80 mg/ml, which had the highest viscosity among the tested solutions (ηmax). The solvent δs was set to 19
MPa0.5, which is a typical value for MEK.
The miscibility gap between low- and high-molecular-weight polystyrene can be derived based on the PS
blends’ viscosity. Furthermore, the miscibility gap decreases accordingly with the low molecular weight frac-
tion. Here, δeff is the effective Hildebrand miscibility parameter calculated based on the intrinsic viscosity [η].
For the 20 mg/ml concentration, all the solutions are present on the same linear trend with the lowest δeff for the
highest molecular weight. It should be noted that with increasing concentration, the trends for 20 kDa/200 kDa
solutions (brown squares), 91 kDa/200 kDa solutions (purple triangles), and uniform solutions (blue circles)
become divergent at low molecular weights, with their trends coincident at 200 kDa (Fig. 10).
Self‑assembly of micro islands/honeycombs due to phase separation and water condensa‑
tion. As a follow-up, we utilized humidity to take advantage of the phase separation observed above. It was
assumed that phase separation could be further enhanced if spin-coating was performed under humid condi-
tions. It was further concluded that water condensation would eventually lead to ruptures in the solution layer.
Scientific Reports | (2021) 11:13299 | https://doi.org/10.1038/s41598-021-92594-1 7
Vol.:(0123456789)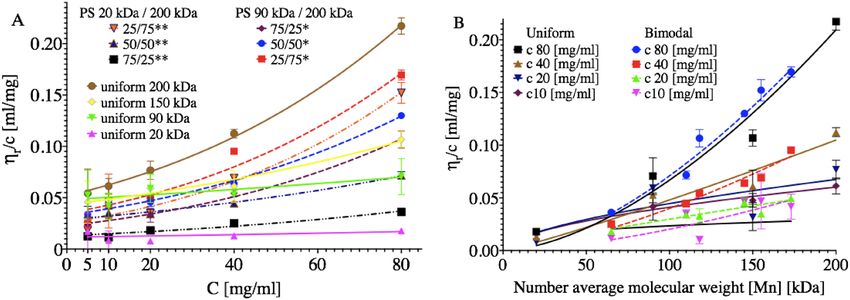
www.nature.com/scientificreports/
Figure 7. Force spectroscopy maps of bimodal MWD coatings and corresponding histograms of the elastic
modulus. The greyscale shows the stiffness—the white colour corresponds to the highest stiffness. The grayscale
range is ± 1 GPa.
By this, a new interface between the solution, water, and SiO2 substrate would be created. This would induce
separation between segregated phases. The condensing water forces the liquid film to dewet and retreat from
SiO2. The viscosity gradient between different phases would lead to the formation of convection cells and honey-
comb morphology65,66. It was assumed that the spinodal-like structures found during the FS investigation, prob-
ably consisting of a higher molecular weight fraction, would reinforce the honeycomb borders. As revealed by
the viscosity investigation, the longer polymer chains would carry the stress as they would be highly entangled.
The lower molecular phase would separate because no stress would be applied to the shorter chains. It should
also be considered that MEK is a hygroscopic solvent, while PS is slightly hydrophobic. The absorption of water
by MEK can further alter the interactions between the solvent and different PS phases. The viscosity and solubil-
ity investigations pointed to 80 mg/ml concentration to obtain the most pronounced effect. It was also assumed
that water condensation would take place in the later stage of spinning. As the humidity slows evaporation, the
Scientific Reports | (2021) 11:13299 | https://doi.org/10.1038/s41598-021-92594-1 8
Vol:.(1234567890)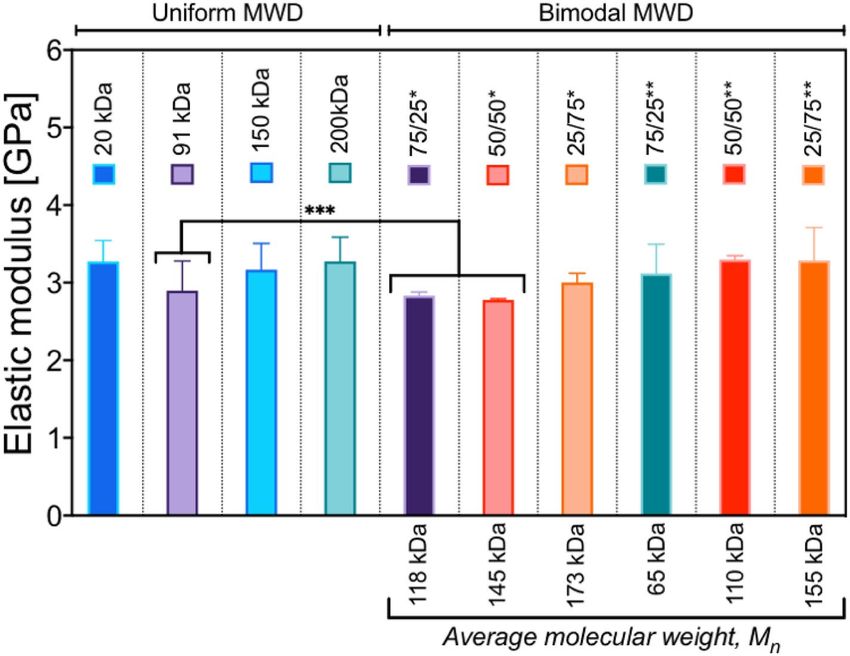
www.nature.com/scientificreports/

                                  Figure 8.  Force spectroscopy maps of coatings with uniform MWD and corresponding histograms of the
                                  elastic modulus. The greyscale shows the stiffness—the white colour corresponds to the highest stiffness.

                                  highest humidity allows the longest time for morphology formation. The tested relative humidity Rh values were
                                  45%, 55%, and 75%.
                                      Figure 11 A shows images of coatings composed of uniform polystyrenes, Fig. 11B presents images of coat-
                                  ings prepared from 91 and 200 kDa blends, and Fig. 11C presents images of coatings prepared from 20 and
                                  200 kDa blends.
                                      Each column is marked below with the mixture’s PDI value, and each row corresponds to one of the Rh
                                  values. Optical microscopy showing three different areas of the coatings is presented in the Supplementary
                                  Information, Figs. S6–S8.
                                      We observed that smaller cavities (breath figures) formed around the larger cavities caused by dewetting-
                                  related polymeric film ruptures. The structure that resembles the honeycomb also occurred. For Rh 55%, a
                                  honeycomb-like morphology is found for all coatings, except the uniform 20 kDa coating. It is difficult to
                                  distinguish uniform samples from the 90 kDa 200 kDa blend. However, the 20 kDa and 200 kDa blends have
                                  distinctive morphology that depends on the PDI value. Radially averaged power spectral density analysis (SI,
                                  Fig. S9) of four averaged images depicts the differences between the 75/25, 50/50, and 25/75 w/w% 20 kDa and
                                  200 kDa coatings.
                                      Interestingly, the coatings prepared from 20 and 200 kDa bimodal blends at Rh 75% had polymeric islands
                                  inside the large holes. The onset of such structures can also be observed in the case of coatings prepared in Rh
                                  55%. The fraction of the islands decreased with an increase in the 200 kDa contribution. It was assumed that the
                                  islands are made of a lighter and less viscous fraction. Seemingly, the heavier polymer fraction, more viscous

Scientific Reports |   (2021) 11:13299 |              https://doi.org/10.1038/s41598-021-92594-1                                                   9

                                                                                                                                              Vol.:(0123456789)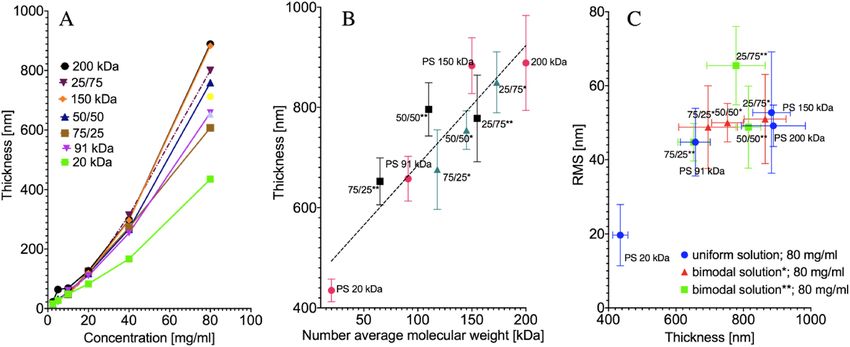
www.nature.com/scientificreports/
Figure 9. The skewness of the elastic modulus data sets. Uniform—grouped means that represents the skewness
of histograms of uniform coatings elastic modulus. Bimodal—grouped means that represents the skewness of
histograms of all kinds of bimodal blends elastic modulus. The means of these two groups were significantly
different (p < 0.05).
Figure 10. The effective miscibility parameter δeff of the polystyrenes in MEK with bimodal and uniform
distributions for two kinds of bimodal distributions: 20 kDa/200 kDa—brown squares and 91 kDa/200 kDa—
purple triangles; the blue circles represent data for polystyrenes with uniform distributions. [ Mn] = f1Mw1 + f2Mw2,
where f w/w % ratio of polymers.
Scientific Reports | (2021) 11:13299 | https://doi.org/10.1038/s41598-021-92594-1 10
Vol:.(1234567890)www.nature.com/scientificreports/
Figure 11. AFM topographical images of tested samples. The colour represents the height, and brighter means
higher. The solution concentration C was 80 mg/ml, while the samples were spun under different humidity,
from 0 to 75% Rh. The z-scale was chosen for the best representation of the coating morphology. (A) uniform
coatings; (B) 20 kDa and 200 kDa blends; (C) 91 kDa and 200 kDa blends.
Figure 12. Four scenarios of phase separation: spin-coating in dry air ((1), 0% Rh); moderate humidity ((2),
45% Rh; (3), 55% Rh); and high humidity ((4), 75% Rh). Low and high molecular weight fractions, convective
flow driving honeycomb formation, and low molecular weight separation at the interface between the water-
wetted rupture and the liquid layer of the polymer solution are presented. (Inkscape v0.92, https://inkscape.org).
and more entangled, reinforced the honeycomb cell borders. The possible scenario is illustrated in Fig. 12. The
coatings at Rh 0%, 45%, 55%, and 75% are marked by numbers 1, 2, 3, and 4, respectively. It is assumed that
MEK did not evaporate entirely and formed MEK/20 kDa and MEK/200 kDa fractions. It should be noted that
MEK is also soluble in water. Thus, some fraction of the solvent can diffuse to the water phase. The MEK/20 kDa
fraction becomes dispersed in the water area of the sample. The MEK/200 kDa fraction forms the walls of the
cells. Two explanations can be proposed. First, as shown above, the rheological properties of 200 kDa and 20 kDa
polystyrene species differ. The more entangled 200 kDa chains act together, while the 20 kDa chains separate from
the high-tension region (higher molecular weight) towards the water/MEK interface. However, water has very
high polarity. Very nonpolar polystyrene forms a round shape in contact. Furthermore, as was demonstrated,
the solvent would deplete the 20 kDa fraction faster than the 200 kDa fraction, allowing for faster solidification
of the 20 kDa islands.
Scientific Reports | (2021) 11:13299 | https://doi.org/10.1038/s41598-021-92594-1 11
Vol.:(0123456789)www.nature.com/scientificreports/
Second, it can be discussed in terms of the two-step phase separation process discussed by Henderson et al.
Their study focused on modelling the two-step quench scenario. First, the solution undergoes a temperature
quench into the spinodal decomposition region. After a specific time, a secondary quench was enacted by a fur-
ther decrease in the temperature. As a result, secondary domains appeared inside the already formed s tructures34.
The morphology discussed was very similar to that discussed in the current paper. The presented power spectra
of the optical images of the 75/25 w/w% 20 kDa and 200 kDa coatings presented in Fig. 13A coincide with the
results presented in the abovementioned paper. Nevertheless, in the current experiment, the first temperature
quench is followed by the condensation of water. A decrease in temperature may facilitate the phase separation
of polystyrene. Conversely, condensation should coincide with an increase in temperature. 23 However, water
may be absorbed by MEK. The MEK/water composition would be a much poorer solvent for PS. Thus, secondary
quenching would occur due to the change in solvent quality by water.
Figure 13 presents the characteristic values describing the shape of the islands, Fig. 13B–height H, Fig. 13C—
radius R, Fig. 13D—aspect ratio H/R and Fig. 13E–profile of an island. The dependence of the shape on the
fraction of 20 kDa PS can be pointed out.
Additionally, we tested the formation of micro islands when a short spin-coating time was used (0.5 s and
1 s). These images are presented in Fig. S15 in SI. Secondary phase separation has already been seen, although
the islands were not fully formed.
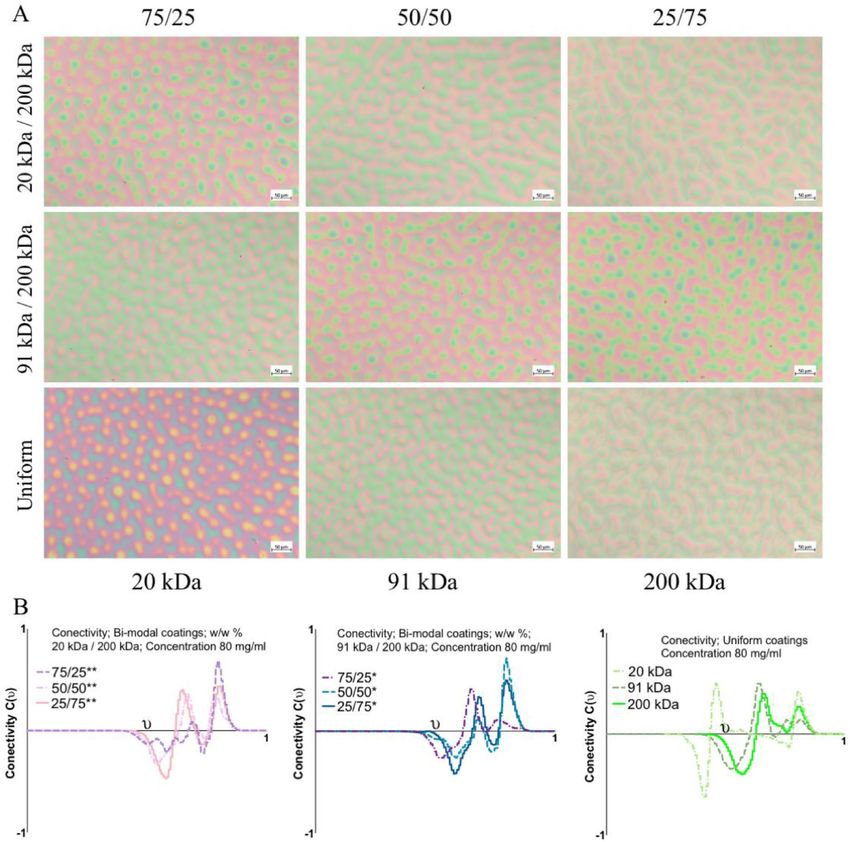
The AFM image (Fig. 14a–c) shows the event of the low molecular weight fraction separating from the cell
border. Cracks between the two phases and the spot where the partially formed island disconnects from the
bulk can be seen. The black rectangle indicates the area that differed in terms of the deflection signal and phase
contrast. However, the discussed phenomenon appears after the thin film of the solution was formed on the sub-
strate. The condensation required time to make holes in the films. The dewetting of the substrate by the solution
can induce additional motion of molecules, allowing the lower molecular weight fraction to precipitate. Water
would also change the surface tension locally and induce the thermocapillary effects that lead to the formation
of convection cells (depicted in Fig. 14d).
As mentioned, the polystyrenes used were unmodified standard grade polymers. The unchanged chemical
composition of the coatings was confirmed by FTIR spectroscopy (SI Fig. S10–S12). The recognized functional
groups were CH3, CH2, and phenyl groups. These groups are hydrophobic and were the driving force behind
the dewetting process under high humidity conditions. This argument was further reinforced by the free surface
energy (SEF) measurement (SI Figs. S13–S14). The SEF of the 20 kDa coating was slightly higher than that of
the 200 kDa coating and, consequently, led to a higher affinity for the hydrophilic S iO2 substrate of the former
coating.
Conclusions
To the best of our knowledge, we have demonstrated for the first time phase separation in a solution of polysty-
renes with identical chemical structures but different molecular weights. Phase separation was found for 90 kDa
and 200 kDa blends and 20 kDa and 200 kDa blends. In both cases, phase separation was found for 75/25 and
50/50 w/w%. Force spectroscopy was used to determine the different phases in the coatings. Phase separation
was discussed in terms of the difference in the viscosity of polystyrene species. Next, we provoked secondary
phase separation by introducing water vapor. We have theorized that water vapor would act two-fold. The water
droplets formed breath figures, and as the vapor concentration increased, they caused raptures in the liquid
film. Second, the absorption of vapor by methyl ethyl ketone, a solvent chosen due to its hygroscopic proper-
ties, would decrease the solubility of polystyrene. We observed secondary phase separation for the 20 kDa and
200 kDa blends. But not for 90 kDa and 200 kDa blends. We also pointed out that the internal thermocapillary
convection and gradient of the surface tension of the top layer formed convection cells inside the liquid. The
ruptures caused by condensation, with the combination of convection and thermocapillary effects, formed
honeycombs. The secondary phase separation left the dispersed 20 kDa polystyrene phase inside the 200 kDa
polystyrene honeycomb.
The described mechanism can likely be applied to other solvent-polymer systems, consisting even of three
polymer fractions. It is likely possible to apply the described process to other coating methods, such as dip coat-
ing, blade coating or ink-jet printing.
Experimental
Materials. All polymers and solvents were purchased from Sigma Aldrich (Merck KGaA). A one-side pol-
ished ultrasmooth SiOx wafer was purchased from Technolutions Sp. z o. o.
Preparation of the coatings. Analytical standard grade polystyrenes (PS) obtained from the supplier
with PDI = 1.04 and Mw = 20 kDa, 91 kDa, 150 kDa, or 200 kDa were used.
Two kinds of blends were prepared: blends of 20 kDa and 200 kDa PS mixed in 75/25, 50/50, 25/75 w/w %
proportions; similarly, blends of 91 kDa and 200 kDa PS were mixed in the same proportions and dissolved in
methyl ethyl ketone (analytic grade, MEK) and mixed for an hour at 37 °C. After mixing, the solutions were
stored overnight. The list of polystyrene blends used is summarized in Table 1. The concentrations of these solu-
tions ranged from 2.5 to 80 mg/ml. A DIY Arduino-based spin-coater with a chamber with controlled humidity
was used to spin polystyrene films onto the SiOx wafers. The experimental setup is depicted in Supplementary
Information (SI) Figs. S1–S2. A 35 μl aliquot of the solution was pipetted onto a 1 cm × 1 cm wafer. Spin-coating
was performed in a closed chamber with a constant airflow of 10 ml/min to maintain the desired humidity. The
rotational speed was 2700 rpm or 3300 rpm. The spinning time was set to 10 s to allow the solvent to evaporate.
Solutions were spin-coated under humidity of Rh 0%, 45%, 55%, 75%.
Scientific Reports | (2021) 11:13299 | https://doi.org/10.1038/s41598-021-92594-1 12
Vol:.(1234567890)www.nature.com/scientificreports/
Figure 13. (A) Power spectra of islands/honeycomb morphology. (B) Mean height, H, of islands with respect to
the fraction of 20 kDa PS, ɸ. (C) Mean radius of islands, R. (D) mean aspect ratio of islands, H/R. H profile of an
island.
Scientific Reports | (2021) 11:13299 | https://doi.org/10.1038/s41598-021-92594-1 13
Vol.:(0123456789)www.nature.com/scientificreports/
Figure 14. AFM magnification of the cell border of the 20 kDa and 200 kDa 75/25 w/w% blend spun at Rh
75%. The black rectangle indicates the separation of different phases. The same region is shown in the form of
(a) topography, (b) AFM deflection, the direction of dewetting is indicated by the black arrows; (c) AFM phase
image, an arrow indicates the phase signal difference presented as the averaged cross-section of the marked
region (black box); (d) schematic illustration depicting proposed formation mechanism of the honeycomb;
Convection inside the liquid film led to cells formation, condensation of water led to film rupture (Blue).
Subsequently, the recess of the film occurred. At the interface between the rupture area and the receding film,
separation of the lower molecular fraction arises (yellow). Subsequently, the cell borders were reinforced by the
remaining high molecular weight fraction (Orange).
Gel permeation chromatography (GPC). The number and weight average molecular weights (Mn and
Mw) were determined by an Agilent 1200 series GPC modular system with a refractive index detector (RID)
equipped with two PLgel 5 µm MIXED-C columns (300 × 7.5 mm) in the series, while the polydispersity index
was calculated as the ratio of M
w/Mn. Calibration was performed using a set of 12 narrowly distributed polysty-
rene standards with molecular weights (Mps) in the range of 474 g/mol—1 800 000 g/mol.
The measurements were performed at 35 °C. Chloroform GPC grade was used as a solvent at a flow rate of
0.7 ml/min. All samples (~ 2 mg/ml) were filtered through a PTFE 0.2 µm membrane before the analysis. The
data were collected by ChemStation for LC and analysed by ChemStation GPC Data Analysis Software.
Force spectroscopy FS and elastic modulus. When a force spectroscopy experiment is performed, an
AFM probe applies strain on the film surface67. Force spectroscopy was performed by means of atomic force
microscopy (AFM, Asylum Research MFP3D Bio)68. An OMLCT-AC200TS-R3 (Olympus) cantilever was used
with the nominal spring constant k = 9 N/m and tip radius below 10 nm, as suggested by the cantilever’s pro-
ducer. AFM was calibrated using the built-in thermal vibrations method. Th e69 Johnson, Kendall, and Roberts
(JKR) model was used to calculate the elastic modulus (E)70. The indentation depth was ~ 8 nm (Supplementary
Information, 4. Force Spectroscopy). As we wanted to neglect the possible influence of stiff (silica) substrate on
the polystyrene coating’s registered mechanical data, we decided to perform an FS experiment using the thickest
films (films spun from the solution of a concentration of 80 mg/ml).
Scientific Reports | (2021) 11:13299 | https://doi.org/10.1038/s41598-021-92594-1 14
Vol:.(1234567890)www.nature.com/scientificreports/
Type of Blend Sample code Molecular weight Mw [kDa] PDI
20 kDa 20 1.04
91 kDa 91 1.04
Uniform
150 kDa 150 1.04
200 kDa 200 1.04
Molecular weight
Bimodal Sample code [Mw] [kDa] a [Mn] [kDa] b PDI
75/25* 137 118 1.16
91 kDa / 200 kDa 50/50* 166 146 1.14
25/75* 186 173 1.08
75/25** 158 65 2.43
20 kDa / 200 kDa 50/50** 184 110 1.67
25/75** 194 155 1.25
Table 1. List of polymer blends that were used for spin-coating. a Weight average molecular weight
[ Mw] = (f1Mw12 + f2Mw22)/(f1Mw1 + f2Mw2), bNumber average molecular weight [Mn] = f1Mw1 + f2Mw2, where f—
fraction of one of the polymers in %; PDI states for the polydispersity index.
Maps of a large area of the coating 80 μm × 80 μm with 40 × 40 points were obtained. These higher resolu-
tion maps are supplemented as an attachment (SI). These data were supported by lower resolution maps with a
resolution of 15 × 15 points. Each map was used to obtain the mean elastic modulus value. Altogether, at least
five maps were made. Ordinary one-way ANOVA followed by multiple comparisons Fisher’s test was used to
compare different groups’ means.
Furthermore, histograms representing each higher resolution map were prepared. The skewness of the elastic
modulus distribution was measured. Skewness was divided into two groups: one for uniform coatings and one
for bimodal coatings. The t-test (p < 0.05) was used to compare the means of these two groups.
Evaluation of the thickness of spin‑coated films by means of atomic force microscopy. The
thickness of spin-coated films was assessed based on intentionally made scratch topography images (SI Fig. S3).
Five randomly selected areas of each sample were tested, and profiles were generated. Each of the profile lines
was averaged from three contiguous lines to avoid any unwanted artefacts.
Imaging of the coatings. Inverted light microscopes (Nikon EPIPHOT 200 and Zeiss Axio Observer)
were used for imaging. An atomic force microscope (AFM, Asylum Research MFP3D Bio) working in tapping
mode (AC mode) was used to illustrate the phase composition and topography of the polystyrene films.
In situ measurement of evaporation during spin‑coating through laser light reflectometry
with stroboscopic effect. In situ stroboscopic laser light reflectometry was developed to investigate the
thinning of the solution layer while spinning. The laser light is reflected from the coating during the spin-coating
process. The occurring interference pattern can be used to estimate the thinning rate of the s olution71–73. The
experimental setup is described in SI, Figs. S1–S2.
Depending on the thickness of the layer, constructive or destructive interference can occur. The condition
for the constructive interference was calculated from Bragg’s law: 2n�hcosθ = m , where n is the refractive
index of the layer, Δh is the thickness of the layer, θ is the incident angle, m is an integer number, and λ is the
light wavelength. For pure MEK, Δh = 235 nm (assuming the refractive index MEK = 1.3788). For the polymer
solution, it was assumed that the refractive index was n = 1.5; thus, Δh = 217 nm. The laser light wavelength was
λ = 650 nm. The time resolution was 0.022 s.
Data analysis and visualisation. For data visualization and analysis: Microsoft PowerPoint 365, Inkscape
v0.92, and GraphPad Prism was used. Image analysis procedures implemented in Gwyddion software (ver 2.50)
and Igor Pro 6.37 with Asylum Research 15.02.105 add-on were used. Spectragryph v1.5.15 was used for FTIR
analysis.
Fourier transform IR. Infrared spectra were collected using a Fourier transform infrared spectrophotom-
eter (Nicolet 8700 FTIR, Thermo Scientific). Measurements were performed using FTIR ATR over a range of
4000–400 cm−1.
Contact angle and surface free energy measurement. The contact angle (CA) was measured using a
Data Physics OCA 20 goniometer. The contact angle was measured with a sessile drop method. For surface free
energy measurement (SFE), two kinds of coatings were chosen: 20 kDa and 200 kDa. For each type of coating,
three droplets were measured, and three different coatings were used. Two liquid systems were used: deionised
water and diiodomethane (Sigma Aldrich, Analytic grade). The groups were compared with the t-test (p < 0.05).
The Owens, Wendt, Rabel, and Kaelble (OWKR) method was used for SFE calculation74.
Scientific Reports | (2021) 11:13299 | https://doi.org/10.1038/s41598-021-92594-1 15
Vol.:(0123456789)www.nature.com/scientificreports/
Supporting Information (SI)
Experimental setup depicting the custom-built spin-coater with a humidity-controlled chamber and an in situ
interferometer with the stroboscopic effect. Illustration of thickness measurement. Viscosity-related coefficients.
Optical microscope images. FTIR results. Free Surface Energy results.
Received: 11 March 2021; Accepted: 2 June 2021
References
1. Kumar, M. & Bhardwaj, R. Wetting characteristics of Colocasia esculenta (Taro) leaf and a bioinspired surface thereof. Sci. Rep.
10(1), 1–15 (2020).
2. He, R. et al. Artificial honeycomb-inspired TiO 2 nanorod arrays with tunable nano/micro interfaces for improving
poly(dimethylsiloxane) surface hydrophobicity. J. Mater. Sci. 51(6), 2935–2941 (2016).
3. Jahed, Z. et al. Bacterial networks on hydrophobic micropillars. ACS Nano 11(1), 675–683 (2017).
4. Liu, X. et al. Subcellular cell geometry on micropillars regulates stem cell differentiation. Biomaterials 111, 27–39. https://doi.org/
10.1016/j.biomaterials.2016.09.023 (2016).
5. Walheim, S., Böltau, M., Mlynek, J., Krausch, G. & Steiner, U. Structure formation via polymer demixing in spin-cast films. Mac-
romolecules 30(17), 4995–5003. https://doi.org/10.1021/ma9619288 (1997).
6. Daly, R., Sader, J. E. & Boland, J. J. The dominant role of the solvent–water interface in water droplet templating of polymers. Soft
Matter 9(33), 7960 (2013).
7. Khikhlovskyi, V. et al. Nanoscale organic ferroelectric resistive switches. J. Phys. Chem. C 118(6), 3305–3312. https://doi.org/10.
1021/jp409757m (2014).
8. D’Andrade, B. W. & Forrest, S. R. White organic light-emitting devices for solid-state lighting. Adv. Mater. 16(18), 1585–1595.
https://doi.org/10.1002/adma.200400684 (2004).
9. Yabu, H. Fabrication of honeycomb films by the breath figure technique and their applications. Sci. Technol. Adv. Mater. 19(1),
802–822. https://doi.org/10.1080/14686996.2018.1528478 (2018).
10. Wu, D. et al. Design and preparation of porous polymers. Chem. Rev. 112(7), 3959–4015. https://d oi.o
rg/1 0.1 021/c r2004 40z (2012).
11. Karagkiozaki, V. et al. Development of a nanoporous and multilayer drug-delivery platform for medical implants. Int. J. Nanomed.
7, 5327–5338 (2012).
12. Calejo, M. T., Ilmarinen, T., Skottman, H. & Kellomäki, M. Breath figures in tissue engineering and drug delivery: state-of-the-art
and future perspectives. Acta Biomater. 66, 44–66 (2018).
13. Vendra, V. K., Wu, L., & Krishnan, S. Polymer Thin Films for Biomedical Applications. In: Nanotechnologies for the Life Sciences.
Weinheim: Wiley-VCH Verlag GmbH & Co. KGaA (2011). https://doi.org/10.1002/9783527610419.ntls0179.
14. Griesser, H. J. Thin Film Coatings for Biomaterials and Biomedical Applications, 1st Edition, p. 310 (2016).
15. Łojkowski, M., Walheim, S., Jokubauskas, P., Schimmel, T. & Święszkowski, W. Tuning the wettability of a thin polymer film by
gradually changing the geometry of nanoscale pore edges. Langmuir 35(17), 5987–5996. https://doi.org/10.1021/acs.langmuir.
9b00467 (2019).
16. Plawsky, J. L., Kim, J. K. & Schubert, E. F. Engineered nanoporous and nanostructured films. Mater Today 12(6), 36–45. https://
doi.org/10.1016/S1369-7021(09)70179-8 (2009).
17. Bormashenko, E. Breath-figure self-assembly, a versatile method of manufacturing membranes and porous structures: physical,
chemical and technological aspects. Membranes (Basel) 7, 3 (2017).
18. Birnie, D. P. Rational solvent selection strategies to combat striation formation during spin coating of thin films. J. Mater. Res.
16(4), 1145–1154 (2001).
19. van Franeker, J. J. et al. Controlling the dominant length scale of liquid-liquid phase separation in spin-coated organic semicon-
ductor films. Adv. Funct. Mater. 25(6), 855–863. https://doi.org/10.1002/adfm.201403392 (2015).
20. Schaefer, C., Michels, J. J. & van der Schoot, P. Structuring of thin-film polymer mixtures upon solvent evaporation. Macromolecules
49(18), 6858–6870. https://doi.org/10.1021/acs.macromol.6b00537 (2016).
21. Ebbens, S. et al. In situ imaging and height reconstruction of phase separation processes in polymer blends during spin coating.
ACS Nano 5(6), 5124–5131. https://doi.org/10.1021/nn201210e (2011).
22. Danglad-Flores, J., Eickelmann, S. & Riegler, H. Deposition of polymer films by spin casting: a quantitative analysis. Chem. Eng.
Sci. 179, 257–264 (2018).
23. Dombrovsky, L. A., Frenkel, M., Legchenkova, I. & Bormashenko, E. Effect of thermal properties of a substrate on formation of
self-arranged surface structures on evaporated polymer films. Int. J. Heat Mass Transf. 158, 120053. https://doi.org/10.1016/j.ijhea
tmasstransfer.2020.120053 (2020).
24. Daly, R., Sader, J. E. & Boland, J. J. Taming self-organization dynamics to dramatically control porous architectures. ACS Nano
10(3), 3087–3092. https://doi.org/10.1021/acsnano.5b06082 (2016).
25. Zabusky, H. H. & Heitmiller, R. F. Properties of high density polyethylenes with bimodal molecular weight distribution. Polym
Eng Sci. 4(1), 17–21 (1964).
26. Wu, B. H., Zhong, Q. Z., Xu, Z. K. & Wan, L. S. Effects of molecular weight distribution on the self-assembly of end-functionalized
polystyrenes. Polym. Chem. 8(29), 4290–4298 (2017).
27. Jiang, H. et al. Producing bimodal molecular weight distribution polymers through facile one-pot/one-step RAFT polymerization.
J. Polym. Sci. Part A Polym. Chem. 50(19), 4103–4109 (2012).
28. Whitfield, R., Parkatzidis, K., Truong, N. P., Junkers, T. & Anastasaki, A. Tailoring polymer dispersity by RAFT polymerization: a
versatile approach. Chem. 6(6), 1340–1352 (2020).
29. Tanaka, K., Takahara, A. & Kajiyama, T. Effect of polydispersity on surface molecular motion of polystyrene films. Macromolecules
30(21), 6626–6632. https://doi.org/10.1021/ma970057e (1997).
30. Heitmiller, R. F., Naar, R. Z. & Zabusky, H. H. Effect of homogeneity on viscosity in capillary extrusion of polyethylene. J. Appl.
Polym. Sci. 8(2), 873–880. https://doi.org/10.1002/app.1964.070080226 (1964).
31. Koningsveld, R., Chermin, H. A. G. & Gordon, M. Liquid─liquid phase separation in multicomponent polymer solutions-VIII.
Stability limits and consolute states in quasi-ternary mixtures. Proc. R. Soc. Lond. A Math. Phys. Sci. 319(1538), 331–349. https://
doi.org/10.1098/rspa.1970.0182 (1970).
32. Zeman, L. & Patterson, D. Effect of the solvent on polymer incompatibility in solution. Macromolecules 5(4), 513–516. https://doi.
org/10.1021/ma60028a030 (1972).
33. Shultz, A. R. & Flory, P. J. Phase equilibria in polymer—solvent systems 1,2. J. Am. Chem. Soc. 74(19), 4760–4767. https://doi.org/
10.1021/ja01139a010 (1952).
34. Henderson, I. C. & Clarke, N. Two-step phase separation in polymer blends. Macromolecules 37(5), 1952–1959 (2004).
35. Tanaka, H. Viscoelastic phase separation in soft matter and foods. Faraday Discuss. 158, 371–406 (2012).
Scientific Reports | (2021) 11:13299 | https://doi.org/10.1038/s41598-021-92594-1 16
Vol:.(1234567890)www.nature.com/scientificreports/
36. Hengeller, L. et al. Stress relaxation of bi-disperse polystyrene melts: exploring the interactions between long and short chains in
non-linear rheology. Rheol. Acta 55(4), 303–314 (2016).
37. Harris, E. K. Effect of blending on the rheological properties of polystyrene. J. Appl. Polym. Sci. 17(6), 1679–1692. https://doi.org/
10.1002/app.1973.070170604 (1973).
38. Klein, J. The onset of entangled behavior in semidilute and concentrated polymer solutions. Macromolecules 11(5), 852–858.
https://doi.org/10.1021/ma60065a002 (1978).
39. Hong, K. M. & Noolandi, J. Theory of inhomogeneous multicomponent polymer systems. Macromolecules 14(3), 727–736. https://
doi.org/10.1021/ma50004a051 (1981).
40. Hariharan, A., Kumar, S. K. & Russell, T. P. A lattice model for the surface segregation of polymer chains due to molecular weight
effects. Macromolecules 23(15), 3584–3592. https://doi.org/10.1021/ma00217a009 (1990).
41. Mahmoudi, P. & Matsen, M. W. Entropic segregation of short polymers to the surface of a polydisperse melt. Eur. Phys. J. E. 40(10),
85. https://doi.org/10.1140/epje/i2017-11575-7 (2017).
42. Hill, J. A. et al. Detection of surface enrichment driven by molecular weight disparity in virtually monodisperse polymers. ACS
Macro Lett. 7(4), 487–492. https://doi.org/10.1021/acsmacrolett.7b00993 (2018).
43. Stein, G. E., Laws, T. S. & Verduzco, R. Tailoring the attraction of polymers toward surfaces. Macromolecules 52(13), 4787–4802.
https://doi.org/10.1021/acs.macromol.9b00492 (2019).
44. Carlier, V., Sclavons, M., Jonas, A. M., Jérôme, R. & Legras, R. Probing thermoplastic matrix−carbon fiber interphases 1. Preferential
segregation of low molar mass chains to the interface. Macromolecules 34(11), 3725–3729. https://doi.org/10.1021/ma000404b
(2001).
45. Suwa, J., Kakiage, M., Yamanobe, T., Komoto, T. & Uehara, H. Molecular weight segregation on surfaces of polyethylene blended
films as estimated from nanoscratch tests using scanning probe microscopy. Langmuir 23(11), 5882–5885. https://d oi.o rg/1 0.1 021/
la070150o (2007).
46. Karim, A. et al. Phase-separation-induced surface patterns in thin polymer blend films. Macromolecules 31(3), 857–862. https://
doi.org/10.1021/ma970687g (1998).
47. Hoppe, H., Heuberger, M. & Klein, J. Self-similarity and pattern selection in the roughening of binary liquid films. Phys. Rev. Lett.
86(21), 4863–4866. https://doi.org/10.1103/PhysRevLett.86.4863 (2001).
48. Heier, J., Kramer, E. J., Revesz, P., Battistig, G. & Bates, F. S. Spinodal decomposition in a subsurface layer of a polymer blend film.
Macromolecules 32(11), 3758–3765. https://doi.org/10.1021/ma981709h (1999).
49. Jandt, K. D., Heier, J., Bates, F. S. & Kramer, E. J. Transient surface roughening of thin films of phase separating polymer mixtures.
Langmuir 12(15), 3716–3720 (1996).
50. Huang, C., Förste, A., Walheim, S. & Schimmel, T. Polymer blend lithography for metal films: large-area patterning with over 1
billion holes/inch2. Beilstein. J. Nanotechnol. 6(1), 1205–1211 (2015).
51. Flory, P. J. & Höcker, H. Thermodynamics of polystyrene solutions. Part 1.—Polystyrene and methyl ethyl ketone. Trans. Faraday
Soc. 67, 2258–2269 (1971).
52. Imre, A. & Van Hook, W. A. Liquid-liquid demixing from solutions of polystyrene. 1. A review. 2. Improved correlation with
solvent properties. J. Phys. Chem. Ref. Data 25, 637–661 (1996).
53. Utracki, L. A., & Wilkie, C. A. Polymer Blends Handbook, pp. 1–2378 (2014).
54. Ying, Q. & Chu, B. Overlap concentration of macromolecules in solution. Macromolecules 20(2), 362–366. https://d oi.o rg/1 0.1 021/
ma00168a023 (1987).
55. Kim, J. K., Taki, K., Nagamine, S. & Ohshima, M. Periodic porous stripe patterning in a polymer blend film induced by phase
separation during spin-casting. Langmuir 24(16), 8898–8903 (2008).
56. Heier, J., Kramer, E. J., Groenewold, J. & Fredrickson, G. H. Kinetics of individual block copolymer island formation and disap-
pearance near an absorbing boundary. Macromolecules 33(16), 6060–6067 (2000).
57. Coveney, S. & Clarke, N. Pattern formation in polymer blend thin films: surface roughening couples to phase separation. Phys.
Rev. Lett. 113(21), 1–5 (2014).
58. Mecke, K. Additivity, convexity, and beyond: applications of minkowski functionals in statistical physics. Stat. Phys. Spat. Stat.
https://doi.org/10.1007/3-540-45043-2_6 (2000).
59. Wolf, B. A. Improvement of polymer solubility: influence of shear and of pressure. Pure Appl. Chem. 69(5), 929–933 (1997).
60. Du, B., Tsui, O. K. C., Zhang, Q. & He, T. Study of elastic modulus and yield strength of polymer thin films using atomic force
microscopy. Langmuir 17(11), 3286–3291. https://doi.org/10.1021/la001434a (2001).
61. Landel, R. F. & Nielsen, L. E. Mechanical Properties of Polymers and Composites (CRC Press, 1993).
62. Torres, J. M., Stafford, C. M. & Vogt, B. D. Impact of molecular mass on the elastic modulus of thin polystyrene films. Polymer
(Guildf). 51(18), 4211–4217. https://doi.org/10.1016/j.polymer.2010.07.003 (2010).
63. Kok, C. M. & Rudin, A. Prediction of Flory–Huggins interaction parameters from intrinsic viscosities. J. Appl. Polym. Sci. 27(2),
353–362 (1982).
64. Lee, S. H. & Lee, S. B. The Hildebrand solubility parameters, cohesive energy densities and internal energies of 1-alkyl-3-methyl-
imidazolium-based room temperature ionic liquids. Chem. Commun. 27, 3469–3471 (2005).
65. Bormashenko, E. et al. Mesoscopic patterning in evaporated polymer solutions: Poly(ethylene glycol) and room-temperature-
vulcanized polyorganosilanes/-siloxanes promote formation of honeycomb structures. Macromol. Chem. Phys. 209(6), 567–576
(2008).
66. Uchiyama, H., Matsui, T. & Kozuka, H. Spontaneous pattern formation induced by bénard–marangoni convection for sol–gel-
derived titania dip-coating films: effect of co-solvents with a high surface tension and low volatility. Langmuir 31(45), 12497–12504.
https://doi.org/10.1021/acs.langmuir.5b02929 (2015).
67. Zgłobicka, I. et al. Microstructure and nanomechanical properties of single stalks from diatom Didymosphenia geminata and their
change due to adsorption of selected metal ions. J. Phycol. 53, 4 (2017).
68. Chlanda, A., Kijeńska-Gawrońska, E., Zdunek, J. & Swieszkowski, W. Internal nanocrystalline structure and stiffness alterations
of electrospun polycaprolactone-based mats after six months of in vitro degradation. An atomic force microscopy assay. J. Mech.
Behav. Biomed. Mater. 101, 103437 (2020).
69. Sader, J. E. et al. A virtual instrument to standardise the calibration of atomic force microscope cantilevers. Rev Sci Instrum. 87(9),
093711. https://doi.org/10.1063/1.4962866 (2016).
70. Wu, K. C. & You, H. I. Determination of solid material elastic modulus and surface energy based on JKR contact model. Appl.
Surf. Sci. 253(20), 8530–8537 (2007).
71. Toolan, D. T. W. Straightforward technique for in situ imaging of spin-coated thin films. Opt. Eng. 54(2), 024109 (2015).
72. Toolan, D. T. W. & Howse, J. R. Development of in situ studies of spin coated polymer films. J. Mater. Chem. C 1(4), 603–616 (2013).
73. Mokarian-Tabari, P. et al. Quantitative evaluation of evaporation rate during spin-coating of polymer blend films: control of film
structure through defined-atmosphere solvent-casting. Eur. Phys. J. E 33(4), 283–289 (2010).
74. Drelich, J. W. et al. Contact angles: history of over 200 years of open questions. Surf. Innov. https://doi.org/10.1680/jsuin.19.00007
(2019).
Scientific Reports | (2021) 11:13299 | https://doi.org/10.1038/s41598-021-92594-1 17
Vol.:(0123456789)You can also read