Predicting the invasion range for a highly polyphagous and widespread forest herbivore
←
→
Page content transcription
If your browser does not render page correctly, please read the page content below
A peer-reviewed open-access journal
NeoBiota 59: 1–20 (2020)
                                                Winter moth environmental niche
doi: 10.3897/neobiota.59.53550                             RESEARCH ARTICLE                                                     NeoBiota1
http://neobiota.pensoft.net                                                                              Advancing research on alien species and biological invasions

               Predicting the invasion range for a highly
             polyphagous and widespread forest herbivore

                Laura M. Blackburn1, Joseph S. Elkinton2, Nathan P. Havill3,
              Hannah J. Broadley2, Jeremy C. Andersen2, Andrew М. Liebhold1,4

1 Northern Research Station, USDA Forest Service, Morgantown, West Virginia, USA 2 Department of En-
vironmental Conservation, University of Massachusetts, Amherst, Massachusetts, USA 3 Northern Research
Station, USDA Forest Service, Hamden, Connecticut, USA 4 Faculty of Forestry and Wood Sciences, Czech
University of Life Sciences Prague, 165 00 Praha 6 – Suchdol, Czech Republic

Corresponding author: Andrew Liebhold (andrew.liebhold@usda.gov)

Academic editor: Ingolf Kühn | Received 23 April 2020 | Accepted 26 June 2020 | Published 28 July 2020

Citation: Blackburn LM, Elkinton JS, Havill NP, Broadley HJ, Andersen JC, Liebhold AМ (2020) Predicting the
invasion range for a highly polyphagous and widespread forest herbivore. NeoBiota 59: 1–20. https://doi.org/10.3897/
neobiota.59.53550

Abstract
Here we compare the environmental niche of a highly polyphagous forest Lepidoptera species, the winter
moth (Operophtera brumata), in its native and invaded range. During the last 90 years, this European tree fo-
livore has invaded North America in at least three regions and exhibited eruptive population behavior in both
its native and invaded range. Despite its importance as both a forest and agricultural pest, neither the poten-
tial extent of this species’ invaded range nor the geographic source of invading populations from its native
range are known. Here we fit a climatic niche model, based on the MaxEnt algorithm, to historical records
of winter moth occurrence in its native range and compare predictions of suitable distributions to records
from the invaded range. We modeled this distribution using three spatial bins to overcome sampling bias for
data obtained from public databases and averaged the multi-continental suitable habitat prediction. Results
indicate that this species is distributed across a wide range of climates in its native range but occupies a nar-
rower range in its invaded habitat. Furthermore, the lack of a close fit between climatic conditions in parts
of its invaded range and its known native range suggests the possibility that this species has adapted to new
climatic conditions during the invasion process. These models can be used to predict suitable habitats for
winter moth invasions worldwide and to gain insight into possible origins of North American populations.

Keywords
bioclimatic modelling, biological invasions, climatic envelope, geographical distribution, invasive alien
species, range projection, species distribution models

Copyright Laura M. Blackburn et al. This is an open access article distributed under the terms of the Creative Commons Attribution License (CC BY
4.0), which permits unrestricted use, distribution, and reproduction in any medium, provided the original author and source are credited.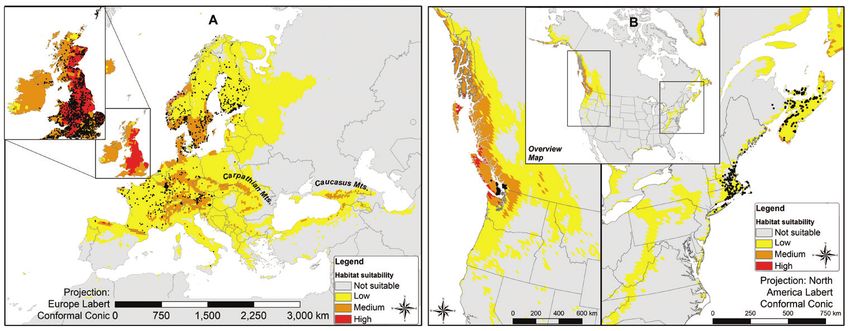
2                    Laura M. Blackburn et al. / NeoBiota 59: 1–20 (2020)

Introduction
With heightened awareness of the damage caused by biological invasions, biosecurity
programs take on increasing importance for preventing new invasions (Hulme 2009).
Risk assessment plays a key role in biosecurity programs, providing information on like-
ly invasion success and impacts of species, and is used to prioritize preventative meas-
ures (Hayes 2003). A crucial component of the risk assessment process is mapping the
potential range of a species should it become established (Venette et al. 2010). Knowl-
edge of the potential geographical distribution of a candidate invasive species can guide
implementation of both pre- and post-border biosecurity activities such as surveillance.
     Understanding and quantifying the ecological niche of a species in its native range
can be used to predict its potential distribution in a novel environment. Ecological
niche models use occurrence data and environmental variables to predict habitat suit-
ability (Guisan and Zimmermann 2000). These models typically use available species
occurrence records to quantify the association of a species’ distribution with various
components of its habitat such as climate. Ecological niche models assume that a spe-
cies is well adapted to present climatic conditions and this acclimation assumption is
carried into future distribution forecasts. For practicality, these models typically ignore
the effects of biotic interactions which may limit a species’ potential distribution, and
thus are expressed as a realized niche. Application of ecological niche models to predict
an invading species future range assumes that successful invasion of novel environ-
ments requires similarly matched climates between the native and novel regions (Pan-
etta and Mitchell 1991).
     Unfortunately, systematic surveys for most species throughout their ranges are of-
ten impractical, though a wealth of distribution information resides in global databases
and museum collections worldwide. These datasets, such as the Global Biodiversity
Information Facility (GBIF, GBIF.org 2018), assemble occurrence records from many
different sources; however, the intensity of sampling behind these records often con-
tains a sampling bias where more records exist in certain areas (such as near research
facilities or locations with extensive sampling by hobbyists).
     A number of methods can be applied to limit this spatial bias. One method of ac-
counting for sampling bias is to use frequencies of background occurrence records of
a conspecific species or an entire genus, often referred to as target group background
bias records, as proxies for sampling effort (Yates et al. 2010). Another method involves
spatially filtering the occurrence records to remove records at distances greater than the
resolution of cells in the environmental layers (Aiello‐Lammens et al. 2015; Boria et
al. 2014; Hijmans 2012; Kramer‐Schadt et al. 2013; Pearson et al. 2007; Veloz 2009).
Occurrence records can also be thinned based on their environmental/climatic values,
discarding repetitive occurrences in similar climatic conditions (Varela et al. 2014), or
records can be filtered geographically, splitting occurrence records into geographic bins
(Jiménez-Valverde et al. 2011; Radosavljevic and Anderson 2014).
     This study focuses the use of ecological niche models for predicting the potential
distribution of the winter moth, Operophtera brumata. The native distribution of this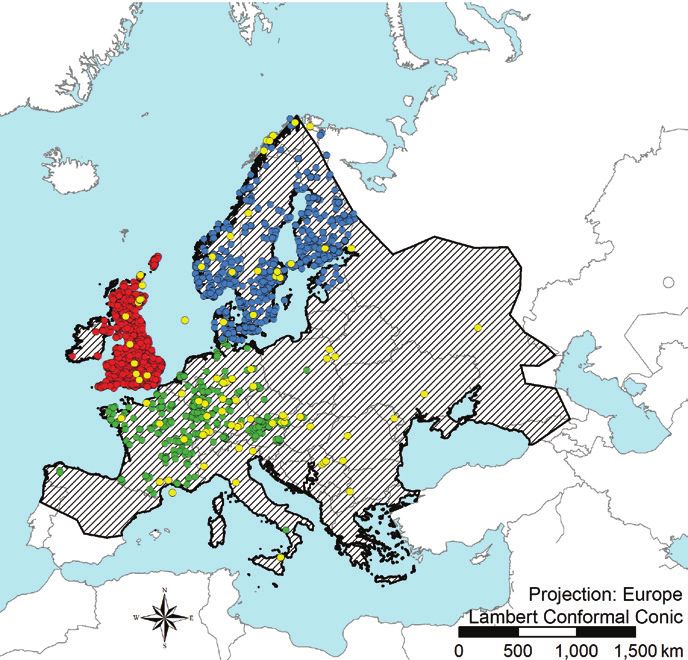
Winter moth environmental niche                                    3

species ranges widely through most of Europe (Kozhanchikov 1950) (Fig. 1). Further-
more, larvae of this species are known to have an extremely broad host range, feeding
on the foliage of a wide variety of broadleaf trees and occasionally on certain conifer
species (Wint 1983). Recurrent outbreaks of this insect occur in several regions of its
native range, especially in mountain birch (Betula pubescence) forests in Fennoscandia
(Jepsen et al. 2008), but also on other hosts, such as Sitka spruce (Picea sitchensis)
planted in the British Isles (Stoakley 1985; Watt and McFarlane 1991) and even on
heather (Calluna vulgaris) in Scotland (Kerslake et al. 1996).
    Non-native populations of the species exist in portions of North America with
alien populations established in Nova Scotia, the Pacific Northwest, and New England
(Fig. 1). Winter moth was first accidentally introduced to Nova Scotia in the 1930s
(Hawboldt and Cuming 1950), Oregon in the 1950s (Kimberling and Miller 1988),
near Vancouver, British Columbia around 1970 (Gillespie et al. 1978), and eastern
Massachusetts in the 1990s (Elkinton et al. 2010). It is unknown whether these repre-
sent separate introductions from the native range or a single invasion that has spawned
several secondary introductions. Following the initial establishment of each of these
populations there was some initial range expansion, though in each case, spread may

A                                                                 B

Figure 1. A map showing the distribution of the native range for winter moth (Operophtera brumata),
recreated from Kozhanchikov (1950), as well as native winter moth occurrence records used as training
records – colored according to three geographic filters (British Isles in red, Fennoscandia in blue and
Central/Southern Europe in green) and evaluation records shown in yellow B map of North American
records reflecting the invaded range separated into three geographic regions (western Canada in brown,
New England in orange and eastern Canada in violet).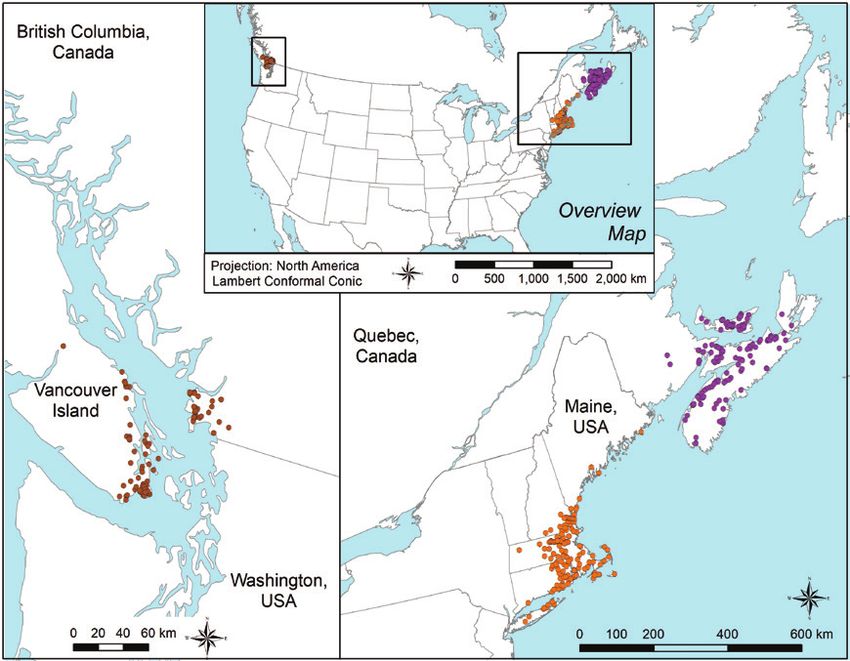
4                     Laura M. Blackburn et al. / NeoBiota 59: 1–20 (2020)

have been limited by climatic conditions, introduction of biological control agents,
and/or by hybridization with the native congener, Bruce spanworm, O. bruceata (El-
kinton et al. 2010).
    The objective of this study was to fit ecological niche models based on winter moth
occurrence records from its native range in order to predict the potential invaded range
of this species. Furthermore, as there is much uncertainty about where in Europe the
non-native populations of winter moth originated from (Andersen et al. 2017; Elkin-
ton et al. 2010; Gwiazdowski et al. 2013), we use geographic filtering to compare the
climatic suitability of different potential source populations to each of the invaded
North American populations. We then comment on the utility of geographic filtering
to reduce sample bias in datasets based on public records.

Methods
Modelling approach

The winter moth’s climatic niche was quantified using the machine learning algorithm,
MaxEnt v. 3.4.1 (Phillips et al. 2006), using presence-only data for this species. MaxEnt
uses both distribution information and environmental variables to predict potential are-
as of distribution for a species. It provides an estimated likelihood for a species range that
is near uniform and still subject to environmental confines (Elith et al. 2011). MaxEnt,
the most widely used species niche and distribution modelling algorithm (Fourcade et
al. 2014), is efficient for complex interactions between response and predictor variables
with little sensitivity to small sample sizes. However, difficulties in accuracy arise when
modelling generalist or widespread species (Connor et al. 2018; Jiménez‐Valverde et al.
2008; Luoto et al. 2005; Marmion et al. 2009; Segurado and Araujo 2004).

Occurrence records
Presence-only distribution data were assembled from various sources: GBIF (www.
GBIF.org, taxon key = 1972449), Barcode Of Life Database (BoldData, www.bar-
codinglife.org), Canadian Forest Invasive Alien Species (CanFIAS, www.exoticpests.
gc.ca) database, Elkinton et al. (2010), Andersen et al. (2017), and Tenow et al.
(2013). These records were cleaned and separated into two subsets – all of the GBIF
records were placed into a training dataset (n = 4151), while records from BoldData,
CanFIAS, Elkinton, Andersen and Tenow were separated into a testing dataset (n =
518). Records from the training dataset, consisting of occurrence records for win-
ter moth in the GBIF database, were downloaded on November 29, 2018 using the
dismo package in R (Hijmans et al. 2017) and the gbif function. Both training and
testing records were cleaned to remove any records where either the latitude or lon-
gitude coordinates were missing. Additionally, these records were filtered temporally,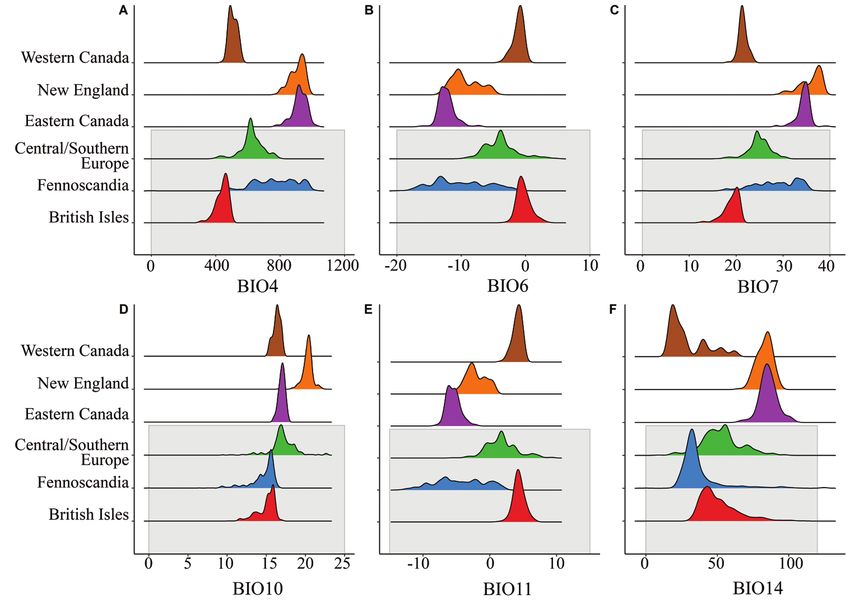
Winter moth environmental niche                           5

keeping only those records between 1970 and 2010, to best align with the environ-
mental layers while maintaining a large sample size. Next, these records were visual-
ized in ArcMap (ESRI 2017) to group locations (Fig. 1) into three regions for native
range records: the British Isles (n = 2846), Fennoscandia (n = 894), and Central/
Southern Europe (n = 398); and three regions for invaded range records (n = 103):
Western Canada, Eastern Canada and New England. The three native range regions
were arbitrarily selected as geographically isolated areas, each with unique densities of
occurrence records. The three invaded range regions were selected because they repre-
sent isolated ranges, though there is a small coastal area where the Eastern Canada and
New England regions are contiguous (Fig. 1). Finally, only unique records were kept
– using the delete identical tool with the advanced license of ArcMap. These cleaned
records were re-projected into the World Molliweide projection, to match that of the
environmental layers, and the latitude and longitude were recalculated before creating
a CSV file to be used in MaxEnt.

Sampling bias
Accurate application of MaxEnt necessitates accounting for the effects of geographi-
cal sampling bias in locations of occurrence data. Use of occurrence data sets that
are spatially biased can result in over-representation of certain environmental features
prevalent in more intensively surveyed areas (Phillips et al. 2009). If the sampling ef-
fort is known, it can be included in the model calibration to correct for sampling bias
(Anderson 2012; Phillips et al. 2009). However, this is rarely the case especially when
using museum records from databases, such as GBIF.
     We focused our analysis on geographic filtering or splitting of the data into bins
to overcome sampling bias. Due to the winter moth’s extensive geographical range and
the comparatively high density of records in the United Kingdom compared to Cen-
tral/Southern Europe, we selected to split location records from the native range into
three geographical bins: the British Isles, Fennoscandia, and Central/Southern Europe
(Fig. 1) as the simplest method for handling sampling bias.

Environmental variables
Environmental variables included in the model were selected from WorldClim 10
minute resolution variables (Fick and Hijmans 2017). WorldClim version 2 includes
gridded values for 19 bioclimatic variables derived from temperature and precipitation
measurements spanning 1970–2000 collected from a global network of meteorological
stations. All environmental variables were resampled in R using the bilinear method
to a 25 km cell size in the Mollweide projection, which maintains equal areas – an as-
sumption that is required for MaxEnt models (Elith et al. 2011). We chose to use the
following temperature variables that are likely to be of biological importance, BIO1–4,
6                       Laura M. Blackburn et al. / NeoBiota 59: 1–20 (2020)

Table 1. WorldClim v.2 bioclimatic variables included in the model, and their descriptions.

    Variable                                               Description
BIO1                                             Annual Mean Temperature (°C)
BIO2                            Mean Diurnal Range (Mean of monthly (max temp – min temp)) (°C)
BIO3                                           Isothermality ((BIO2/BIO7) * 100)
BIO4                                    Temperature Seasonality (standard deviation *100)
BIO6                                         Min Temperature of Coldest Month (°C)
BIO7                                     Temperature Annual Range (BIO5-BIO6) (°C)
BIO10                                     Mean Temperature of Warmest Quarter (°C)
BIO11                                      Mean Temperature of Coldest Quarter (°C)
BIO14                                          Precipitation of Driest Month (mm)

6–7, 10–11 and 14 (Table 1). Insects are ectotherms and therefore their development
is sensitive to accumulated degree days as well as to extreme temperatures (Battisti and
Larsson 2015). For this reason, we concluded that temperature would be more likely
to influence the distribution of winter moth than precipitation, but also identified
drought as possibly affecting the pupal stage which reside in the top layer of the soil
throughout the summer and early autumn, hence the inclusion of BIO14. Given the
polyphagous nature of winter moth larvae, we expected that suitable host plants are
present in most locations of the native and invaded ranges and therefore we did not
include any variable describing vegetation as predictive environmental variables.

Model parameters
We fit MaxEnt models using the following adjustments to default settings. We generat-
ed response curves and jackknife statistics to measure variable importance. Samples files
consisted of training datasets for each spatial bin. Environmental layers were clipped
to a 400 km buffer around each sample file. The projection layers directory consisted
of environmental variables clipped to latitudes above 20°N. The algorithm created 100
replicate models for cross validation. The test sample file was the corresponding testing
dataset, the maximum iterations was changed to 5000 for reaching algorithm optimi-
zation. A statistical analysis was performed on data extrapolated from each model run,
using the receiver operating characteristic (ROC) plot to evaluate model performance.
The area under the curve (AUC) of an ROC curve ranges in values from 0 to 1 (Field-
ing and Bell 1997) with a value of 0.5 indicating that the model performed as good as
random and a value of 1 indicates the model has perfect discrimination.
     Selection of an appropriate background extent during ecological niche modeling
is often overlooked. If the considered extent is too narrow to accurately represent the
potential movement of a species over time, the importance of climatic variables in
demarcating a species’ distribution may be underestimated (Barve et al. 2011). We
chose a buffer distance of 400 km, roughly the distance between the Nova Scotia
population and the Massachusetts population. However, this distance is much larger
than the likely generational winter moth maximum dispersal distance; windborne first
Winter moth environmental niche 7
instar larvae are known to balloon 50 m (Edland 1971; Huntley et al. 1995) and adult
females are incapable of flight.
Model complexity can be varied by altering the regularization parameter; this pa-
rameter reduces omission rates. After running the models with regularization values of
0.1, 1 and 3, we chose to use a regularization parameter of 3 to avoid over-fitting our
distribution model.
Analyzing the climatic niche
Ridgeline plots of the distribution of environmental variables (BIO 1–4, 6–7, 10–11,
14) among samples were created to further identify differences and similarities in the
abiotic niche for each spatial bin from the native versus novel locales. Next, principal
components analysis was applied to the nine environmental variables for the pooled oc-
currence records (both native and invaded ranges) and scores for the first two principal
components were plotted separately for each spatial bin (British Isles, Fennoscandia,
and Central/Southern Europe, Western Canada, Eastern Canada and New England) in
order to discern climatic similarities and differences among regions. ArcMap was used
to create a 15 km fishnet of points for the entire study area, which extends 400 km
beyond sites of winter moth occurrences in both the native and novel ranges. Next,
WorldClim layers were speared to assign their values to each point location. Addition-
ally, cells were coded based on their geographic location (spatial bin) and if within
15 km of a winter moth occurrence. These occurrence data were then exported to R
and principal components analyzed with the ‘prcomp’ function in the base R language.
Distribution modelling
Three different MaxEnt models, one fit to occurrence data from each of the three geo-
graphical bins of the native range, were used to predict probabilities of suitable habitat
for winter moth in North America. These three model predictions were then averaged
to create a combined model and these probabilities were classified into three levels of
habitat suitability
MaxEnt output consist of continuous probability values ranging from 0 (unsuit-
able habitat) to 1 (suitable habitat). MaxEnt output provides the modeler with 11
thresholds to choose from when converting the suitability map to a binary map, all
of these thresholds provide a balance between commission and omission rates (Field-
ing and Bell 1997; Phillips et al. 2017). Model outputs were converted to classified
suitability maps. To do this we employed MaxEnt’s ‘balance’ threshold which mini-
mizes 6.00 * training omission rate + 0.04 * cumulative threshold + 1.60 * fractional
predicted area. Values below this threshold were dropped and a composite map was
created, averaging across predicted probabilities from models derived from each of the
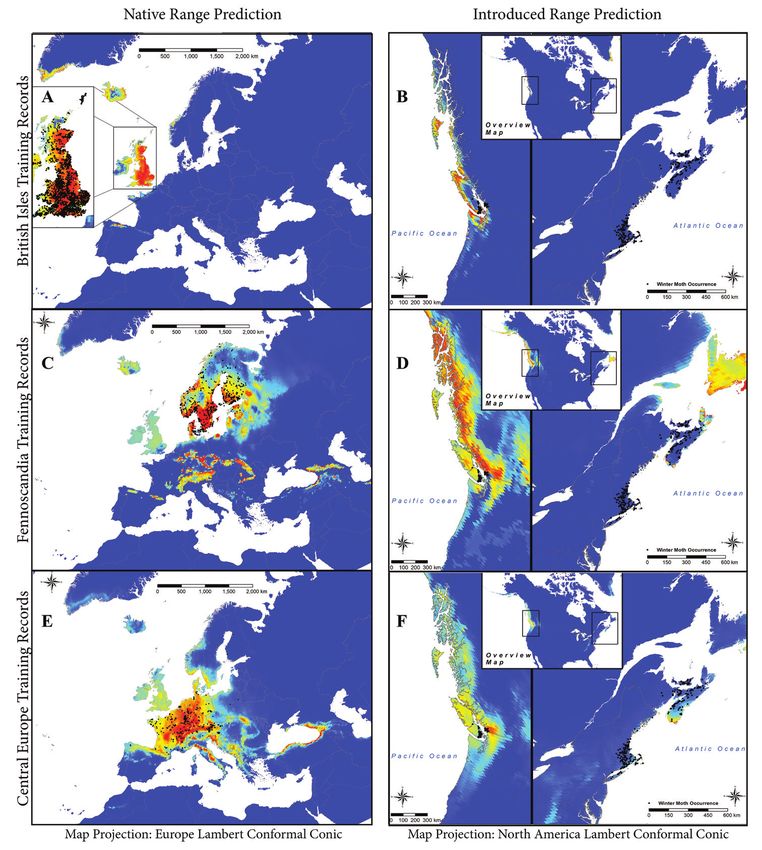
three geographical bins in the native range.8 Laura M. Blackburn et al. / NeoBiota 59: 1–20 (2020) Results Predictions based on native range occurrences All three models fit to native range records from spatial bins (Fig. 2) performed better than random (Table 2; British Isles AUC = 0.795, Fennoscandia AUC = 0.75, Cen- tral/Southern Europe AUC = 0.816). Predictions of suitable winter moth habitat in Europe and North America based on averaging probabilities from the three different models are shown in Fig. 3. The predicted distribution in Europe based on the average of the three models mostly corresponds well with the extent of the distribution map from Kozhanchikov (1950) (Fig. 1). However, the predicted area of suitable habi- tat extends beyond the eastern boundary of occurrence records into the Carpathian and Caucasus Mountain ranges (Fig. 3). The predicted distribution in North America correctly predicts the winter moth distribution in western Canada, but also predicts extensive areas of suitable habitat north of the invaded range, along the coast of the Cordillera region in Canada and into the Pacific Mountain System of Alaska includ- ing the Alaska Peninsula. The prediction for suitable habitat in eastern North America includes a small portion of Nova Scotia, but overall misses most of the Winter Moth’s current eastern North American range and instead predicts moderately suitable habi- tat farther north in eastern Newfoundland. Areas of low habitat suitability in North America are also predicted in the Canadian Rockies, Northern Idaho, Western Mon- tana and the Appalachian Mountains. Comparison of predicted distributions based on regional bins Predicted suitable habitat in North America varies among models fit to different geo- graphic bins of native occurrence records (Fig. 2). Models fit to occurrences in the Brit- ish Isles identified only a small region of suitable habitat in North America, in British Columbia along the North, South and West coasts of Vancouver Island, as well as in Naikoon Provincial Park on Graham Island and in Washington in the San Juan Islands, Fidalgo Island, Whidbey Island and along the northern coast of the Olympic Peninsula from Port Townsend to Neah Bay. Models fit to occurrences in Fennoscandia predicted the greatest amount of suitable habitat in North America, including the entire coast of British Columbia and the southern coast of Alaska from the Prince of Wales Island to the Alaska Peninsula in Western North America and in the East suitable habitat is found throughout Newfoundland and in spots along the southern and southwestern coast of Nova Scotia and on Cape Breton Island. The models fit to occurrences in Central/Southern Europe found moderate to low suitability along the western coast of British Columbia north to the Alaska Peninsula with a localized region of moderately high suitability in the vicinity of Vancouver in Western North America, low predicted suitability along the southeastern coast of Newfoundland, moderate to low suitability along the southern coast of Nova Scotia, as well as low suitability in the Appalachian
Winter moth environmental niche                                      9

Figure 2. Model predictions for each spatial bin in the winter moth native range. The column on the
left shows the winter moth training records (shown as black dots) used to make the predictions for suit-
able habitat in the native range and the column on the right shows the suitable habitat prediction for the
invaded range. The prediction is shown from blue (being less suitable) to red (being most suitable).

Mountains and along the New England coast with Cape Cod and Nantucket Island
displaying moderately suitable habitat. Models based on the different geographic bins
highlight varying degrees of suitable habitat in the vicinity of invaded regions of Van-
couver and Vancouver Island; however, the predictions of suitable habitat in Eastern
North America were generally not as congruous with the invaded areas with very little
overlap between models.
10                          Laura M. Blackburn et al. / NeoBiota 59: 1–20 (2020)

Table 2. Model results for each spatial bin. Percent contribution of environmental variables are in bold
for those variables that showed the highest model gain in isolation; values highlighted in gray represent the
most information not present in other variables, and * denotes balance threshold used for classified maps
which seeks to balance training omission, predicted area and threshold value cloglog threshold.

 Winter Moth      sample   threshold   AUC                   % Contribution of Environmental Variables
   Region           size    values*            BIO1   BIO2    BIO3 BIO4 BIO6 BIO7 BIO10 BIO11 BIO14
British Isles      381      0.1432     0.795    1.1    0.6     9.3    42.8     14.5     0.1    29.5     0.4  1.7
Fennoscandia       379      0.1132      0.75    5.1     6      5.6     0.7     16.4     0.3    47.1    18.7  0.1
Interior Europe    224      0.0806     0.816    1.4    0.6      7      2.4      1.1    33.7     6.2     2.1 45.6
Model Averages                                  2.5    2.4     7.3    15.3     10.7    11.4    27.6     7.1 15.8

Figure 3. Predicted suitable habitat in native range (panel A) and invaded range (panel B) with occur-
rence records (shown as black dots), this reclassified map is based on the averaged prediction for three
spatial bins in the native range. Probabilities falling below balance threshold values shown in Table 2 for
each of the three models were classified as “not suitable”. Probabilities < 0.25 were classified as “low suit-
ability”, values > 0.25 but < 0.5 were classified as “medium suitability” and values > 0.5 were considered
“high suitability”.

Analysis of environmental variables

Environmental variables contributed differently for each spatial bin (Table 2). Jack-
knife analyses indicated that the relative contribution of different environmental vari-
ables differed considerably among the three models. Temperature seasonality (BIO 4)
is the environmental variable that contributed the most to the model fit from occur-
rences from the British Isles. In the model fit to Central/Southern Europe occurrences,
precipitation during the driest month (BIO 14) contributed the most to this model.
Mean temperature of the warmest quarter (BIO 10) contributed most to the model fit
from Fennoscandia occurrences. When averaging model results for variable contribu-
tion across spatial bins, the environmental variables contributing the most influence in
the native range are BIO 10, 14, 4, 7 and 6.
     While there was considerable overlap in the distribution of climatic variables be-
tween the native and invaded ranges, ridgeline plots highlight the variation among
populations (Fig. 4). These plots highlight the similarities between the New England
Winter moth environmental niche 11
Figure 4. Distribution of bioclimatic variables among occurences within various geographic bins. Gray
shading represents winter moth records in the native range. Bioclimatic variables found to contribute the
most for each model area shown here, panel A shows BIO4 (temperature seasonality, standard deviation
*100), panel B shows BIO6 (minimum temperature of coldest month, °C), panel C shows BIO7 (tem-
perature annual range, °C), pancel D shows BIO10 (mean temperature of warmest quarter, °C), panel E
shows BIO 11 (mean temperature of coldest quarter, °C) and panel F shows BIO 14 (precipitation of
driest month, mm).
region and Eastern Canada, with New England showing more variability in BIO 6, 7,
10 and 11. When comparing Eastern Canada to the native regions, more climatic val-
ues overlap with the Fennoscandia region (BIO 4, 6, 7 and 11) but values of only two
variables (BIO 10 and 14) overlap with the Central/Southern Europe region. Values of
climatic variables from the New England region overlap with the distribution of val-
ues in both Fennoscandia and Central/Southern Europe. The Western Canada region
seems most similar to the British Isles across most climatic variables.
Finally, we used principal components analysis to compare the environmental niche
at occurrence sites for winter moth in each geographic region (Fig. 5). We analyzed the
same climatic variables used in the MaxEnt models (BIO 1–4, 6–7, 10–11 and 14). The
first axis generally corresponded to values of BIO3, BIO4, BIO6, BIO7, BIO11 and
BIO14 while the second axis was most strongly related to values of BIO10, but also cor-
responded to values of BIO1 and BIO2. The three native range regions and three invaded
regions were generally segregated in the space defined by these two axes. However, there
was considerable overlap in the distribution of Central/Southern Europe with western12 Laura M. Blackburn et al. / NeoBiota 59: 1–20 (2020)
Contribution of Climate Variables
British Isles Central/Southern Europe Western Canada
Location Fennoscandia Eastern Canada New England
0.04
PC2 (24.41%)
0.00 BIO 6
BIO 14 BIO 3
BIO 4 BIO 11
BIO 7
−0.04 BIO 1
BIO 2
BIO 10
−0.04 −0.02 0.00 0.02 0.04
PC1 (60.29%)
Figure 5. Plot of occurrences in each geographic region based on their values for the first two principal com-
ponent axes derived from values of the nine environmental variables used in the MaxEnt models (Table 1).
North America. There was also some overlap in the distribution of Fennoscandia and
Central/Southern Europe. Of all invaded regions, the climate in the New England occur-
rence locations were generally the most different from climates within the native range.
Discussion
As expected, each of the three models predicted suitable habitat in portions of Europe
from which occurrence data were located (Fig. 2). Averaging predictions across all
three models from the native range (Fig. 3A) produces a predicted European range very
similar to the range described in Kozhanchikov (1950) (Fig. 1), though the model fails
to predict suitable habitat in Ukraine and southeastern Russia. However, the lack of
predicted presence in these areas could have arisen simply from inadequate sampling
in that region. Winter moth was recently reported from Tunisia (Mannai et al. 2015),
and genetic analyses suggest this population is native to the region (Andersen et al.
2019b). Andersen et al. (2019b) also reported winter moth occurrence in southern
Spain and Italy. Because dates of these observations fall outside of the range of dates
that were used for the climate data (1970–2010), they were not used in our analysis,Winter moth environmental niche 13
though their inclusion could further change the predicted distribution of winter moth
to include additional Mediterranean locations. The species is also reported as an estab-
lished non-native species in Iceland (Halldórsson et al. 2019).
The average of predictions from the models based on the three native range re-
gions predicts suitable habitat in northwestern Washington, along the coast of Western
Canada and northward along the coast into Alaska (Fig. 3B). Though winter moth has
been established in part of this region (i.e. coastal British Columbia) for over 50 years it
has not spread into most of the predicted region. It is possible that populations in this
region are constrained from expanding into a climatically suitable region by a biotic fac-
tor, such as the introduced parasitoid Cyzenis albicans (Elkinton et al. 2015; Roland and
Embree 1995), other natural enemies (Broadley et al. 2019) though there are only a few
examples where natural enemies are known to constrain the range of an insect species
(e.g., Elkinton et al. 2006, Parry 2008). Another possibility is that hybridization with
the native congener, Bruce spanworm (Andersen et al. 2019a) alters the fitness of invad-
ing populations, thereby constraining their range. Predictions of the model appear to
align with invaded portions of Eastern North America more poorly. The model predicts
most of the invaded portions of Nova Scotia and New England as low suitability but
classifies all of Newfoundland and portions of Labrador, areas that have never been
invaded, as either low or medium suitability. However, it is possible that winter moth
has never had the opportunity to invade these regions since the Gulf of St. Lawrence
separates them from the currently invaded area. As stated earlier, this lack of agreement
in portions of the Eastern North America between the model and winter moth occur-
rence could also be due to hybridization with Bruce spanworm (Havill et al. 2017).
Predictions of suitable habitat based on climatic niche models fit to native occur-
rence records sometimes do not coincide well with actual invaded regions (Broen-
nimann et al. 2007; Jiménez-Valverde et al. 2011; Ørsted and Ørsted 2019; Roura-
Pascual et al. 2006; Steiner et al. 2008), and this may result from factors such as
species not being in equilibrium with the local climate, release from competitors and
predators, or sampling and dispersal limitations. Fitzpatrick et al. (2007) found similar
results of under-predicting the invasive potential of fire ants using native range occur-
rence records and over-predicting the southern boundary of the native range using
invaded range records, which they concluded was due to fire ants establishing in a
novel environment similar to their native environment and then expanding into novel
climatic environments not available in their native range.
It is not unusual for populations of various species to become locally adapted to
their climate and such local adaptation can result in variation in the potential alien
range of populations originating from different portions of the native range. In such
cases, models built with spatially partitioned occurrence records from the native range
may provide some indication of the geographic origins of invaded populations (Steiner
et al. 2008). However, without prior knowledge of the extent of local adaptation, such
reconstruction of the origins of invading populations may not be possible. In our
analysis, models based on records from all three native regions predict suitability in
the western Canada invaded range near Vancouver and Victoria (Fig. 2). Analysis of14 Laura M. Blackburn et al. / NeoBiota 59: 1–20 (2020)
climatic conditions (Fig. 5) indicates considerable overlap in climate between invaded
areas of Western Canada and all three native regions. Thus, our analysis does not show
any uniquely high similarity of the invaded portion of Western Canada with any sin-
gle region of Europe. Only two models fit to European regions (Fennoscandia and
the Central/Southern Europe) show suitable habitat in Nova Scotia. In the ridgeline
plots (Fig. 4) and the PCA plots (Fig. 5) the records from Eastern Canada fall closest
to those of Fennoscandia, suggesting this region as a possible origin for the Eastern
Canada population. The model fit to the Central/Southern Europe occurrence records
is the only model that predicts suitable habitat in New England, specifically near Cape
Cod. When plotting climatic conditions using PCA (Fig. 5), the New England records
appear to occupy a different niche mainly outside of the distribution of records from
all other regions, though perhaps most similar to the Central/Southern Europe native
region, supporting the hypothesis of that region being the origin of the invasion. How-
ever, we have no evidence of local adaptation to climate in the winter moth’s native
range, so such attribution is tentative.
Adaptation to local environments is often observed in species with large geo-
graphical ranges (Osborne and Suárez-Seoane 2002; Peterson and Vargas 1993). Dif-
ferences in predictions from models based on native range occurrence records are
apparent in AUC scores (Table 2), the variables of greatest contribution (Table 2)
and the averaged prediction (Fig. 3). Probabilities averaged across the three models
based on native range regions accurately predicted suitable North American habitat
in most of the invaded regions, but predicted particularly high habitat suitability in
invaded portions of the south coast of British Columbia (Fig. 3). However, it also
predicted large areas of medium to high habitat suitability in uninvaded regions
north of both the western and eastern invaded regions. It is suggested that distribu-
tion models may be useful in predicting regions where species are likely to invade,
but may be flawed in predicting subsequent spread in novel regions (Fitzpatrick et
al. 2007; Loo et al. 2007). Given that many of the large areas of predicted suitable
habitat are adjacent to currently invaded areas but remain uninvaded, we suspect
that there may be unknown biotic or abiotic factors (other than the climatic variables
considered here) that limit North American populations into these northern unin-
vaded areas. However, the identity of such biotic factors remains unknown and we
encourage further research into the biotic variables that may be limiting the spread
of winter moth in its invaded regions.
Conclusions
We focused our study on a generalist herbivore, the winter moth, to predict areas in
North America where this species is likely to invade. We applied MaxEnt, the most
widely used species distribution and niche modelling algorithm, to predict the poten-
tial range of suitable habitat for winter moth. Preliminary model runs fit to large re-Winter moth environmental niche 15
gions of winter moth occurrence highlighted a high sampling bias in the United King-
dom. We implemented a simple method of applying spatial filters based on geography
to reduce sampling bias. Environmental variables were selected based on expectations
of climatic factors likely to be important to the biology of this species. We chose to use
environmental variables at a coarse grain (25 km) due to the widespread nature of this
species and multi-continental areas of interest.
Differentiating the geographic origins for each of the North American winter
moth ranges based on predictions from the various native geographic bins is possible,
assuming local adaptation to climate in native populations. Based upon climatic simi-
larity, central Europe appears to be the most likely origin of non-native populations in
New England. Climatic similarity of the invaded range in Eastern Canada with Fen-
noscandia and Central Europe suggests those regions as likely origins. However, the
Western Canada invaded range appeared equally similar to all native regions and thus
there was no evidence regarding possible origins. All of these conclusions regarding
origin remain speculative and would require confirmation based on genetic similari-
ties. Combining molecular marker studies in ecological niche modelling approaches
can help advance this field (Scoble and Lowe 2010) and improve future predictions of
species distribution trajectories. Furthermore, evidence of hybridization with the na-
tive Bruce spanworm has been shown in New England, Oregon, British Columbia and
Nova Scotia (Andersen et al. 2019a; Elkinton et al. 2010; Havill et al. 2017). If alleles
from Bruce spanworm can introgress into winter moth, then this hybridization may
increase winter moth’s ability to adapt to a novel environment, leading to a shift in the
species’ fundamental niche (Holt and Gaines 1992).
Predicting the potential North American distribution of this invasive species can
aid managers in proactively selecting survey locations for this destructive moth. Areas
outside the current species’ distribution, which are highly suitable for winter moth,
may be prioritized for biosecurity measures to help prevent establishment of this spe-
cies. However, it remains to be confirmed whether winter moth could establish in the
vast regions predicted to be suitable north of currently invaded areas. Given that winter
moth is not currently expanding its range into these areas, many of which are adjacent
to currently invaded regions, there may be unknown biotic factors that limit the range
of this species in ways that are not currently understood.
Acknowledgements
This research was funded by the USDA Forest Service. LB acknowledges support from
University of Tennessee National Institute for Mathematical and Biological Synthe-
sis (NIMBioS) at a tutorial session “Applications of Spatial Data: Ecological Niche
Modeling”. AML was supported by grant EVA4.0, No. CZ.02.1.01/0.0/0.0/16_019
/0000803 financed by OP RDE. Funding to JSE was from USDA-APHIS grant Nos
AP17PPQS&T00C068. AP19PPQFO000C12516 Laura M. Blackburn et al. / NeoBiota 59: 1–20 (2020)
References
Aiello‐Lammens ME, Boria RA, Radosavljevic A, Vilela B, Anderson RP (2015) spThin: an R
package for spatial thinning of species occurrence records for use in ecological niche mod-
els. Ecography 38: 541–545. https://doi.org/10.1111/ecog.01132
Andersen JC, Havill NP, Broadley HJ, Boettner GH, Caccone A, Elkinton JS (2019a) Wide-
spread hybridization among native and invasive species of Operophtera moths (Lepidop-
tera: Geometridae) in Europe and North America. Biological Invasions 21: 3383–3394.
https://doi.org/10.1007/s10530-019-02054-1
Andersen JC, Havill NP, Caccone A, Elkinton JS (2017) Postglacial recolonization shaped the
genetic diversity of the winter moth (Operophtera brumata) in Europe. Ecology and evolu-
tion 7: 3312–3323. https://doi.org/10.1002/ece3.2860
Andersen JC, Havill NP, Mannai Y, Ezzine O, Dhahri S, Ben Jamâa ML, Caccone A, Elkin-
ton JS (2019b) Identification of winter moth (Operophtera brumata) refugia in North Af-
rica and the Italian Peninsula during the last glacial maximum. Ecology and evolution 9:
13931–13941. https://doi.org/10.1002/ece3.5830
Anderson RP (2012) Harnessing the world’s biodiversity data: promise and peril in ecological
niche modeling of species distributions. Annals of the New York Academy of Sciences
1260: 66–80 https://doi.org/10.1111/j.1749-6632.2011.06440.x
Barve N, Barve V, Jiménez-Valverde A, Lira-Noriega A, Maher SP, Peterson AT, Soberón J,
Villalobos F (2011) The crucial role of the accessible area in ecological niche modeling
and species distribution modeling. Ecological Modelling 222: 1810–1819. https://doi.
org/10.1016/j.ecolmodel.2011.02.011
Battisti A, Larsson S (2015) Climate change and insect pest distribution range. In: Bjorkman
C, Niemela P (Eds) Climate Change and Insect Pests. CABI, Wallingford, 1–15. https://
doi.org/10.1079/9781780643786.0001
Boria RA, Olson LE, Goodman SM, Anderson RP (2014) Spatial filtering to reduce sampling
bias can improve the performance of ecological niche models. Ecological Modelling 275:
73–77. https://doi.org/10.1016/j.ecolmodel.2013.12.012
Broadley HJ, Kula RR, Boettner GH, Andersen JC, Griffin BP, Elkinton JS (2019) Recruitment of
native parasitic wasps to populations of the invasive winter moth in the northeastern United
States. Biological Invasions 21: 2871–2890. https://doi.org/10.1007/s10530-019-02019-4
Broennimann O, Treier UA, Müller‐Schärer H, Thuiller W, Peterson A, Guisan A (2007) Ev-
idence of climatic niche shift during biological invasion. Ecology letters 10: 701–709.
https://doi.org/10.1111/j.1461-0248.2007.01060.x
Connor T, Hull V, Viña A, Shortridge A, Tang Y, Zhang J, Wang F, Liu J (2018) Effects of
grain size and niche breadth on species distribution modeling. Ecography 41: 1270–1282.
https://doi.org/10.1111/ecog.03416
Edland T (1971) Wind dispersal of the winter moth larvae Operophtera brumata L.(Lep., Ge-
ometridae) and its relevance to control measures. Nor Entomol Tidsskr 18: 103–107.
Elith J, Phillips SJ, Hastie T, Dudík M, Chee YE, Yates CJ (2011) A statistical explanation of
MaxEnt for ecologists. Diversity and Distributions 17: 43–57. https://doi.org/10.1111/
j.1472-4642.2010.00725.xWinter moth environmental niche 17
Elkinton JS, Parry D, Boettner GH (2006) Implicating an introduced generalist parasitoid
in the invasive browntail moth’s enigmatic demise. Ecology 87: 2664–2672. https://doi.
org/10.1890/0012-9658(2006)87[2664:IAIGPI]2.0.CO;2
Elkinton J, Boettner G, Liebhold A, Gwiazdowski R (2015) Biology, spread, and biological
control of winter moth in the eastern United States. FHTET-2014-07 Morgantown, WV:
US Department of Agriculture, Forest Service, Forest Health Technology Team 22 p, 1–22.
Elkinton JS, Boettner GH, Sremac M, Gwiazdowski R, Hunkins RR, Callahan J, Scheufele SB,
Donahue CP, Porter AH, Khrimian A (2010) Survey for winter moth (Lepidoptera: Ge-
ometridae) in northeastern North America with pheromone-baited traps and hybridization
with the native Bruce spanworm (Lepidoptera: Geometridae). Annals of the Entomologi-
cal Society of America 103: 135–145. https://doi.org/10.1603/AN09118
ESRI (2017) ArcGIS Desktop 10.5.1. Redlands, CA.
Fick SE, Hijmans RJ (2017) Worldclim 2: New 1-km spatial resolution climate surfaces for
global land areas. International Journal of Climatology 37: 4302–4315. https://doi.
org/10.1002/joc.5086
Fielding AH, Bell JF (1997) A review of methods for the assessment of prediction errors in
conservation presence/absence models. Environmental conservation 24: 38–49. https://
doi.org/10.1017/S0376892997000088
Fitzpatrick MC, Weltzin JF, Sanders NJ, Dunn RR (2007) The biogeography of prediction er-
ror: why does the introduced range of the fire ant over‐predict its native range? Global Ecol-
ogy and biogeography 16: 24–33. https://doi.org/10.1111/j.1466-8238.2006.00258.x
Fourcade Y, Engler JO, Rödder D, Secondi J (2014) Mapping species distributions with MAX-
ENT using a geographically biased sample of presence data: a performance assessment
of methods for correcting sampling bias. PLoS One 9: e97122. https://doi.org/10.1371/
journal.pone.0097122
GBIF.org (2018) GBIF Home Page. Checklist dataset. https://www.gbif.org [29 November
2018]
Gillespie D, Finlayson T, Tonks N, Ross D (1978) Occurrence of the winter moth, Operoph-
tera brumata (Lepidoptera: Geometridae), on southern Vancouver Island, British Colum-
bia. Canadian Entomologist. https://doi.org/10.4039/Ent110223-2
Guisan A, Zimmermann NE (2000) Predictive habitat distribution models in ecology. Ecologi-
cal Modelling 135: 147–186. https://doi.org/10.1016/S0304-3800(00)00354-9
Gwiazdowski RA, Elkinton JS, Dewaard JR, Sremac M (2013) Phylogeographic diversity of
the winter moths Operophtera brumata and O. bruceata (Lepidoptera: Geometridae) in Eu-
rope and North America. Annals of the Entomological Society of America 106: 143–151.
https://doi.org/10.1603/AN12033
Halldórsson G, Hrafnkelsdóttir B, Oddsdóttir ES (2019) Invasive forest pests in Iceland. Ab-
stracts of NordGen Forest Conference 2019, 13–15.
Havill N, Elkinton J, Andersen J, Hagen S, Broadley HJ, Boettner G, Caccone A (2017) Asym-
metric hybridization between non-native winter moth, Operophtera brumata (Lepidoptera:
Geometridae), and native Bruce spanworm, Operophtera bruceata, in the Northeastern
United States, assessed with novel microsatellites and SNPs. Bulletin of Entomological
Research 107: 241–250. https://doi.org/10.1017/S000748531600085718 Laura M. Blackburn et al. / NeoBiota 59: 1–20 (2020)
Hawboldt L, Cuming F (1950) Cankerworms and European Winter Moth in Nova Sco-
tia. Bi-monthly Progress Report Forest Insect Investigations Department of Agriculture
Canada 6: 1–2.
Hayes KR (2003) Biosecurity and the role of risk assessment. In: Carlton J (Ed.) Invasive spe-
cies: vectors and management strategies. Island Press, Washington, DC, 382–414.
Hijmans RJ (2012) Cross‐validation of species distribution models: removing spatial sorting
bias and calibration with a null model. Ecology 93: 679–688. https://doi.org/10.1890/11-
0826.1
Hijmans RJ, Phillips S, Leathwick J, Elith J (2017) dismo: Species Distribution Modeling. R
package version 1.1–4. https://CRAN.R-project.org/package=dismo
Holt RD, Gaines MS (1992) Analysis of adaptation in heterogeneous landscapes: implications
for the evolution of fundamental niches. Evolutionary Ecology 6: 433–447. https://doi.
org/10.1007/BF02270702
Hulme PE (2009) Trade, transport and trouble: managing invasive species pathways in an era
of globalization. Journal of Applied Ecology 46: 10–18. https://doi.org/10.1111/j.1365-
2664.2008.01600.x
Huntley B, Berry PM, Cramer W, McDonald AP (1995) Special paper: modelling present and
potential future ranges of some European higher plants using climate response surfaces.
Journal of biogeography: 967–1001. https://doi.org/10.2307/2845830
Jepsen JU, Hagen SB, Ims RA, Yoccoz NG (2008) Climate change and outbreaks of the geom-
etrids Operophtera brumata and Epirrita autumnata in subarctic birch forest: evidence of
a recent outbreak range expansion. Journal of Animal Ecology 77: 257–264. https://doi.
org/10.1111/j.1365-2656.2007.01339.x
Jiménez-Valverde A, Peterson AT, Soberón J, Overton J, Aragón P, Lobo JM (2011) Use of
niche models in invasive species risk assessments. Biological Invasions 13: 2785–2797.
https://doi.org/10.1007/s10530-011-9963-4
Jiménez‐Valverde A, Lobo JM, Hortal J (2008) Not as good as they seem: the importance
of concepts in species distribution modelling. Diversity and Distributions 14: 885–890.
https://doi.org/10.1111/j.1472-4642.2008.00496.x
Kerslake J, Kruuk L, Hartley S, Woodin S (1996) Winter moth (Operophtera brumata (Lepi-
doptera: Geometridae)) outbreaks on Scottish heather moorlands: effects of host plant and
parasitoids on larval survival and development. Bulletin of Entomological Research 86:
155–164. https://doi.org/10.1017/S0007485300052391
Kimberling DN, Miller JC (1988) Effects of temperature on larval eclosion of the winter moth,
Operophtera brumata. Entomologia Experimentalis et Applicata 47: 249–254. https://doi.
org/10.1111/j.1570-7458.1988.tb01143.x
Kozhanchikov IV (1950) Life cycle development and geographical distribution of frost span-
worm, Operophtera brumata (L.), Leopid. Geometridae). Entomologuicheskoye Obozreni-
ye (Entomological Review) 31: 178–197.
Kramer‐Schadt S, Niedballa J, Pilgrim JD, Schröder B, Lindenborn J, Reinfelder V, Stillfried
M, Heckmann I, Scharf AK, Augeri DM (2013) The importance of correcting for sampling
bias in MaxEnt species distribution models. Diversity and Distributions 19: 1366–1379.
https://doi.org/10.1111/ddi.12096Winter moth environmental niche 19
Loo SE, Nally RM, Lake PS (2007) Forecasting New Zealand mudsnail invasion range: mod-
el comparisons using native and invaded ranges. Ecological applications 17: 181–189.
https://doi.org/10.1890/1051-0761(2007)017[0181:FNZMIR]2.0.CO;2
Luoto M, Pöyry J, Heikkinen R, Saarinen K (2005) Uncertainty of bioclimate envelope models
based on the geographical distribution of species. Global Ecology and biogeography 14:
575–584. https://doi.org/10.1111/j.1466-822X.2005.00186.x
Mannai Y, Ezzine O, Nouira S, Ben J (2015) First report of the winter moth Operophtera bru-
mata on Quercus canariensis and Q. afares in North West of Tunisia. Tunisian Journal of
Plant Protection 10: 69–73.
Marmion M, Luoto M, Heikkinen RK, Thuiller W (2009) The performance of state-of-the-art
modelling techniques depends on geographical distribution of species. Ecological Model-
ling 220: 3512–3520. https://doi.org/10.1016/j.ecolmodel.2008.10.019
Ørsted IV, Ørsted M (2019) Species distribution models of the Spotted Wing Drosophila (Dros-
ophila suzukii, Diptera: Drosophilidae) in its native and invasive range reveal an ecologi-
cal niche shift. Journal of Applied Ecology 56: 423–435. https://doi.org/10.1111/1365-
2664.13285
Osborne PE, Suárez-Seoane S (2002) Should data be partitioned spatially before building large-
scale distribution models? Ecological Modelling 157: 249–259. https://doi.org/10.1016/
S0304-3800(02)00198-9
Panetta F, Mitchell N (1991) Homoclime analysis and the prediction of weediness. Weed Re-
search 31: 273–284. https://doi.org/10.1111/j.1365-3180.1991.tb01767.x
Parry D (2008) Beyond Pandora’s box: quantitatively evaluating nontarget effects of parasitoids
in classical biological control. Biological Invasions 11: 47–58. https://doi.org/10.1007/
s10530-008-9319-x
Pearson RG, Raxworthy CJ, Nakamura M, Townsend Peterson A (2007) Predicting species
distributions from small numbers of occurrence records: a test case using cryptic geckos
in Madagascar. Journal of biogeography 34: 102–117. https://doi.org/10.1111/j.1365-
2699.2006.01594.x
Peterson AT, Vargas N (1993) Ecological diversity in scrub jays, Aphelocoma coerulescens. In:
Ramamoorthy TP, Bye R, Lot A, Fa J (Eds) Biological diversity of Mexico: origins and
distribution. Oxford University Press, New York, 309–317.
Phillips SJ, Anderson RP, Dudík M, Schapire RE, Blair ME (2017) Opening the black box:
an open‐source release of Maxent. Ecography 40: 887–893. https://doi.org/10.1111/
ecog.03049
Phillips SJ, Anderson RP, Schapire RE (2006) Maximum entropy modeling of species geo-
graphic distributions. Ecological Modelling 190: 231–259. https://doi.org/10.1016/j.ecol-
model.2005.03.026
Phillips SJ, Dudík M, Elith J, Graham CH, Lehmann A, Leathwick J, Ferrier S (2009) Sample
selection bias and presence‐only distribution models: implications for background and pseu-
do‐absence data. Ecological applications 19: 181–197. https://doi.org/10.1890/07-2153.1
Radosavljevic A, Anderson RP (2014) Making better Maxent models of species distributions:
complexity, overfitting and evaluation. Journal of biogeography 41: 629–643. https://doi.
org/10.1111/jbi.1222720 Laura M. Blackburn et al. / NeoBiota 59: 1–20 (2020)
Roland J, Embree DG (1995) Biological control of the winter moth. Annual review of ento-
mology 40: 475–492. https://doi.org/10.1146/annurev.en.40.010195.002355
Roura-Pascual N, Suarez AV, McNyset K, Gómez C, Pons P, Touyama Y, Wild AL, Gascon
F, Peterson AT (2006) Niche differentiation and fine‐scale projections for argentine ants
based on remotely sensed data. Ecological applications 16: 1832–1841. https://doi.
org/10.1890/1051-0761(2006)016[1832:NDAFPF]2.0.CO;2
Scoble J, Lowe AJ (2010) A case for incorporating phylogeography and landscape genetics into
species distribution modelling approaches to improve climate adaptation and conserva-
tion planning. Diversity and Distributions 16: 343–353. https://doi.org/10.1111/j.1472-
4642.2010.00658.x
Segurado P, Araujo MB (2004) An evaluation of methods for modelling species distri-
butions. Journal of biogeography 31: 1555–1568. https://doi.org/10.1111/j.1365-
2699.2004.01076.x
Steiner FM, Schlick‐Steiner BC, VanDerWal J, Reuther KD, Christian E, Stauffer C, Suarez
AV, Williams SE, Crozier RH (2008) Combined modelling of distribution and niche in
invasion biology: a case study of two invasive Tetramorium ant species. Diversity and Dis-
tributions 14: 538–545. https://doi.org/10.1111/j.1472-4642.2008.00472.x
Stoakley J (1985) Outbreaks of Winter moth, Operophthera brumata L. (Lep., Geometridae)
in young plantations of Sitka spruce in Scotland 1: Insecticidal control and population as-
sessment using the sex attractant pheromone. Zeitschrift für angewandte Entomologie 99:
153–160. https://doi.org/10.1111/j.1439-0418.1985.tb01973.x
Tenow O, Nilssen AC, Bylund H, Pettersson R, Battisti A, Bohn U, Caroulle F, Ciornei C,
Csóka G, Delb H (2013) Geometrid outbreak waves travel across Europe. Journal of Ani-
mal Ecology 82: 84–95. https://doi.org/10.1111/j.1365-2656.2012.02023.x
Varela S, Anderson RP, García‐Valdés R, Fernández‐González F (2014) Environmental filters
reduce the effects of sampling bias and improve predictions of ecological niche models.
Ecography 37: 1084–1091. https://doi.org/10.1111/j.1600-0587.2013.00441.x
Veloz SD (2009) Spatially autocorrelated sampling falsely inflates measures of accuracy for
presence‐only niche models. Journal of biogeography 36: 2290–2299. https://doi.
org/10.1111/j.1365-2699.2009.02174.x
Venette RC, Kriticos DJ, Magarey RD, Koch FH, Baker RH, Worner SP, Gómez Rabo-
teaux NN, McKenney DW, Dobesberger EJ, Yemshanov D (2010) Pest risk maps for
invasive alien species: a roadmap for improvement. BioScience 60: 349–362. https://doi.
org/10.1525/bio.2010.60.5.5
Watt A, McFarlane A (1991) Winter moth on Sitka spruce: synchrony of egg hatch and bud-
burst, and its effect on larval survival. Ecological Entomology 16: 387–390. https://doi.
org/10.1111/j.1365-2311.1991.tb00231.x
Wint W (1983) The role of alternative host-plant species in the life of a polyphagous moth, Op-
erophtera brumata (Lepidoptera: Geometridae). The Journal of Animal Ecology: 439–450.
https://doi.org/10.2307/4564
Yates CJ, McNeill A, Elith J, Midgley GF (2010) Assessing the impacts of climate change and
land transformation on Banksia in the South West Australian Floristic Region. Diversity
and Distributions 16: 187–201. https://doi.org/10.1111/j.1472-4642.2009.00623.xYou can also read