Physiology and biogeography: The response of European mussels (Mytilus spp.) to climate change
←
→
Page content transcription
If your browser does not render page correctly, please read the page content below
Amer. Malac. Bull. 33(1): 136–149 (2015)                                                                  http://www.bioone.org/toc/malb/33/1

Physiology and biogeography: The response of European mussels (Mytilus spp.) to
climate change*

Elizabeth K. Fly1,2, Thomas J. Hilbish3, David S. Wethey3, and Rhiannon L. Rognstad3,4

1
 South Carolina Sea Grant Consortium, Charleston, South Carolina, 29401, U.S.A.
2
Carolinas Integrated Sciences and Assessments, Department of Geography, University of South Carolina, Columbia, South Carolina 29208,
U.S.A.
3
 Department of Biological Sciences, University of South Carolina, Columbia, South Carolina 29208, U.S.A.
4
 Present address: Keck Science Department, Claremont McKenna College, Claremont, California, 91711, U.S.A.
Correspondence, Elizabeth Fly: lizkfly@gmail.com

Abstract: To understand how ecological communities may respond to climate change we have adopted the approach of determining the
response of major ecosystem engineers that determine community composition and function. We utilize two approaches, correlative and
mechanistic, to understand the current and future distributions of the marine mussels Mytilus edulis Linnaeus, 1758 and M. galloprovincialis
Lamarck, 1819 in Europe. Both are dominant space-occupying species that control biodiversity in many coastal ecosystems and are the basis
of the largest aquaculture production in Europe. A mechanistic analysis of physiological energetic response to temperature of the two species
indicates that M. edulis cannot sustain a positive energy balance for sustained periods when sea surface temperature (SST) is greater than 23 °C,
while M. galloprovincialis can maintain a positive energy balance at SST up to 30 °C. There is no difference in energetic response of the two
species at cold temperatures (5–10 °C). The upper temperature threshold of positive energy balance in each species corresponds closely to the
distribution of SST at their respective southern range limits in Europe. Alternatively, the northern range limit of M. galloprovincialis coincides
with areas where winter SST is less than 9 °C, but there is no evidence of an energetic limit to this species at the cold end of its geographic
range. Presently there is no mechanistic explanation for the difference between species in their northern range limits; however, as indicated by
Random Forest modeling, M. galloprovincialis appears to be limited by cold temperatures during winter, suggesting the hypothesis of failure
in reproductive development. These approaches allow for the ability to forecast changes in the distributions of these two species in Europe as
SST continues to increase.

Key words: Species distribution modeling, Random Forest, blue mussel, ecological forecasting

      It is now well established that organisms are responding              what specific environmental variables may be important for
to the unprecedented rate of climate warming, including                     the distribution of that species (Robertson et al. 2003, Elith
changes in the timing of biological activities (Philippart et al.           and Leathwick 2009). Mechanistic SDMs create predictions
2003, Edwards and Richardson 2004, Burrows et al. 2011)                     based on knowledge of underlying physiological and/or life
and biogeography (Burrows et al. 2011, Hilbish et al. 2012,                 history responses to environmental variables (Robertson
Jones et al. 2012). To understand current and potential distri-             et al. 2003, Kearney and Porter 2009, Buckley et al. 2010,
butions of species, many biologists rely on species distribu-               Woodin et al. 2013). Mechanistic SDMs are more time-
tion models (SDMs) that use spatial environmental data                      consuming to develop, since the important physiological
relevant to a species to predict its distribution (Guisan and               mechanisms that potentially regulate the species distribution
Thuiller 2005, Elith and Leathwick 2009, Peterson et al. 2011).             must first be determined (Kearney and Porter 2009), but may
There are two types of SDMs: correlative and mechanistic,                   provide greater insight into the factors limiting a species’ dis-
though the two are not mutually exclusive. Correlative SDMs                 tribution than a purely correlative model.
create predictions based on correlations between species dis-                    The current challenge is to move beyond modeling
tribution records and environmental variables (Robertson                    changes in the range limits of single species to develop an
et al. 2003, Buckley et al. 2010). These types of models can be             understanding of the biological mechanisms responsible for
generated fairly quickly and can often, particularly for a spe-             these changes and, importantly, the responses of communi-
cies for which little is known, provide more information on                 ties and the functions of ecosystems. We have taken the

*Symposium on “Climate Change and Molluscan Ecophysiology” at the 79th Annual Meeting of the American Malacological Society, 2013
 World Congress of Malacology, July 23, 2013 Azores.
                                                                      136
RESPONSE OF EUROPEAN MUSSELS TO CLIMATE CHANGE 137
approach of focusing on the response of key ecosystem engi- (2012), who sampled 97 locations along the Atlantic coast of
neers that both control the composition and diversity of eco- Spain and France. However, we developed an even more
logical communities and are primary determinants of the extensive range database by collating data from several stud-
“function” of ecosystems with respect to the goods and ser- ies (Lionetto et al. 2003, Gosling et al. 2008, Pisanelli et al.
vices provided to human societies, using both correlative and 2009, Banni et al. 2011, Kijewski et al. 2011, Hilbish et al.
mechanistic methods. Mechanistic SDMs have been sug- 2012, Wethey unpubl. data, Appendix A) as well as sampling
gested as a more responsive model to climate change and in certain regions that were missing recent data (particularly
invasive species scenarios (Kearney and Porter 2009) as they the United Kingdom). Although these species do hybridize,
are better able to extrapolate to novel environmental condi- for the purposes of this study we focused on “pure” species
tions due to an understanding of the causative mechanisms populations (populations that contained 95% allele fre-
behind species distributions (Helmuth et al. 2005, Kearney quency of one species) because the physiological studies of
and Porter 2009, Woodin et al. 2013). However, these two Fly and Hilbish (2013), described below, focused on “pure”
types of approaches are not mutually exclusive and we show species rather than hybrids. In 2008 and 2009, we sampled
that incorporating both may provide a more robust model of mussel populations at 43 sites in England, Scotland, and
a species’ complete biogeographic range (Lawler et al. 2006, Wales that were originally sampled in 1976 and 1977 by
Elith and Leathwick 2009, Sará et al. 2011). Skibinski et al. (1983). To gain higher spatial resolution of the
In this study our focal system is marine mussels in the hybrid zone in southwest England, we sampled an additional
genus Mytilus across Linnaeus, 1758 a European scale. We 24 sites in 2010 that were previously sampled in 1996 by
selected mussels because they are major determinants of Hilbish et al. (2002). DNA extraction and genotyping at the
space and, therefore, biodiversity within rocky intertidal Glu-5′ locus followed the protocols in Hilbish et al. (2012).
marine communities (Suchanek 1992). Also, mussels are
farmed commercially, and mussel aquaculture is a multi- Modeling
billion dollar industry (FAO 2012). Mytilus edulis Linnaeus, We used two separate, yet complementary, modeling
1758 and M. galloprovincialis Lamarck, 1819 are sister spe- approaches to identify key variables determining the range
cies that inhabit the coastal waters of Europe. Mytilus edulis limits of Mytilus edulis and M. galloprovincialis. The correla-
is a cold-temperate species, inhabiting northern European tive approach was used primarily to classify known sites of
waters to the French/Spanish border in the Bay of Biscay “pure” populations of one of the two species, and then iden-
(Hilbish et al. 2012). Mytilus galloprovincialis is native to the tify temperature variables that could be used to differentiate
Mediterranean and is found as far north as the British Isles between M. edulis sites and M. galloprovincialis sites. The
(Skibinski et al. 1983, McDonald et al. 1991, Seed 1992). The mechanistic approach used laboratory estimates of scope for
overlap of these species has created a mosaic hybrid zone, growth of the two species to compare regions where scope for
with alternating patches of hybrids and pure parental popula- growth is estimated to be zero with the geographic limits of
tions from the Bay of Biscay to northern Scotland (Skibinski the two species.
et al. 1983, Coustau et al. 1991, Bierne et al. 2003, Gosling
et al. 2008, Hilbish et al. 2012). We sought to understand what Correlative approach
controls the biogeographic distributions of these economi- To estimate the importance of sea surface temperature
cally and ecologically important species in Europe, and how (SST) on the distribution of Mytilus spp. in Europe, we ana-
their functional performance differs within their ranges. This lyzed the distribution of “pure” Mytilus populations using
work provides a basis for forecasting future changes in the Random Forest (RF) modeling, which is becoming increas-
distribution of these species as the climate continues to ingly popular in ecological studies (Cutler et al. 2007). This
change. machine learning model generates a summary of many clas-
sification trees to determine the best predictor variables for a
dataset (Breiman 2001). To build the model, we classified
MATERIALS AND METHODS sites from both our field studies and the literature (see
Appendix A) as either M. galloprovincialis or M. edulis based
European Mytilus distributions on allele frequency with a 95% threshold; sites with 95% of
Mytilus spp. have been well studied for many decades in alleles for a particular species were classified as a population
Europe (Skibinski et al. 1983, Coustau et al. 1991, Gardner of that species. We used the temperature parameters of yearly
and Skibinski 1991, Rawson and Hilbish 1998, Daguin et al. mean SST, monthly mean SST (for each month), and sea-
2001, Bierne et al. 2003), and their distribution in the past sonal mean SST, as in Hilbish et al. (2012). These parameters
decade in various regions has been documented quite thor- were calculated using National Oceanic and Atmospheric
oughly. Much of this distribution was reported in Hilbish et al. Administration (NOAA) Optimum Interpolation ¼ Degree138 AMERICAN MALACOLOGICAL BULLETIN · ·
33 1 2015
Daily SST (OISST) data derived from Advanced Very High very high gene flow, with dispersal distances of up to 100 km
Resolution Radiometer (AVHRR) satellite sensors (Reynolds (Gilg and Hilbish 2003). The data presented below suggest
et al. 2007), acquired from the National Climatic Data Center that there is not local adaptation occurring in genes relevant
archive at http://www.ncdc.noaa.gov/thredds/catalog/oisst/ to setting Mytilus range limits, since the physiological ener-
NetCDF/AVHRR/catalog.html. The SST value for each sam- getics measured using animals from one population appear
ple site was estimated by finding the pixel on each SST grid to well explain the southern range edge of both M. edulis and
nearest to the sampling location. We determined SST means M. galloprovincialis. If there were local adaptation occurring,
listed above for each population for the five years prior to we would expect to see these data fail to explain distribution
each mussel sample date. This time period of five years was limits.
chosen to encompass on average the life span of the mussels
(Hilbish et al. 2012). Ecological forecasting
The RF model was built using the randomForest package Forecasts of future environmental conditions were made
(Liaw and Wiener 2002) in R version 2.7.1 (R Development using model output from the EURO-CORDEX project (Jacob
Core Team 2010) with 250,000 individual trees, in which et al. 2014). This project uses regional circulation models
one-third of the cases were left out of each tree to be used as (RCM) to downscale global circulation models (GCM) in
an estimate of classification error as the trees were added to order to predict monthly average SST on a 44 km grid. We
the forest. Classification error is the frequency of test cases chose to use the 4.5 Wm-2 (rcp4.5) global energy imbalance
(those not included in model generation) incorrectly classi- scenario of the IPCC 5th Assessment Report, which simulates
fied by the final model and was used to evaluate the ability of moderate future warming and is similar to the IPCC 4th
the model to differentiate between M. galloprovincialis and Assessment Report scenario A1B. To date, 8 GCMs have been
M. edulis sites. The relative importance of each temperature downscaled with one RCM (Appendix B), and the results
variable was determined for the RF model to identify which have been posted on the Earth System Grid (http://esgf-data.
variables were most useful for classifying the sites, thus, iden- dkrz.de/esgf-web-fe/). EURO-CORDEX 44-km data were on
tifying temperature differences between the ranges of the two a curvilinear grid, so they were interpolated to a 25 km
species. The importance of the predictor temperature vari- Mercator grid, using the R package “akima” (Akima et al.
ables was determined using the mean decrease in accuracy 2013). Since there is disagreement among the models in terms
calculated during the RF analysis. This metric is calculated by of the spatial distribution of sea surface temperatures, we
identifying the decrease in the accuracy of the model when made maps of the fraction of models that predicted SST of at
the values of a single predictor variable are randomly per- least 20 ºC in summer (August) and at least 9 ºC in winter
muted. Thus, variables with the larger mean decrease in accu- (February). The temperature of 20 ºC in summer is a proxy
racy are more important for data classification. for the southern geographic limit of M. edulis (Fly and Hilbish
2013) and the temperature of 9 ºC is a proxy for the northern
Mechanistic approach geographic limit of M. galloprovincialis (Hilbish et al. 2012),
The physiological energetics of Mytilus edulis and M. gal- as indicated by the mechanistic and correlative models. We
loprovincialis were measured by Fly and Hilbish (2013). They used the median of the model predictions as our estimate of
integrated measurements of filtration rate, absorption effi- the expected geographic distribution of the Mytilus species
ciency, and metabolic rate to derive an estimate of the scope over the periods 2046–2050 and 2096–2100. For comparison
for growth (SFG) (sensu Widdows and Bayne 1971 the SFG to the present, we used the daily NOAA OISST product
measures the energy above maintenance available for growth (Reynolds et al. 2007) to make maps of monthly average SST
and reproduction) of mussels at water temperatures ranging over the period 2002–2009. We then determined for each
from 5 °C to 30 °C. We used their estimate of the critical SST pixel in the map, the fraction of years (2002–2009) with tem-
at which SFG = 0 to determine the geographic regions in peratures higher than 9 ºC in winter and 20 ºC in summer.
Europe in which each species can potentially maintain a per-
manent population. In regions that exceed the critical SST at
which SFG = 0, populations of each species are expected to be RESULTS
absent or ephemeral (Sokolova et al. 2012, Woodin et al.
2013). We compared the distribution of M. edulis and M. gal- The distribution of Mytilus spp. in Europe ranges from
loprovincialis to the monthly SST along the European coast- northern Africa, through the Mediterranean, along the
line and to the critical temperature at which SFG = 0 (Fly and Atlantic coastline into Scandinavia and on the British Isles
Hilbish 2013). SFG data were collected from one population (Fig. 1). Contiguous populations of M. galloprovincialis
of each species (Fly and Hilbish 2013). While local adaptation extend from the Mediterranean north to the border between
may be possible, Mytilus populations have the potential for Spain and France in the Bay of Biscay (Fig. 1). Two disjunctRESPONSE OF EUROPEAN MUSSELS TO CLIMATE CHANGE 139
the distribution of this species in
northern Africa is not well-documented,
so populations likely experience even
warmer temperatures.
The Random Forest classification
model, a correlative model, performed
well, correctly classifying the out of bag
samples (30% of data excluded when
building the model) 97.14% of the
time. Relative importance evaluation
identified winter and spring variables
(mean winter temperature, mean spring
temperature, mean January temperature,
mean March temperature, and mean
April temperature) as the most impor-
tant variables (ranked by mean decrease
in model accuracy) for correctly classi-
fying a site as Mytilus edulis or M. gal-
loprovincialis. These results align nicely
with a smaller-scale RF model based
Figure 1. Sample locations used for biogeographic modeling of Mytilus spp. in Europe. These on M. galloprovincialis distribution in
data were collated from several published studies (see Appendix A) as well as additional France and Spain, and explain histori-
sampling in certain regions that were missing data (in particular the United Kingdom). For cal changes in the distribution of
the purposes of this study we focused on “pure” species populations, and we defined “pure” as M. galloprovincialis along the Normandy
populations that contained 95% genotype of either M. edulis or M. galloprovincialis. Although coast in France (Hilbish et al. 2012).
the data points are sparse in the Mediterranean and North Sea, these areas are nearly exclusively
Based on this correlative model and the
M. galloprovincialis and M. edulis, respectively. The current southern limit of M. edulis occurs at
the France/Spain border in the Bay of Biscay, while the current northern limit of M. galloprovin-
known distribution of M. galloprovin-
cialis is on France’s Brittany coast on Europe’s mainland and in southwest England. cialis with respect to SST, M. gallo-
provincialis is likely precluded from
inhabiting areas where winter SST is
populations of M. galloprovincialis occur in Brittany, France, routinely below 9 °C, while M. edulis is more cold-adapted
and in Cornwall, England (Fig. 1). Thus, there are three (Fig. 2). However, this correlative approach provides no
northern limits of M. galloprovincialis in Europe. The North explanation for the mechanism involved in this northern
Sea, Irish Sea, and the eastern English Channel are composed range limit of M. galloprovincialis. Previous work discerning
almost exclusively of populations of M. edulis. A disjunct the energetics of these two species (Fly and Hilbish 2013)
population of M. edulis occurs in a certain area of the Bay of provides evidence that the mechanism is not adult mussel
Biscay in France (Fig. 1) where SST is generally cooler than energetics, as there are no significant differences at cold tem-
the rest of the bay (Fig. 5A). We plotted these populations peratures (Fig. 3).
with respect to winter and summer SST, using February and Differences in energetics can, however, be ascertained as
August SST, respectively, to see how the distributions were the mechanism for the differences in the species’ southern
related to the warmest and coldest environmental tempera- limits. As stated previously, populations of Mytilus edulis do
tures these populations experienced (Fig. 2). Populations of not inhabit areas where summer temperatures routinely
M. galloprovincialis in Europe never occur in areas where exceed ~23 °C (Fig. 2). Fly and Hilbish (2013) determined the
mean monthly SST falls below 9 °C in the winter, while popu- critical temperature at which SFG = 0 for M. edulis and
lations of M. edulis occur in areas down to 6 °C (Fig. 2). In the M. galloprovincialis. While there were seasonal differences, the
summer, most populations of M. edulis occur where summer critical temperature for M. edulis was regularly around 23 °C
temperatures are below 20 °C, and no populations persist (Fig. 3, Fly and Hilbish 2013), which corresponds with the
where summer SST is greater than 23 °C. Conversely, popula- environmental temperatures at the southern range edge of
tions of M. galloprovincialis inhabit much warmer locations this species (Fig. 2, Fig. 4). The critical temperature for
(Figure 2) including sites where summer SST regularly exceeds M. galloprovincialis was between 29–30 °C (Fig. 3, Fly and
23 °C. The warmest average summer temperature experienced Hilbish 2013), and M. galloprovincialis inhabits regions in Europe
by M. galloprovincialis in our dataset was 26.4 °C; however, with SST that does not exceed this threshold (Fig. 2, Fig. 4).140 AMERICAN MALACOLOGICAL BULLETIN · ·
33 1 2015
both winter and summer warming
(Fig. 5C–F). The result of this warming
is the northward movement of the con-
ditions for survival of M. edulis and
M. galloprovincialis. The median of
the EURO-CORDEX rcp4.5 forecasts
predicts that summer maximum
monthly SST of 20 ºC will move north-
ward to just south of the Brittany pen-
insula in France by 2050 (Fig. 5D), and
Figure 2. Distribution of European Mytilus populations with respect to winter and summer
sea surface temperatures (SST). We plotted the populations shown in Figure 1 with respect move into the western English Channel
to winter and summer SST, using A, February and B, August SST, respectively, to see how and southern North Sea to 53ºN by
the distributions were related to environmental temperatures. A, Populations of M. gallopro- 2100 (Fig. 5F). This 20 ºC isotherm is a
vincialis never occur in areas where mean monthly SST falls below 9 °C in the winter, while proxy for the expected southern geo-
populations of M. edulis occur in areas down to 6 °C. B, In the summer, most populations graphic limit of M. edulis, and predicts
of M. edulis occur where summer temperatures are below 20 °C, and no populations persist that the only region of the English
where summer SST is greater than 23 °C. Conversely, populations of M. galloprovincialis in- Channel that will be habitable by
habit much warmer locations. M. edulis by 2100 will be along the
Normandy coast of France (between
Cherbourg and Calais). While a similar
In the past decade, the 9 ºC winter isotherm has been in permissible area appears on England’s side of the English
the western part of the English Channel in the south (Fig. Channel (between Bournemouth and Dover), mussels are
5A). During the same period, the 20 ºC summer isotherm has not readily found in this area due to a predominance of
traversed the Bay of Biscay from just south of the mouth of sandy beaches rather than hard substrates. The median of
the Gironde (45 ºN) to NW Spain (Fig. 5B). This pattern is the rcp4.5 forecasts suggest that winter monthly SST
consistent with the exclusion of Mytilus edulis from the lower higher than 9 ºC will move eastward into the English
Bay of Biscay (Fig. 1). The EURO-CORDEX forecast predicts Channel and northward into the Irish Sea by 2050 (Fig. 5C),
Figure 3. Physiological energetics of Mytilus edulis and M. galloprovincialis. Measurements of filtration rate, absorption efficiency and meta-
bolic rate were used to derive an estimate of scope for growth (SFG) (sensu Widdows and Bayne 1971 the SFG measures the energy above
maintenance available for growth and reproduction) of mussels at water temperatures ranging from 5 °C to 30 °C in A, spring, B, summer,
and C, fall. No mussels survived at 30 °C in the fall. Estimates of the critical temperatures at which SFG = 0 (dashed line) were used to de-
termine the geographic regions in Europe in which each species can potentially maintain a permanent population. This figure was adapted
from Fly and Hilbish (2013).RESPONSE OF EUROPEAN MUSSELS TO CLIMATE CHANGE 141
exceeds 20 °C, due to rapidly declining
SFG above this temperature. It is likely
that the southern limit of M. gallopro-
vincialis is also controlled by energetic
limitation; however, the southern limit
of this species on the northwest African
coast is not well-documented, so we
cannot currently determine tempera-
tures experienced at the very southern
range edge of this species. Interestingly,
while the southern limits of Mytilus spp.
in Europe appear to be controlled by
sublethal temperature effects of adult
energetics, the southern limit of M. edu-
lis on the east coast of the U.S. is con-
trolled by lethal temperature effects on
adult populations (Jones et al. 2010).
This is likely because the east coast of
the U.S. has a more continental climate
(and, therefore, greater temperature
Figure 4. Average temperature profile of European Mytilus edulis (gray) and M. galloprovincia-
extremes) than the west coast of Europe,
lis (black) populations in each season. The transparent rectangles (gray for M. edulis and black
for M. galloprovincialis) indicate the critical temperature at which SFG = 0 in spring, summer, which has a more coastal climate
and fall, as determined by Fly and Hilbish (2013). SFG data were not collected for winter (A). (Wethey 1985, Jenkins et al. 2008,
In regions that exceed this critical temperature, populations of mussels are expected to be Bailey 2009). Thus, mechanisms can
ephemeral or absent and, indeed, very few populations experience temperatures higher than differ within the same species in differ-
that critical temperature. Summer (C) and fall (D) appear to be more physiologically-limiting ent regions.
than spring (B). This figure was adapted from Fly and Hilbish (2013). The mechanism limiting the north-
ern range of Mytilus galloprovincialis in
Europe is still unknown; however, limi-
with only slightly further movement into the northern tations due to adult energetics are very unlikely. Blue mussels
North Sea by 2100 (Fig. 5E). This prediction suggests that are physiologically quiescent during winter (Bayne 1976),
M. galloprovincialis will be much more prevalent in the and there are no major differences in the SFG of M. edulis and
British Isles and English Channel than it currently is. M. galloprovincialis at cold temperatures in other seasons that
would explain the inability of M. galloprovincialis popula-
tions to persist where winter temperatures are below 9 °C
DISCUSSION (Fly and Hilbish 2013). This cold-water limitation has been
noted previously for European M. galloprovincialis popula-
Species distribution models are useful in understanding tions (Hilbish et al. 2012), as well as populations on the west
current and potential distributions of species; however, coast of the U.S. (Hilbish et al. 2010). There are several
oftentimes one type of SDM is incapable of accurately pre- hypotheses on the mechanism of this limitation that warrant
dicting all of a species’ range limits (e.g., north and south, east further investigation, including tolerance to cold-shock and
and west) (Woodin et al. 2013). This is because a given SDM reproductive abilities.
applies a single mechanism or environmental profile across The tolerance of species to cold temperatures depends
an entire species’ range, when, it is often the case that differ- on a variety of factors, including the thermal regimes and accli-
ent mechanisms or stressors control different portions of a mation times experienced (Renault et al. 2004, Terblanche
species’ geographic range or its distribution in different geo- et al. 2011). Jansen et al. (2007) found that Mytilus gallo-
graphic regions (Sokolova et al. 2012, Woodin et al. 2013). provincialis populations were much more sensitive to cold
This appears to be the case with Mytilus edulis and M. gallo- shock than M. edulis populations. This suggests that M. gal-
provincialis. As suggested by mechanistic modeling, the loprovincialis might not have the same capability to recover
southern limit of M. edulis is likely controlled by physiologi- from cumulative cold damage as M. edulis. Another possibil-
cal constraints on the adult populations: specifically, popula- ity is that the reproductive capabilities of M. galloprovincialis
tions cannot persist in areas where summer SST routinely are impeded at temperatures below 9 °C (Hilbish et al. 2010,142 AMERICAN MALACOLOGICAL BULLETIN · ·
33 1 2015
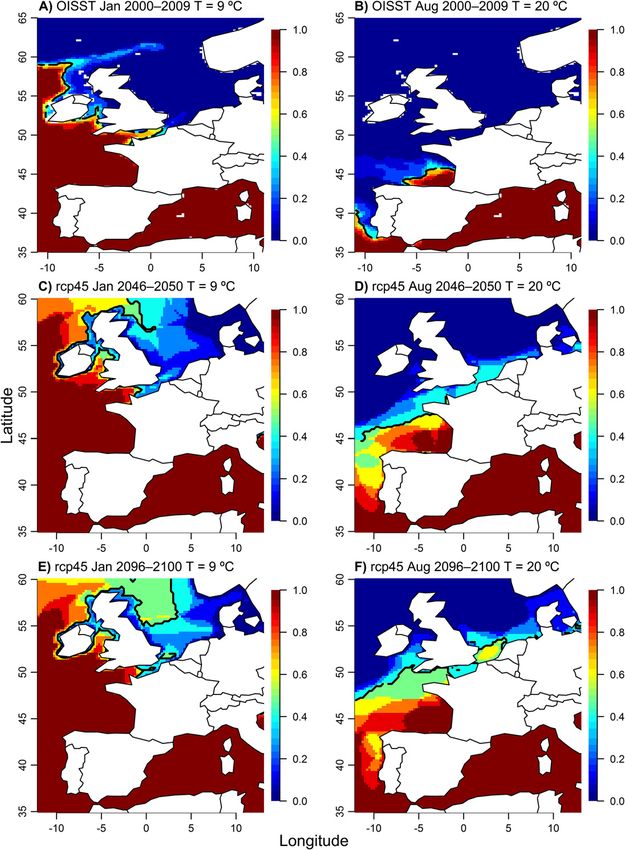
Figure 5. A, Fraction of winters 2002–2009 with temperatures above 9 ºC in winter (February) and B, above 20 ºC in summer (August),
derived from NOAA Optimally Interpolated Sea Surface Temperature data. The contour line is the 50th percentile of the values throughout
the figure. C, Fraction of EURO-CORDEX rcp4.5 models indicating temperatures above 9 ºC in winter (February) and D, 20 ºC in summer
(August) in the period 2046–2050. E, Fraction of EURO-CORDEX rcp4.5 models indicating temperatures above 9 ºC in winter (February)
and F, 20 ºC in summer (August) in the period 2096–2100. The temperature of 20 ºC in summer is a proxy for the southern geographic limit
of Mytilus edulis and the temperature of 9 ºC is a proxy for the northern geographic limit of M. galloprovincialis. The contour lines for the
forecasts (C–F) indicate the median of the model predictions. (Color shown in electronic version only).RESPONSE OF EUROPEAN MUSSELS TO CLIMATE CHANGE 143
Hilbish et al. 2012). Most populations of mussels spawn in brings to light the vulnerability of M. edulis to warming envi-
the spring after having undergone gametogenesis over the ronmental conditions: those populations exposed to summer
winter (Bayne 1976). The fact that the RF model indicated SSTs greater than 20 °C are highly vulnerable to being unable
winter or early spring as a key time for determining the distri- to persist.
bution of these mussels suggests a hypothesis that some Although we understand an important mechanism con-
aspect of gametogenesis and/or spawning is temperature trolling the southern range edge of Mytilus edulis in Europe,
dependent and different between species. we currently have still used 20 °C as our proxy for the physi-
Understanding the mechanism controlling this northern ological limit of this species. While the temperature at which
limit will be useful in making better predictions for the SFG = 0 for M. edulis is ~23 °C, the southern range edge of
expansion of these populations as winter SSTs warm. The RF this species maps more closely to a 20 °C SST isotherm, with
correlative model used monthly mean SST, while the mecha- only several populations persisting where summer tempera-
nistic model considered distributions on a daily scale. Hilbish tures range between 20–23 °C. It is likely that the populations
et al. (2012) ran a similar model using maximum entropy living in this summer temperature range are physiologically
modeling (Maxent, http://www.cs.princeton.edu/~schapire/ stressed (Sokolova et al. 2012) and heavily dependent on
maxent/), that considered the number of days below temper- other factors such as food availability. We should be able to
ature thresholds as variables. The two variables contributing develop an even stronger model to predict not only the range
most to mussel distribution were days below 9 °C and days edge of this species with changing SST based on where SFG =
below 10 °C (Hilbish et al. 2012). As hypotheses for mecha- 0, but to begin to quantify the productivity of these mussel
nisms explaining this temperature distribution are examined, beds based on the physiological rates measured (Fly and
the temporal scale of the temperature distribution should be Hilbish 2013). These mechanistic models, as stated earlier,
considered. require much more input and background knowledge than
Warming of the ocean is not expected to occur uniformly correlative models. Thus, several issues must be resolved to
(Xie et al. 2010), which suggests that the northern range limit produce a meaningful mechanistic model based on physio-
of Mytilus galloprovincialis and the southern range limit of logical productivity. A more detailed model will better take
M. edulis will likely change at heterogeneous rates over the into account any differences between submerged and inter-
remainder of the 21st century. During the first half of the cur- tidal mussels. Mytilus edulis and M. galloprovincialis reduce
rent century (present to 2050) the northern range limit of their aerial rate of oxygen consumption to 4–17% that of
M. galloprovincialis is expected to shift substantially into the their rate of aquatic oxygen consumption (Widdows et al.
English Channel and into the Irish Sea and North Atlantic 1979), and incur only a small cost in terms of oxygen debt
Ocean (Fig. 5C). However, during the second half of the cen- recovery (Widdows and Shick 1985). However, intertidal
tury further range expansion is expected to be comparatively mussels can only feed while submerged, thus, affecting food
small (Fig. 5E). Conversely, the anticipated contraction of the availability and energy intake. A robust mechanistic model
southern range edge of M. edulis is expected to remain south will take into account food availability and duration of expo-
of France’s Brittany coast in the Bay of Biscay through 2050 sure at low tide conditions.
(Fig. 5D), but shift dramatically north to 53°N by 2100, leav- The most outstanding question is how to incorporate
ing only a small portion of French coastline, mainly the food availability into projections of secondary production.
Normandy coast, suitable for M. edulis (Fig. 5F). France pro- Mussels consume food particles in the size range of 2–20 μm
duces about 73,000 tons of mussels each year, 22% of which (Bayne 1976), but algal biomass within this size range is only,
are produced in Normandy (Eurostat 2009). These potential at best, weakly correlated with chlorophyll a or other pig-
future SST shifts indicate the bulk of the commercial mussel ments that can be assessed with remote sensing (Alpine and
farms on the rest of the French coastline may no longer be Cloern 1985, Han and Furuya 2000, Arin et al. 2002). Addi-
able to cultivate M. edulis by the end of the century. tionally remote sensing products are often unreliable in
Mytilus edulis and M. galloprovincialis hybridize exten- near-shore coastal environments where materials of terres-
sively, and the differing rates in their range expansions and trial origin and reflection off of the ocean bottom interfere
contractions have implications for the hybrid zones formed with sensor readings (Hellweger et al. 2004, Moses et al.
between them. With a rapid northward expansion of M. gal- 2009). The result is that it is very difficult to predict present
loprovincialis and minimal contraction of M. edulis by 2050, day secondary production of mussels (and many other
the hybrid zones between these two species could expand marine species) on a regional scale. It will be even more dif-
substantially. However, by 2099, many current regions of ficult to forecast changes in primary production, specifically
hybridization should be displaced by M. galloprovincialis and of the nanoplankton as a consequence of climate change and
new hybrid zones may form in the Irish and North Atlantic to incorporate these changes into models of secondary pro-
Seas, regions currently inhabited primarily by M. edulis. This duction of mussels and other coastal species (Sommer and144 AMERICAN MALACOLOGICAL BULLETIN · ·
33 1 2015
Lengfellner 2008). Until meaningful projections of changes in Bayne, B. L. 1976. Marine Mussels: Their Ecology and Physiology.
coastal primary production become available the most pro- Cambridge University Press, Cambridge, United Kingdom.
ductive approach may be to forecast changes in local and Bierne, N., P. Borsa, C. Daguin, D. Jollivet, F. Viard, F. Bonhomme,
regional potential for secondary production and provide and P. David. 2003. Introgression patterns in the mosaic hybrid
mechanistic models that will allow the incorporation of local zone between Mytilus edulis and M. galloprovincialis. Molecular
Ecology 12: 447–461.
primary production to assess the management of coastal spe-
Breiman, L. 2001. Random forests. Machine Learning 45: 5–32.
cies with respect to climate change.
Buckley, L. B., M. C. Urban, M. J. Angilletta, L. G. Crozier, L. J.
Rissler, and M. W. Sears. 2010. Can mechanism inform species’
distribution models? Ecology Letters 13: 1041–1054.
ACKNOWLEDGMENTS Burrows, M, T., D. S. Schoeman, L. B. Buckley, P. Moore, E. S.
Poloczanska, K. M. Brander, C. Brown, J. F. Bruno, C. M. Duarte,
This study was supported by grants from NSF B. S. Halpern, J. Holding, C. V. Kappel, W. Kiessling, M. I.
(OCE1039513, OCE1129401), and NASA (NNX07AF20G, O’Connor, J. M. Pandolfi, C. Parmesan, F. B. Schwing, W. J.
NNX11AP77G). We acknowledge the World Climate Research Sydeman, and A. J. Richardson. 2011. The pace of shifting cli-
Programme’s Working Group on Regional Climate, and the mate in marine and terrestrial ecosystems. Science 334: 652–655.
Working Group on Coupled Modelling, former coordinating Coustau, C., F. Renaud, and B. Delay. 1991. Genetic characteriza-
body of CORDEX and responsible panel for CMIP5. We also tion of the hybridization between Mytilus edulis and M. gal-
thank the climate modelling groups (listed in Appendix B of loprovincialis on the Atlantic coast of France. Marine Biology
111: 87–93.
this paper) for producing and making available their model
Cutler, D. R., T. C. Edwards, K. H. Beard, A. Cutler, K. T. Hess,
output. We also acknowledge the Earth System Grid Feder-
J. Gibson, and J. J. Lawler. 2007. Random forests for classifica-
ation infrastructure, an international effort led by the U.S. tion in ecology. Ecology 88: 2783–2792.
Department of Energy’s Program for Climate Model Diagnosis Daguin, C., F. Bonhomme, and P. Borsa. 2001. The zone of sympat-
and Intercomparison, the European Network for Earth System ry and hybridization of Mytilus edulis and M. galloprovincialis,
Modelling and other partners in the Global Organisation for as described by intron length polymorphism at locus mac-1.
Earth System Science Portals (GO-ESSP). P. M. Brannock, Heredity 86: 342–354.
A. O. Hollis, and S. J. Jones assisted with field and genetic work. Edwards, M. and A. J. Richardson. 2004. Impact of climate change
We are grateful to P. B. Marko and B. A. Seibel, the American on marine pelagic phenology and trophic mismatch. Nature
Malacological Society, and the University of the Azores for 430: 881–884.
their organization of the World Congress of Malacology 2013 Elith, J. and J. R. Leathwick. 2009. Species distribution models: Eco-
conference and the symposium on “Climate Change and logical explanation and prediction across space and time. An-
Molluscan Ecophysiology.” This is publication number 73 in nual Review of Ecology, Evolution, and Systematics 40: 677–697.
Eurostat, 2009. Eurostat statistics in focus. Agriculture and Fisher-
Ecological Forecasting from the University of South Carolina.
ies, 83/2009.
FAO. 2012. Cultured Aquatic Species Information Programme. Myti-
lus edulis. Text by Goulletquer, P. In: FAO Fisheries and Aqua-
LITERATURE CITED culture Department [online]. Rome, Italy. http://www.fao.org/
fishery/culturedspecies/Mytilus_edulis/ 6 February 2012.
Akima, H., A. Gebhardt, and T. Petzoldt. 2013. Akima: Interpola- Fly, E. K. and T. J. Hilbish. 2013. Physiological energetics and bio-
tion of irregularly spaced data. R. package version 0.5-10. In- geographic range limits of three congeneric mussel species.
ternet resource: http://CRAN.R-project.org/package=akima. Oecologia 172: 35–46.
Alpine, A. E. and J. E. Cloern. 1985. Differences in in vivo fluores- Gardner, J. P. A. and D. O. F. Skibinski. 1991. Biological and physi-
cence yield between three phytoplankton size classes. Journal of cal factors influencing genotype-dependent mortality in hy-
Plankton Research 7: 381–390. brid mussel populations. Marine Ecology Progress Series 71:
Arin, L., X. A. G. Moran, and M. Estrada. 2002. Phytoplankton size 235–243.
distribution and growth rates in the Alboran Sea (SW Mediter- Gilg, M. R. and T. J. Hilbish. 2003. The geography of marine larval
ranean): Short term variability related to mesoscale hydrody- dispersal: Coupling genetics with fine-scale physical oceanog-
namics. Journal of Plankton Research 24: 1019–1033. raphy. Ecology 84: 2989–2998.
Bailey, R. G. 2009. Ecoregions of the United States. In R. G. Bailey, Gosling, E., S. Doherty, and N. Howley. 2008. Genetic character-
ed., Ecosystem Geography: From Ecoregions to Sites. 2nd edition. ization of hybrid mussel (Mytilus) populations on Irish coasts.
Springer-Verlag. New York, New York. Journal of the Marine Biological Association of the UK 88:
Banni, M., A. Negri, F. Mignone, H. Boussetta, A. Viarengo, and 341–346.
F. Dondero. 2011. Gene expression rhythms in the mussel Mytilus Guisan, A. and W. Thuiller. 2005. Predicting species distribution:
galloprovincialis (Lam.) across an annual cycle. PLoS ONE 6: Offering more than simple habitat models. Ecology Letters 8:
e18904. 993–1009.RESPONSE OF EUROPEAN MUSSELS TO CLIMATE CHANGE 145
Han, M.-S. and K. Furuya. 2000. Size and species-specific primary Liaw, A. and M. Wiener. 2002. Classification and regression by
productivity and community structure of phytoplankton in randomForest. R News 2/3: 18–22.
Tokyo Bay. Journal of Plankton Research 22: 1221–1235. Lionetto, M. G., R. Caricato, M. E. Giordano, M. F. Pascariello,
Hellweger, F. L., P. Schlosser, U. Lall, and J. K. Weissel. 2004. Use of L. Marinosci, and T. Schettino. 2003. Integrated use of bio-
satellite imagery for water quality studies in New York Harbor. markers (acetylcholinesterase and antioxidant enzymes activi-
Estuarine, Coastal and Shelf Science 61: 437–448. ties) in Mytilus galloprovincialis and Mullus barbatus in an Italian
Helmuth, B., J. G. Kingsolver, and E. Carrington. 2005. Biophysics, coastal marine area. Marine Pollution Bulletin 46: 324–330.
physiological ecology, and climate change: Does mechanism McDonald, J. H., R. Seed, and R. K. Koehn. 1991. Allozymes and mor-
matter? Annual Review of Physiology 67: 177–201. phometric characters of three species of Mytilus in the Northern
Hilbish, T. J., P. M. Brannock, K. R. Jones, A. B. Smith, B. N. Bullock, and Southern Hemispheres. Marine Biology 111: 323–333.
and D. S. Wethey. 2010. Historical changes in the distributions Moses, W. J., A. A. Gitelson, S. Berdnikov, and V. Povazhnyy. 2009.
of invasive and endemic marine invertebrates are contrary to Estimation of chlorophyll-a concentration in case II waters
global warming predictions: The effects of decadal climate os- using MODIS and MERIS data – successes and challenges.
cillations. Journal of Biogeography 37: 423–431. Environmental Research Letters 4: 045005, doi:10.1088/1748-
Hilbish, T. J., E. W. Carson, J. R. Plante, L. A. Weaver, and M. R. 9326/4/4/045005.
Gilg. 2002. Distribution of Mytilus edulis, M. galloprovincia- Peterson, A. T., J. Soberón, R. G. Pearson, R. P. Anderson, E. Martínez-
lis and their hybrids in open-coast populations of mussel in Meyer, M. Nakamura, and M. B. Araújo. 2011. Ecological Niches
southwestern England. Marine Biology 140: 137–142. and Geographic Distributions. Princeton University Press,
Hilbish, T. J., F. P. Lima, P. M. Brannock, E. K. Fly, R. L. Rognstad, and Princeton, New Jersey, U.S.A.
D. S. Wethey 2012. Change and stasis in marine hybrid zones in Philippart, C. J. M., H. M. van Aken, J. J. Beukema, O. G. Bos, G.
response to climate warming. Journal of Biogeography 39: 676–687. C. Cadée, and R. Dekker. 2003. Climate-related changes in
Jacob, D., J. Petersen, B. Eggert, A. Alias, O. B. Christensen, L. M. recruitment of the bivalve Macoma balthica. Limnology and
Bouwer, A. Braun, A. Colette, M. Déqué, G. Georgievski, Oceanography 48: 2171–2185.
E. Georgopoulou, A. Gobiet, L. Menut, G. Nikulin, A. Haensler, Pisanelli, B., M. Benedetti, D. Fattorini, and F. Regoli. 2009. Sea-
N. Hempelmann, C. Jones, K. Keuler, S. Kovats, N. Kröner, S. sonal and inter-annual variability of DNA integrity in mussels
Kotlarski, A. Kriegsmann, E. Martin, E. van Meijgaard, C. Mytilus galloprovincialis: A possible role for natural fluctua-
Moseley, S. Pfeifer, S. Preuschmann, C. Radermacher, K. Radtke, tions of trace metal concentrations and oxidative biomarkers.
D. Rechid, M. Rounsevell, P. Samuelsson, S. Somot, J.-F. Chemosphere 77: 1551–1557.
Soussana, C. Teichmann, R. Valentini, R. Vautard, B. Weber, R Development Core Team. 2010. R: A language and environment
and P. Yiou. 2014. EURO-CORDEX: New high-resolution cli- for statistical computing. R Foundation for Statistical Comput-
mate change projections for European impact research. Regional ing, Vienna, Austria.
Environmental Change 14: 563-578. Rawson, P. D. and T. J. Hilbish. 1998. Asymmetric introgression
Jansen, J. M., S. W. Bonga, and H. Hummel. 2007. Differential cold- of mitochondrial DNA among European populations of blue
shock resistance among acclimated European mussel populations. mussels (Mytilus spp.). Evolution 52: 100–108.
Marine and Freshwater Behaviour and Physiology 40: 233–245. Renault, D., O. Nedved, F. Hervant, and P. Vernon. 2004. The im-
Jenkins, S. R., P. Moore, M. T. Burrows, D. J. Garbary, S. J. Hawkins, portance of fluctuating thermal regimes for repairing chill in-
A. Ingólffson, K. P. Sebens, P. V. R. Snelgrove, D. S. Wethey, juries in the tropical beetle Alphitobius diaperinus (Coleoptera:
and S. A. Woodin. 2008. Comparative ecology of North Atlan- Tenebrionidae) during exposure to low temperature. Physi-
tic shores: Do differences in players matter for process? Ecology ological Entomology 29: 139–145.
89: S3–S23. Reynolds, R. W., T. M. Smith, C. Liu, D. B. Chelton, K. S. Casey,
Jones, S. J., F. P. Lima, and D. S. Wethey. 2010. Rising environmen- and M. G. Schlax. 2007. Daily high-resolution-blended analysis
tal temperatures and biogeography: Poleward range contraction for sea surface temperature. Journal of Climate 20: 5473–5496.
of the blue mussel, Mytilus edulis L., in the western Atlantic. Roberston, M. P., C. I. Peter, M. H. Villet, and B. S. Ripley. 2003.
Journal of Biogeography 37: 2243–2259. Comparing models for predicting species’ potential distribu-
Jones, S. J., A. J. Southward, and D. S. Wethey. 2012. Climate change tions: a case study using correlative and mechanistic predictive
and historical biogeography of the barnacle Semibalanus bala- modeling techniques. Ecological Modelling 164: 153–167.
noides. Global Ecology and Biogeography 21: 716–724. Sará, G., M. Kearney, and B. Helmuth. 2011. Combining heat-
Kearney, M. and W. Porter. 2009. Mechanistic niche modeling: transfer and energy budget models to predict thermal stress in
Combining physiological and spatial data to predict species’ Mediterranean intertidal mussels. Chemistry and Ecology 27:
ranges. Ecology Letters 12: 334–350. 135–145.
Kijewski, T., B. Śmietanka, M. Zbawkicka, E. Gosling, H. Hummel, Seed, R.1992. Systematics evolution and distribution of mussels be-
and R. Wenne. 2011. Distribution of Mytilus taxa in European longing to the genus Mytilus: An overview. American Malaco-
coastal areas as inferred from molecular markers. Journal of Sea logical Bulletin 9: 123–137.
Research 65: 224–234. Skibinski, D. O. F., J. A. Beardmore, and T. F. Cross. 1983. Aspects
Lawler, J. J., D. White, R. P. Neilson, and A. R. Blaustein. 2006. Pre- of the population genetics of Mytilus (Mytilidae; Mollusca) in
dicting climate-induced range shifts: Model differences and the British Isles. Biological Journal of the Linnean Society 19:
model reliability. Global Change Biology 12: 1568–1584. 137–183.146 AMERICAN MALACOLOGICAL BULLETIN · ·
33 1 2015
Sokolova, I. M., M. Frederich, R. Bagwe, G. Lannig, and A. A.
Sukhotin. 2012. Energy homeostasis as an integrative tool for
assessing limits of environmental stress tolerance in aquatic in-
vertebrates. Marine Environmental Research 79: 1–15.
Sommer, U. and K. Lengfellner. 2008. Climate change and the tim-
ing, magnitude, and composition of the phytoplankton spring
bloom. Global Change Biology 14: 1199–1208.
Suchanek, T. H. 1992. Extreme biodiversity in the marine environ-
ment: Mussel bed communities of Mytilus californianus. North-
west Environmental Journal 8: 150–152.
Terblanche, J. S., A. A. Hoffmann, K. A. Mitchell, L. Rako, P. C. le
Roux, and S. L. Chown. 2011. Ecologically relevant measures of
tolerance to potentially lethal temperatures. Journal of Experi-
mental Biology 214: 3713–3725.
Wethey, D. S. 1985. Catastrophe, extinction and species diversity: A
rocky intertidal example. Ecology 66: 445–456.
Widdows, J. and B. L. Bayne. 1971. Temperature acclimation of
Mytilus edulis with reference to its energy budget. Journal of the
Marine Biological Association of the UK 51: 827–843.
Widdows, J., P. Fieth, and C. M. Worrall. 1979. Relationships be-
tween seston, available food and feeding activity in the com-
mon mussel Mytilus edulis. Marine Biology 50: 195–207.
Widdows, J. and J. M. Shick. 1985. Physiological responses of Myti-
lus edulis and Cardium edule to aerial exposure. Marine Biology
85: 217–232.
Woodin , S. A., T. J. Hilbish, B. Helmuth, S. J. Jones, and D. S.
Wethey. 2013. Climate change, species distribution models,
and physiological performance metrics: Predicting when bio-
geographic models are likely to fail. Ecology and Evolution 3:
3334–3346.
Xie, S.-P., C. Deser, G. A. Vecchi, J. Ma, H. Teng, and A. T. Wittenberg,
2010. Global warming pattern formation: Sea surface tempera-
ture and rainfall. Journal of Climate 23: 966–986.
Submitted: 10 December 2013; accepted 31 August, 2014;
final revisions received: 15 January 2015RESPONSE OF EUROPEAN MUSSELS TO CLIMATE CHANGE 147 Appendix A Data used for Europe-wide Random Forest model using distributions of “pure” populations of Mytilus galloprovincialis and M. edulis based on published accounts or genetic analyses done for this study where M. galloprovincialis allele frequencies were greater than 95% or less than 5%, respectively. The sample sites are listed by latitude from North to South. Year sampled Site Latitude Longitude Frequency of Mg allele Source 2003 White Sea, Russia 66.00 39.37 0.00 Kijewski et al. 2011 2003 Reykjavik, Iceland 64.17 -22.02 0.00 Kijewski et al. 2011 2008 Tayport, Scotland 56.44 -2.94 0.01 current study 2008 Cramond, Scotland 55.98 -3.30 0.01 current study 2009 Fairlie, Scotland 55.76 -4.86 0.04 current study 2009 Millport, Scotland 55.75 -4.93 0.01 current study 2009 Rockcliffe, England 54.85 -3.79 0.00 current study 2009 Seascale, England 54.40 -3.49 0.00 current study 2009 Ravenglass, England 54.36 -3.41 0.00 current study 2008 Filey Brigg South, England 54.22 -0.27 0.04 current study 2005 Carlingford, Ireland 54.04 -6.18 0.00 Gosling et al. 2008 2005 Dunany, Ireland 53.86 -6.24 0.00 Gosling et al. 2008 2009 Thurstaston, England 53.34 -3.15 0.00 current study 2005 Dublin, Ireland 53.30 -6.15 0.00 Gosling et al. 2008 2009 Conwy, Wales 53.29 -3.83 0.00 current study 2008 Heacham, England 52.91 0.47 0.00 current study 2008 Lowestoft, England 52.45 1.74 0.01 current study 2008 Llangranog, Wales 52.16 -4.47 0.01 current study 2008 Harwich, England 51.93 1.27 0.00 current study 2008 Solva, Wales 51.87 -5.20 0.00 current study 2008 Milford Haven, Wales 51.72 -5.10 0.02 current study 2008 Dales, Wales 51.71 -5.17 0.00 current study 2008 Burry Port, Wales 51.68 -4.25 0.00 current study 2008 South Woodham Ferrers, England 51.63 0.61 0.00 current study 2008 Port Talbot, Wales 51.59 -3.81 0.00 current study 2008 Mumbles, Wales 51.57 -3.99 0.00 current study 2008 Porthcawl, Wales 51.50 -3.74 0.00 current study 2008 Atlantic College, England 51.40 -3.53 0.00 current study 2008 Swale, England 51.35 0.88 0.00 current study 2008 Minehead, England 51.21 -3.46 0.00 current study 2009 Exmouth, England 50.61 -3.41 0.00 current study 2009 Teignmouth, England 50.54 -3.49 0.00 current study 2009 Maidencombe, England 50.51 -3.51 0.00 current study 2009 Torbay, England 50.45 -3.54 0.00 current study 2009 Dartmouth, England 50.34 -3.57 0.00 current study 2009 Torcross, England 50.26 -3.65 0.00 current study 2003 Vlissengen, Netherlands 51.44 3.56 0.05 Kijewski et al. 2011 2003 Oostende, Belgium 51.24 2.92 0.00 Kijewski et al. 2011 2005 Dunkirk, France 51.05 2.38 0.00 Hilbish et al. 2012 2005 Dieppe, France 49.94 1.09 0.00 Hilbish et al. 2012 2005 Saint-Vaast-la-Hougue, France 49.58 -1.26 0.00 Hilbish et al. 2012 2003 Seine, France 49.42 0.08 0.00 Kijewski et al. 2011 2007 Merville-Franceville, France 49.29 -0.20 0.00 Hilbish et al. 2012 2006 Billiers, France 47.52 -2.48 0.04 Hilbish et al. 2012 2006 Barbatre, France 46.89 -2.15 0.01 Hilbish et al. 2012 2005 Saint-Gilles-Croix-de-Vie, France 46.69 -1.95 0.04 Hilbish et al. 2012 2006 La Tranche-sur-Mer, France 46.34 -1.46 0.03 Hilbish et al. 2012 2006 Vieux Châtelaillon, France 46.06 -1.09 0.00 Hilbish et al. 2012 2006 Montalivet-les-Bains, France 45.38 -1.16 0.01 Hilbish et al. 2012 2006 Mimizan-Plage, France 44.21 -1.29 0.01 Hilbish et al. 2012 2006 Pointe de Grave, France 45.57 -1.06 0.04 Hilbish et al. 2012 2006 Pornic, France 47.11 -2.11 0.05 Hilbish et al. 2012
148                             AMERICAN MALACOLOGICAL BULLETIN                  · ·
                                                                              33 1 2015

Appendix A. (Continued)

Year sampled     Site                                 Latitude   Longitude   Frequency of Mg allele   Source
2006             Saint-Brevin-les-Pins, France         47.27       -2.17               0.03           Hilbish et al. 2012
2006             Nacqueville, France                   49.68       -1.72               0.01           Hilbish et al. 2012
2006             Pointe du Moulard, France             49.64       -1.23               0.00           Hilbish et al. 2012
2006             Ravenoville, France                   49.47       -1.24               0.00           Hilbish et al. 2012
2006             Sainte-Honorine-des-Pertes, France    49.36       -0.80               0.00           Hilbish et al. 2012
2006             Luc-sur-Mer, France                   49.32        0.47               0.00           Hilbish et al. 2012
2006             Saint-Jouin-Bruneval, France          49.65        0.15               0.00           Hilbish et al. 2012
2006             Étretat, France                       49.71        0.20               0.00           Hilbish et al. 2012
2006             Saint-Pierre-en-Port, France          49.81        0.49               0.01           Hilbish et al. 2012
2006             Saint-Valéry-en-Caux, France          49.87        0.71               0.00           Hilbish et al. 2012
2006             Pourville, France                     49.92        1.03               0.00           Hilbish et al. 2012
2009             Port Quin, England                    50.59       -4.87               0.99           current study
2009             Rock, England                         50.54       -4.92               0.98           current study
2009             Porthcothan, England                  50.51       -5.03               0.97           current study
2009             Newquay, England                      50.42       -5.07               0.96           current study
2009             Trevaunance Cove, England             50.32       -5.20               0.98           current study
2009             Portreath, England                    50.26       -5.30               0.98           current study
2009             Saint Ives, England                   50.22       -5.49               0.96           current study
2005             Île Callot, France                    48.68       -3.92               0.98           Hilbish et al. 2011
2005             Roscoff, France                       48.73       -3.99               1.00           Hilbish et al. 2012
2005             Île Grande, France                    48.81       -3.57               0.99           Hilbish et al. 2013
2007             Locquirec, France                     48.69       -3.64               0.99           Hilbish et al. 2012
2007             Brignogan-Plage, France               48.67       -4.32               0.96           Hilbish et al. 2012
2006             Saint-Jean-de-Luz, France             43.39       -1.67               1.00           Hilbish et al. 2012
2005             Viveiro, Spain                        43.72       -7.62               0.97           Hilbish et al. 2012
2005             Ortigueira, Spain                     43.71       -7.85               0.99           Hilbish et al. 2012
2005             Foz, Spain                            43.57       -7.25               0.98           Hilbish et al. 2012
2006             Laredo, Spain                         43.41       -3.42               1.00           Hilbish et al. 2012
2005             Cabanas, Spain                        43.41       -8.17               0.99           Hilbish et al. 2012
2006             San Vincente de la Barquera, Spain    43.39       -4.37               0.98           Hilbish et al. 2012
2006             Hondarribia, Spain                    43.37       -1.79               0.95           Hilbish et al. 2012
2005             A Coruña, Spain                       43.37       -8.38               0.98           Hilbish et al. 2012
2006             Deba, Spain                           43.30       -2.35               0.98           Hilbish et al. 2012
2005             Laxe, Spain                           43.22       -9.00               0.97           Hilbish et al. 2012
2005             Esteiro, Spain                        42.79       -8.98               0.99           Hilbish et al. 2012
2005             Marin, Spain                          42.40       -8.69               0.99           Hilbish et al. 2012
2005             San Xenxo, Spain                      42.38       -8.85               0.99           Hilbish et al. 2012
2005             Bueu, Spain                           42.23       -8.79               0.99           Hilbish et al. 2012
2005             Viana do Castelo, Portugal            41.70       -8.86               1.00           Hilbish et al. 2012
2005             Ílhavo, Portugal                      40.62       -8.75               1.00           Hilbish et al. 2012
2005             São Martinho do Porto, Portugal       39.52       -9.15               1.00           Hilbish et al. 2012
2005             Tróia, Portugal                       38.49       -8.90               1.00           Hilbish et al. 2012
2006             Sines, Portugal                       37.91       -8.80               1.00           Hilbish et al. 2012
2005             Albufeira, Portugal                   37.08       -8.23               1.00           Hilbish et al. 2012
2006             Burgau, Portugal                      37.07       -8.77               1.00           Hilbish et al. 2012
2003             Cádiz, Spain                          36.55       -6.37               0.96           Kijewski et al. 2011
2006             Ancona, Italy                         43.56       13.59               1.00           Pisanelli et al. 2009
2006             Cap d’Agde, France                    43.27        3.52               1.00           Wethey, unpubl. data
2003             Banyuls-sur-Mer, France               42.48        3.13               1.00           Kijewski et al. 2011
2003             Barcelona, Spain                      41.37        2.20               1.00           Kijewski et al. 2011
2000             Carovigno, Italy                      40.72       17.80               1.00           Lionetto et al. 2003
2000             Brindisi, Italy                       40.65       17.98               1.00           Lionetto et al. 2003
2000             Torchiarolo, Italy                    40.54       18.08               1.00           Lionetto et al. 2003
2006             Peñíscola, Spain                      40.36        0.40               1.00           Wethey, unpubl. data
RESPONSE OF EUROPEAN MUSSELS TO CLIMATE CHANGE 149 Appendix A. (Continued) Year sampled Site Latitude Longitude Frequency of Mg allele Source 2000 Lecce, Italy 40.34 18.37 1.00 Lionetto et al. 2003 2000 Otranto, Italy 40.15 18.49 1.00 Lionetto et al. 2003 2000 Santa Maria al Bagno, Italy 40.13 17.99 1.00 Lionetto et al. 2003 2006 Oropesa del Mar, Spain 40.08 0.14 1.00 Wethey, unpubl. data 2000 Gallipoli, Italy 40.05 17.97 1.00 Lionetto et al. 2003 2000 Castro, Italy 40.00 18.43 1.00 Lionetto et al. 2003 2003 Oristano, Sardinia 39.86 8.55 1.00 Kijewski et al. 2011 2008 Bizerte, Tunisia 37.27 9.89 1.00 Banni et al. 2011 2006 Torrox, Spain 36.73 -3.96 1.00 Wethey, unpubl. data 2006 Estepona, Spain 36.41 -5.17 1.00 Wethey, unpubl. data Appendix B. Combinations of global and regional circulation models used in ensemble predictions of ocean climate change. C4I, Com- munity Climate Change Consortium for Ireland, CNRM, Météo France, DMI, Danish Meteorological Institute, ETHZ, Swiss Institute of Technology Zurich, GKSS, Helmholz Center Geesthacht Institute for Coastal Research, ICTP, KNMI, Royal Netherlands Meteorological Institute, HC, UK Met Office Hadley Centre, MPI, Max Planck Institute, OURANOS, Consortium on Regional Climatology and Adaptation to Climate Change, SMHI, Swedish Meteorological and Hydrological Institute, UCLM, Universidad Castilla, La Mancha, VMGO, Voeikov Main Geophysical Observatory. Modeling Group Global Model Regional Model C4I ECHAM5 RCA3 CNRM ARPEGE Aladin4.5 CNRM ARPEGE Aladin5.1 DMI ARPEGE HIRHAM5 DMI ECHAM5 HIRHAM5 DMI BCM HIRHAM5 ETHZ HadCM3Q0 CLM GKSS IPSL CLM KNMI ECHAM5-r3 RACMO2 HC HadCM3Q0 HadRM3Q0 HC HadCM3Q3 HadRM3Q3 HC HadCM3Q16 HadRM3Q16 MPI ECHAM5 M-REMO OURANOS CGCM3 CRCM SMI BCM RCA SMI ECHAM5-r3 RCA SMI HadCM3Q3 RCA UCLM HadCM3Q0 PROMES VMGO HadCM3Q0 RRCM
You can also read