Monitoring and moderating extreme indoor temperatures in low-income urban communities
←
→
Page content transcription
If your browser does not render page correctly, please read the page content below
LETTER • OPEN ACCESS

Monitoring and moderating extreme indoor temperatures in low-income
urban communities
To cite this article: R L Wilby et al 2021 Environ. Res. Lett. 16 024033

View the article online for updates and enhancements.

                                This content was downloaded from IP address 46.4.80.155 on 10/09/2021 at 10:52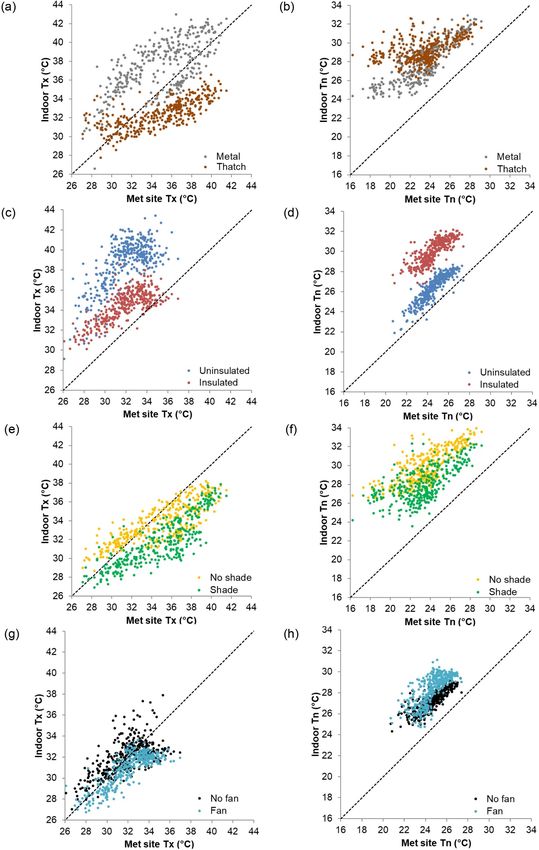
Environ. Res. Lett. 16 (2021) 024033 https://doi.org/10.1088/1748-9326/abdbf2
LETTER
Monitoring and moderating extreme indoor temperatures in
OPEN ACCESS
low-income urban communities
RECEIVED
11 November 2020 R L Wilby1, R Kasei2, K V Gough1, E F Amankwaa3, M Abarike2, N J Anderson1, S N A Codjoe4,
REVISED P Griffiths5, C Kaba2, K Abdullah2, S Kayaga6, T Matthews1, P Mensah3, C Murphy7
6 January 2021
and P W K Yankson3
ACCEPTED FOR PUBLICATION
1
14 January 2021 Geography and Environment, Loughborough University, Loughborough LE11 3TU, United Kingdom
2
PUBLISHED
Department of Climate Change and Food Security, University for Development Studies, Tamale, Ghana
3
2 February 2021 Department of Geography and Resource Development, University of Ghana, Legon LG 59, Ghana
4
Regional Institute for Population Studies, University of Ghana, Legon LG 96, Ghana
5
School of Sport, Exercise and Health Sciences, Loughborough University, Loughborough LE11 3TU, United Kingdom
Original content from 6
this work may be used School of Architecture, Building and Civil Engineering, Loughborough University, Loughborough LE11 3TU, United Kingdom
7
under the terms of the Irish Climate Analysis and Research UnitS (ICARUS), Department of Geography, Maynooth University, Maynooth, Ireland
Creative Commons
Attribution 4.0 licence. E-mail: r.l.wilby@lboro.ac.uk
Any further distribution Keywords: climate change, extreme heat, informal settlements, indoor temperature, Ghana
of this work must
maintain attribution to Supplementary material for this article is available online
the author(s) and the title
of the work, journal
citation and DOI.
Abstract
Climate change presents significant threats to human health, especially for low-income urban
communities in the Global South. Despite numerous studies of heat stress, surprisingly little is
known about the temperatures actually encountered by people in their homes, or the benefits of
affordable adaptations. This paper examines indoor air temperature measurements gathered from
47 living rooms within eight low-income communities of Accra and Tamale, Ghana. Using
multiple temperature indices and a tiered analysis, we evaluate indoor temperature variations
linked to roof type, ceiling insulation, presence of fans, and tree shade, for different housing types
and locations. Our data reveal indoor temperatures in the range 22.4 ◦ C to 45.9 ◦ C for Accra, and
22.2 ◦ C to 43.0 ◦ C in Tamale. Using dummy regression analysis, we find that tree shade reduces the
number of very hot days (>40 ◦ C) and nights (>30 ◦ C) by about 12 and 15 d per year, respectively.
Building materials also strongly moderate indoor temperatures but in opposing ways: rooms with
traditional mud walls and thatch roofs are on average 4.5 ◦ C cooler than rooms in concrete block
houses with uninsulated metal roofs during the day but are 1.5 ◦ C warmer at night; rooms with
ceiling insulation are on average 6.9 ◦ C cooler in the day but 1.4 ◦ C warmer at night. We conclude
that sub-daily data are necessary for reporting extreme indoor temperatures, and that trade-offs
between minimum and maximum temperatures require interventions to be assessed carefully
before attempting to counter extreme heat inside homes.
1. Introduction which elevates heat stress compared to surrounding
rural areas (Wilby 2007, Oleson et al 2015, Coffel et al
Millions of people are already exposed to deadly heat 2017). Low-income communities are especially vul-
but this hazard is expected to become more frequent nerable given their relatively high exposure to extreme
and severe as global temperatures rise (Zhao et al weather events and dependence on fragile water/en-
2015, Nangombe et al 2018, Lie et al 2020). Popu- ergy infrastructure (Makaka and Meyer 2006, Maller
lations in the tropics and subtropics are most likely and Strengers 2011, Ahmadalipour et al 2019, Gough
to encounter the greatest rise in heatwaves with fur- et al 2019, Jagarnath et al 2020, Kayaga et al 2020).
ther warming (Dong et al 2015, Matthews et al 2017, Hence, the global frontline for deadly heat is likely
Mora et al 2017, Rohat et al 2019, Raymond et al to be found in the densely populated informal set-
2020). Moreover, high temperatures are exacerbated tlements of the tropics in general, and sub-Saharan
within dense cities by the urban heat island (UHI), Africa in particular.
© 2021 The Author(s). Published by IOP Publishing Ltd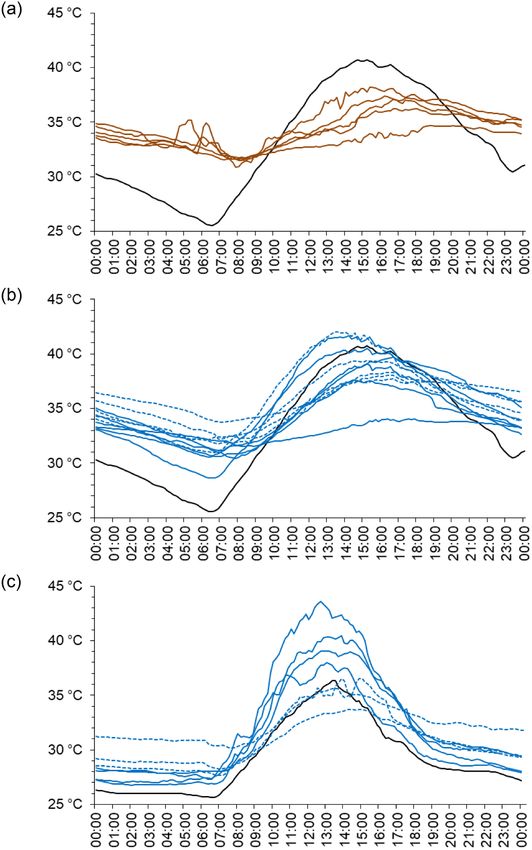
Environ. Res. Lett. 16 (2021) 024033                                                                              R L Wilby et al

                                       Table 1. Study settlements and their key characteristics.

           City              Settlement         Code               Characteristics

           Accra             Agbogbloshie          S               State-recognized indigenous settlement with
                                                                   dense infilling and busy informal market.
                             Alajo                 A               Large colonial style dwellings divided into multi-
                                                                   family units and informal compound housing.
                             Odawna                O               Informal settlement located by Odaw river with
                                                                   busy market and various commercial activities.
                             Bortianor             B               Peri-urban indigenous coastal settlement with
                                                                   relatively low housing density.
           Tamale            Kukuo                 K               Densely populated informal community with mix
                                                                   of modern and traditional housing.
                             Lamashegu             L               Combined informal residential and industrial
                                                                   area.
                             Gumani                G               Low-lying linear settlement.
                             Ward K                W               Centrally located informal community.

     Despite such concerns, surprisingly little is known                  In this paper, we advance understanding by stat-
about extreme indoor temperatures in urban areas                     istically relating building types and modifications to
(Scott et al 2017) and even less about afford-                       sub-hourly air temperature variations monitored in
able measures for lowering temperatures in homes                     diverse homes within low-income urban communit-
within informal settlements of tropical Africa (Amos-                ies. Temperatures were studied in two cities in Ghana,
Abanyie et al 2013, Dauda and Gao 2013). Expos-                      namely: Accra (5◦ 33′ N, 0◦ 12′ W, population 4.2 mil-
ure to high indoor temperatures matters because of                   lion, hot semi-arid/tropical wet climate) and Tamale
the adverse impacts on human health, comfort, and                    (9◦ 24′ N, 0◦ 51′ W, population 0.4 million, tropical
productivity (Dapi et al 2010, White-Newsome et al                   wet and dry climate). These communities and cities
2012, Dunne et al 2013, Codjoe et al 2020). With more                were chosen because they regularly endure adverse
extreme temperatures and rapidly growing urban                       impacts from extreme heat (Gough et al 2019, Codjoe
populations, there is mounting recognition that cit-                 et al 2020)—events that have become more frequent
ies are priority places for climate action (Dodman                   and severe in recent decades (Ringard et al 2016). The
et al 2019). More specifically, affordable/low-energy                following analysis provides evidence of the efficacy
solutions are urgently needed to manage deadly heat,                 of affordable measures intended to moderate extreme
especially within low-income urban settlements in                    indoor temperatures.
sub-Saharan Africa (Parkes et al 2019).
     The effectiveness of building modifications to
manage extreme temperatures depends on context.                      2. Data and methods
Many factors affect indoor temperatures, including:
wall, roof and floor materials; roof pitch and reflect-              2.1. Field data
ance, ventilation, size, and age of the structure; num-              Four communities were chosen in Acca and four
ber of occupants and their behaviour; building use;                  more in Tamale based on their mix of building types
artificial heat sources; building, window, and door                  and density, informality, and vulnerability to extreme
size/orientation; site elevation, shade, local breezes,              heat (table 1). Tinytag Transit 2 thermistors were
proximity to water bodies, and the urban heat island.                installed within homes to monitor air temperatures
Previous research has evaluated building age, win-                   encountered by occupants during 2018. According
dow size/type, thermal mass or roof type using field                 to the manufacturer, the sensors have a precision of
measurements and/or building simulations (Taylor                     0.01 ◦ C and accuracy of 0.4 ◦ C in the range 0 ◦ C to
et al 2000, Amos-Abanyie et al 2013, Morakinyo et al                 50 ◦ C (Gemini Data Loggers 2015). The logging inter-
2016, Naicker et al 2017, Wright et al 2017, Ayanlade                val was set to 10 min.
et al 2019). Many studies use daily mean temperatures                    Homes were selected to represent different
even though averages can obscure critical variations                 structures, building materials, sizes, and locations
within the diel (24 h) thermal regime. Other research                (figure 1). This process was guided by the local
draws on qualitative evidence (e.g. Nematchoua et al                 knowledge of ‘community champions’ (residents
2014, 2017) or multi-variate indices of thermal com-                 nominated by their communities to liaise between
fort and heat stress (e.g. Holmes et al 2016). Met-                  households and the research team). A standard
rics of human thermoregulation combine permuta-                      form captured information about building loc-
tions of environmental data (such as air temperature,                ation (coordinates, elevation), number of floors
humidity, air speed and radiant energy) with inform-                 and building height (as a proxy for size/thermal
ation about occupants’ metabolic rate and clothing.                  mass), alongside other characteristics (wall, and roof
Dry-bulb air temperature features in the majority of                 materials, number of doors and windows, amount
heat warning systems and building energy models.                     of shade, and orientation). Any modifications to
                                                       2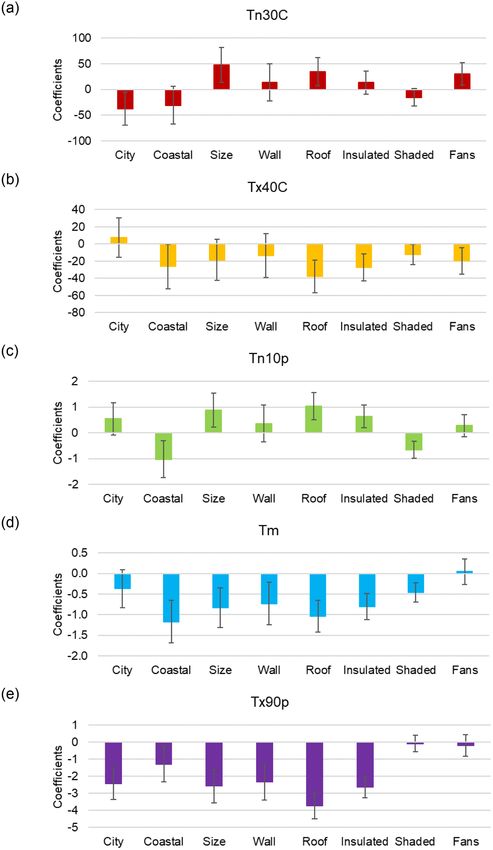
Environ. Res. Lett. 16 (2021) 024033 R L Wilby et al
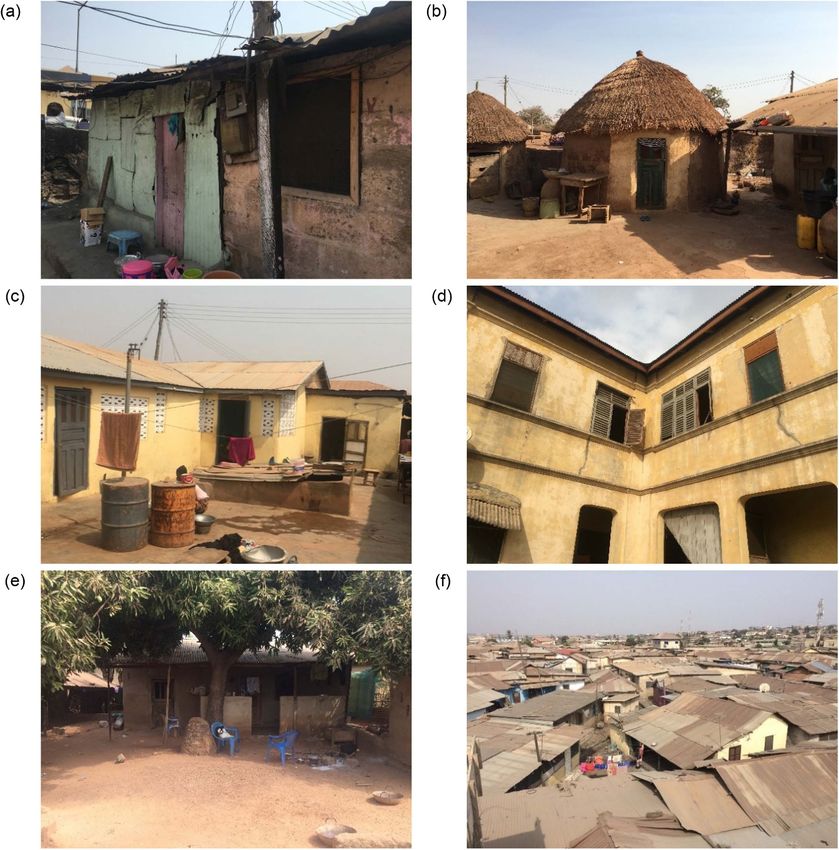
Figure 1. Example dwellings with: (a) wood walls and sheet metal-roof (Accra); (b) traditional mud walls and thatch roof
(Tamale); (c) single-storey concrete block walls and sheet metal roof (Tamale); (d) two-storey/large concrete block walls (Accra);
(e) some shade (Tamale); and (f) no shade (Accra).
counter high temperatures, such as ceiling insu- Testo 610 handheld sensor (Testo 2020). Variations
lation (plywood, plastic sheeting, Polyvinyl chlor- in temperature were always smaller than instrument
ide, a synthetic plastic polymer tongue and groove accuracy (±0.5 ◦ C).
panels, plaster), fans (ceiling, free-standing), tree Thermistors were also installed within Steven-
shade or air conditioning, were also recorded. Room son screens at ∼1.25 m above ground level alongside
occupancy, usage, and artificial heat sources were thermometers operated by the Ghana Meteorological
noted too. Agency (GMA) at three sites: (A) their compound
At each home, one thermistor was fixed outdoors on the University of Ghana (Legon, Accra) campus,
on a self-shaded north-facing wall to measure ambi- (B) Accra airport, and (C) Tamale airport (figure S1).
ent air temperature, whilst up to four were sited Indoor temperatures are expected to differ from these
inside rooms with various ceiling types, usage, occu- records because a key purpose of a dwelling is to reg-
pancy, and dimensions (figure S1 (available online ulate the thermal environment for occupants. Non-
at stacks.iop.org/ERL/16/024033/mmedia)). All ther- etheless, previous studies show strong positive linear
mistors were mounted ∼2 m above ground level, associations between indoor and outdoor temperat-
away from direct sunlight and artificial heat sources. ures on a home-by-home basis (e.g. Quinn et al 2014,
These sites had to be as unobtrusive as possible and Nguyen and Dockery 2016, Naicker et al 2017). Here,
always beyond the reach of children. Spot measure- our thermistor records at GMA stations (A and C
ments were taken within several homes to assess above) are used as points of reference for our out-
any height-dependency of air temperatures using a door and indoor temperature measurements. Sensors
3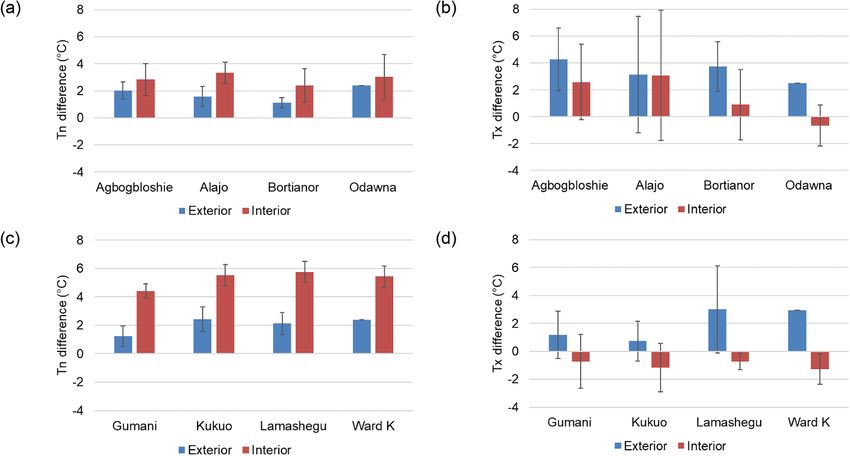
Environ. Res. Lett. 16 (2021) 024033                                                                                      R L Wilby et al

           Table 2. Definitions of primary (daily) and derived (from daily) temperature indices obtained for each sensor site.

                        Code                   Description                                                Units

                                               Primary indices (daily)
                                                                                                          ◦
                        Tn                     Daily minimum temperature                                    C
                                                                                                          ◦
                        Tx                     Daily maximum temperature                                    C
                                                                                                          ◦
                        Tm                     Daily mean temperature                                       C
                                                                                                          ◦
                        DTR                    Daily temperature range (Tx—Tn)                              C
                                               Derived indices (from daily)
                        Tn30C                  Number of hot nights (Tn > 30 ◦ C)                         days
                        Tx40C                  Number of very hot days (Tx > 40 ◦ C)                      days
                                                                                                          ◦
                        Tnn                    Minimum value of daily Tn                                    C
                                                                                                          ◦
                        Tn01p                  1st percentile of daily Tn                                   C
                                                                                                          ◦
                        Tn10p                  10th percentile of daily Tn                                  C
                                                                                                          ◦
                        Tn50p                  Median (50th percentile) of daily Tn                         C
                                                                                                          ◦
                        Tnx                    Maximum value of daily Tn                                    C
                                                                                                          ◦
                        Txn                    Minimum value of daily Tx                                    C
                                                                                                          ◦
                        Tx50p                  Median (50th percentile) of daily Tx                         C
                                                                                                          ◦
                        Tx90p                  90th percentile of daily Tx                                  C
                                                                                                          ◦
                        Tx99p                  99th percentile of daily Tx                                  C
                                                                                                          ◦
                        Txx                    Maximum value of daily Tx                                    C

housed within these official meteorological stations                  thermistor recordings at each site (table 2). These data
are expected to have more stable environments than                    were then used to derive 12 temperature indices, again
outdoor sites within communities.                                     for each site. These are the number of very hot nights
    Initially, a network of 96 thermistors were                       [when Tn > 30 ◦ C] (Tn30C); the number of very hot
deployed; after 1 year, 81 were still in place and oper-              days [when Tx > 40 ◦ C] (Tx40C); temperature min-
ating (47 inside homes, 24 outside homes, plus 7 ver-                 ima summarised by the very lowest (Tnn), the 1st
andas, and 3 at meteorological stations). Data were                   (Tn01p), 10th (Tn10p), and 50th (Tn50p) percent-
downloaded every other month and quality assured.                     ile, and very highest (Tnx) of the daily distribution
Day-to-day changes and basic range checks were per-                   of Tn; temperature maxima characterised by the very
formed, with records from GMA stations and homes                      lowest (Txn), the 50th (Tx50p), 90th (Tx90p) and
cross-compared to eliminate outliers/suspect values                   99th (Tx99p) percentile, and the very highest (Txx) of
associated with artificial heat exposure. Percentile-                 the daily distribution of Tx. Note that the temperat-
based indicators, rather than absolute extremes, were                 ure thresholds for Tn30C and Tx40C are higher than
used for statistical analysis (section 2.3) to reduce                 used elsewhere because the conventional definition of
possible contamination by erroneous outliers. Abrupt                  a ‘tropical night’ (Tn > 20 ◦ C) (Sillmann et al 2013)
changes in the daily range helped to detect any reloca-               would be exceeded 100% of the time at all sites (except
tion or tampering with a sensor. The cleaned archive                  for the GMA station in Tamale).
yielded more than 3.5 million data values for analysis.
Importantly, the high temporal resolution enabled                     2.3. Statistical analysis
evaluation of temperature variations within a day,                    We used the above indices to discern variations in
so the effects of location and building factors can be                temperature associated with building location, type,
discerned from a range of temperature metrics.                        and modifications that favour lower indoor temperat-
    According to multi-decadal thermometer-based                      ures. Three tiers of statistical technique were applied:
records provided by GMA (for sites B and C above),                    (a) community level averaging of temperature to eval-
annual mean temperatures in Tamale and Accra for                      uate local variations in the strength of the UHI; (b)
2018 were 9th and 11th highest since 1960, respect-                   category level averages to show differences in tem-
ively. Since the 1960s, annual mean temperatures rose                 perature between groups of similar buildings; and (c)
by 0.26 ◦ C decade−1 and 0.18 ◦ C decade−1 at the                     building level dummy regression analysis of variables
same sites. Hence, we regard our study period as rep-                 influencing selected indoor temperature indices.
resentative of the generally warmer conditions exper-                     For tier 1, mean daily indoor and outdoor tem-
ienced in recent decades. Hereafter, we present res-                  peratures were stratified by community then com-
ults from thermistor data gathered during the 365 d                   pared with thermistor data from GMA sites (A and
period covering 22 January 2018–21 January 2019.                      C). Since these meteorological stations are in open-
                                                                      grassed sites outside the city centre, differences in
2.2. Primary and derived temperature indices                          temperature between them and communities are
Primary series of daily minimum (Tn), daily max-                      indicative of local UHI intensity. This reveals ambi-
imum (Tx), daily mean (Tm), and daily range of tem-                   ent temperature variations across each city reflect-
perature (DTR; Tx minus Tn) were obtained from                        ing local building density, artificial heat sources,

                                                       4
Environ. Res. Lett. 16 (2021) 024033 R L Wilby et al
proximity to open/green space, water bodies, and dis- metal or asbestos); ceiling insulation (0 for none); tree
tance from the coast (for Accra). shade (0 for none); and ceiling or free-standing fan
For tier 2, building types were categorized by (0 for none). The coefficients β i,j are directly com-
height/number of floors, wall, and roof material as parable (in each temperature index). Some dummy
well as by measures intended to reduce indoor tem- variables could have been sub-classified, such as ceil-
peratures (table S1). The sampled housing archetypes ing insulation (by material), tree shade (by extent),
were as follows. Single-storey homes (⩽5 m high) or sheet roofing (by material). However, there is a
were comprised of wood walls with metal or asbes- danger of over-fitting the model given the modest
tos sheet roofs (figure 1(a)), or traditional mud walls sample size (45 rooms after excluding two homes with
with thatch roofs (figure 1(b)), or concrete walls with air conditioning). The dummy variables allowed us
metal or asbestos roofs (figure 1(c)). Two-storey or to pool temperature indices reflecting very different
large (>5 m high) buildings had concrete walls and building types and locations.
asbestos sheet or tiled roofs (figure 1(d)). Shade by
vegetation was classified as either present (figure 1(e)) 3. Results
or absent (figure 1(f)). This binary approach was jus-
tified given that rapid visual assessment of shade is 3.1. Variations in extreme temperature between
problematic due to variations by time of day and sites
effect of neighbouring structures. Our thermistor data reveal considerable variations of
Building-specific indices (Tn10p, Tx90p and indoor temperature linked to site. In Accra, the low-
mean Tm) were stratified by city, then averaged by est recorded indoor temperature (Tn) was 22.4 ◦ C
housing archetype, or cooling measure. Two-sample for a small asbestos-roofed, wood-walled room near
t-tests of differences in the mean (assuming unequal the coast; the highest indoor temperature (Tx) was
variance) were applied to the groups of data. For 45.9 ◦ C for a small metal-roofed, wood-walled room
example, indoor temperatures may be compared for in a densely built-up area. As expected, equivalent val-
sub-samples of single-storey (n1 ) and two-storey ues (Tn = 20.7 ◦ C, Tx = 37.0 ◦ C) at Accra meteorolo-
(n2 ) housing in Accra, with the null hypothesis of gical station were lower. The average number of very
no difference. The number of degrees of freedom hot nights (Tn30C) within homes ranged between 7
(n1 + n2 − 2) is sometimes small, in which case (single-storey concrete houses) and 92 (two-storey or
the statistical power to identify differences between large concrete houses) per year, whereas none were
factors is limited (i.e. there is a higher chance of recorded at the meteorological station (table 3). Like-
accepting a null hypothesis that is actually false). wise, the number of very hot days (Tx40C) was on
Indoor temperatures were also compared for rooms average 40 inside single-storey wood homes but zero
with different modifications within the same house at the nearest meteorological station.
or with a nearby property of similar size, age, and In Tamale, the lowest indoor temperature (Tn)
design. Resulting scatterplots reveal daily variations was 22.2 ◦ C and the highest (Tx) was 43.0 ◦ C (both
of indoor Tx and Tn depending on outdoor temper- for metal-roofed homes). Temperatures at Tamale
atures (at the reference site); roof type (metal versus airport ranged between 17.4 ◦ C and 41.4 ◦ C. Average
thatch); ceiling type (insulated versus uninsulated); Tn30C within metal and thatch roof homes were 96
shade (tree cover versus unshaded); and fans (present and 102 nights per year respectively, compared with
or absent). none at the GMA station (table 3). In contrast, aver-
For tier 3, we apply dummy regression modelling age Tx40C was zero in thatch roof rooms, 7 in metal
to i temperature indices (Tn30C, Tx40C, Tn10p, Tm, roof rooms, and 10 at the GMA station.
and Tx90p) to quantify the benefit of modifications We also stratified our temperature data by com-
relative to the effects of building location and char- munity to elucidate variations across the two cities.
acteristics. The influence of n dummy variables (vj ) In Accra, average indoor Tn were higher for all com-
were estimated from the coefficients of the following munities than at GMA stations (by up to +3.3 ◦ C in
model, fitted via ordinary least squares: Alajo) (figure 2). Likewise, indoor Tx was higher in
all communities (by up to +3.1 ◦ C in Alajo) except
∑
n
Odawna (−0.7 ◦ C), an area with some two-storey
Ti = αi + βi,j vj + ei (1)
j=1
houses (figure 1(d)). In Tamale, Tn were higher than
the GMA station in all communities, whereas Tx were
where Ti is the indoor temperature index, αi is the lower on average than the meteorological station (by
model intercept, β i,j are the model coefficients, and as much as −1.3 ◦ C in Ward K).
ei is the model error. Eight dummy variables were Outdoor temperatures in communities were con-
applied, each coded either 0 for the reference case or sistently higher than those at GMA stations (figure 2),
1 for the ‘treatment’ (table S2). The variables were as official sites (A and C) are located away from the
city (0 for Tamale); coastal (0 for sites > 1 km from city centre, in open, well-ventilated areas. Hence, by
the sea); thermal mass (0 for buildings ⩽ 5 m high); comparing outdoor temperature differences between
wall material (0 for wood); roof material (0 for sheet communities and reference stations, we estimated
5Environ. Res. Lett. 16 (2021) 024033
Table 3. Arithmetic mean temperature indices based on the same from each site, pooled by building category and city. Single-storey houses are distinguished by wall material (in parentheses). Mean temperature indices are also given
for outdoor (self-shaded) sites within communities and at reference meteorological stations. Refer to table 2 for index definitions.
Tm DTR Tn30C Tx40C Tnn Tn01p Tn10p Tn50p Tnx Txn Tx50p Tx90p Tx99p Txx
City Category n (◦ C) (◦ C) (days) (days) (◦ C) (◦ C) (◦ C) (◦ C) (◦ C) (◦ C) (◦ C) (◦ C) (◦ C) (◦ C)
6
Accra (n = 33) Single-storey (wood) 7 31.9 8.5 28 40 24.0 24.9 26.0 27.8 29.9 28.6 36.6 38.5 39.5 40.2
Single-storey (concrete) 5 29.2 4.5 7 0 23.9 24.6 25.5 27.1 29.8 26.8 31.8 33.2 34.5 35.1
Two-storey/large (concrete) 6 30.0 1.8 92 0 26.2 26.7 27.5 29.2 31.2 27.7 31.2 32.5 33.3 33.7
Veranda 1 30.3 10.1 0 1 21.7 21.9 23.5 25.4 27.6 27.1 35.9 37.4 38.4 40.0
Outdoor (self-shaded) 13 31.0 9.4 0 36 22.2 23.0 24.6 26.4 28.7 27.9 36.0 38.6 40.1 40.9
Met site 1 28.2 7.3 0 0 20.7 21.6 22.9 24.6 27.4 25.0 32.1 34.3 35.6 37.0
Tamale (n = 48) Single-storey (mud) 6 30.8 3.8 102 0 25.1 25.7 26.9 28.6 32.9 27.6 32.7 35.4 36.8 37.4
Single-storey (concrete) 23 31.3 5.5 96 7 24.8 25.3 26.3 28.3 33.1 27.6 34.0 37.5 38.7 39.2
Veranda 6 30.9 10.5 22 57 21.5 22.0 23.2 25.5 30.4 26.3 36.6 40.2 42.2 43.0
Outdoor (self-shaded) 11 31.0 11.0 3 59 20.7 21.3 22.7 25.2 30.4 26.0 36.5 40.5 42.1 42.9
Met site 2 29.0 11.2 0 10 17.4 18.2 20.2 23.4 29.1 24.6 35.3 39.0 40.5 41.4
R L Wilby et alEnviron. Res. Lett. 16 (2021) 024033 R L Wilby et al
Figure 2. Difference in daily mean (a), (c) minimum temperature (Tn) and (b), (d) maximum temperature (Tx) within living
rooms (interior) and outside homes (exterior) by community in (a), (b) Accra and (c), (d) Tamale, compared with reference
meteorological stations. T-bars denote one standard deviation from the mean.
Table 4. Differences in indoor temperature indices associated with building characteristics and modifications, based on two-sample
t-tests assuming unequal variance. The number of degrees of freedom (df) are also given. Rooms with air conditioning were excluded.
City Factors df Tn10p (◦ C) Tm (◦ C) Tx90p (◦ C)
Accra Two-storey/large house v single-storey house 14 +1.5‡ −1.2† −4.4‡
Insulated room v uninsulated room 14 +1.4† −2.3† −6.9‡
Some shade v no shade 14 −0.2 −0.5 −0.7
Fan v no fan 14 +0.4 +0.3 −0.2
Tamale Thatch roof v metal roof 27 +0.6 −0.6∗ −2.2‡
Insulated roof v uninsulated roof 27 +0.4 −0.2 −0.7
Insulated metal roof v uninsulated metal roof 21 +1.1 −0.8∗ −2.8†
Insulated thatch roof v uninsulated thatch roof 4 −0.1 +0.1 0
Insulated thatch roof v uninsulated metal roof 6 +1.5 −1.2† −4.5‡
Insulated thatch roof v insulated metal roof 19 +0.3 −0.4† −1.6
Uninsulated thatch roof v insulated metal roof 21 +0.4 −0.5 −1.7‡
Some shade v no shade 27 −0.8∗ −0.7† −0.4
Fan v no fan 27 0 0.5 +1.3∗
Significant differences are shown in bold for p-values: ∗Environ. Res. Lett. 16 (2021) 024033 R L Wilby et al
differences in Tn10p (−0.8 ◦ C) for shaded rooms and air from outside. This was confirmed by the absence
in Tx90p (+1.3 ◦ C) for rooms with fans. of any statistically significant temperature differences
Differences also emerge when comparing daily Tx in our pairwise analysis of all rooms with, and without
(−4.9 ◦ C) and Tn (+1.3 ◦ C) for rooms with thatch fans (table 4). Likewise, there was no differences in
or metal roofs, in this case, within the same house temperature due to fans in the subset of rooms with
(figures 3(a) and (b)). During the hottest day sampled no ceiling insulation (figure S3). Although Tn was
in Tamale, the smallest daily temperature range was higher in some rooms with PVC ceiling cladding and
recorded in a room with thatch underlain by plastic a fan (figures 3(g) and (h)), this may be explained by
sheeting (installed to protect occupants from dust and a greater number of electrical appliances (i.e. artificial
insects rather than for insulation) (figure 4(a)). Vari- heat sources) and fewer doors.
ations within the diel regime were likewise recorded
amongst rooms with metal roofs (figure 4(b)). The 3.4. Combined effects of modifications on indoor
room with the smallest daily variation was in a large, temperatures
single-storey house inhabited by one family, with par- We used dummy regression to evaluate the rel-
tial shade to the rear and PVC cladding on high ceil- ative effects of geographic location (city, distance
ings. Conversely, the metal-roofed room with greatest from sea), building archetype (number of floors/
daily temperature range had no shade and a low, thermal mass, wall, and roof materials), and modi-
uninsulated ceiling. fications (ceiling insulation, tree shade, and fans)
Similarly, diel temperature profiles for the hottest on indoor temperature indices (figure 5 and table
day in Accra were different for single-storey houses S2). The amount of variance explained by these
with insulated ceilings compared to those with unin- factors ranged from 17% (Tx40C) to 73% (Tx90p).
sulated ceilings (figure 4(c)). The sample size is not Statistically significant (p = 0.05) model coeffi-
large enough to discern the effect of floor-level (in cients (with standard errors) emerge for rooms
two-storey buildings) or roof type; however, the data with:
reveal a narrower indoor daily temperature range for
insulated than uninsulated rooms, with a diel regime
similar to thatch (figure 4(a)). Although Tx was lower, (a) Thatch roof versus metal roof. This changes
temperatures in rooms with insulated metal/asbes- Tx40C by −38 (±19) d, Tm by −1.0 (±0.4) ◦ C,
tos and thatch roofs were consistently higher at night Tn10p by +1.0 (±0.4) ◦ C, and Tx90p by −3.7
than uninsulated metal-roofed rooms (see below). (±0.8) ◦ C.
(b) Ceiling insulation versus no insulation. This
3.3. Effect of individual modifications on indoor changes Tm by −0.8 (±0.3) ◦ C and Tx90p by
temperatures −2.6 (±0.6) ◦ C.
Modifications to homes, such as ceiling insulation, (c) Concrete/mud walls versus wood walls. This
shade, and fans are intended to improve thermal com- changes Tx90p by −2.3 (±1.0) ◦ C.
fort. However, consequences for indoor temperatures (d) Tree shade versus no shade. This changes Tn10p
were mixed, depending on time of day and building by −0.7 (±0.3) ◦ C.
archetype. Rooms with insulated ceilings were up to (e) Large (>5 m high) versus small (⩽5 m
7 ◦ C cooler in the day than ones without insulated high) buildings. This changes Tx90p by −2.6
ceilings within the same home (figures 3(c) and (d)) (±1.0) ◦ C.
but during one night, the insulated room did not fall
below 32.2 ◦ C. Hence, insulation reduces Tx but at Dummy variable coefficients can be summed to give
the penalty of higher Tn. combined effects of several measures. For example,
Tree shade reduces indoor temperatures most traditional homes in Tamale are always ⩽5 m high,
during the day (Tx) in the dry season (figure S2(a)) have thatch roofs and mud walls but are not loc-
and, as expected, there is no difference between ated by the coast. Hence, to reduce Tx90p in such
shaded and unshaded rooms at night (figure S2(b)). homes, the modelled measures (i.e. ceiling insulation
Although lower indoor temperatures were recorded −2.6 ◦ C, tree shade −0.1 ◦ C, and a fan −0.2 ◦ C)
in rooms with some shade (table 4), the difference would yield a benefit of −2.9 ◦ C relative to the
in Tx peaked during April–July (2.2 ◦ C) for the two reference building (table S2). However, the model
exemplar rooms. On some days, Tx in a shaded room also indicates that this set of modifications would
was at least 8 ◦ C cooler than the meteorological sta- increase the number of very hot nights by 28 per
tion (figure 3(e)). year. Adding ceiling insulation, tree shade and a fan
Discerning the effect of (ceiling) fans on indoor to a concrete walled and metal roofed home would
temperatures is problematic as their presence or change Tx90p by +0.8 ◦ C and Tn30C by −7 nights
absence tends to coincide with that of insulation. per year.
Moreover, even when present, fans may not be used. Day/night trade-offs are also predicted by the
Overall, fans are not expected to reduce indoor tem- models for modifications to low-income homes in
peratures unless by promoting ventilation of cooler Accra. For example, upgrading a reference building
8Environ. Res. Lett. 16 (2021) 024033 R L Wilby et al
Figure 3. Indoor daily maximum (Tx) and minimum (Tn) temperatures for different rooms with (a), (b) metal or thatched roofs;
(c), (d) uninsulated or insulated ceilings; (e), (f) without or with shade; and (g), (h) without or with ceiling fans. Dashed lines are
the 1:1 relationship between indoor and reference station temperatures.
9Environ. Res. Lett. 16 (2021) 024033 R L Wilby et al
Figure 4. Indoor temperatures on the hottest days of the study period in Tamale (3 March 2018) for single-storey houses with (a)
thatch (brown lines); (b) metal (blue lines, Kukuo dashed, Gumani solid) and; in Accra (25 February 2018) for (c) metal/asbestos
roofs (blue lines, where insulated are dashed; uninsulated are solid). Temperatures at the reference meteorological station are also
shown (black lines).
(⩽5 m high, wooden wall, metal roof, with no insu- 4. Discussion
lation) to one with concrete walls, insulation, and
fan, could change Tx90p by −5.2 ◦ C but Tn30C by Relatively little is known about indoor temperat-
+57 nights per year. Overall, choice of roof material ures in tropical Africa; even less for those living and
and ceiling insulation are the most heavily weighted working within high-density, informal communities.
variables for reducing Tx90p. Addition of tree shade In this paper we have shown that building mater-
reduces the frequency of hot nights by 15 per ials and modifications can have significant impacts
year. on the indoor temperatures endured by residents
10Environ. Res. Lett. 16 (2021) 024033 R L Wilby et al
Figure 5. Coefficients for variables (horizontal axes) used in dummy regression models of: (a) number of hot nights (Tn30C); (b)
number of very hot days (Tx40C); (c) 10th percentile of daily minimum temperature (Tn10p); (d) mean daily temperature (Tm);
and (e) 90th percentile of the daily maximum temperature (Tx90p). See table S2 for model details. T-bars denote the standard
error of coefficient estimates.
of low-income communities. Here, we consider the significantly under-report the extraordinary indoor
wider implications of our research for other parts of temperatures faced by some households; yet such sta-
the Global South. tion data (or gridded derivatives) are routinely used
We show that conventional dry-bulb air tem- as reference points for heatwave forecasts and climate
perature measurements at meteorological stations change studies (e.g. Alexander et al 2006, Donat et al
11Environ. Res. Lett. 16 (2021) 024033 R L Wilby et al
2013, Raymond et al 2020). This adds to the sense be tested (Santamouris 2014, Akbari and Kolokotsa
that heatwave impacts are being overlooked for sub- 2016, Kolokotroni et al 2018). The influence of floor
Saharan Africa (Harrington and Otto 2020). Sub- level on temperatures (inside multi-storey homes)
hourly, indoor temperature data reveal that residents and long-term trends in preference for certain mater-
may be living much closer to a ‘thermal precipice’ ials are also worthy of further exploration. In our
than conventional ambient air temperature measure- sample, ceiling insulation was present in 74% of the
ments suggest (Kenney et al 2004). We suspect that rooms. Amongst these, 69% used plywood, 20% PVC
this situation is not unique to Ghana. cladding or plastic sheeting, and 11% plaster. More
Although often used, we show that mean indoor widespread use of PVC tongue and groove panels
temperature data can hide important trade-offs. For in place of plywood would favour higher night-time
example, thatch with insulated ceilings has relat- indoor temperatures over the long-term (Naicker et al
ively low indoor Tx but comparatively high Tn. If 2017).
the aim is to bring respite from high indoor Tx, We acknowledge that the benefits of fans are dif-
preferred options are ceiling insulation, tree shade, ficult to quantify without accompanying information
and/or thatch roof materials. If improved sleeping about their use. Nonetheless, it is accepted that the
conditions at night are the priority (i.e. lower Tn), protective value of fans is via increased airflow and
then uninsulated metal roofs and/or tree shade are evaporative cooling from sweating. Previous research
desirable. Such measures can reduce the frequency of shows that indoor fan use is beneficial up to ∼45 ◦ C
very hot nights by 30 per year. This means that the diel and 10% relative humidity or ∼40 ◦ C and 60% relat-
temperature regime must be considered when evalu- ive humidity; beyond these limits there is increased
ating heatwave impacts and adaptations. risk of dehydration (Jay et al 2015). Some recom-
There are also important considerations about mend against use of fans in very hot (⩾45 ◦ C) and
the cultural and practical aspects of some modi- arid (Environ. Res. Lett. 16 (2021) 024033 R L Wilby et al
malaria risk (Monroe et al 2015). Consequently, there P Griffiths https://orcid.org/0000-0002-0591-
is a strong imperative to moderate indoor temperat- 9724
ure extremes at night as well as during the day. Since K Abdullah https://orcid.org/0000-0001-9101-
most home-based livelihood activities take place out- 3437
side the physical structure of the home, in a kiosk or S Kayaga https://orcid.org/0000-0001-8749-723X
under an adjacent veranda (Gough 2010, Amankwaa T Matthews https://orcid.org/0000-0001-6295-
et al 2017), measures are also needed for reducing 1870
ambient heat in outdoor spaces. C Murphy https://orcid.org/0000-0003-4891-2650
5. Conclusions References
This study exposes the level to which observations Ahmadalipour A, Moradkhani H and Kumar M 2019 Mortality
at meteorological stations and use of daily means risk from heat stress expected to hit poorest nations the
hardest Clim. Change 152 569–79
under-report the extraordinary indoor temperat-
Akbari H and Kolokotsa D 2016 Three decades of urban heat
ures encountered by some households. Our data islands and mitigation technologies research Energy Build.
also show the relative effects of building location, 133 834–42
size, wall/roof materials, insulation, shade, and cool- Alexander L V et al 2006 Global observed changes in daily climate
extremes of temperature and precipitation J. Geophys. Res.
ing systems on extreme indoor temperatures. We
Atmos. 111 D05109
used statistical modelling to quantify the benefits Amankwaa E F 2017 Water and electricity access for home-based
of affordable adaptation measures (traditional roof enterprises and poverty reduction in the greater Accra
materials, ceiling insulation, shading by vegetation, metropolitan area (GAMA), Ghana PhD Thesis University
of Ghana
and electric fans). Critical trade-offs emerge when
Amos-Abanyie S, Akuffo F O and Kutin-Sanwu V 2013 Effects of
evaluating consequences of these measures using thermal mass, window size, and night-time ventilation on
more nuanced temperature indices. Such evidence peak indoor air temperature in the warm-humid climate of
is urgently needed to properly monitor and then Ghana Sci. World J. 2013 620195
Ayanlade A, Esho O M, Popoola K O, Jeje O D and Orola B A 2019
guide modifications to low-income housing. In this
Thermal condition and heat exposure within buildings: a
way, vulnerable people in tropical cities will have case study of tropical city Case Stud. Therm. Eng. 14 100477
an opportunity to become more resilient to climate Codjoe S N A et al 2020 Impact of extreme weather conditions on
change. healthcare provision in urban Ghana Soc. Sci. Med.
258 113072
Coffel E, Horton R M and De Sherbinin A M 2017 Temperature
Data availability statement and humidity based projections of a rapid rise in global heat
stress exposure during the 21st century Environ. Res. Lett.
The data that support the findings of this study are 13 014001
available upon reasonable request from the authors. Dapi L N, Rocklöv J, Nguefack-Tsague G, Tetanye E and
Kjellstrom T 2010 Heat impact on schoolchildren in
Cameroon, Africa: potential health threat from climate
Acknowledgments change Glob. Health Action 3 5610
Dauda A M and Gao H 2013 Improving sustainability of housing
in Ghana through energy efficient climate control strategies
This work was funded by the British Academy under Adv. Mater. Res. 608 1698–704
the Cities and Infrastructure Programme CI170211. Dodman D, Archer D and Satterthwaite D 2019 Editorial:
The VEWEC team thank the communities, in par- responding to climate change in contexts of urban poverty
ticular the Community Champions, for facilitating and informality Environ. Urban 31 3–12
Donat M G, Alexander L V, Yang H, Durre I, Vose R and Caesar J
the fieldwork. We are especially grateful to all the 2013 Global land-based datasets for monitoring climatic
participants who repeatedly welcomed us into their extremes Bull. Am. Meteorol. Soc. 94 997–1006
homes and workplaces to record the temperatures Dong W, Liu Z, Liao H and Tang Q 2015 New climate and
they experience. Ben Roberts kindly supplied data on socio-economic scenarios for assessing global human health
challenges due to heat risk Clim. Change 130 505–18
temperature variations within rooms linked to meas- Dunne J P, Stouffer R J and John J G 2013 Reductions in labour
urement heights above ground level. capacity from heat stress under climate warming Nat. Clim.
Change 3 563–6
ORCID iDs Gemini Data Loggers 2015 Tinytag transit 2 temperature data
logger (−40 to +70 ◦ C) TG-4080 (available at:
http://gemini2.assets.d3r.com/pdfs/original
R L Wilby https://orcid.org/0000-0002-4662-9344 /2081-tg-4080.pdf) (Accessed 6 March 2015)
K V Gough https://orcid.org/0000-0002-9638- Giridharan R and Emmanuel R 2018 The impact of urban
9879 compactness, comfort strategies and energy consumption
on tropical urban heat island intensity: a review Sustain.
E F Amankwaa https://orcid.org/0000-0002-8735- Cities Society 40 677–87
2521 Gough K V 2010 Continuity and adaptability of home-based
N J Anderson https://orcid.org/0000-0002-0037- enterprises: a longitudinal study from Accra, Ghana Int. Dev.
0306 Plan. Rev. 32 45–70
Gough K V, Yankson P W K, Wilby R L, Amankwaa E, Abarike M,
S N A Codjoe https://orcid.org/0000-0002-6567- Codjoe S, Griffiths P, Kaba C, Kasei R and Kayaga S 2019
0262 Vulnerability to extreme weather events in cities:
13Environ. Res. Lett. 16 (2021) 024033 R L Wilby et al
implications for infrastructure and livelihoods J. Br. Acad. Mora C et al 2017 Global risk of deadly heat Nat. Clim. Change
7 155–81 7 501–6
Hansen N T, Ræbild A and Hansen H H 2012 Management of Morakinyo T E, Dahanayake K K C, Adegun O B and Balogun A A
trees in northern Ghana—when the approach of 2016 Modelling the effect of tree-shading on summer
development organizations contradicts local practices For. indoor and outdoor thermal condition of two similar
Trees Livelihoods 21 241–52 buildings in a Nigerian university Energy Build. 130 721–32
Harrington L J and Otto F E 2020 Reconciling theory with the Morris N B, English T, Hospers L, Capon A and Jay O 2019 The
reality of African heatwaves Nat. Clim. Change effects of electric fan use under differing resting heat index
10 796–8 conditions: a clinical trial Ann. Intern. Med. 171 675–7
Holmes S H, Phillips T and Wilson A 2016 Overheating and Naicker N, Teare J, Balakrishna Y, Wright C Y and Mathee A 2017
passive habitability: indoor health and heat indices Build. Indoor temperatures in low cost housing in Johannesburg,
Res. Inform. 44 1–19 South Africa Int. J. Environ. Res. Public Health 14 1410
IPCC 2013 Annex I: atlas of global and regional climate Nangombe S, Zhou T, Zhang W, Wu B, Hu S, Zou L and Li D 2018
projections ed G J van Oldenborgh, M Collins, J Arblaster, J Record-breaking climate extremes in Africa under stabilized
H Christensen, J Marotzke, S B Power, M Rummukainen 1.5 C and 2 C global warming scenarios Nat. Clim. Change
and T Zhou Climate Change 2013: The Physical Science Basis. 8 375–80
Contribution of Working Group I to the Fifth Assessment Nematchoua M K, Ricciardi P, Reiter S, Asadi S and Demers C M
Report of the Intergovernmental Panel on Climate Change ed 2017 Thermal comfort and comparison of some parameters
T F Stocker, D Qin, G K Plattner, M Tignor, S K Allen, coming from hospitals and shopping centers under natural
J Boschung, A Nauels, Y Xia, V Bex and P M Midgley ventilation: the case of Madagascar Island J. Build. Eng.
(Cambridge: Cambridge University Press) 13 196–206
Jagarnath M, Thambiran T and Gebreslasie M 2020 Heat stress Nematchoua M K, Tchinda R, Ricciardi P and Djongyang N
risk and vulnerability under climate change in Durban 2014 A field study on thermal comfort in naturally-
metropolitan, South Africa—identifying urban planning ventilated buildings located in the equatorial climatic
priorities for adaptation Clim. Change 163 807–29 region of Cameroon Ren. Sustain. Energy Rev. 39 381–93
Jay O, Cramer M N, Ravanelli N M and Hodder S G 2015 Should Nguyen J L and Dockery D W 2016 Daily indoor-to-outdoor
electric fans be used during a heat wave? Appl. Ergon. temperature and humidity relationships: a sample across
46 137–43 seasons and diverse climatic regions Int. J. Biometeorol.
Kayaga S et al 2020 Cities and extreme weather events: impact of 60 221–9
flooding and extreme heat on water and electricity services Ojeh V N, Balogun A A and Okhimamhe A A 2016 Urban-rural
in Ghana Environ. Urban (https://doi.org/10.1177/ temperature differences in Lagos Climate 4 29
0956247820952030) Oleson K W, Monaghan A, Wilhelmi O, Barlage M, Brunsell N,
Kenney W L, Degroot D W and Holowatz L A 2004 Extremes of Feddema J, Hu L and Steinhoff D F 2015 Interactions
human heat tolerance: life at the precipice of between urbanization, heat stress, and climate change Clim.
thermoregulatory failure J. Therm. Biol. 29 479–85 Change 129 525–41
Kolokotroni M, Shittu E, Santos T, Ramowski L, Mollard A, Rowe Parkes B, Cronin J, Dessens O and Sultan B 2019 Climate change
K, Wilson E, de Brito Filho J P and Novieto D 2018 Cool in Africa: costs of mitigating heat stress Clim. Change
roofs: high tech low cost solution for energy efficiency and 154 461–76
thermal comfort in low rise low income houses in high solar Quinn A, Tamerius J D, Perzanowski M, Jacobson J S, Goldstein I,
radiation countries Energy Build. 176 58–70 Acosta L and Shaman J 2014 Predicting indoor heat
Kyriakodis G E and Santamouris M 2018 Using reflective exposure risk during extreme heat events Sci. Total Environ.
pavements to mitigate urban heat island in warm 490 686–93
climates-results from a large scale urban mitigation project Raymond C, Matthews T and Horton R M 2020 The emergence of
Urban Clim. 24 326–39 heat and humidity too severe for human tolerance Sci. Adv.
Li D, Yuan J and Kopp R B 2020 Escalating global exposure to 6 eaaw1838
compound heat-humidity extremes with warming Environ. Ringard J et al 2016 The intensification of thermal extremes in
Res. Lett. 15 064003 west Africa Glob. Planet. Change 139 66–77
Makaka G and Meyer E 2006 Temperature stability of traditional Rohat G, Flacke J, Dosio A, Dao H and van Maarseveen M 2019
and low-cost modern housing in the Eastern Cape, South Projections of human exposure to dangerous heat in African
Africa J. Build. Phys. 30 71–86 cities under multiple socioeconomic and climate scenarios
Maller C J and Strengers Y 2011 Housing, heat stress and health in Earth’s Future 7 528–46
a changing climate: promoting the adaptive capacity of Santamouris M 2014 Cooling the cities–a review of reflective and
vulnerable households, a suggested way forward Health green roof mitigation technologies to fight heat island and
Promot. Int. 26 492–8 improve comfort in urban environments Sol. Energy
Markolf S A, Chester M V, Eisenberg D A, Iwaniec D M, Davidson 103 682–703
C I, Zimmerman R, Miller T R, Ruddell B L and Chang H Satterthwaite D, Archer D, Colenbrander S, Dodman D, Hardoy J
2018 Interdependent infrastructure as linked social, and Patel S 2018 Responding to climate change in cities and
ecological, and technological systems (SETSs) to address in their informal settlements and economies. IIED paper
lock-in and enhance resilience Earth’s Future 6 1638–59 prepared from the IPCC Int. Scientific Conf. Cities and
Mastrucci A, Byers E, Pachauri S and Rao N D 2019 Improving Climate Change (Edmonton, 2018) (Accessed 4 December
the SDG energy poverty targets: residential cooling needs in 2019)
the global South Energy Build. 186 405–15 Scott A A et al 2017 Temperature and heat in informal settlements
Matthews T, Wilby R L and Murphy C 2017 Communicating the in Nairobi PLoS One 12 e0187300
deadly consequences of global warming for human heat Sillmann J, Kharin V V, Zhang X, Zwiers F W and Bronaugh D
stress Proc. Natl Acad. Sci. 114 3861–6 2013 Climate extremes indices in the CMIP5 multimodel
Matthews T, Wilby R L and Murphy C 2019 An emerging tropical ensemble: part 1. model evaluation in the present climate J.
cyclone-deadly heat compound hazard Nat. Clim. Change Geophys. Res. Atmos. 118 1716–33
9 602–6 Simwanda M, Ranagalage M, Estoque R C and Murayama Y 2019
Monroe A, Asamoah O, Lam Y, Koenker H, Psychas P, Lynch M, Spatial analysis of surface urban heat islands in four rapidly
Ricotta E, Hornston S, Berman A and Harvey S A 2015 growing African cities Remote Sens. 11 1645
Outdoor-sleeping and other night-time activities in Taylor P B, Mathews E H, Kleingeld M and Taljaard G W 2000
northern Ghana: implications for residual transmission and The effect of ceiling insulation on indoor comfort Build.
malaria prevention Malaria J. 14 35 Environ. 35 339–46
14Environ. Res. Lett. 16 (2021) 024033 R L Wilby et al
Testo 2020 Test 610 humidity/temperature measuring instrument Wright C Y, Street R A, Cele N, Kunene Z, Balakrishna Y, Albers P
Data sheet (available at: https://static-int.testo.com/ N and Mathee A 2017 Indoor temperatures in patient
media/48/db/71587df6c7c4/testo-610-Data- waiting rooms in eight rural primary health care centers in
sheet.pdf) Northern South Africa and the related potential risks to
White-Newsome J L, Sánchez B N, Jolliet O, Zhang Z, Parker E A, human health and wellbeing Int. J. Environ. Res. Public
Dvonch J T and O’Neill M S 2012 Climate change and Health 14 43
health: indoor heat exposure in vulnerable populations Zhao Y, Ducharne A, Sultan B, Braconnot P and Vautard R 2015
Environ. Res. 112 20–27 Estimating heat stress from climate-based indicators:
Wilby R L 2007 A review of climate change impacts on the built present-day biases and future spreads in the CMIP5 global
environment Built. Environ. J. 33 31–45 climate model ensemble Environ. Res. Lett. 10 084013
15You can also read