Influence of Waxes on Bitumen and Asphalt Concrete Mixture Performance - YLVA EDWARDS - KTH
←
→
Page content transcription
If your browser does not render page correctly, please read the page content below
Influence of Waxes on Bitumen and
Asphalt Concrete Mixture Performance

          YLVA EDWARDS
Abstract
This doctoral thesis consists of a literature review, presented in two papers,
and another six papers describing experimental studies of the influence of
different kinds of wax and polyphosporic acid on bitumen and asphalt
concrete mixture properties.
The literature review should give an extensive description of the field of
knowledge concerning wax in bitumen. Effects of wax in crude oil, bitumen
and asphalt concrete as well as test methods for studying these effects are
described. Theories behind possible mechanisms are also discussed, and
commercial wax as additive to bitumen for different purposes included.
The experimental parts comprise laboratory studies involving totally five
160/220 penetration base bitumens from different sources, two isolated
bitumen waxes, five commercial waxes and one polyphosphoric acid.
Asphalt concrete slabs, containing base or modified bitumen were prepared
and tested. Binder properties were evaluated using different types of
laboratory equipment, such as dynamic shear rheometer (DSR), bending
beam rheometer (BBR), differential scanning calorimeter (DSC), force
ductilometer, as well as equipment for determining conventional parameters
like penetration, softening point, viscosity, and Fraass breaking point.
Fourier Transform Infrared (FTIR) spectroscopy and Thin Layer
Chromatography (TLC-FID) were used for chemical characterization. The
binders were aged by means of the rolling thin film oven test (RTFOT) and
pressure ageing vessel (PAV) in combination. Asphalt concrete properties
were evaluated at low temperatures using the tensile strain restrained
specimen test (TSRST) and creep test at -25°C. Dynamic creep testing was
performed at 40°C, as well as complex modulus tests between 0 and 20°C.
Binder test results indicated that the magnitude and type of effect on
bitumen rheology depend on the bitumen itself, type of crystallizing fraction
in the bitumen and/or type and amount of additive used. Bitumen
composition was found to be of decisive importance.
Adding polyethylene wax or polyphosphoric acid, especially to a non-waxy
160/220 penetration grade bitumen, showed no or positive effects on the
rheological behaviour at low temperatures (decrease in stiffness) as well as
medium and high temperatures (increase in complex modulus and decrease
in phase angle). However, the corresponding positive effects could not be

                                      i
shown in dynamic creep testing (at 40°C) of asphalt concrete mixtures
containing these modified binders.
Adding FT-paraffin decreased the physical hardening index for all
bitumens. Also polyethylene wax and montan wax showed this effect for
some bitumens. Slack wax showed a large increasing effect on physical
hardening, and polyphosphoric acid none or a minor negative effect. No
correlation between physical hardening index (PHI) and wax content by
DSC was found in this study, involving both natural bitumen wax and
commercial wax.
Addition of the commercial waxes used showed no or marginally positive
influence on bitumen ageing properties for the bitumens and test conditions
used.
Comparing asphalt mixture test results to the corresponding binder test
results, the effects on asphalt mixtures from adding commercial wax or
polyphosphoric acid were less evident. Significant binder physical
hardening by BBR could not be confirmed by TSRST.
Keywords: bitumen, asphalt, additives, wax in bitumen, polyphosphoric acid in bitumen,
rheology, IR-spectroscopy, dynamic mechanic analysis (DMA), bending beam rheometer
(BBR), literature study, low temperature physical hardening, highway materials,
morphology, modified bitumens, temperature susceptibility, low temperature performance,
ageing, microscopy, chromatography, Fourier transform infrared spectroscopy, force
ductility, conventional binder tests, asphalt performance, tensile strain restrained specimen
test (TSRST).
iiThe doctoral thesis contains the following publications:
I Edwards Y., Isacsson U., STATE OF THE ART - “Wax in bitumen
Part 1 - Classifications and General Aspects”. Road Materials and
Pavement Design 6, 3 (2005) 281.
II Edwards Y., Isacsson U., STATE OF THE ART - “Wax in bitumen
Part 2 - Characterization and Effects”. Accepted for publication in
Road Materials and Pavement Design 6, 4 (2005). In press.
III Edwards Y., Redelius P., “Rheological Effects of Waxes in Bitumen”.
Energy & Fuels 17, 3 (2003) 511.
IV Edwards Y., Tasdemir Y., Isacsson U., “Rheological effects of
commercial waxes and polyphosphoric acid in bitumen 160/220
- High and medium temperature performance”. Submitted for
publication in Construction and Building Materials.
V Edwards Y., Tasdemir Y., Isacsson U., “Rheological effects of
commercial waxes and polyphosphoric acid in bitumen 160/220 - Low
temperature performance”. Accepted for publication in Fuel 85,
(2006). In press.
VI Edwards Y., Tasdemir Y., Isacsson U., “Influence of Commercial
Waxes on Bitumen Aging Properties”. Accepted for publication in
Energy & Fuels 19, 6 (2005) 2519. In press.
VII Edwards Y., Tasdemir Y., Isacsson U., “Effects of commercial waxes
on asphalt concrete performance at low and medium temperatures”.
Submitted for publication in Cold Regions Science and Technology.
VIII Edwards Y., Tasdemir Y., Isacsson U., “Influence of commercial
waxes and polyphosphoric acid on bitumen and asphalt concrete
performance at low and medium temperatures”. Submitted for
publication in Materials and Structures.
iiiTABLE OF CONTENTS
Abstract i
1. Introduction 1
2. Literature Review (Papers I and II) 3
2.1 What is wax and wax in bitumen? 3
2.2 Definition and classification of waxes in bitumen 4
2.3 Wax content in bitumen 5
2.4 Effects of wax in bitumen 7
2.5 Commercial wax as additive in bitumen 9
3. Materials and procedures (Papers III – VIII) 10
3.1 Bitumens and additives 10
3.2 Preparation of binder mixtures 11
3.3 Methods for binder mixture analysis 11
3.3.1 Dynamic mechanical analysis (DMA) 11
3.3.2 Bending beam rheometer test (BBR) 12
3.3.3 Force ductility 12
3.3.4 Differential scanning calorimetry 12
3.3.5 Fourier Transform Infrared Spectroscopy 13
3.3.6 Thin Layer Chromatography (TLC-FID) 13
3.4 Asphalt concrete mixtures 13
3.5 Methods for asphalt concrete mixture analysis 14
3.5.1 Tensile Stress Restrained Specimen Test 14
3.5.2 Dynamic creep test 14
3.5.3 Complex modulus test 15
3.5.4 Creep testing at low temperature 15
4. Results and analysis (Papers III – VIII) 15
4.1 Binder mixtures (Papers III-VI) 15
4.1.1 Empirical measurements (Papers IV and V) 15
4.1.2 DSC measurements 16
4.1.3 Rheological effects at high and medium temperatures 19
4.1.4 Rheological effects at low temperatures (+5°C to -25°C) 23
4.1.5 Effects on irreversible ageing properties (Papers IV, V and VI)26
4.1.6 Effects on low temperature physical hardening 30
4.2 Asphalt concrete mixtures (Papers VII – VIII) 32
4.2.1 Influence of additive on medium temperature performance 32
4.2.1 Influence of additive on low temperature performance 365. Discussions 38 5.1 Experimental 40 6. Conclusions 43 7. Acknowledgements 45 8. References 45 Abbreviations 47 Enclosures (Paper I-VIII)
1. Introduction
Natural wax is part of practically all bitumens and may in different ways
affect bitumen properties. Wax has for a long time been of great interest,
particularly regarding effects on bitumen quality and methods for
determining wax content. Opinions about wax in bitumen have varied over
the years and sometimes been contradictory. Already at the first world oil
congress in London 1933, the urgent need for a standard method for
determining the characteristics and performance of crystallizing and not
crystallizing bitumen wax was pointed out.
Through different types of phase transition, natural wax in bitumen may
influence binder properties to a larger or minor extent. In some cases, such
an influence may give rise to negative effects, as increased sensitivity to
cracking or plastic deformation in asphalt concrete pavements. In other
cases, wax may show positive effects on bitumen, such as increased
stiffness at higher temperatures, leading to improved resistance to rutting.
Different methods for determining wax contents give different values for the
same bitumen, which is one reason why the opinions concerning effects of
wax on bitumen properties have varied so much.
The presence of large wax crystals (macrocrystalline wax) in bitumen is
considered to be most problematic. However, waxes in road (penetration
grade) bitumen nowadays generally are microcrystalline and/or amorphous
and may contain branched, alicyclic and aromatic components with
heteroatoms, which renders crystallization considerably more difficult.
Commercial wax, such as FT-paraffin and montan wax, sometimes is added
to bitumen or asphalt concrete mixtures in order to obtain certain positive
effects. These products are typical so-called flow improvers mainly used for
reducing the asphalt mixing temperature in order to reduce energy
consumption and emissions, but also to improve workability. However,
other effects of different kinds also may result from such wax modification.
The laboratory investigations presented in this thesis were performed in
order to better understand the effects of waxes, natural bitumen wax as well
as commercial wax, on bitumen and asphalt concrete mixture properties.
The softer type of base binder used in the studies (penetration grade
160/220) was chosen, since it is frequently used in Sweden, and because the
effect of commercial wax (on for instance softening point and penetration)
has been reported to decrease with increasing hardness of the bitumen.

                                     1
Initially, natural wax in bitumen was the main interest of this project.
However, from the literature study (Paper I and II) and first laboratory
experiment (Paper III), it was found that natural wax in straight run bitumen
today, due to the refinery process, is low in content and of a kind which
should not be particularly harmful for binder or asphalt concrete properties,
that is to say, no increased sensitivity to, for instance, cracking or plastic
deformation in asphalt concrete pavements would normally appear due to
natural wax in the bitumen. However, wax could unintentionally be
produced through refining procedures like visbreaking or hydrocracking
(Redelius 2004).
In the case of blown bitumens and/or wax modified bitumens in road
construction (frequently used in the US and Canada in order to fulfil the
SHRP binder specifications), the effects on asphalt concrete properties may
vary considerably (Hesp 2004). Therefore, commercial wax as an additive
to bitumen became of larger interest in the project. In practice, as already
mentioned, commercial wax, like FT-paraffin or montan wax, is added to
bitumen in order to achieve certain preferred properties like reduced asphalt
mixing temperature and higher stiffness of the pavement. Papers IV–VIII
deal with the effects of such waxes (and polyphosphoric acid) on binder and
asphalt concrete mixture performance.
In the following sections, literature review and laboratory studies are
summarized and discussed. The work is described more in detail in the eight
enclosed papers.
22. Literature Review (Papers I and II)
The literature review on wax in bitumen is presented in two companion
papers, one on classifications and general aspects (Paper I) and another on
characterization and effects of wax (Paper II). Paper I contains some
sections on wax in petroleum and crude oil, where problems, methods and
effects on chemical and rheological performance of the oil are discussed. A
general description of mechanisms and effects of wax in bitumen is given,
and commercial wax as additive to bitumen is described. The chemical
composition and definition of different types of wax, in crude oil as well as
in bitumen, is dealt with. In Paper II, methods for the separation of wax,
chemical characterization, rheological methods, thermal analysis and
crystallography are included. Rheological effects on bitumen caused by wax
are described, and possible effects on asphalt concrete mixture performance
discussed.
The following short summary of the literature review mainly focuses on
some general findings concerning wax and the influence of wax on bitumen
and asphalt concrete performance.
2.1 What is wax and wax in bitumen?
The English term wax (from Anglo-Saxon weax) was originally applied just
to beeswax. In time, the term wax took on a broader significance and
became generally applied to wax-like solids and liquids found in nature, as
well as components occurring in these materials, such as hydrocarbons,
acids, alcohols, and esters with waxy character. Certain synthetic
compounds, which chemically are not waxes, but have waxy physical
character and technically can be used as a wax substitute, are also included
in the wax concept (Warth 1956). There are no evident distinctions between
natural and synthetic wax. In general, waxes are indissoluble in water,
difficult to dissolve in alcohol and can in melted state be mixed with oil.
Wax is used in a lot of industrial applications, such as production of candles,
polishes, crayons, and impregnating substances. Much of this wax comes
from petroleum, which is the largest single source of hydrocarbon waxes
(Musser et al., 1998). Petroleum wax is a by-product in the petroleum
industry. For instance, in order to produce lubricating oil with proper low
temperature properties, the wax has to be removed from the oil.
Paraffin rich crude oil is generally considered not quite suitable for bitumen
production, but lack of asphaltene rich crude oils may demand the use of
3paraffin naphthenic crude oils as base material at the production of bitumen.
However, the wax content as a rule does not constitute any criteria of
usefulness at bitumen production, as the wax varies with distillation grade
and type of crude oil. The choice of base material for bitumen production is
therefore judged by the heavy distillate residue rather than by the crude oil
wax content. It has been suggested that wax content in bitumen should not
be more than 3 %. If this is a relevant figure or not, depends on the
definition of wax in bitumen. Isolating wax from bitumen is a process
affected by several variables, which is currently not fully understood and
controllable. Furthermore, distinct definitions of different wax concepts do
not currently exist.
Wax in bitumen has for a long time been of great interest, particularly the
effect on bitumen quality and methods for determining wax content
(Boucher 1991, Such et al., 2000). Opinions about the effect of wax on
bitumen quality have varied over the years and sometimes been
contradictory (Barth 1962, Krom 1968, De Bats et al., 1975, Fritsche 1995,
Gawel et al., 1998, Planche et al., 1998, Butz et al., 2001, Edwards et al.,
2003). Negative effects of wax in bitumen are linked to crystallizing and
melting properties. Different types of wax may affect bitumen performance
in different ways.
2.2 Definition and classification of waxes in bitumen
The definition of bitumen wax has been formulated to facilitate the
distinction between harmful wax and less harmful or non-harmful. Often,
waxes in bitumen are divided into three general categories:
macrocrystalline, microcrystalline and/or amorphous (non-crystalline) wax.
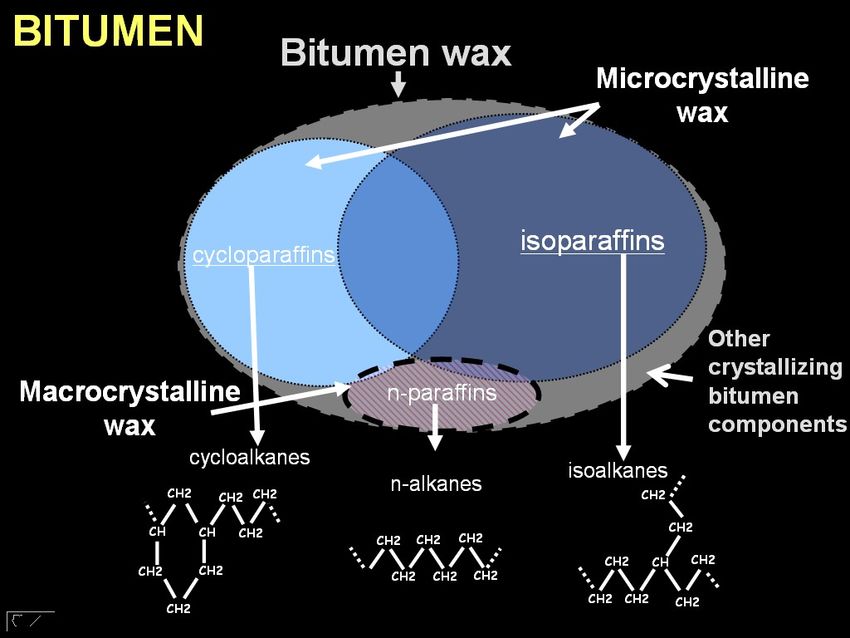
Macrocrystalline waxes in bitumen typically have about 30 carbon atoms
and crystallize in larger crystals. At 40 or higher numbers of carbon atoms,
smaller crystals are formed. Wax with branched carbon chains, aromatic and
alicyclic components or heteroatoms show difficulties in crystallizing and
are considered as amorphous, ductile or elastic (Boucher 1991). A
simplified schematic picture of wax in bitumen is shown in Figure 1,
including some general structural formulas for the main chemical
components of macro- and microcrystalline wax in bitumen. Composition
and properties of these waxes are further discussed in the literature review
(Paper I).
Certain components in the bitumen may affect the wax precipitation,
implying that different bitumens show different so-called wax-tolerance
4(meaning measure of penetration and viscosity etc. for de-waxed bitumen
after addition with selected commercial waxes according to specified
method (Boucher 1991)).
Figure 1. Schematic picture of wax in bitumen (Paper I).
The terms classical and non-classical wax also have been used. Non-
classical wax has been suggested for wax isolated from the SEC (Size
Exclusion Chromatography)-II fraction of the bitumen, in contrast to more
classical methods with mainly classical wax (n-alkanes) in exchange
(Redelius et al., 2002). Yet another classification term used for the total
amount of wax in bitumen is crystallizing fraction (CF) by DSC
(Differential Scanning Calorimetry).
2.3 Wax content in bitumen
Concerning wax content, different methods give different results, which is
true for wax quantity as well as quality (Fritsche 1995, Gawel et al.,
1997/1998, Krom 1968, Noel et al., 1970, Barth 1962, Edwards et al., 2003,
Mózes 1982, Boucher 1991). Over the years, wax content has been
5determined using a lot of different methods/procedures such as the ones
listed below:
• German method by Holde (DIN-52015) (destructive distillation
method);
• French method (NF-T66) ;
• Shell method SMS 1769 (SHRP-A-369);
• IR method (Van Doorn 2002, McKay et al., 1995) (the IR regions 750-
680 cm-1, 940-660 cm-1 and 1800-1530 cm-1 have been used);
• Iatroscan method (Unterleutner et al., 1998) (a correlation between
Iatroscan analysis and paraffin wax content according to DIN 52015 has
been found);
• Differential Scanning Calorimetry (DSC) (Brulé et al., 1990, Noel et al.,
1970, Such et al., 2000, Edwards et al., 2003, Lu et al., 2004);
• Adduct formation with urea (Boucher 1991, Mózes 1982, Barth 1962);
• Dilatation measurements (Krom 1968, Bahia et al., 1992);
• Brightness method (Obertür 1998) (the brightness of bitumen is
measured with reflectometer).
In the European binder specification EN 12591 (1999) “Bitumen and
bituminous binders – Specifications for paving grade bitumens”, two
methods for the determination of wax content are included, the distillation
method EN 12606-1 and the extraction method 12606-2. The specification
standard contains two different requirements (max. 2.2 and 4.5 weight-%,
respectively). EN 12606-1 is based on DIN 52015-1980 and EN 12606-2 is
based on AFNOR NF T 66-015-1984. In both the EN methods, paraffin wax
is defined as "mixture of hydrocarbons crystallizing in an ether/ethanol
50 % (V/V) mixture at temperatures down to -20 °C, obtained by a specified
process and having a range of melting of above 25 °C". Several European
countries (Austria, Denmark, Germany, France and the UK) have in their
national specification included wax requirement limits according to either of
the two methods. For Sweden, there is a special A-deviation concerning
viscosity at 60°C allowing higher requirements for viscosity (since low
viscosity may be an indication of wax in bitumen). However, the standard is
under revision in order to make it more harmonized. In the revised EN
12591 standard (to be published during 2007), both wax content and the
A-deviation have been deleted. Furthermore, performance-related
6specifications are under development within CEN TC 336 for possible
publication in 2010 or later.
The SHRP binder specification does not include any requirement on wax
content. However, Boucher (1991) was of the opinion that wax content as
well as wax-tolerance ought to be included, suggesting lower wax content
than wax-tolerance as a possible requirement.
One main conclusion to be drawn from the literature study is that wax
content in bitumen is not meaningful for specification purposes. Specifying
wax criteria on for instance DMA measurements should be more relevant
than specifying certain maximum values for wax content by any test method
known from the literature. Also, methods used in research for isolating wax
from bitumen should be described more in detail, and the wax components
obtained chemically characterized and defined in order to distinguish
between different types of wax.
2.4 Effects of wax in bitumen
Concerning the influence of natural wax on bitumen properties in practice,
there are conflicting opinions.
In laboratory studies on bitumen, the effects of wax on traditional bitumen
properties have been presented. For instance, it is well known that the
effects of wax on bitumen properties such as penetration and viscosity can
be illustrated in a Bitumen Test Data Chart (BTDC). In such a chart, the
transition range between penetration and viscosity is typical for wax in
bitumen, and the crystallization of wax is expressed through the fact that the
softening point calculated from viscosity values will be lower than the
experimentally determined softening point. Another simple method for
demonstrating wax in bitumen could be the difference in viscosity at 60°C,
when tested after heating or after cooling to this temperature. However,
these effects will show only in the case of n-alkane rich bitumen wax.
Rheometer analyses of different types have been part of many studies.
Bitumen analysed in these studies may be divided into three groups:
• Bitumen containing natural wax of different types;
• Bitumen to which natural wax, isolated from bitumen using different
procedures, is added;
• Bitumen to which commercial macrocrystalline or microcrystalline wax
is added.
7Some of the results obtained in this type of studies are listed below:
• The wax content and type of wax depend on origin (oil crude) and
production process. As a rule, distillates from crude oil of naphthenic
base type show low content of paraffinic hydrocarbons. Bitumen wax
most often is of microcrystalline and/or amorphous type.
• Parameters controlling the effects of wax are chemical composition and
rheological properties of the bitumen, amount of wax in the bitumen as
well as chemical composition and crystalline structure of the wax. The
effect of wax on bitumen is linked to its crystallinity and melting
properties. N-alkane rich crystallizing wax in bitumen, as a rule, gives a
sudden softening effect at higher temperatures and a stiffening effect at
lower temperatures. Crystallizing wax, with no or very low n-alkane
content, affects the bitumen to a lower extent and, above all, gives a
certain stiffening effect below the melting point of the wax.
• Decisive for the effect of wax is the temperature range of application
and the definition chosen for the wax in bitumen.
• One reason for the variation of opinions concerning effects of wax in
bitumen is the fact that different methods give different results. This is
true for wax quantity as well as wax quality. Several methods have been
used over the years. Determination of wax content by DSC is mostly
reported in recent literature.
• Different bitumens may contain larger or smaller amounts of wax,
without their properties being affected in a negative way.
• Few binder studies have been found comparable. Very few scientific
studies correlating wax effects in bitumen to the corresponding effects
on asphalt mixtures or pavements in the fields have been found.
Amount of heteroatoms, alicyclic and aromatic components in waxes, as
well as molecular distribution and carbon chain branching, greatly influence
the wax properties. Regarding the effect of wax on bitumen, the temperature
range used for the bitumen obviously is of crucial importance, since the
crystallizing parts belonging to the different types of waxes show different
phase transition areas (crystallization and melting) in bitumen, influencing
its rheological properties. Simplifying, waxes in bitumen reduce the
stiffness if they remain part of the liquid fraction, but stiffen the bitumen if
they separate into solid wax. However, wax in bitumen could disturb the
colloidal structure (orientation of polar groups), stability and homogeneity
8of the binder. Additionally, waxy bitumen may harden with time (physical
hardening), especially at lower temperatures, possibly initiating cracks in
asphalt pavements.
Apparently, the most feared influence of wax in bitumen is the sudden
decrease in viscosity due to the melting of crystallized wax, if this phase
transition should occur within a temperature range affecting the resistance to
permanent deformation of binder and asphalt pavement. Other possible
drawbacks are brittleness, physical hardening, poor ductility and poor
adhesion. However, results and experience concerning negative effects of
wax in bitumen are based mainly on laboratory studies on bitumen and
bitumen mixtures, and very few studies concerning effects of waxy
bitumens on pavement properties have been reported. Large effects on
binders due to wax content must not mean a large influence on asphalt
concrete mixture properties (Soenen et al., 2004).
2.5 Commercial wax as additive in bitumen
Addition of wax products as flow improver to bitumen has caught the
interest of particularly the German asphalt industry (Damm et al., 2002,
Butz et al., 2001). Wax as flow improver shows a softening effect on the
binder and asphalt mixture at higher temperature. The chief purpose of such
an addition is to reduce the mixing temperature of the asphalt in order to
reduce the energy consumption and emissions, but also to improve
workability and handling. Furthermore, lower void content due to improved
compaction should make the pavement more dense and durable. Additional
positive effects, such as improved resistance to deformation at higher
temperatures for bitumen and asphalt concrete have been reported as well.
However, low temperature performance and effects on fatigue and adhesion
properties are less investigated. Typical viscosity lowering additives used
for bitumen are FT-paraffin, montan wax based products, oxidized
polyethylene wax, thermoplastic resins and fatty acid amide. Molecular
weight distributions of such products differ a lot.
Already in 1922, the German chemist Frans Fischer and his Czech colleague
Hans Tropsch developed a procedure for producing liquid fuel from coal by
heating it under pressure, obtaining a mixture of carbon monoxide and
hydrogen gas. By leading the mixture over metal catalysts and pumping in
more hydrogen gas, chemical reactions start building up long hydrocarbon
chains. FT-paraffin for bitumen modification mainly consists of
hydrocarbon chains with 40 to 100 carbon atoms. The congealing point is
9about 100°C and the product melts between about 70 and 120°C. Montan
wax is a fossil ester wax obtained from brown coal. It shows a more
complicated chemical structure compared to FT-paraffin.
3. Materials and procedures (Papers III – VIII)
3.1 Bitumens and additives
Totally five bitumens of the same penetration grade, 160/220, and different
origins were used for the studies. Two of the bitumens were non-waxy and
the other three contained 2-4 %wt natural wax by DSC. Bitumen
characteristics are given in the different papers.
The additives used were two natural bitumen waxes, slack wax, FT-paraffin
(Sasobit), montan wax (Asphaltan B), polyethylene wax (Luwax A) and
polyphosphoric acid (Innovalt N200).
The natural bitumen waxes added were isolated from the SEC-II fractions of
the two waxy bitumens used. Characteristics of these bitumen waxes are
given in Paper III. The composition of the two bitumen waxes was
chemically different, containing no or very little n-alkanes.
The slack wax, used in Paper III, was a commercially available product
(Terhell Paraffin Type JA 201 from Hans-Otto Schumann GmbH& Co)
with a congealing point of 41-42°C and mainly composed of n-alkanes. A
very similar slack wax product (Sasolwax 4442 from Sasol) with a
congealing point of 43-47°C was used in Paper VIII. The reason for not
using the Terhell Paraffin in both studies was that for the later study in
Paper VIII, Terhell Paraffin was no longer available.
FT-paraffin and montan wax are so-called bitumen flow improvers with
congealing or solidification points of about 100°C. The products were
supplied by Sasol Wax GmbH and Romonta GmbH, respectively. As
already mentioned (cf. Section 2.5), such viscosity depressants sometimes
are used for asphalt pavements and mastic asphalt to reduce the mixing
temperature and thereby energy consumption and emissions. Certain
stiffening effects may be obtained as well.
The polyethylene wax is a type of product normally not used as additive to
bitumen, generally showing a congealing point of 92-100°C. It was supplied
for the study by Sasol.
10Finally, the polyphosphoric acid used is a bitumen modifier aimed for
improving high and low temperature performance. Obviously, this is not a
wax product. The reason for using polyphosphoric acid in some of the
studies (Papers IV, V and VIII) was that its effects on binder properties have
been reported to be similar to those of the commercial waxes used.
Characteristics are reported in Paper IV and V. The product was supplied
for the study by Rhodia.
3.2 Preparation of binder mixtures
Samples were prepared by adding calculated amount of additive to
approximately 250 g of bitumen, after which the sample was heated 30 min
at 155 °C. The samples were then placed in preheated blocks and
homogenized by shaking 90 s. Levels of 3 and 6 %wt wax were used. For
polyphosphoric acid the levels were 0.4 and 1 %wt.
In some cases (Papers IV-VI), samples were aged using the RTFOT (rolling
thin film oven test) followed by PAV (pressure ageing vessel) according to
SHRP specifications. Ageing in PAV was performed at 90°C. Aged binders
were evaluated by rheological and chemical measurements.
3.3 Methods for binder mixture analysis
Methods used for binder analysis were rheological methods (dynamic
mechanical analysis (DMA), bending beam rheometer (BBR), softening
point (EN 1427), penetration at 25°C (EN 1426), dynamic viscosity
(EN 12596), kinematic viscosity (EN 12595), breaking point Fraass (EN
12593) and force ductility (EN 13589)), differential scanning calorimetry
(DSC) and methods for chemical characterization (Fourier transform
infrared (FTIR) spectroscopy and thin layer chromatography (TLC-FID)).
These tests are described in Papers III-VI. Short descriptions of some of the
methods also are given in the following sections.
3.3.1 Dynamic mechanical analysis (DMA)
Rheological measurements were performed with temperature sweeps using
a rheometer (Rheometrics, RDA II). Experiments were carried out in the
temperature range of -30°C to +100°C. For the temperature range –30 to
+80°C, parallel plates with 8 mm diameter and gap 1.5 mm were used,
while for the range 10 to 100°C, the plate diameter was 25 mm and the gap
1 mm. The temperature sweeps started at the lower temperature, and the
temperature was increased by 2°C /min. A sinusoidal strain was applied, and
11the actual strain and torque were measured. Dynamic shear modulus │G*│,
phase angle δ, and G*/sinδ were calculated. The frequencies used were 10
rad/s for the temperature range of -30 to +80°C and 1 and 0.1 rad/s for the
temperature range of +10 to +100°C. In Paper III, also frequency sweeps
from 0.1 to 100 rad/s were performed.
3.3.2 Bending beam rheometer test (BBR)
Creep tests were carried out using the bending beam rheometer (TE-BBR,
Cannon Instrument Company). Test temperatures used were from -15 to
-35°C. A sample beam (125 mm long 12.5 mm wide and 6.25 mm thick)
was submerged in a constant temperature bath and kept at test temperature
for 60 min. A constant load of 100 g was then applied to the beam of the
binder, which was supported at both ends, and the deflection of centre point
was measured continuously. Creep stiffness (S) and creep rate (m) of the
binders were determined at a loading time of 60 s. Physical hardening after
24 h at -25°C was determined as well (Paper V).
3.3.3 Force ductility
Force ductility testing was performed at +5°C and 50 mm/min using a
Strassentest Baustoff system. Test specimens were stretched up to break or
until constant registered zero force. Maximum load was registered.
Deformation energy was calculated for original samples, but not for aged
samples, as break occurred in some cases before the recorded force reached
zero, and calculations therefore became not relevant.
3.3.4 Differential scanning calorimetry
DSC analysis was performed using a Mettler TA3000 system.
Approximately 15 mg of bitumen sample was weighed in an open pan and
placed in the DSC cell under nitrogen blanket. The sample was heated to
+110°C and then cooled at 10°C /min to –110°C, followed by heating to
+110°C at the same rate. For samples containing FT-paraffin, montan wax
or polyethylene wax, the heating temperature 160°C had to be chosen for
the dissolution to be completed. The method was used for determining the
DSC wax content of the prepared bitumen/wax samples. Both cooling and
heating cycles were used for calculation of the amount of crystallizing
material (crystallizing material in the cooling cycle plus re-crystallizing
material in the heating cycle, or melting material in the heating cycle). Other
parameters registered in the analysis were the starting temperature of
12crystallization, the wax melting out temperature and the temperature at
exothermic and endothermic peak heat flow. For the calculation of amount
of wax, a value of ∆H=121.3 J/g was used. This figure is an estimated
average value for natural wax in bitumen (Redelius 2004).
3.3.5 Fourier Transform Infrared Spectroscopy
An FTIR spectrometer, Infinity 60AR (Mattson resolution 0.125 cm-1), was
used to investigate functional groups of wax modified binders before and
after ageing. 5 %wt solutions of binder samples were prepared in carbon
disulfide. Scans were performed using circular sealed cells (ZnSe windows
and 1 mm thickness). All spectra were obtained by 32 scans with 5 % iris
and 4 cm-1 resolution in wave numbers from 4000 to 500 cm-1. Peaks of IR
absorbance from 750 to 680 cm-1 were used as an indication of amorphous
and/or crystalline structures in the binder due to wax content. Peaks at 1705
and 1030 cm-1 show bitumen carbonyl compounds and sulfoxides,
respectively, and were used to characterize bitumens of the wax modified
binders and as an indication of ageing.
3.3.6 Thin Layer Chromatography (TLC-FID)
Iatroscan MK-5 analyzer (Iatron Laboratories Inc., Tokyo, Japan) was used
for determining generic fractions of the wax modified binders before and
after ageing. 2 % (w/v) solutions of bitumen were prepared in
dichloromethane, and 1µl sample solution spotted on chromarods. Bitumen
was separated into four generic fractions (saturates, aromatics, resins and
asphaltenes) using n-heptane, toluene and dichloromethane/methanol (95/5),
respectively, in a three-step eluting process.
3.4 Asphalt concrete mixtures
Dense graded asphalt concrete with maximum aggregate size of 11 mm and
nominal binder content 6.2 % by weight was prepared for the studies in
Papers VII and VIII. A crushed granite material was used. The target air
void content was 2.0-3.5 % by volume. The mixtures were manufactured by
Nynas, and compacted to slabs using a laboratory rolling wheel compactor
(MAP Spechbach-le-bas, France). The final dimensions of each slab were
600 mm × 400 mm × 100 mm. Five slabs were prepared for the study in
Paper VII and eight for the study in Paper VIII. The temperature for mixing
and compaction was 155°C. From each slab, cylindrical specimens were
cored for different types of testing.
133.5 Methods for asphalt concrete mixture analysis
Methods used for testing asphalt concrete mixture properties were tensile
stress restrained specimen test (TSRST), dynamic creep test and complex
modulus test. Also, creep testing at -25°C was carried out for the NB and
slack wax modified NB mixture in Paper VIII. In Paper VII, TSRST
specimens were subjected to thermal ageing in a draft oven at 85°C.
3.5.1 Tensile Stress Restrained Specimen Test
For the TSRST equipment used, the main parts are environmental chamber,
load frame, screw jack, cooling device, temperature controller, and data
acquisition and control system. The test specimen is glued to two aluminium
plates and mounted in the load frame. Before performing the test, the
specimen was kept for one hour at approximately 2°C in the environmental
chamber to ensure that the inside temperature of the specimen was the same
as the temperature of the environmental chamber. The cooling rate was
10°C /h. The contraction of the specimen during the cooling process was
measured using two linear variable differential transducers (LVDT).
Initially, due to relaxation of the specimen, a relatively slow increase in
thermal stress can be observed. As the temperature is decreased to a certain
level, the thermally induced stress becomes almost linearly related to the
temperature, until fracture of the specimen occurs at the fracture
temperature and maximum stress value (fracture strength).
Specimens were also cooled unrestrained to –25°C and held for 3 and 24 h,
after which they were strained and tested according to the procedure
described above, starting at –25°C.
3.5.2 Dynamic creep test
This repeated load axial test was performed using a Nottingham asphalt
tester. Cylindrical specimens were exposed to uniaxial, periodically
repeated loading consisting of a 1-second loading (100 kPa) and a 1-second
rest. The test was carried out at 40ºC using 3600 pulses. The deformation in
the direction of the loading was measured as a function of the number of
loadings. The deformation remaining after testing was stated as permanent
deformation. The creep rate was calculated. The test was performed
according to a Swedish standard test method (FAS 468), using a loading
plate with diameter of 100 mm (i.e. smaller than the specimen diameter,
which was 150 mm).
143.5.3 Complex modulus test
Complex modulus was investigated using un-confined uniaxial tension and
compression tests. A servo-hydraulic testing system (MTS 810, Teststar II)
was used. The specimens were subjected to sinusoidal oscillating axial
loading in both tension and compression at constant (50⋅10-6 m/m)
amplitude. The specimens were tested at three temperatures (0, 10 and
20°C). At each temperature, a frequency sweep of nine frequencies (40, 32,
16, 8, 4, 2, 1, 0.5 and 0.1 Hz) was performed. Dynamic modulus, ⏐E*(ω)⏐,
and phase angle, ϕ(ω), were obtained as well as Poisson ratio, ν. Data were
used to construct dynamic modulus and phase angle master curves.
3.5.4 Creep testing at low temperature
Creep testing was performed at –25°C in uni-axial compression. The stress
was applied in one step and held constant for 240 s. The creep compliance
D(t) was calculated as
ε
D (t ) =
σ0
σ 0 = 1000 kPa
To ensure that thermal equilibrium, the specimen was kept at the testing
temperature for 3h before the creep test started. Measurements were then
made after 7, 11, 15, 19 and 23 h at the test temperature used.
4. Results and analysis (Papers III – VIII)
4.1 Binder mixtures (Papers III-VI)
4.1.1 Empirical measurements (Papers IV and V)
Adding commercial wax to bitumen showed an increase in binder stiffness
expressed in terms of penetration and softening point. The changes
increased with additive content but varied with bitumen source and type of
additive. Adding FT-paraffin showed the highest effect, followed by montan
wax and polyethylene wax. For instance, adding 6 % of FT-paraffin to non-
waxy bitumen made the softening point increase from 38 to 96°C and the
penetration decrease from 173 to 68 dmm. Adding polyphosphoric acid also
made the bitumen stiffer, but to a minor extent. Penetration index PI (by
15Pfeiffer and Van Doormal) was considerably increased by the addition of
commercial waxes, up to positive values of about 7. Although PI frequently
is used as approximation of expected temperature susceptibility for bitumen,
it could for waxy or wax modified bitumens give incorrect indications. The
formula used presupposes that the binder has a penetration value of 800
dmm at its softening point, which is normally not known and therefore
makes the PI very sensitive to variations in softening point. PI for base
penetration bitumens normally ranges from about -3 (for highly temperature
susceptible bitumens) to about +7 for highly blown (low-temperature
susceptible) bitumens.
Adding FT-paraffin or montan wax generally increased Fraass breaking
point of the binders (performed on aged samples), while adding
polyethylene wax or polyphosphoric acid showed smaller effects. The
largest increase in breaking point (6°C) was obtained from adding 6 % FT-
paraffin to two of the base bitumens. For no additive, but possibly PPA
(1 %), the breaking point was significantly decreased (Paper V). However,
as described in Paper VIII, adding polyethylene wax, slack wax and
polyphosphoric acid, respectively, to the non-waxy bitumen used decreased
the breaking point by approximately 3 to 4°C. In this case measurements
were performed on non-aged samples.
Viscosity at 60°C was decreased only by the addition of slack wax (Paper
VIII). In all other cases, viscosity was increased, and most by the addition of
FT-paraffin.
4.1.2 DSC measurements
DSC curves from bitumens are comparably complicated, since there may be
several overlapping phenomena to consider. The glass transition of bitumen
occurs over a large temperature range due to the complex mixture of
different molecules. Starting at a lower temperature range of the heat flow
DSC diagram, the glass transition shows as a shift in specific heat versus
temperature. The glass transition may be followed by a weak exothermic
effect caused by the cold crystallization of wax, which could not crystallize
through the cooling cycle due to limited mobility. This effect did not occur
for non-waxy bitumen containing commercial wax (FT-paraffin, montan
wax or polyethylene wax), but did occur for waxy bitumen with or without
commercial wax additive. Consequently, all three commercial waxes
crystallized through the cooling cycle and did not show any additional
exothermic effect in the heating cycle due to re-crystallization. Mixtures
16containing polyphosphoric acid did not show any thermal effects at all due
to the presence of this additive.
A broad endothermic effect may also be observed in the DSC heat flow
diagram due to the melting of crystallizing fractions or other phenomena.
This peak differs mostly depending on type of wax. For bitumen containing
slack wax, the peak was very pronounced, while for bitumen containing
solely natural bitumen wax, the peak profile was broader and showed no
pronounced peak (most likely due to lack of n-alkanes) or (if containing
some n-alkanes), the profile was a combination of a pronounced and broader
peak. This is illustrated in Figure 2, showing heating scans for binder
mixtures containing added natural bitumen wax or slack wax.
In the range of 60 to 90°C, natural bitumen wax is normally completely
melted out. However, for the commercial waxes used in these binder
studies, the melting out temperatures of the bitumen/wax mixtures were
higher (between approximately 100 and 130°C). For slack wax, the melting
temperature range was comparably narrow and the wax melted out at a
considerably lower temperature.
The determined crystallizing fraction (CF) by DSC was higher than
expected (natural wax content by DSC + added amount of wax) for all
binder mixtures containing FT-paraffin, which could mainly be explained
melting enthalpy
by the fact that the same enthalpy value ( wax (%) = ⋅100 )
121.3
was used for all binder samples. For instance, adding 6 %wt FT-paraffin to
non-waxy bitumen (NV) gave a CF value of 10.5 %. Binders containing
polyethylene wax, on the other hand, showed lower values and binders
containing montan wax approximately expected values. For binders
containing added bitumen wax or slack wax, the determined crystallizing
fractions were lower than expected, indicating certain dissolution of added
wax. (In this connection it is interesting to notice that if a microcrystalline
wax is added to melted macrocrystalline wax, it behaves like a solution. The
melting point of the wax mixture is increased and the crystallization of the
macrocrystalline wax inhibited (Warth 1956)). However, for the non-waxy
bitumen NB (Paper VIII), adding montan wax or slack wax gave higher
values than expected, indicating differences in chemical composition
between the two different non-waxy bitumens used. As already mentioned,
the binders containing polyphosphoric acid did not show any thermal effects
due to the presence of this additive.
17-30 -20 -10 0 10 20 30 40 50 60 70 80
-0.21 Temp [°C]
Heat Flow [W/g]
-0.23
-0.25
+ slack wax
-0.27
-0.29
-0.31 + bitumen
wax
-0.33
-30 -20 -10 0 10 20 30 40 50 60 70 80
Temp °C
Figure 2. Heat flow in heating cycle by DSC for bitumen ME containing
different types of wax (Paper III).
Depending on molecular weight distribution, the wax melting temperature
range differed between the different binder mixtures and was considerably
broader for montan wax and FT-paraffin wax than for polyethylene wax,
natural wax, and slack wax. Polyethylene wax showed a more narrow
melting temperature range, compared to FT-paraffin and montan wax,
starting at about 70°C. This is shown in Figure 3.
18Non-waxy Venezuelan
Heat Flow
NV
NV+6%S
NV+6%PW
NV+6%MW
-70 -50 -30 -10 10 30 50 70 90 110 130
o
Temperature, C
Figure 3. Heat flow by DSC, showing the melting process of bitumen NV
containing 6 %wt wax S, MW and PW, respectively (Paper IV).
Possible relationships between DSC and empirical testing parameters for
binders containing wax additive (FT-paraffin, montan wax or polyethylene
wax) were investigated in Paper IV. The best correlation was found between
temperature at exothermic peak heat flow by DSC and penetration index PI
(R2=0.92) or softening point (R2=0.86). Determined amount of crystallizing
fraction by DSC could best be correlated to force ductility maximum load at
+5°C (R2=0.72). The highest PI values (around 7) were obtained by the
addition of FT-paraffin or montan wax.
4.1.3 Rheological effects at high and medium temperatures
Rheological effects at high and medium temperatures of adding wax to
bitumen were studied using DMA (Paper III and IV). In DMA, the ratio of
peak stress to peak strain is defined as the complex modulus |G*|, which is a
measure of the overall resistance to deformation of the sample tested. The
phase difference between stress and strain is defined as the phase angle δ,
and is a measure of the viscoelastic character of the sample. For a
completely viscous liquid, the phase angle is 90° and for an ideal elastic
solid material, the phase angle is 0°. Complex modulus and phase angle of
bitumens are functions of temperature and frequency, which may be
19changed by the addition of different additives such as waxes, polymers and
acids.
In Paper III, bitumen mixtures containing added natural bitumen wax or
slack wax were studied, and in Paper IV mixtures containing commercial
wax or polyphosphoric acid. In both studies, magnitude and type of effect
were found to depend on the bitumen itself as well as type and amount of
additive. Adding slack wax gave markedly negative effects by lowering the
complex modulus at temperatures over about 40°C (cf. Figure 4). At higher
wax levels, a pronounced deviation from the smooth phase angle curve and
corresponding plateau effect for the complex modulus appeared at low
frequency. Adding bitumen wax (with no or very low n-alkane content)
gave no negative complex modulus lowering effect at higher temperatures.
However, stiffening effects occurred below about 50°C.
In the case of commercial waxes and polyphoshoric acid, temperature
sweeps showed the highest stiffening effects from adding polyethylene wax
or polyphosphoric acid in the temperature range from about +25 to 90°C (cf.
Figure 5). The high effect from adding polyethylene wax may partly be
explained by its more narrow melting temperature range compared to FT-
paraffin or montan wax, as well as the ability to form an elasticity
improving crystal and/or gel network. The effect was more evident at lower
frequency. None of the commercial waxes or polyphosphoric acid showed
any sudden complex modulus lowering effect at higher temperatures,
thereby possibly affecting the resistance to permanent deformation, as for
waxes containing n-alkanes. Stiffening effects occurred at temperatures
below 90°C. However, at temperatures higher than 90°C, FT-paraffin and
montan wax, being used as flow improvers, showed viscosity lowering
effects due to high melting temperatures of some parts of these waxes. Such
effects were not investigated in any of the studies.
In Paper III, the slope of the logarithmic function of the complex modulus
between 25 and 60°C was suggested as a factor of rutting sensitivity (cf.
Figure 6). However, both the positive stiffening effect in one part of the
temperature range and the sudden negative decreasing viscosity effect in the
other part of the temperature range will contribute to the decrease of such a
value, which may be misleading. Adding natural bitumen wax (Paper III) or
slack wax (Paper III and VIII) increased the negative slope value, most for
slack wax. Adding montan wax showed the same effect but to a minor
extent, while adding FT-paraffin, either slightly increased or decreased the
20slope, depending on base bitumen. Adding polyethylene wax or
polyphosphoric acid decreased the negative slope in all cases.
1.0E+09 90
1.0E+08
6% 80
Non waxy Venezuelan
1.0E+07 70
Phase angle [Deg]
1.0E+06 NV 60
NV + wax 36
G* [Pa]
1.0E+05 NV + wax 40 50
NV + slack wax
1.0E+04 40
1.0E+03 30
1.0E+02 G* 20
1.0E+01 10
1.0E+00 0
0 10 20 30 40 50 60 70 80 90 100
Temp[°C]
Figure 4. Influence on complex modulus and phase angle (frequency
1 rad/s) on the non-waxy bitumen NV due to the addition of natural bitumen
wax or slack wax (Paper III).
In Paper VIII, adding the same types of commercial wax, polyphosphoric
acid and slack wax to the non-waxy 160/220 penetration grade bitumen
(NB) showed similar effects by DMA as for the non-waxy bitumen NV
referred to above. However, the effects from adding polyethylene wax were
less pronounced for NB than for NV and the effects from adding slack wax
more devastating by a sudden decrease in complex modulus already at about
25°C. This is illustrated in Figures 4 and 5. Comparing curves in Figure 5,
the modulus of NB is less increased by the addition of polyethylene wax
than the modulus of NV over approximately the same higher temperature
range. The different behaviour probably is linked to differences in molecular
associations between wax and bitumen, indicating a stronger kind of
network for the NV mixture (lower phase angle). Concerning the influence
of slack wax on NV and NB, the differences between binder mixtures could
be due to several reasons such as melting point range, solubility and
chemical composition. This is further discussed in Chapter 5.
211.E+09 90
1.E+08 80
Non-waxy Venezuelan
1.E+07 70
Phase Angle [Deg]
1.E+06 60
1.E+05 50
G* [Pa]
G*
1.E+04 40
1.E+03 NV 30
NV+6%S
1.E+02 NV+6%PW 20
1.E+01 NV+6%MW 10
NV+1%PPA
1.E+00 0
10 20 30 40 50 60 70 80 90 100
o
Temperature [ C]
Figure 5. Influence on complex modulus and phase angle (frequency
1 rad/s) on the two different non-waxy bitumens NV and NB due to the
addition of commercial wax or polyphosphoric acid (Papers IV and VIII).
22Wax content [weight-%]
-0.060
0 1 2 3 4 5 6 7
-0.065
-0.070
Slope of log(G*)
-0.075
-0.080
-0.085
-0.090
WV + G36
-0.095 WV + G40
WV + slack wax
-0.100
Figure 6. SlopeW of logarithm
t t [ i ht %]
of complex modulus between 25 and 60°C for
one bitumen at different wax levels (Paper III).
4.1.4 Rheological effects at low temperatures (+5°C to -25°C)
The influence of adding wax or acid on the low-temperature performance of
bitumens was studied using DMA, BBR, and force ductility measurements.
Too high a binder modulus at low temperatures could make the asphalt
concrete sensitive to thermal and load induced cracking. A major factor
determining the susceptibility of a pavement to thermal cracking is the
ability of the binder to withstand or relieve thermal stresses before a certain
critical level is reached, where cracks appear.
DMA results (Paper III and V) showed that adding natural wax or slack wax
gave a stiffening effect down to at least -5°C, indicating possible lower
resistance to cracking at these temperatures. However, adding slack wax
showed a decreasing effect on the stiffness of the non-waxy bitumen at
temperatures lower than -5°C. BBR analysis at -15, -20 and -25°C gave the
same indication, i.e. the non-waxy bitumen became more flexible. Also,
according to results in Paper VIII, adding slack wax to non-waxy bitumen
(NB) decreased the BBR stiffness at -25°C. However, at -20°C, this
behaviour was not shown. Also adding PPA to this particular non-waxy
bitumen made the BBR stiffness decrease (at both -25 and -20°C).
Adding FT-paraffin, montan wax or polyethylene wax showed noticeable
stiffening effect at temperatures down to at least +5°C for all the bitumens
studied. Adding polyphosphoric acid also made the bitumens stiffer at lower
23temperatures but to a smaller extent. Adding of commercial waxes also in
some cases resulted in stiffening effects at temperatures lower than +5°C.
For the non-waxy bitumen NV, only adding FT-paraffin showed an
increasing effect on the complex modulus at low temperatures.
Effects at lower temperatures may also be illustrated by comparing effects
on the glass transition temperature, Tg, at peak loss modulus and maximum
rate complex modulus. Not for any binder mixture containing FT-paraffin,
montan wax, polyethylene wax or polyphosphoric acid was the effect of
adding the additive more than ±2°C on Tg by DMA. Adding slack wax
decreased Tg by 2 to 6°C. Also in the case of Tg by DSC, the effect from
adding commercial was in no case more than ±2°C.
In force ductility testing at 5°C, maximum force load was considerably
increased by the addition of FT-paraffin or montan wax, but not by
polyethylene wax or polyphosphoric acid. The highest value of maximum
load was shown for the binder mixtures containing both natural bitumen
wax and FT-paraffin wax. Consequently, adding FT-paraffin or montan wax
made bitumen stiffer and less cohesive or ductile at +5°C, while adding
polyethylene wax or polyphosphoric acid showed marginal effects. Adding
slack wax (Paper VIII) to the non-waxy bitumen NB made force ductility
increase to some extent. The influence at lower temperatures of adding wax
or polyphosphoric acid to waxy bitumen ME is illustrated in Figure 7,
showing similar indications at +5°C.
It could be mentioned that a fracture or fracture toughness test, such as the
low-temperature fracture test using BBR and sample bars with a starter
notch, as suggested by Iliuta et al. (2004), could be a method better suited
for measuring binder ability to withstand internal stresses leading to
cracking. The reason suggested for this by Iliuta et al. was that the BBR
fracture test is more directly related to the energy release during crack
propagation compared to tests that measure strength, strain-to-failure, or
ductility. Using the BBR fracture test method, addition of for instance 6 %
stabilized polyethylene has been shown to increase the fracture toughness at
-20°C by 50 %, although the binder stiffness was not greatly increased (Lee
et al., 1994). However, it is important to note that the polyethylene wax used
in the studies of this thesis is not of the same type as the one used in the
study by Lee et al. In studies of this thesis (Papers VII and VIII), no
correlation was found between BBR stiffness at –25°C and TSRST fracture
temperature (cf. Section4.2.1).
24In Paper III, it was found that effects due to natural wax or slack wax
content in bitumen shown in DMA temperature sweeps were well related to
the corresponding effects shown in DSC thermograms. In Paper V, this
proved to be true as well for FT-paraffin, montan wax and polyethylene wax
in bitumen, but not for polyphosphoric acid, showing no effects by DSC.
160
140
120 +6%S
100
Force (N)
80
+6%MW
60
+6%PW
+1%PPA
40
20
ME
0
0 20 40 60 80 100
Elongation (mm)
1.E+09 90
Middle East
80
G* 70
Phase Angle (Deg) y
60
ME
G* (Pa)
50
1.E+08 ME+6%S
40
ME+6%PW
ME+1%PPA 30
20
10
1.E+07 0
-30 -25 -20 -15 -10 -5 0 5
Temperature (oC)
Figure 7. Force ductility curves at +5°C, and DMA at temperatures below
5°C for non-aged waxy bitumen ME mixtures. For sake of clarity, the ME+6
% MW graph is omitted in the lower figure diagram (Paper V).
25You can also read


