U.S. Consumer & Economic Impacts of U.S. Automotive Trade Policies - FEBRUARY
←
→
Page content transcription
If your browser does not render page correctly, please read the page content below

U.S. Consumer & Economic
Impacts of U.S. Automotive
Trade Policies

Michael Schultz

Kristin Dziczek

Yen Chen

Bernard Swiecki

                                             FEBRUARY

   © CENTER FOR AUTOMOTIVE RESEARCH | 2019
                                               2019
                                                i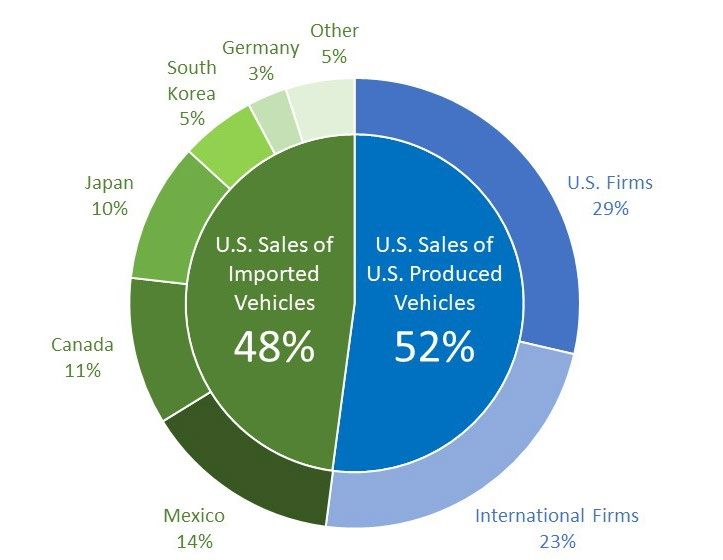
Table of Contents
Acknowledgments........................................................................................................................................ iii
Executive Summary ....................................................................................................................................... 1
Introduction .................................................................................................................................................. 3
Trade and the U.S. Automotive Industry ...................................................................................................... 3
Policy Specifics .............................................................................................................................................. 6
   Section 232 Tariffs on Imported Light Vehicles & Vehicle Parts ............................................................... 6
   USMCA ...................................................................................................................................................... 6
   Section 301 Tariffs on Imports from China ............................................................................................... 8
   Section 232 Tariffs on Imported Steel & Aluminum ................................................................................. 9
Summary of Methods ................................................................................................................................... 9
   Simulation Model ...................................................................................................................................... 9
   Simulation Inputs .................................................................................................................................... 10
   Section 232 Tariffs on Imported Light Vehicles & Vehicle Parts ............................................................. 10
   USMCA .................................................................................................................................................... 10
   Section 301 Tariffs on Imports from China ............................................................................................. 11
   Section 232 Tariffs on Imported Steel & Aluminum ............................................................................... 11
   U.S. Light Vehicle Production Capacity ................................................................................................... 12
Uncertain Impacts on Used Vehicles Prices, Repair, & Maintenance Costs ............................................... 12
Policy Scenarios........................................................................................................................................... 13
Results ......................................................................................................................................................... 14
Conclusions ................................................................................................................................................. 17
Works Cited ................................................................................................................................................. 18
Methodology Appendix .............................................................................................................................. 21
   The Simulation Model ............................................................................................................................. 21
   Compliance with USMCA Rules of Origin ................................................................................................ 22
   Section 232 and Section 301 Tariffs ........................................................................................................ 24
   Known Biases .......................................................................................................................................... 26
   Scenario Results Without Capacity Constraints ...................................................................................... 27

© CENTER FOR AUTOMOTIVE RESEARCH | 2019                                                                                                                i

List of Figures

Figure 1: Sourcing of U.S. Light Vehicle Sales, 2017 ..................................................................................... 4
Figure 2: Sourcing of U.S. Motor Vehicle Parts Imports, 2017 ..................................................................... 5
Figure 3: U.S. Consumer Price Indices for All Items-Except Food & Energy, and New Vehicles, 1994-2018 6

List of Tables

Table 1: USMCA Regional Value Content Requirements .............................................................................. 7
Table 2: Overview of U.S. Automotive Trade Scenarios Analyzed.............................................................. 14
Table 3: Source of Impacts, by Specific Policy, by Scenario ........................................................................ 15
Table 4: Change in U.S. Light Vehicle Sales and Prices Under Various U.S. Automotive Trade Policies..... 16
Table 5: Change in Dealership Revenue, Employment, U.S. GDP, and Overall U.S. Employment Under
Various U.S. Automotive Trade Scenarios ................................................................................................. 16
Table 6: Change in U.S. Light Vehicle Sales, and Prices Under Various U.S. Automotive Trade Policies --
Capacity Unconstrained .............................................................................................................................. 28
Table 7: Change in Dealership Revenue, Employment, U.S. GDP, and Overall U.S. Employment Under
Various U.S. Automotive Trade Scenarios – Capacity Unconstrained ........................................................ 28

© CENTER FOR AUTOMOTIVE RESEARCH                        | 2019                                                                              ii

Acknowledgments
The authors would like to thank Diana Douglass, and Jack Ombry at the Center for Automotive Research
for their assistance with this briefing. This research was sponsored by the National Automobile Dealers
Association.

For citations and reference to this publication, please use the following:

        Schultz, M., Dziczek, K., Chen, Y., and Swiecki, B. (2019). U.S. Consumer & Economic Impacts of
        U.S. Automotive Trade Policies. Center for Automotive Research, Ann Arbor, MI.

                                        3005 Boardwalk, Suite 200
                                          Ann Arbor, MI 48108
                                           www.cargroup.org

 CAR’s mission is to conduct independent research and analysis to educate, inform and advise
 stakeholders, policymakers, and the general public on critical issues facing the automotive
 industry, and the industry’s impact on the U.S. economy and society.

© CENTER FOR AUTOMOTIVE RESEARCH        | 2019                                                   iii
Executive Summary
A decision to impose tariffs on U.S. imports of autos and auto parts under Section 232 of the Trade
Expansion Act of 1962, as amended (hereafter, “Section 232 autos and auto parts tariffs”), could far
outweigh the impact of any previous trade action on the U.S. automotive industry, and on related U.S.
consumer prices, sales, and employment. Moreover, this is true even though the implementation of the
new United States Mexico Canada Agreement (USMCA) and other trade agreements will partially
mitigate the effects of these tariffs.
The Center for Automotive Research (CAR) looked at ten different policy scenarios, projecting different
combinations of policies and U.S. trade deals including: Section 232 autos and auto parts tariffs; the
USMCA; the current (as of January 21, 2019) Section 301 tariffs on Chinese imports; and the current
Section 232 steel and aluminum tariffs. Across all these policy scenarios, the impact on the U.S. new
vehicle market and the broader U.S. economy is (1) substantial and (2) nearly entirely determined by the
severity of the potential Section 232 tariffs on imported autos and auto parts.
Worst-case scenario
Under the scenario where (1) the USMCA is implemented in its current form, (2) other tariffs continue
unmodified, and (3) the Section 232 auto and auto parts tariffs are imposed except on Canada, Mexico,
and South Korea, the following will likely occur:
• A total of 366,900 U.S. jobs will be lost;
• U.S. light-duty vehicle prices will increase by USD 2,750 on average;
• U.S. new light-duty vehicle sales will drop by 1,319,700 units per year; and
• Many consumers will be forced into the used car market.
Importantly, in this worst-case scenario, the broad-based Section 232 autos and auto parts tariffs will be
responsible for over 90 percent of the total economic harm.
Other scenarios
A range of current and potential U.S. trade actions will impact the U.S. automotive industry going
forward – from the new USMCA, to current tariffs on imports from China and imported steel and
aluminum products from a wide range of trading partners, to the potential for new tariffs on imported
automobiles and auto parts. No matter how these policies are combined, they operate to raise
consumer prices for new vehicles, while lowering U.S. light vehicle sales, U.S. Gross Domestic Product
(GDP), and total and new vehicle dealership employment.
© CENTER FOR AUTOMOTIVE RESEARCH | 2019 1In every scenario considered new vehicle dealership revenue and employment fall. Dealerships are likely to experience a decline in revenue totaling between USD 6.1 billion and USD 43.6 billion, with associated employment losses of between 10,700 and 77,000 employees. For the average dealership, these losses correspond to a fall in revenue ranging from USD 362,000 to USD 2.6 million, with corresponding employment losses of 0.6 to 4.6 employees. In the broader economy, U.S. GDP is projected to fall between USD 6.0 billion and USD 30.4 billion and total economy-wide employment would decline by between 71,200 and 366,900 jobs. In addition, higher prices for new vehicles will impact the market for used vehicles as well as raise the price of repair and maintenance parts – thereby raising the overall cost of vehicle ownership for consumers. While there are many moving pieces in U.S. trade policy, the range of likely outcomes from (1) the implementation of the USMCA, (2) continuation of Section 301 China tariffs, (3) the Section 232 steel and aluminum tariffs, and (4) a range of possible Section 232 auto and auto parts tariffs are all profoundly negative for consumers, for new vehicle dealership revenue and employment, and for overall U.S. economic output and employment levels. © CENTER FOR AUTOMOTIVE RESEARCH | 2019 2
Introduction
Since the early days of the 2016 U.S. presidential campaign, President Trump pledged to revamp U.S.
trade policy. The first two years of the Trump Administration have seen dramatic and, at times, rapid
changes as the President seeks to prioritize U.S. manufacturing employment and investment. Many of
the enacted or proposed policy changes have profound impacts on the U.S. and North American
automotive industry, consumer prices for autos and auto parts, and the broader economy.

This briefing provides a quantitative analysis of current and proposed trade policy impacts on the U.S.
automotive industry and updates CAR’s Trade Briefing: Consumer Impact of Potential U.S. Section 232
Tariffs and Quotas on Imported Automobiles & Automotive Parts that was released in July 2018 (Schultz,
Dziczek, Swiecki, & Chen, 2018). This briefing expands on the July report and considers four specific
policies: The United States-Mexico-Canada Agreement (USMCA), Section 232 national security tariffs on
imported steel and aluminum, Section 301 tariffs implemented against imports from China, and the
potential for Section 232 national security tariffs on imported autos and auto parts. The Center for
Automotive Research (CAR) evaluated ten policy scenarios to estimate the combined effect of adopting
each of these four policies. The scenarios differ by which countries are assumed to be subject to the
potential auto and auto parts tariffs, and whether Canada and Mexico win exemptions from U.S. tariffs
on imported steel and aluminum.

Trade and the U.S. Automotive Industry
The U.S. market relies on imported light vehicles and automotive parts to meet consumer demand.
While the United States produced over 11 million light vehicles in 2018, light vehicle sales were 17.3
million. (IHS, 2018). In 2017, the dollar value of imported light vehicles and parts totaled over USD 340
billion (U.S.A. Trade Online, 2018). That year, 48 percent of all vehicles sold in the United States were
imported – with 25 percent imported from NAFTA partners: Canada (11 percent) and Mexico (14
percent) (IHS Markit).

NAFTA ranks third globally in terms of light- and medium-duty vehicle production and is the second
largest auto parts production region in the world. The North American light- and medium-duty motor
vehicle market is estimated to be worth USD 728 billion annually, which together represents roughly 28
percent of the global market for new vehicles (Ward’s World Motor Vehicle Data, 2017).

© CENTER FOR AUTOMOTIVE RESEARCH       | 2019                                                      3
Figure 1: Sourcing of U.S. Light Vehicle Sales, 2017

Source: CAR; U.S. International Trade Administration

Automakers and their suppliers throughout the NAFTA region are very interconnected. No vehicle
assembled in the United States is 100 percent U.S.-made; the average vehicle produced in the United
States relies on 40 to 50 percent imported parts and component content (National Highway Traffic
Safety Administration, 2018).

The share of non-U.S. parts content ranges widely across vehicles – and does not fall neatly across
companies or vehicle brands. Some vehicles assembled in the United States have low North American
and U.S. content, while certain models assembled outside the United States have high U.S. content.
Consider two generalized examples: A vehicle selling for USD 35,000 contains approximately USD 26,000
in value from materials, parts, and components. At 80 percent U.S. content for these inputs, a 25
percent tariff applied to all imported auto parts would add USD 1,300 to the vehicle’s price. For a U.S.
content level of 30 percent, the price increase would surpass USD 4,500. At the vehicle model level,
consumers are very sensitive to relative prices compared to other vehicles within the same class or
segment. Thus, even the relatively small price change experienced by the 80 percent U.S. content
vehicle could drive significant sales losses for a dealership.
The U.S. imported USD 148.8 billion in auto parts in 2017 with NAFTA partners accounting for nearly half
of all parts imports: 11 percent of all U.S. parts imports were from Canada and 37 percent from Mexico
(U.S.A. Trade Online). Canada and Mexico are also the destinations for 62 percent of U.S. motor vehicle
and parts exports (U.S. International Trade Administration, 2017).

Even for vehicles not assembled in the United States, automakers’ decisions on where to build their
products impact U.S. jobs and the economy. Imports from Canada and Mexico support many U.S. jobs
since there is a greater share of U.S. content in the average Canadian- or Mexican-built vehicle than
there is in any vehicle assembled in a non-NAFTA country. According to CAR’s estimates of NAFTA
content in vehicles sold in the United States, the typical Mexican-assembled vehicle includes between 20
and 30 percent U.S. and Canadian content. In contrast, the average vehicle imported from outside the
region has North American content of just 3.5 percent.

© CENTER FOR AUTOMOTIVE RESEARCH          | 2019                                                4
Figure 2: Sourcing of U.S. Motor Vehicle Parts Imports, 2017
                                          UK         ROW
                             Taiwan India 1%         11%
                               2%    1%

                             Thailand
                               2%                                          Mexico
                   South Korea                                              37%
                       5%
                            Germany
                               7%

                                    Japan
                                     11%

                                              Canada               China
                                               11%                  12%

          Mexico           China             Canada        Japan           Germany   South Korea
          Thailand         Taiwan            India         UK              ROW

Source: CAR; U.S. International Trade Administration

Due to the automotive industry’s reliance on complex cross-border supply chains, any new barriers to
trade will have a significant impact on the U.S. automotive industry, consumer prices, and U.S. sales,
employment, and economic output. Trade enables the U.S. automotive and parts industries to be
globally competitive. Because of international commerce, the U.S. industry can specialize in areas where
it has a comparative advantage and achieve greater economies of scale.

U.S. consumers benefit from trade both because there is a greater selection of models in the market,
and because trade helps to keep new vehicles affordable. While only 117 vehicle models were produced
in the United States in 2017, 354 models were available for U.S. consumers to choose from (IHS, 2018).
Among the 237 vehicle models without U.S. production, some models have sales that are just too low to
support local production: 49 of these models see fewer than 1,000 annual U.S. sales, and 95 less than
5,000 (IHS, 2018). U.S. consumers additionally benefit from improved affordability as trade increases
competition between automakers encourages specialization and improves economies of scale.

Figure 3 shows that while consumer prices have risen 86 percent since NAFTA came into being in 1994,
new vehicle prices have only gone up by 7 percent over the same period.

© CENTER FOR AUTOMOTIVE RESEARCH            | 2019                                              5
Figure 3: U.S. Consumer Price Indices for All Items-Except Food & Energy, and New Vehicles, 1994-
2018
260
Consumer Price Index (1982-1984 = 100)
240 257.6
220
200
180
156.5
160
140
146.3
120 137.6
100
1994
1995
1996
1997
1998
1999
2000
2001
2002
2003
2004
2005
2006
2007
2008
2009
2010
2011
2012
2013
2014
2015
2016
2017
2018
CPI: All items less food and energy CPI: New vehicles
Source: U.S. Bureau of Labor Statistics, 2018
Policy Specifics
Section 232 Tariffs on Imported Light Vehicles & Vehicle Parts
In May 2018, at the direction of President Trump, the U.S. Department of Commerce (DOC) opened an
investigation into whether U.S. light vehicle and parts imports are a threat to U.S. national security,
again using the authority granted Section 232 of the Trade Expansion Act of 1962. The DOC was
expected to issue findings and recommendations in February 2019, 1 after which the President has 90
days to decide whether to impose tariffs or quotas (or both) to adjust imports. President Trump has
frequently mentioned imposing new auto and auto parts tariffs of as high as 25 to 30 percent using
Section 232 as the tool to do so.
As part of the USMCA negotiations, both Canada and Mexico gained commitments from the United
States, which effectively exempt them from any Section 232 tariffs on vehicles or vehicle parts.
USMCA
The renegotiation of NAFTA began in August 2017, and the parties released the draft text of the USMCA
on September 30, 2018. President Trump, Canadian Prime Minister Trudeau, and Mexican President
Peña Nieto signed the agreement on November 30, 2018. Pending approval by each party’s national
legislatures, USMCA is projected to enter into force on January 1, 2020.
Alterations to the rules governing automotive trade are among the most significant changes in the move
from NAFTA to USMCA. The USMCA heavily modifies the automotive Regional Value Content (RVC)
requirement and introduces a North American steel and aluminum purchase requirement and a Labor
1
The report is due within 270 days of opening the investigation.
© CENTER FOR AUTOMOTIVE RESEARCH | 2019 6Value Content (LVC) requirement, both of which finished vehicles must additionally comply with to
receive tariff-free access to each country.
Under NAFTA, a 62.5 percent RVC was the only requirement necessary for vehicles and vehicle parts to
receive tariff-free market access. Before the USMCA, NAFTA automotive rules provided the strictest
rules of origin of any U.S. trade agreement. NAFTA includes extensive rules for calculating content,
provisions to prevent the use of roll-ups, 2 and the use of a tracing list – where the origin of items on the
list had to be traced back often to the raw materials used in their manufacture.
Under USMCA, the content requirement threshold for finished vehicles increases to 75 percent of the
net cost. However, this higher requirement is counterbalanced by provisions which explicitly permit the
use of roll-ups in the calculation of originating content and the abolishment of the tracing list.
The USMCA also extends the requirements for vehicle parts content. Whereas NAFTA had one content
requirement level, the USMCA creates three bins for vehicle parts, each with a different threshold. The
“Core Parts” bin has an RVC of 75 percent, the “Principal Parts” bin has an RVC of 70 percent, and the
“Complimentary Parts” bin has an RVC of 65 percent.
Table 1: USMCA Regional Value Content Requirements
Required
RVC Category Description of Category and Phase-In Period
Content
3-year transition, but automakers can appeal for a 2-year extension for a limited
Light Vehicles 75%
amount of production (~10%) if they have a “credible plan” to meet the new ROO
Includes engine, transmission, body & chassis, axle, suspension, steering (all 3-year
Core Parts 75% transition), and advanced batteries (5-year transition). Must be originating for the
vehicle to be originating.
Includes tires, glass, pumps & compressors, A/C, bearings & bearing housings, electric
motors used as primary source of propulsion, electric motors for electrical variable
Principal Parts 70%
transmission, electromagnets, starter motors & generators, bumpers, safety belts,
brakes, road wheels, radiators, mufflers, clutches, airbags, seats, and parts of seats.
Includes dies, locks, catalytic converters, valves, taps & cocks, electric motors &
universal AC/DC motors not exceeding 37.5W, DC motors & generators not
Complementary exceeding 750W, other batteries, distributors & ignition coils, electrical lighting,
65%
Parts windshield wipers/defrosters, sound recording/reproducing apparatus, switches,
insulating wiring sets, headlamps, electronic instruments & measurement
equipment.
Steel &
70% Day 1 rule, no transition.
Aluminum
Source: CAR summary of USMCA provisions on the USTR website
USMCA additionally requires that items in the “Core Parts” bin must be originating content for a finished
vehicle to meet the RVC. To comply with the core parts requirement, either each core part must
2
When roll-ups are employed, any item which meets the relevant content requirement threshold is counted as
wholly originating. For example, consider a car which uses an engine with 75 percent North American content,
facing an RVC threshold of 75 percent. On average, engines account for 11.5 percent of total car content. Without
roll-up, this engine would contribute 8.6 percent (75 percent x 11.5 percent) towards the content requirement. If
roll-up is permitted, however, the full value of the engine is counted as originating content, so it adds 11.5 percent
towards the RVC requirement.
© CENTER FOR AUTOMOTIVE RESEARCH | 2019 7individually meet the 75 percent content threshold or 75 percent of the total content of core parts value must be originating. Under this second option, which is called the “Super-Core” provision, a vehicle may contain some non-originating core parts, such as a transmission, and still comply with the core parts requirement. However, under either option, if a very high-value core part is non-originating, the vehicle will fail the core parts requirement. For example, if a vehicle is entirely made of North American content except for its engine (or battery in the case of an EV), the vehicle would fail the core parts requirement (because the engine is such a large share of core parts content), and therefore the vehicle would fail the RVC requirement and be subject to tariff. In addition to the RVC requirements for vehicles and vehicle parts, the USMCA includes a mandate for North American sourcing of metals used in vehicle manufacturing. For a vehicle to comply, at least 70 percent of an automaker’s expenditures on steel and aluminum purchased to produce vehicles in North America must be attributable to steel and aluminum products originating in North America. The USMCA also introduces an innovation in trade policy – the LVC requirement. Under the USMCA, for tariff-free market access, a minimum portion of the direct manufacturing labor incorporated into the production of the vehicle must involve a base wage rate of at least USD 16 per hour. For cars, the minimum is 40 percent, and for light trucks, the minimum is 45 percent. A credit of up to 10 percentage points towards the 40 or 45 percent LVC requirement is available through the employment of highly- compensated salaried workers in research & development or information technology. An additional credit of 5 percentage points applies to vehicles which use an engine, transmission, or battery sourced from a manufacturing facility with average direct manufacturing pay exceeding USD 16 per hour. In practice, the LVC is a mandate for U.S. or Canadian manufacturing employment, with additional incentives for locating salaried workers in the United States or Canada. Section 301 Tariffs on Imports from China In August 2017, the United States initiated an investigation into China’s acts, policies, and practices related to technology transfer, intellectual property, and innovation under Section 301 of the Trade Act of 1974. The United States Trade Representative (USTR) issued a report in March 2018 and found that China’s technology-transfer policies, licensing restrictions, outbound investments, and cybercrimes constitute unfair trading practices. The USTR points to China’s National Medium- and Long-Term Science and Technology Development Plan, the State Council Decision on Accelerating and Cultivating the Development of Strategic Emerging Industries, and the Made in China 2025 Notice as evidence of their claim. The finding enables the United States to pursue trade remedies through bilateral negotiations, filing disputes at the World Trade Organization (WTO), or initiating additional Section 301 investigations. The United States published a list of USD 50 billion in Chinese goods that it would target for tariffs, and China also released a list of USD 50 billion in U.S. goods on which it would impose additional tariffs if the United States went forward with its tariffs. In July 2018, the United States imposed 10 percent additional tariffs on the first tranche of USD 34 billion in Chinese imports; China quickly retaliated with tariffs on USD 34 billion in U.S. imports to China. Also in July 2018, China lowered its bound rate for light vehicle imports from 25 percent to 15 percent, and then quickly added a 25 percent tariff on U.S. light vehicle imports only – taking the duty for U.S. autos to 40 percent while the rest of the world pays 15 percent. In response to China’s retaliatory moves, the United States published a list in July 2018 of USD 200 billion of Chinese imports that it would target for additional tariffs, and China published a list of USD 60 © CENTER FOR AUTOMOTIVE RESEARCH | 2019 8
billion in U.S. goods on which it would raise duties in response. The second tranche of U.S. tariffs on USD
16 billion in Chinese imports went into effect in August 2018, and China quickly followed with tariffs on
USD 16 billion of U.S. imports to China. The third tranche of U.S. tariffs on Chinese goods, which took
effect in September 2018, included substantially all light vehicle parts and components as well as
automotive tooling and molds. The United States set the tariff rate on Chinese imports in the third
tranche at 10 percent, with a threat that the rate would increase to 25 percent if China did not act to
resolve the dispute. In November 2018, the United States and China agreed to a tariff truce and initiated
a series of bilateral talks aimed at addressing the trade dispute. The United States has said it would
automatically raise the third tranche tariff rate to 25 percent if the parties do not make progress in talks
before the end of March 2019. If this comes to pass, the impacts of Section 301 will be far more
significant than CAR has modeled, as this briefing is based on tariff rates in effect as of January 2019.

Section 232 Tariffs on Imported Steel & Aluminum
In January 2018, the DOC completed its investigation into whether imports of steel and aluminum
products constitute a national security threat under Section 232 of the Trade Expansion Act of 1962. As
a result, the United States imposed a 25 percent tariff on steel imports and 10 percent tariff on
aluminum imports on 1 June 2018 (U.S. Customs and Border Protection, 2018). The additional duty
applies to all affected steel and aluminum products from countries except for those the United States
agreed to grant an exemption, including Argentina, Australia, Brazil, and South Korea. As of December
20, 2018, the DOC has issued some 14,301 steel product exclusions out of 44,389 requests filed and 917
aluminum product exclusions out of 6,013 petitions filed (McDaniel & Parks, 2019).

As a result of the tariffs, prices for imported steel and aluminum increased, as did prices for U.S.-
produced metals due to increased demand. U.S. steel and aluminum price increases have increased the
costs of U.S. motor vehicle and parts output due to the usage of steel and aluminum as inputs in the
manufacturing process. The U.S. tariffs have made reportedly made U.S. steel the most expensive,
globally (Naughton & Deaux, 2018). Both Ford and General Motors disclosed in late 2018 that these
tariffs had cost them USD 1 billion each – approximately USD 700 for each vehicle they produced in
North America. Ford and GM’s input costs rose despite already predominantly using U.S.-sourced metals
(Carey & Klayman, 2018) (Carey & Shepardson, 2018).

The steel and aluminum tariffs have also increased the costs of vehicle and parts production in Canada
and Mexico. Due to the integration of the North American market, vehicle parts produced in one
country are often used for vehicle assembly occurring in another. As a result, broad-based cost increases
in one country, such as due to the U.S. tariffs on imported steel and aluminum, and retaliatory measures
enacted by Canada and Mexico, have increased metals prices in all three NAFTA countries.

Summary of Methods
Simulation Model
CAR developed a simulation model of trade in the U.S. automotive industry to evaluate the impact of
imposing additional tariffs on imported autos and auto parts. The analysis examines the substitution
away from imported autos and auto parts as a result of the potential trade action and assumes unitary
demand elasticity (i.e., changes in price yield proportionate changes in sales volumes and the total dollar

© CENTER FOR AUTOMOTIVE RESEARCH       | 2019                                                      9
value of the market remains unchanged). The analysis also assumes that producers will fully pass cost
increases along into consumer prices. The simulation provides direct estimates of the impacts on vehicle
prices, sales, dealership revenue, and motor vehicle and parts manufacturing. The direct effects are
used as input values to determine the economy-wide impacts using the Regional Input-Output Modeling
System (RIMS II) – a commercially-available model of the U.S. economy. The appendix presents
additional information on the modeling process.

Simulation Inputs
The impacts of each policy action are required inputs to the simulation model. The potential costs of
each policy were estimated using publicly available data. Where assumptions were required, CAR
utilized best-case scenarios for CAR’s modeling to avoid overstating and compounding potential
negative impacts. A brief discussion of the procedures for estimating changes in trade costs follow, with
additional information available in the methodology appendix.

Section 232 Tariffs on Imported Light Vehicles & Vehicle Parts
While intuitive to assign the tariffs imposed on imported vehicles and vehicle parts as costs to vehicle
sales or vehicle assembly, doing so would overstate the impacts of these tariffs. The reason is that it
would fail to differentiate between original equipment – the production of new vehicles or creation of
vehicle parts – and aftermarket use, such as a consumer purchasing a new muffler from a parts store.
Additionally, many of the goods subject to tariffs are used by multiple industries. CAR researchers
pursued numerous avenues of research to adequately adjust import figures to reflect only the costs
these tariffs would impose on the manufacture and sale of new vehicles.

For imported parts that are specific to light vehicles, an estimated 75 percent of imports (by value) are
destined for original equipment use (Automotive Aftermarket Suppliers Association, 2012) (International
Trade Administration, 2011) (International Trade Administration, 2009) (International Trade
Administration, 2007). Thus, when estimating the impact on the costs of U.S.-assembled vehicles, CAR
considered trade impacts upon 75 percent of imported vehicle parts by value. The total tariff-caused
increase in OEM parts cost is assigned to all vehicles assembled in the United States, with the effects on
the prices of vehicles both assembled and sold in the United States presented in our results. Cost
increases raise the price of U.S. vehicle exports, as well, but this briefing only presents effects on U.S.
consumers. For vehicles assembled outside of the United States, and imported from countries which are
subject to the tariff, the assumed tariff rate of 25 percent is applied to these vehicles as a consumer
price increase.

USMCA
Evaluating the impacts of the new rules of origin requirements present in USMCA requires first
estimating the North American content and the U.S. and Canadian labor content of all vehicles
assembled and sold in North America. While NAFTA content certification data exists, it is not available
for public or research use. CAR developed a method for estimating the required vehicle-model level
content figures using the model year 2018 the American Automobile Labeling Act data, and industry-
level government data available through the U.S. Census Bureau, Statistics Canada, and Instituto
Nacional de Estadística y Geografía. These estimates were cross-checked using trade data and

© CENTER FOR AUTOMOTIVE RESEARCH       | 2019                                                     10
proprietary databases. Additionally, one automaker provided limited feedback on the accuracy of CAR’s
estimates for their products.

CAR estimates that 47 vehicle models which are produced and sold in North America do not meet the
USMCA rules of origin requirements. Of these, 20 vehicle models are assembled in the United States,
and the remaining 27 vehicle models are assembled in either Canada or Mexico. Nearly all of the models
assembled outside of the United States met the NAFTA requirements – 24 of the 27 which would not
comply with USMCA do meet NAFTA requirements. Under USMCA, these 24 vehicle models would be
newly exposed to import tariffs assessed by each country. Passenger vehicles entering the United States
would be assessed at the most-favored-nation (MFN) tariff rate of 2.5 percent and cargo vehicles,
including light-duty pickup trucks and vans, are assessed a 25 percent tariff. Across these 24 vehicle
models, the average potential tariff cost for units complying with NAFTA but not USMCA would be USD
635. However, it is unlikely that many of these models will be brought into compliance with USMCA
rules. All non-conforming vehicles fail multiple criteria within the USMCA rules of origin, with the LVC
requirement particularly challenging to meet through supply chain alteration. Instead, the sale of these
vehicles in the U.S. market is likely to cease. Manufacturers have already announced plans to end either
North American production or U.S. sales for 12 of these vehicles.

Although the cost increase for these individual models which could lose tariff-free access is substantial
on a model-by-model basis, weighed against the total volume of vehicles imported from Canada or
Mexico, the average per vehicle imported cost would be far smaller. As a simulation input, the shift from
NAFTA to USMCA is incorporated as a slight increase in the U.S. consumer prices of vehicles assembled
in Canada or Mexico.

Section 301 Tariffs on Imports from China
As previously stated, approximately 25 percent of the value of imported vehicle parts is destined for
aftermarket applications. However, available data suggest that for vehicle parts imported from China,
far more than the typical 25 percent are destined for aftermarket use. To properly incorporate Section
301 tariffs against imports from China, CAR conducted additional research and meticulously reviewed
the most detailed data available. Following this review, where used, remanufactured, and non-
automotive vehicle parts were removed from consideration.

CAR researchers developed boundary conditions, where the full value of those imports which could not
be reliably categorized as relevant or irrelevant to the U.S. light vehicle production were wholly assigned
to use in U.S. light vehicle production or were considered to be entirely unrelated to U.S. vehicle
production. This exercise suggests that between 1 and 3 percent of the value of U.S.-assembled vehicles
is made up of vehicle parts imported from China. To evaluate the impacts of Section 301 tariffs, CAR
used the midpoint of this range – an assumption that 2 percent of the value of U.S.-assembled vehicles
stems from parts imported from China.

Section 232 Tariffs on Imported Steel & Aluminum
For the tariffs in effect against U.S. imports of steel and aluminum, CAR researched the consumption
patterns for steel and aluminum by U.S. industry. The U.S. vehicle and vehicle parts manufacturing
industries account for 26 percent of U.S. steel consumption and 31 percent of U.S. aluminum
consumption (statista) (Bray, 2018) (U.S. Census Bureau, 2015). Using full-year 2017 trade data (the

© CENTER FOR AUTOMOTIVE RESEARCH       | 2019                                                      11
latest available), with the exemptions granted to imports from Argentina, Australia, Brazil, and South
Korea, the steel and aluminum tariffs apply to USD 27.8 billion of steel and aluminum imports (U.S.A.
Trade Online). Given current consumption and import patterns and the exemptions granted to imports
from Argentina, Australia, Brazil, and South Korea, the steel and aluminum tariffs represent an indirect
tax of USD 1.4 billion on U.S. light vehicle and vehicle parts manufacturing, increasing costs of U.S.
vehicle assembly by 0.43 percent. Were Canada and Mexico also exempted from the steel and
aluminum tariff, the cost increase for U.S. light vehicle manufacturing would instead be 0.28 percent.

U.S. Light Vehicle Production Capacity
As the U.S. automotive industry does not have sufficient capacity to meet all U.S. consumer demand for
new vehicles, constraints are imposed upon the simulation’s predicted changes to total U.S. light vehicle
production. Open (underutilized) vehicle assembly capacity in the United States currently, as of January
2019, sits at 2.8 million units (Center for Automotive Research, 2018). This open capacity is not evenly
distributed across automakers or regions, does not align with historical production patterns, and mainly
is free due to a mismatch between the products these factories can produce, and those which U.S.
consumers are purchasing.

The simulation model enforces capacity constraints on a regional basis, using data on current open
capacity at each U.S. vehicle assembly plant and recent historical data on each region’s share of the
nation’s light vehicle manufacturing output. The simulation does not attempt to impose constraints
according to vehicle model, class, brand, or any other criteria beyond the production region’s current
and recent output level. This approach provides a generous accounting of open capacity, such that any
open unit could be used to produce any product regardless of vehicle architecture, the manufacturing
process, or facility ownership. The actual effects of capacity constraints would be more severe, and the
employment and economic outcomes more dramatic than what is shown in these scenarios.

Uncertain Impacts on Used Vehicles Prices, Repair, & Maintenance
Costs
Tariffs on new automobiles and automotive parts will impact the market for used vehicles, as well as
increase the price consumers pay to repair and maintain their existing vehicle due to higher parts prices.
Higher costs for vehicle purchases result in higher valuations of existing vehicles and longer service lives,
yet higher operating costs lower the value of existing vehicles and shorten their service lives. The dearth
of literature presently available makes it impossible to determine which of these effects is likely to
dominate. As an attempt at modeling these effects would rely upon assumed parameters, with little
guidance as to their appropriate values, we exclude the impacts on used vehicles and vehicle repair and
maintenance from our analysis.

Used vehicle prices typically follow a well-behaved and consistent depreciation pattern, with a given
vehicle’s value declining approximately 20 percent per year. Deviations from this generalized
depreciation curve result from macro-level shocks in the economy, such as substantial changes in fuel
prices, or shocks to used vehicle supplies, such as widespread destruction of vehicles due to a natural
disaster (Center for Automotive Research) (Yerger, 2010).

© CENTER FOR AUTOMOTIVE RESEARCH        | 2019                                                       12
The relative value of new and used vehicles is influenced by the relationship between used and new
vehicle purchases. The supply of used vehicles is highly inelastic, as additional supply primarily results
from either current vehicle owners bringing in-use vehicles onto the market to reduce their vehicle
holdings or to replace them with newly-manufactured vehicles, thereby expanding the in-use fleet.
Absent a dramatic change to household transportation needs or planned vehicle-ownership downsizing,
sold vehicles must be replaced.

A secondary effect of increasing vehicle prices is an extension of vehicle service lives. Multiple studies
indicate that the typical response to increasing vehicle prices – both for new vehicles, and for used
vehicles – is to extend the length of ownership for currently-held vehicles, resulting in fewer sales of
both new and used vehicles (Copeland, 2013) (Alberini, Bareit, & Martinez-Cruz, 2016) (Bento, Roth, &
Zuo, 2016). However, this effect is offset by the increase in vehicle repair and maintenance costs which a
tariff on imported vehicle parts will cause. Increases in vehicle operating costs have been conclusively
tied to shorter periods of ownership and lower vehicle valuations (Hamilton & Macauley, 1999).

A 25 percent tariff applied to all imports of automotive parts will increase the cost of aftermarket parts
by 8.3 percent. If an exemption were granted to Canada, Mexico, and South Korea, the impact would
instead be a 3.4 percent price increase. Should Canada, Mexico, South Korea, Japan, the United
Kingdom, and the post-BREXIT European Union all receive exemptions, this increase in aftermarket parts
prices declines to 1.7 percent. It is difficult to determine the impact these costs would have on the
providers of automotive repair and maintenance services. Parts and materials account for 100 percent
of the cost of DIY repair and maintenance, and, on average, 33 percent for commercial vehicle repair
and maintenance work. This result suggests that, as the relative cost of DIY would increase against
commercial providers, more consumers would opt for commercial vehicle repair and maintenance
services. However, budget tightening, whether due to price increases or falling incomes, has historically
resulted in a shift towards DIY work. With currently available information, no reliable conclusion can be
drawn as to the impacts of higher parts prices across DIY and “Do It For Me” repair and maintenance
(Automotive Aftermarket Suppliers Association, 2012) (U.S. Bureau of Economic Analysis, 2018) (U.S.
Census Bureau, 2018).

Policy Scenarios
To evaluate the effects of current and potential trade policy, the Center for Automotive Research
developed ten policy scenarios from the four trade policies considered (USMCA, Section 301 China
tariffs, Section 232 steel and aluminum tariffs, and Section 232 auto & auto parts tariffs). In all scenarios,
CAR assumes that the USMCA is ratified and enters into force and that Section 301 tariffs against
imports from China remain unchanged from their January 2019, product coverage and rates. The Section
232 tariffs on imported steel and aluminum are evaluated in either their current form, where Argentina,
Australia, Brazil, and South Korea are exempt or in an alternate form which also provides exemptions for
steel and aluminum imports from Canada and Mexico. This alternative is considered as both countries
had indicated that removal of the steel and aluminum tariffs as a pre-requisite for proceeding with
USMCA, and negotiations towards ending these tariffs or transitioning to a quota system for imports
from Canada and Mexico appear to be ongoing (Rappeport & Thrush, 2018).

© CENTER FOR AUTOMOTIVE RESEARCH        | 2019                                                       13
CAR considered five versions of Section 232 tariffs on autos and parts:
1. A broad-based tariff, where exemptions are granted only to Canada and Mexico, by the existing
and already in-force side letters to the USMCA, and South Korea, because that country has
successfully negotiated exemptions to prior protectionist trade measures;
2. A narrowly-focused tariff that applies only to vehicles and parts imported from the (post BREXIT)
European Union;
3. A narrowly-focused tariff that applies only to vehicles and parts imported from the United
Kingdom;
4. A narrowly-focused tariff that applies only to vehicles and parts imported from Japan; or
5. A broad-based tariff, but with exemptions for Canada, Mexico, South Korea, the EU, the UK, and
Japan.
Section 232 vehicle and parts Scenarios 2 through 5 are in keeping with the Trump administration’s
history of using tariffs – or the threat of tariffs – as a form of leverage in trade negotiations. Aside from
Canada and Mexico, which have broad exemptions to Section 232 auto and parts tariffs via the USMCA,
and South Korea, which has negotiated exemptions to other U.S. tariffs, the Administration is
negotiating new trade agreements with the E.U., with the U.K., and with Japan.
The ten policy scenarios which result from the combination of the five possible Section 232 auto and
auto parts tariffs, the USMCA, the Section 301 tariffs, and the two scenarios for the Section 232 steel
and aluminum tariffs are summarized in Table 2.
Table 2: Overview of U.S. Automotive Trade Scenarios Analyzed
Section Potential Section 232 Auto & Parts Tariffs @ 25%
Section 232
301 Steel &
China Alum. Canada & South All other
USMCA Tariffs Tariffs Mexico Korea EU UK Japan countries
1 Exempt Exempt
In place as of 11 January 2019
Implemented in Current Form
2 Exempt Exempt Exempt Exempt Exempt
Canada &
Include
Mexico
3 Exempt Exempt Exempt Exempt Exempt
4 Exempt Exempt Exempt Exempt Exempt
5 Exempt Exempt Exempt Exempt Exempt
6 Exempt Exempt
7 Exempt Exempt Exempt Exempt Exempt
Canada &
Exclude
Mexico
8 Exempt Exempt Exempt Exempt Exempt
9 Exempt Exempt Exempt Exempt Exempt
10 Exempt Exempt Exempt Exempt Exempt
Results
Across all ten scenarios, average vehicle prices rise and sales fall. New vehicle dealerships – and likewise,
the entire U.S. economy – are always, unambiguously harmed. Of note, the potential Section 232 tariffs
on imported light vehicles and vehicle parts are the single-largest factor in determining the magnitude
of adverse effects. In the worst-case scenario, where a broad-based Section 232 is adopted against
imported light vehicles and vehicle parts, exempting only Canada, Mexico, and South Korea, 90.5
percent of the total economic harm results from this single action. Under the scenario of least-harm,
wherein exemptions to the existent Section 232 steel and aluminum tariffs are expanded to additionally
exempt Canada and Mexico, and Section 232 tariffs on autos and auto parts only affect imports from the
© CENTER FOR AUTOMOTIVE RESEARCH | 2019 14United Kingdom, the vehicle and parts tariffs remain 42.8 percent of the total impact. The source of
impacts, by specific trade policy and scenario, are presented in Table 3.
Table 3: Source of Impacts, by Specific Policy, by Scenario
U
S
Section Section Percent of Total Impact Due to Each Policy, by Policy Scenario
M Potential Section
301 232 Steel &
232 Auto & Parts
C China Aluminum
Tariffs @ 25%
Tariffs Tariffs
A 232 Light 232 Steel and
USMCA 301 China
Vehicles & Parts Aluminum
Canada, Mexico, & South
Include Canada & Mexico
90.5% 2.2% 3.1% 4.1%
Korea Exempt
Only applies to EU 74.2% 6.1% 8.5% 11.2%
Only applies to UK 38.9% 14.5% 20.2% 26.5%
In place as of 11 January 2019
Implemented in Current Form
Only applies to Japan 76.8% 5.5% 7.7% 10.1%
Canada, Mexico, South
Korea, EU, UK, & Japan 73.1% 6.4% 8.9% 11.7%
Exempt
Canada, Mexico, & South
Exclude Canada & Mexico
91.8% 2.3% 3.2% 2.7%
Korea Exempt
Only applies to EU 77.2% 6.4% 8.9% 7.6%
Only applies to UK 42.8% 15.9% 22.2% 19.1%
Only applies to Japan 79.5% 5.7% 7.9% 6.8%
Canada, Mexico, South
Korea, EU, UK, & Japan 76.1% 6.6% 9.3% 8.0%
Exempt
Source: Center for Automotive Research estimates
Across the ten policy scenarios, the magnitude of trade policy impacts varies meaningfully. The price of
the average vehicle sold in the United States could rise as much as USD 2,750 or by slightly more than
USD 350, depending upon which policies are enacted. These price effects correspond to vehicle sales
losses from 183,000 to 1.3 million. These outcomes are summarized in Table 4.
© CENTER FOR AUTOMOTIVE RESEARCH | 2019 15Table 4: Change in U.S. Light Vehicle Sales and Prices Under Various U.S. Automotive Trade Policies
Section Change in Change in
Section 232 Overall Price/Unit Price/Unit
301 Steel & Potential Section 232 Change in Imported Domestic
China Alum. Auto & Parts Tariffs U.S. Sales Price/Unit ($ Vehicles Vehicles
USMCA Tariffs Tariffs @ 25% (units) dollars) ($ dollars) ($ dollars)
Canada, Mexico, & South
(1,319,700) $2,750 $3,700 $1,900
Include Canada
Korea Exempt
In place as of 11 January 2019
Implemented in Current Form
Only applies to EU (494,000) $1,000 $1,400 $650
& Mexico Only applies to UK (197,600) $400 $450 $300
Only applies to Japan (548,700) $1,100 $1,550 $700
Canada, Mexico, South
Korea, EU, UK, & Japan (425,400) $850 $850 $850
Exempt
Canada, Mexico, & South
(1,315,100) $2,750 $3,700 $1,900
Exclude Canada
Korea Exempt
Only applies to EU (482,100) $950 $1,400 $600
& Mexico
Only applies to UK (183,800) $350 $450 $300
Only applies to Japan (536,900) $1,050 $1,550 $700
Canada, Mexico, South
Korea, EU, UK, & Japan (408,800) $800 $850 $800
Exempt
Source: Center for Automotive Research estimates
In every scenario, new vehicle dealership revenue and employment falls, as does U.S. GDP and overall
U.S. employment. Dealerships are likely to experience a decline in revenue totaling between USD 6.1
billion and USD 43.6 billion, with associated employment losses between 10,700 and 77,000 employees.
For the average dealership, these losses correspond to a fall in revenue ranging from USD 362 thousand
to USD 2.6 million, with corresponding employment losses of 0.6 to 4.6 employees. In the broader
economy, U.S. GDP is projected to fall between USD 6.0 billion and USD 30.4 billion and total economy-
wide employment would drop between 71,200 and 366,900 jobs (see Table 5).
Table 5: Change in Dealership Revenue, Employment, U.S. GDP, and Overall U.S. Employment
Under Various U.S. Automotive Trade Scenarios
Change in U.S. Change
Dealership Revenue
U Dealership in
Section Section Potential
S Employment Level U.S. GDP Overall
301 232 Steel & Section 232
M Per ($ U.S.
China Aluminum Auto & Parts Total Per
C Dealershi Billions) Employ-
Tariffs Tariffs Tariffs @ 25% ($ Total Dealershi
A p ment
Billions) p
($1,000s) Level
Canada, Mexico, &
($43.62) ($2,596) (77,000) (4.6) ($30.40) (366,900)
Include Canada
South Korea Exempt
In place as of 11 January 2019
Implemented in Current Form
Only applies to EU ($16.33) ($972) (28,800) (1.7) ($10.80) (131,100)
& Mexico
Only applies to UK ($6.53) ($389) (11,500) (0.7) ($7.10) (83,900)
Only applies to Japan ($18.14) ($1,079) (32,000) (1.9) ($12.00) (145,800)
Canada, Mexico,
South Korea, EU, UK, ($14.06) ($837) (24,800) (1.5) ($18.00) (207,800)
& Japan Exempt
Canada, Mexico, &
($43.47) ($2,587) (76,700) (4.6) ($29.80) (360,500)
Exclude Canada
South Korea Exempt
Only applies to EU ($15.93) ($948) (28,100) (1.7) ($9.80) (119,600)
& Mexico
Only applies to UK ($6.08) ($362) (10,700) (0.6) ($6.00) (71,200)
Only applies to Japan ($17.75) ($1,052) (31,300) (1.9) ($11.00) (134,300)
Canada, Mexico,
South Korea, EU, UK, ($13.51) ($804) (23,900) (1.4) ($16.70) (193,000)
& Japan Exempt
Source: Center for Automotive Research estimates
© CENTER FOR AUTOMOTIVE RESEARCH | 2019 16Conclusions CAR expanded its past research into the effects of potential U.S. trade policy actions to consider ten policy scenarios that combine trade policies implemented as of January 2019 and potential near-term U.S. trade policy changes. Across these policy scenarios, the variation in impacts on the U.S. new vehicle market and the broader U.S. economy is substantial, but near wholly determined by the severity of potential Section 232 tariffs on imported autos and auto parts. In the worst-case scenario, the price of the average vehicle sold in the U.S. would increase by USD 2,750. In the least severe case, this average price increase would be a comparatively small USD 350. The difference between these extremes is almost solely determined by whether automotive Section 232 tariffs are broad-based or highly targeted to only a few countries. Broad-based automotive tariffs threaten more than 366,000 jobs. While the trade restrictions adopted or under consideration are intended to assist U.S. workers, these policies are likely to be extremely disruptive to and negative for the U.S. economy. © CENTER FOR AUTOMOTIVE RESEARCH | 2019 17
Works Cited
Alberini, A., Bareit, M., & Martinez-Cruz, A. (2016). The Impact of Emissions-Based Taxes on the
        Retirement of Used and Inefficient Vehicles: The Case of Switzerland. Zurich: Center of Economic
        Research at ETH Zurich Economics Working Paper Series.

Armington, P. S. (1969). A Theory of Demand for Products Distinguished by Place of Production. IMF
       Staff Papers: Volume 16 No. 1, 159-178.

Automotive Aftermarket Suppliers Association. (2012). Automotive Aftermarket Status Report.

Bento, A., Roth, K., & Zuo, Y. (2016). Vehicle Lifetime Trends and Scrappage Behavior in the U.S. Used Car
        Market. Working paper.

Bray, E. L. (2018, January). Mineral Commodity Summaries: Aluminum. U.S. Geological Survey. Retrieved
         from https://minerals.usgs.gov/minerals/pubs/commodity/aluminum/mcs-2018-alumi.pdf

Bureau of Industry and Security Office of Technology Evaluation. (2018, January). The Effect of Imports
       of Aluminum on the National Security. U.S. Department of Commerce. Retrieved from
       https://www.bis.doc.gov/index.php/documents/aluminum/2223-the-effect-of-imports-of-
       aluminum-on-the-national-security-with-redactions-20180117/file

Carey, N., & Klayman, B. (2018, July 25). Tariffs ding Detroit automakers' profit forecasts, stocks hit.
        Retrieved from Reuters: https://www.reuters.com/article/us-autos-results/tariffs-ding-detroit-
        automakers-profit-forecasts-stocks-hit-idUSKBN1KF1FW

Carey, N., & Shepardson, D. (2018, September 26). Trump metals tariffs will cost Ford $1 billion in
        profits, CEO says. Retrieved from Reuters: https://www.reuters.com/article/us-ford-motor-
        tariffs/trump-metals-tariffs-will-cost-ford-1-billion-in-profits-ceo-says-idUSKCN1M61ZN

Center for Automotive Research. (2018). Analysis based on LMC Automotive production and capacity
        data.

Center for Automotive Research. (2018). Book of Deals. Ann Arbor.

Center for Automotive Research. (n.d.). Unpublished, internal research on vehicle values and
        depreciation by vehicle age.

Copeland, A. (2013). Intertemporal Substitution and New Car Purchases. Retrieved from
       http://copeland.marginalq.com/res_doc/auto_dynamics.pdf

Donelly, W. A., Johnson, K., Tsigas, M., & Ingersoll, D. (2004). Revised Armington Elasticities of
        Substitution for the USITC Model and the Concordance for Constructing a Consistent Set for the
        GTAP Model. Washington, D.C.: U.S. International Trade Commission Office of Economics.

Donelly, W. A., Johnson, K., Tsigas, M., & Ingersoll, D. (2004). Revised Armington Elasticities of
        Substitution for the USITC Model and the Concordance for Constructing a Consistent Set for the
        GTAP Model. Washington, D.C.: U.S. International Trade Commission Office of Economics.

© CENTER FOR AUTOMOTIVE RESEARCH       | 2019                                                     18
You can also read