Poughkeepsie Plenty: A Community Food Assessment - Discussion Brief #11 - Winter 2014
←
→
Page content transcription
If your browser does not render page correctly, please read the page content below
Ce n t e r f o r R es e a r ch , R eg i o n a l E d u c at i o n a n d O u t r e ach

          S tat e u n i v e rs i t y o f n e w yo r k at n e w pa lt z

                Poughkeepsie Plenty:
                A Community Food Assessment
                Discussion Brief #11 – Winter 2014
                Leonard Nevarez, Susan Grove, KT Tobin and Joshua Simons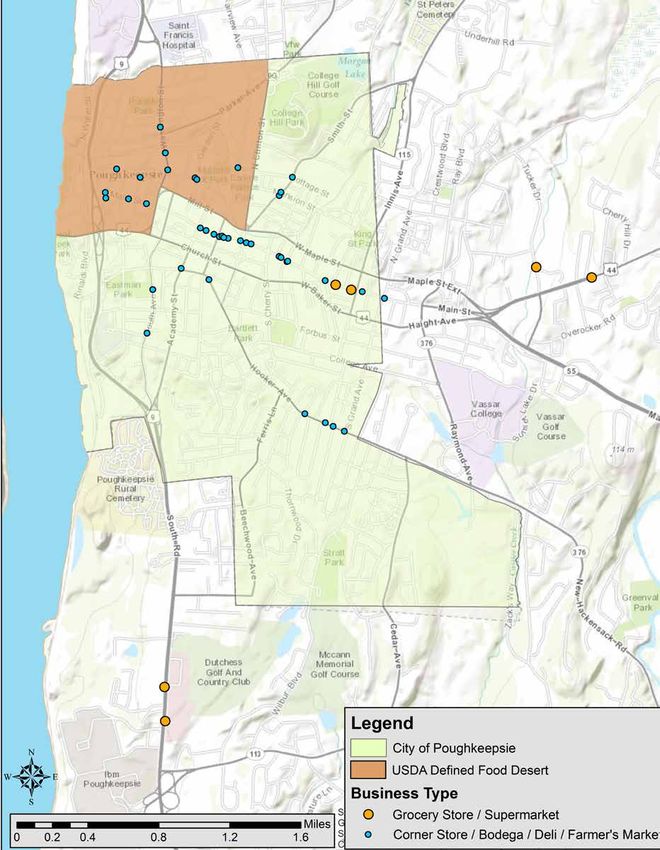
Food insecurity? In the language of the federal government,
    this is what we call it when a person or a family has
    “limited or uncertain availability of nutritionally adequate
     and safe foods or limited or uncertain ability to acquire
     acceptable foods in socially acceptable ways.”

                             Poughkeepsie Plenty is the community collaboration formed to do
                             something to solve this problem. It seeks to transform the City of
                             Poughkeepsie into a place where everyone can secure, prepare, enjoy,
                             and benefit from healthy food. This brief presents findings of research
     More simply stated:     done in 2012 to define the dimensions of problems we face in trying to
          food insecurity    assure food for the food insecure, and offers locally-focused policy
                             proposals to address it.
     exists when people      We found:
      don’t have or can’t    • Over one in four (26 percent) City of Poughkeepsie households experienced
      get enough decent         food insecurity including eleven percent that are food insecure with hunger.
                             • Poverty is a key contributor to food insecurity. A majority (60 percent) of all
    food to eat. However        City of Poughkeepsie households earning $15,000 or less annually were
    put, food insecurity –      food insecure.
                             • Food insecure households rely on a number of social programs to help them
     we show here – is a        afford food. In 2012, about one quarter (24 percent) of city households had
       troubling problem        received food stamp benefits and 15 percent got emergency food supplies
                                from a church, food pantry, or food bank in the previous year. Low income
            in the City of      households were much more likely to need these services: 75 percent of
           Poughkeepsie.        households with an annual income of less than $15,000 received
                                Supplemental Nutrition Assistance Program (SNAP) benefits, formerly
                                known as food stamps, and 44 percent needed emergency food supplies.
                             • The location of food stores is a leading contributor to food insecurity. The
                                city has only two grocery stores, both located near the eastern edge of the
                                city limits. About one in ten (12 percent) of city households did not make
                                most of their food purchases at supermarkets or grocery stores. Indeed,
                                two of the city’s ten census tracts qualify as food deserts.
                             • In this environment, access to transportation is a critical factor. Nearly eight
                                in ten (79 percent) of city households that usually drive a car to a grocery
                                store are food secure. In contrast, food insecurity characterizes 44 percent
                                of the city households that rely on some other means of transportation to
                                go food shopping.

2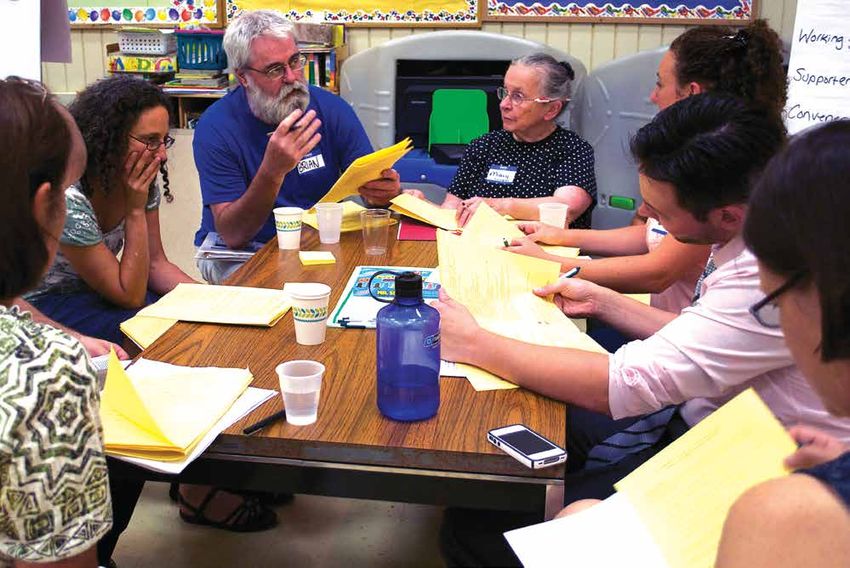
• Smaller food retailers represent significant sources of food for the
                                        city’s population. About one in twenty (4 percent) of all city households
                                        reported buying most of their food from smaller establishments like
                                        corner stores, bodegas, and delis. A similar number (6 percent) reported
                                        purchasing most of their food from restaurants, fast-food, and
                                        take-out establishments.
                                     • Corner stores and other small food retailers are particularly prevalent
                                        in the city’s downtown and western areas. These establishments are
                                        important foundations for ethnic entrepreneurialism and neighborhood
                                        safety, and the food they sell isn’t always more expensive when
                                        compared with supermarkets. However, the product variety, availability
                                        of fresh produce, and the quality and freshness of the food they sell is
                                        often problematic.
                                     • When choosing where to buy food, residents say it’s very important that
                                        a store: be easy to get to (69 percent), have better prices (65 percent),
                                        have healthy food (64 percent), and is close to home or work (64
                                        percent). One third (33 percent) said the store’s acceptance of food
                                        stamps is very important in their consideration of where to shop.
                                     • Chief reasons cited for buying certain foods, other than low cost,
                                       were the ease of food preparation and storage. For about half of
                                       households, food purchases were guided by priorities for particular
                                       kinds of foods: food from your family’s background (50 percent),
                                       brand name (48 percent) and organic (45 percent).
                                     • Residents care about what they eat: 84 percent read food labels
                                        sometimes or more frequently and 93 percent think that it is important
                                        for their stores to have healthy foods. Significantly, the likelihood that
                                        a household would prioritize choosing nutritious or organic food
                                        didn’t vary by income level, indicating that food security seems more
The community food assess-              connected to lack of material resources and geographic mobility than
ment research, conducted in             to different food values or nutrition knowledge.
2010-2012, focused upon the
situation of residents’ food
security and was guided by          Established in 2010, the members of the teams guiding the
three research questions:           Poughkeepsie Plenty research included the Poughkeepsie Farm
                                    Project, Cornell Cooperative Extension of Dutchess County, the
1. H
    ow do residents access         Dutchess County Department of Health, Dutchess Outreach, Vassar
   healthy food in the City of      College, and many other agencies, individuals, and local businesses.
   Poughkeepsie?                    The initial goals of the Poughkeepsie Plenty initiative were: to create
2. H
    ow do City of Poughkeepsie     a research-based community food assessment (CFA); to draw upon
   residents make decisions about   community participation and input to create a plan (for improving
   what to eat?                     the city’s food system) using neighborhood and citywide action
3. What constrains City of         planning forums; and, to establish a community food coalition to
    Poughkeepsie residents’         facilitate and oversee the implementation of the action plan through
    food choices?                   coordinating projects, and monitoring and advocating for policy.

                                                                                                                     3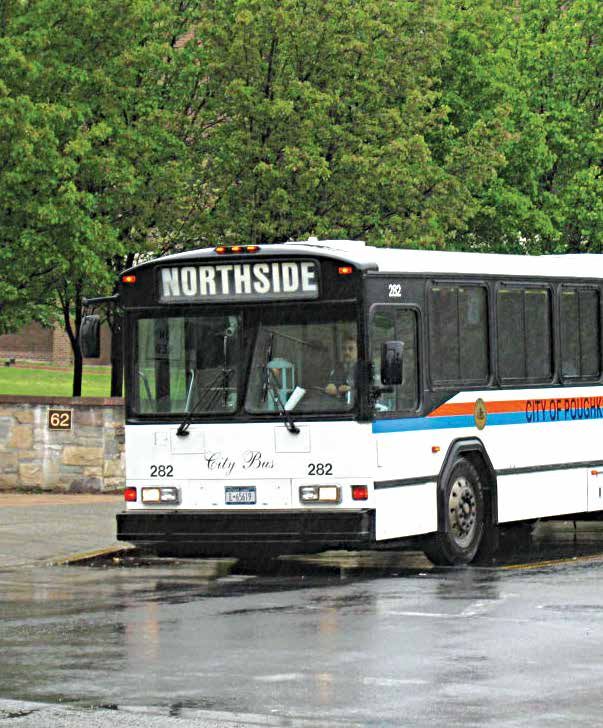
A door-to-door survey was administered in the
    City of Poughkeepsie, generating citywide measures
    for food security, food access, and food preferences.
                                                               5| Consumption
                                                                     Consumption highlights how households
                                                                     prepare and eat food. Various household
    In order to contextualize this baseline data for the             characteristics are relevant, such as money
    city as a whole, seven focus groups were conducted               for food purchases, transportation to stores
    with defined segments of the city’s food insecure                and other food providers, cooking skills,
    at-risk population. Fieldwork, archival research,                nutritional awareness, and dietary and cultural
    further interviews, and secondary data analysis                  preferences for certain foods.
    were conducted to assess those broader features of
    the city’s food system that shape households’ food
    access and food preferences.                               6| Waste
                                                                     Uneaten food and product packaging end up
                                                                     in the waste stream. Issues include landfill
    In addition to the idea of food insecurity, a structured         capacity, composting, recycling infrastructure
    picture of the food system guided the CFA’s meth-                for packaging and food by-products (like
    odology. A food system is the organized chain of                 cooking oil), and other destinations for unused
    activities beginning with food production and ending             food (such as food made informally available
    with the disposal of food waste.                                 for “dumpster diving”).

    It has seven dimensions that impact or result from
    the character, quality, marketing, and availability
                                                               7| Policy
                                                                    This is a cross-cutting domain. Whereas the
                                                                    prior dimensions comprise a linear chain of
    of food.                                                        food transformation, policy may intervene at
                                                                    various points within and between links of this
    1| Production
        Exemplified by agriculture and farming, produc-
        tion refers to where food originates. Issues
                                                                    chain. Policymakers can promote a variety of
                                                                    social goods or harms through subsidy, penal-
                                                                    ization, support, or inaction on issues such as
        involve the ways in which food production is
                                                                    corporate profit, wage and social safety net
        organized, such as industrialized methods and
                                                                    policies, hunger prevention, small-farm viability,
        alternatives, organic farming, and local sourcing.
                                                                    and environmental sustainability.

    2| Processing
         Much of our food is processed, altering it from
         its raw form to the form that people actually
                                                               In an era of agribusiness and global food produc-
                                                               tion, food systems necessarily cross city limits.
                                                               By emphasizing the City of Poughkeepsie’s urban
         obtain. Issues entail food products’ pre-prepa-
                                                               food system, the Poughkeepsie Plenty community
         ration (with consequences for consumer conve-
                                                               food assessment calls specific attention to the local
         nience and nutrition), packaging, and marketing.
                                                               aspects of three domains in the food system: distri-

    3| Transportation
                                                               bution, consumption, and policy. These provide
         As suggested by the idea of “food miles,” food        the foundation for answering one of our primary
         usually travels long distances before consumers       points of focus, namely, how do people experience
         access it. Issues include the geographical            Poughkeepsie’s food system?
         scale of consumer markets that farmers and
         food businesses may reach — international,            Food security is defined by the United States
         national, regional or local — and the impact          Department of Agriculture (USDA) as access by
         of transportation infrastructure on prices and        all people at all times to enough food for an active,
         environmental sustainability.                         healthy life. At a minimum, food security requires
                                                               the ready availability of nutritionally adequate and

    4| Distribution
         There are different settings in which consumers
         can access food products. Most often this is
                                                               safe foods and assured ability to acquire acceptable
                                                               foods in socially acceptable ways (that is, without
                                                               resorting to emergency food supplies, scavenging,
         through retail markets, but may also be through       stealing, or other coping strategies).
         schools and institutions, emergency providers,
         and even backyard or community gardens.

4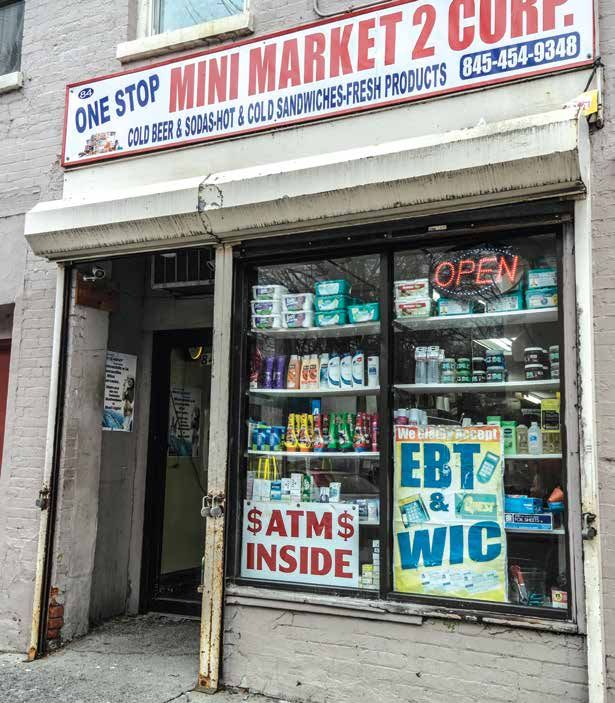
Conversely, the USDA defines food insecurity as            ways” (USDA, 2006). The three categories of condi-
“limited or uncertain availability of nutritionally         tions are relative to a continuum of increased health
 adequate and safe foods or limited or uncertain ability    risks: food secure, food insecure without hunger, and
 to acquire acceptable foods in socially acceptable         food insecure with hunger.

Figure 1. Three Conditions of Household Food Security and Continuum of Health Consequences

         Food Secure                                               Food Insecure

                                              …without hunger:
       No food access                                                               …with hunger:
                                          reduced quality, variety,
   problems or limitations,                                                      multiple indications of
                                            or desirability of diet;
  or so few as to not affect                                                   disrupted eating patterns
                                        little indication of reduced
     diets or food inake.                                                      and reduced food intake.
                                                 food intake.

 Least severe health/nutrition risks __________________ Most severe health/nutrition risks

The City of Poughkeepsie                estimated an unemployment              are found across all ten census
                                        rate of 12 percent in the city, 3      tracts of the city. Neighborhood
Research for the Poughkeepsie
                                        percent higher than the national       inequality also manifests in
Plenty community food assess-
                                        rate (9 percent) and a median          commercial underdevelopment
ment was undertaken in the
                                        household income of $39,061,           in the city. Most importantly for
midst of a national economic
                                        which is over 25 percent less than     the community food assessment,
downturn that, for many, resulted
                                        the U.S. figure ($52,762). Twenty-     the City of Poughkeepsie lacked
in lost jobs and prolonged
                                        five percent of city residents and     a large grocery store within
economic stress. In 2009,
                                        37 percent of children under age       its limits from 1992-2011. The
42.9 million Americans were
                                        eighteen reside in households          recent opening of the Associated
receiving federal food stamp
                                        reliant on incomes below the           Supermarket in April 2011, across
benefits (FRAC, 2010). In the
                                        poverty level. These figures           the street from what was previ-
City of Poughkeepsie, as in other
                                        exceed the national statistics         ously the city’s biggest grocer
communities with heavy concen-
                                        (of 14 percent and 20 percent,         (a medium-sized Latin foods
trations of poverty, the recession
                                        respectively). Four in ten female-     market), marked an important
only exacerbated long-standing
                                        headed single parent households        milestone. However, because
economic distress and socioeco-
                                        and three in twenty seniors (age       these two grocery stores are
nomic inequalities.
                                        65 or older) live in poverty. In the   located on the city’s eastern edge,
                                        city’s public schools, 80 percent      they only reduce the distance for
Poughkeepsie, the county seat of
                                        of students in the 2011-12 school      many of the city’s less affluent
Dutchess County, had a popula-
                                        year qualified to receive free         residents to a supermarket by
tion of 32,736 in 2010. Like many
                                        lunches and another 11 percent         less than a mile. The next closest
other smaller northeastern cities
                                        were eligible for reduced-price        supermarkets are in the neigh-
in the half-century after World
                                        lunches (NYS SED, 2012).               boring Town of Poughkeepsie.
War II, the City of Poughkeepsie
                                                                               Consequently, the two census
experienced declining popula-
                                        People in poverty are more likely      tracts closest to the city center
tion, white flight, and increased
                                        to live in the city’s northern         qualify as food deserts according
concentrations of non-white,
                                        neighborhoods, though house-           to USDA criteria.
lower-income, and less-educated
                                        holds facing economic insecurity
residents. The 2010 U.S. Census

                                                                                                                     5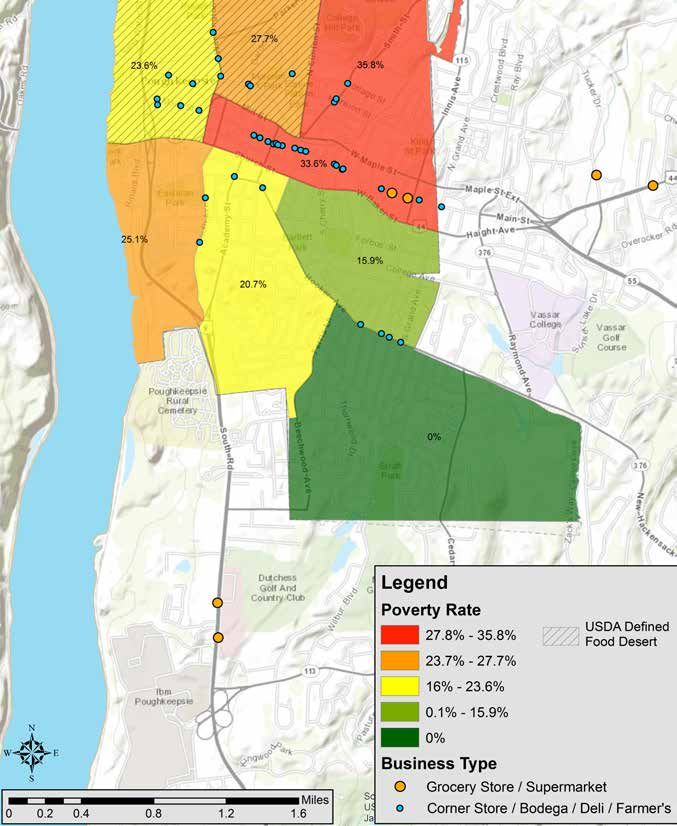
“Census tracts qualify as food deserts
      if they meet low-income and low-access
      thresholds:
      1. T
          hey qualify as low-income communities,
         based on:
         a) a poverty rate of 20 percent or greater,
                                OR
         b) a median family income at or below 80
             percent of the area median family income;
                               AND
      2. They qualify as “low-access communities,”
          based on the determination that at least 500
          persons and/or at least 33% of the census
          tract’s population live more than one mile
          from a supermarket or large grocery store
          (10 miles, in the case of non-metropolitan
          census tracts).” (USDA, 2014)

    In a 2008 countywide telephone        Table 1. Demography and Food Security in the City of Poughkeepsie
    survey of residents conducted by      and the United States
    the Dutchess County Department                                City of Poughkeepsie    United States
    of Health, one in four (26 percent)
    City of Poughkeepsie residents         Race/ethnicity
    reported difficulty accessing           White                          48%                72%
    healthy food, a rate well in excess
    of that reported by residents of        Black                          36%                13%
    other municipalities in the county      Hispanic                       20%                16%
    (CGR, 2009). Additionally, more        Unemployment                    12%                 9%
    than half of those who reported
    difficulty in buying healthy foods     Median Income                 $39,061             $52,762
    also said that such foods were         Poverty Rate
    too expensive. About a fifth of         All residents                  25%                14%
    Hispanic and non-Hispanic black
    respondents in the 2008 survey          Households
                                            with children                  37%                20%
    of Dutchess County reported
    difficulty buying healthy food.         Female-headed
                                            single parent                  40%                29%
    By comparison, 10 percent of
    non-Hispanic white respondents          Seniors
    experienced such difficulty             (age 65 or older)              15%                 9%
    (CGR, 2009).
                                           Food Security
                                           Food Secure                     74%                86%
                                           Food Insecure
                                           without hunger                  15%                 9%

                                           Food Insecure
                                           with hunger                     11%                 5%

                                           Source: USDA 2011, U.S. Census 2012

6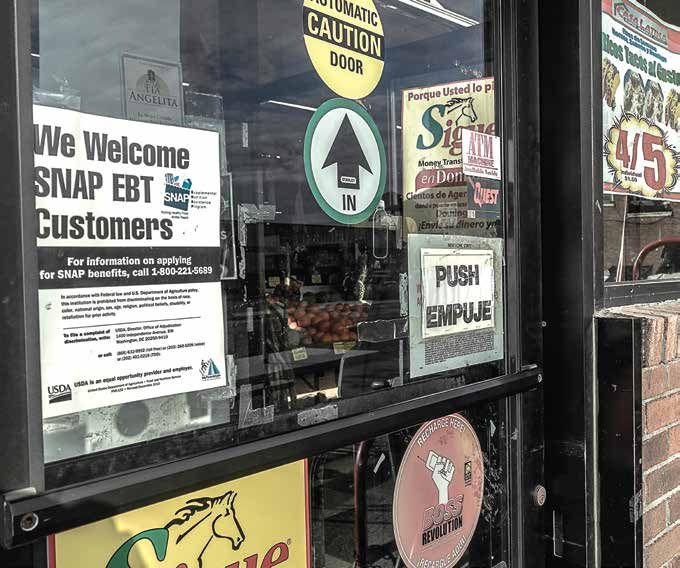
The Poughkeepsie
                                         Map 1. City of Poughkeepsie Food Stores and Poverty Rate by Census Tract
Plenty Survey
Against the backdrop of these
indicators of local food insecurity,
Poughkeepsie Plenty surveyed
a random sample of City of
Poughkeepsie households
between October 2010 and
April 2012 in order to gauge:
1. the extent of food security across
    the city;
2. the levels of access households
    have to grocery stores, other food
    retail, and food assistance; and,
3. the criteria households use when
    choosing food retailers and food
    products to buy.
Since probability sampling was
utilized to select households,
these results may be used to
represent not just the views and
experiences of the surveyed
respondents but the views of all
City of Poughkeepsie house-
                                                                                      Legend
holds within a ± 5.5 percent                                                          Poverty Rate
margin of error. For example, we
                                                                                           27.8%–35.8%             USDA Defined
found that 40 percent of City of                                                           23.7%–27.7%             Food Desert
Poughkeepsie residents said it                                                             16%–23.6%
is very important to them that,                                                            0.1%–15.9%
aside from cost considerations,                                                            0%
they be able to buy food that is                                                      Business Type
easy to prepare. As a result of our                                                     Grocery Store / Supermarket
                                                                                        Corner Store / Bodega / Deli / Farmer’s Market
sampling methodology, we can
say with 95 percent confidence,
that in 2012, between 34.5 and
45.5 percent of the total city           Source: U.S. Census Bureau, 2008-10 American Community Survey 3-year estimates.
                                         Store locations are as of September 2012.
population had this preference.

In order to gauge food in/secu-          extensive research documents             security. Based on the number
rity, and to facilitate possible         a strong relationship between            of affirmative answers, the scale
comparisons, the survey incor-           magnitudes of food insecurity            classifies households as either
porated the USDA’s Household             and nutritional ill health, with         food secure (answering 0-1 ques-
Food Security Scale. This scale          hunger and malnutrition being            tions affirmatively), food insecure
includes six questions about             the most severe consequences.            without hunger (2-4 affirmatives),
households’ financial ability to         Following a protocol developed           and food insecure with hunger
meet nutritional basic needs.            by researchers at the Centers for        (5-6 affirmatives).
These questions don’t directly           Disease Control, the six brief
address household members’               questions comprise a six-item
physical well-being, although            scale to measure household food

                                                                                                                                         7
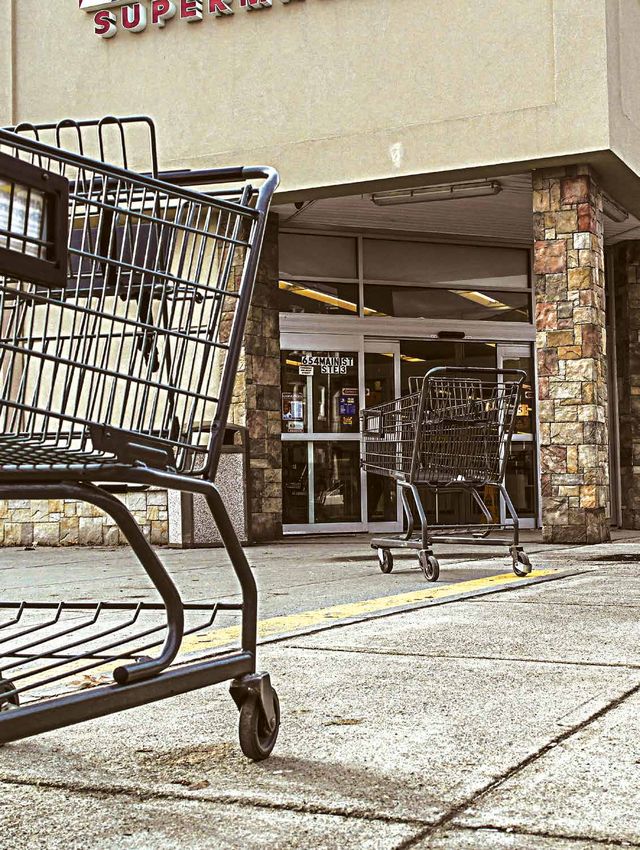
Map 2. City of Poughkeepsie Food Stores and Food Deserts

                                                                    Legend
                                                                        City of Poughkeepsie

                                                                        USDA Defined Food Desert

                                                                    Business Type
                                                                     Grocery Store / Supermarket
                                                                     Corner Store / Bodega / Deli / Farmer’s Market

    Source: USDA. Note: Store locations are as of September 2012.

8
Figure 2: USDA Household Food       Nationwide, in 2010, 14 percent       annually were food insecure,
Security Scale Survey Questions     of households were food inse-         including 32 percent food
                                    cure, 9 percent without hunger        insecure with hunger. Over two-
                                    and 5 percent with hunger. In         thirds (37 percent) of Hispanic
  1.In the last 12 months,
      did you or others in your
                                    metropolitan principal cities,        households were food insecure,
      household ever cut the        these percentages were 11 and 6,      as were 36 percent of black and
      size of your meals or skip    respectively (USDA 2011).             about one in five (19 percent)
      meals because there           As Table 1 indicates, in 2012,        white households. Households
      wasn’t enough money           City of Poughkeepsie residents        that did not usually drive a car
      for food? [If “yes,” ask      were experiencing food insecu-        to go food shopping and those
      question #2]                  rity at higher than national rates:   that got most of their food at
   2. H
       ow often did this           26 percent of households were         places other than supermarkets or
      happen? [Affirmative          food insecure. About two-fifths       grocery stores were more likely
      answers: “almost every        (42 percent) of these food            to experience food insecurity.
      month” and “some
      months but not every          insecure households were food
      month”]                       insecure with hunger. That is,        Group characteristics that
                                    about one in ten (11 percent)         did not significantly correlate
   3.In the last 12 months,
       did you or others in your    City of Poughkeepsie households       with food security in the
       household ever eat less      qualified as hungry by                City of Poughkeepsie deserve
       than you felt you should     USDA standards.                       mention. These include house-
       because there wasn’t                                               hold size and the presence of
       enough money for food?       Three critical factors are signifi-   children in the household. These
   4. In the last 12 months,       cantly correlated with household      findings suggest that food
       were you or others ever      food security in the City of          insecurity is experienced among
       hungry but didn’t eat        Poughkeepsie: income, race/           a range of households, from large
       because there wasn’t         ethnicity, and access. A majority     families with many mouths to
       enough money for food?
                                    of households (60 percent)            feed to those with individuals
   5. Please tell me whether       with incomes less than $15,000        living alone.
       this statement was often,
       sometimes, or never true
       for you or other members
       of the household in the
       past 12 months: “The
       food that we bought just
       didn’t last, and we didn’t
       have money to get more.”
       [Affirmative answers:
     “often true” and “some-
       times true”]
   6. P
       lease tell me whether
      this statement was often,
      sometimes, or never true
      for you or other members
      of the household in the
      past 12 months: “We
      couldn’t afford to eat
      balanced meals.”
   Source: Blumberg et al. (1999)

                                                                                                              9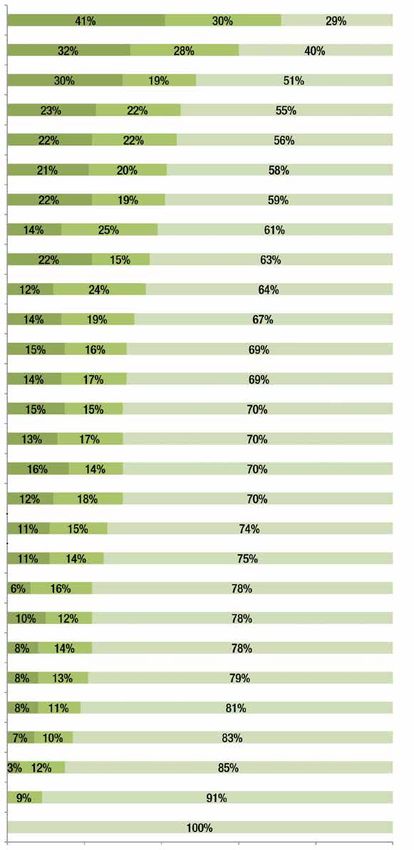
Poughkeepsie Plenty Community Food Assessment (CFA) Household Survey
                The survey was conducted via face-to-face structured            A total of 355 surveys were completed, a final response
                interviews at residences in the City of Poughkeepsie.           rate of 24 percent: 188 addresses were unusable (i.e.,
                Social researchers recognize that sending people out to         vacant properties, assisted living facilities, commercial),
 Methodology

               “pound the pavements” yields some of the worst survey            644 were non-respondents, and 313 refused. The final
                response rates possible, particularly in urban environments     dataset was weighted to reflect the race, Hispanic ethnicity,
                where concerns about answering the door to strangers can        and income distribution of the City of Poughkeepsie
                run high. However, we employed this design because it           according to U.S. Census 2010.
                best corresponded to our target population — all
                households in the City of Poughkeepsie, and not simply          Focus Groups
                households with phones or people conveniently located at        In the spring of 2011, qualitative focus groups were
                Poughkeepsie Plenty events. This made possible                  conducted with two goals in mind. First, we wanted
                representative and generalizable baseline measures of           to gather commentary and elaboration on the closed-
                food security and other characteristics for the entire city.    ended questions administered in the household survey.
                                                                                Second, since Spanish-speaking respondents were
               Households were selected using probability sampling              underrepresented in the household survey, focus groups
               methods. An random sample of 1500 addresses from                 provided an additional venue for these voices to be heard.
               all City of Poughkeepsie households was selected,                From March 27 to May 16, 2011, we convened seven focus
               as recorded by the Dutchess County Division of Planning          groups comprised of approximately 56 total participants.
               and Development. Survey administration began in                  Sponsoring organizations included churches, emergency
               October 2010 and ended in April 2012. An advance                 food providers, senior centers, community gardens, and
               courtesy letter informing residents of the nature of the         health care providers. Interviews were not recorded, which
               project and of the possibility of an upcoming survey             means the focus group quotations in this report represent
               visit was mailed to all 1500 addresses.                          our note takers’ paraphrasing and summary of participants’
                                                                                remarks unless quotation marks are shown (when note
               Both the survey and the letter of introduction were              takers were confident they captured the exact statement).
               prepared in English and Spanish. Surveys were conducted
               during daytime hours (10 am to 5 pm), on both weekdays           Secondary Research
               and weekends. Vassar College students comprised the              To assess the availability of fresh food, affordability
               majority of survey administrators. Others included interns       of staple foods, and acceptance of EBT and WIC food
               from the Dutchess County Department of Health, the               benefits in the city’s food retailers, we visited 22 small
               Poughkeepsie Farm Project, Marist College students,              food stores in the city’s downtown area twice, in October
               Cornell Cooperative Extension employees, and other               2010 and in December 2011 (at least three small food
               Poughkeepsie Plenty volunteers. A few bilingual surveys          stores had closed between these two dates). We also
               were administrated at Spanish-speaking households.               visited four supermarkets: Associated located in the City
               More often, English-speaking interviewers provided a             of Poughkeepsie (which opened in April 2011) and three
               cover letter in Spanish, a printed Spanish-language survey,      others located in the surrounding Town of Poughkeepsie.
               and a stamped addressed envelope to be mailed in
               upon completion.                                                  To estimate business failure and turnover among the city’s
                                                                                 food retailers, the business directory of telephone books
               Prior to going into the field, all administrators were trained    from 1989-2009 (with the exception of 2007, which was
               about the nature of the project, the survey instrument, and       missing) archived at the Adriance Memorial Library were
               standard protocols. Administrators visited the sampled            examined. From these sources, names of commercial food
               addresses in pairs and asked to speak with “the person            retailers located on Main Street under the categories of
               who does most of the planning or preparing of meals in           “Grocery-Retail,” “Delicatessens,” “Convenience Stores,”
               this household.” One administrator asked the questions           “Market,” “Supermarket,” and “Meat-Retail” or “Dairy-
               and the other recorded responses. Each survey took an             Retail” were recorded.
               average of ten minutes to complete.

10
Figure 3. Food Security in the City of Poughkeepsie
Insecure with Hunger Insecure without Hunger Food Secure
Household received emergency food supplies
Household Income: Less than $15K
Household received food stamps past 12 months
Children/women received free or reduced cost food
Usually did not drive a car to store to buy food
Very important store accepts food stamps or WIC
Received delivered meals or at community program
Got most food from place other than supermarket
Household Ethnicity: Hispanic
Household Race: Black
Meal Preparer: Age 35 to 44
Children in household
Household Income: $15K to $50K
Household size: 3 or more people
Meal Preparer: Female
Meal Preparer: Age 45 to 60
Meal Preparer: Under Age 35
City of Poughkeepsie: All Households
Got most food from supermarket/grocery store
Household size: 2 people
Household size: 1 person
No children in household
Usually drove a car to store to buy food
Household Race: White
Meal Preparer: Male
Meal Preparer: Age 60 or older
Household Income: $50K to $100K
Household Income: Over $100K
0% 20% 40% 60% 80% 100%
11Social Programs and Public Benefits
A variety of social programs and public benefits shows, in 2012 about one quarter (24 percent) of
exist to help people at risk gain access to the food City of Poughkeepsie households had received food
they need. Although potential beneficiaries often stamp benefits and 15 percent got emergency food
don’t know about such opportunities or even realize supplies from a church, food pantry, or food bank
that they are eligible (according to the U.S. Census in the previous year. Low income households were
only about half [51 percent] of households in poverty much more likely to need these services: 75 percent
received food stamps in the past twelve months), a of households with an annual income of less than
substantial number of city residents reported partici- $15,000 received food stamps and 44 percent needed
pating in some type of food program. As Figure 4 emergency food supplies.
Figure 4: Coping with Food Insecurity in the City of Poughkeepsie
Yes No
Children: Received free/reduced cost food at school
Households: Received food stamps
Women and/or Children: Received WIC food
Children: Received free/reduced cost food at daycare
Households: Received emergency food supplies
Households: Had meals delivered
Households: Recieved meals at community or senior center
0% 25% 50% 75% 100%
Question wording:
Seventeen percent of food secure In the past 12 months, did you or others in
households received food stamps, your household:
compared with 31 percent of those a) get food stamp benefits — that is, either food
that were food secure without hunger, stamps or a food-stamp benefit card?
b) r eceive any meals delivered to the home from
and 66 percent of those who were community programs like “Meals on Wheels,”
food insecure with hunger. or any other programs?
c) g o to a community program or senior center
to eat prepared meals?
d) get emergency food supplies from a church,
food pantry, or food bank?
In the past 12 months, did any children in
the household
a) receive free or reduced-cost food at a day-care
center or Head Start program?
b) r eceive free or reduced-cost meals at school?
c) (or women) get food through the WIC program?
12Some food assistance programs
are designated for children and
mothers, two groups especially
vulnerable to the effects of food
insecurity. Among households
with children, about a half (48
percent) had students in public
grade schools that received free
or reduced-cost meals in the
preceding 12 months. (Note that
in 2011-12, the Poughkeepsie
City School District reported that
nine in ten students were eligible
for either free or reduced price
lunches. Many households have
more than one child in school.)
Additionally, almost a fifth (18
percent) of city households with
preschool-aged children received
free or reduced-cost food at a
day-care center or Head Start
program. Finally, among house-
holds with women or children,
22 percent included someone
who had received food via WIC
over the past 12 months.
Where and How the City of
Poughkeepsie Shops for Food
In 2012, over one-third (39
percent) of City of Poughkeepsie shopping (21 percent) were more an annual income of less than
households who did not buy most likely to get most of their food in $15,000 usually went food shop-
of their food at a supermarket or places other than supermarkets or ping some other way than by car.
grocery store were food insecure: grocery stores. People who primarily shopped at
14 percent without and 25 percent supermarkets were more likely to
with hunger. About four in ten The 2010 U.S. Census reported drive a car to go grocery shop-
(44 percent) of city households that 27 percent of the City of ping: 81 percent of supermarket
who did not usually drive a car to Poughkeepsie’s occupied housing shoppers compared with 61
go grocery shopping were food units had no available vehicles. percent of those who grocery
insecure: 22 percent without and Survey results confirm that lack shopped at other places got to
22 percent with hunger. of easily available transportation their destination by driving a car.
is linked to food insecurity.
Supermarkets or grocery stores Only 4 percent of city households
are the source of the widest range Over three quarters of house- said they usually ride public
and variety of food products, but holds (78 percent) usually drove transportation to do food shop-
about one in ten (12 percent) of themselves by car to grocery ping. In focus groups conducted
city households reported that shop, 3 percent took a taxi, 3 for the Poughkeepsie Plenty
they got most of their food at percent walked, and 3 percent community food assessment,
other places like corner stores had food delivered. Low income participants who had no cars
or restaurants. People age 35 or households were much less likely gave a number of reasons why
less (21 percent) and people who to have a car for food shopping: the city’s public buses aren’t
did not drive by car to do food 50 percent of households with convenient for grocery shopping.
13Figure 5: Where City of Poughkeepsie Residents Get Most of Their Food
4% 2%
Question wording:
6%
Of these three kinds of places, where do you get most of the food that
(you/people in your household) eat? (By this, I do not mean the store you
go to most often, but the store you get the majority of your food.)
Supermarket and grocery stores
Restaurants, fast food places, take-out food
88%
Corner stores, delis, bodegas, warehouse clubs, produce stands, bakeries
Some other way
Note: Previous questions identified supermarkets and grocery stores in the
Poughkeepsie area as Associated Supermarket, Stop & Shop, Super Stop & Shop,
Price Chopper, Adams Fairacre Farms, Casa Latina, and Mother Earth’s Storehouse.
One in ten food secure households bought most
of their food at places other than supermarkets or
grocery stores. This compares with 18 percent of food
insecure households.
Figure 6: How City of Poughkeepsie Residents Travel to Go Food Shopping
3% 3%
3%
4%
Question wording:
9%
How do you usually get to a grocery store?
Drive a car
Get a ride from someone else
78%
Take public transportation
Walk
Take a taxi
Have food delivered
Over eight in ten (83 percent) food secure households
usually drove a car to go grocery shopping; compared to
62 percent of food insecure households.
14‘Listen, you need transport, I’ll
charge you five dollars to go to
Stop and Shop.’ That’s what we
do here in Poughkeepsie.
Although residents who primarily speak Spanish
have language barriers to deal with when navigating
the bus system, both Spanish and English speakers
frequently cited logistical issues such as:
• Getting on the bus with bags is difficult.
• There’s a four bag limit on the bus.
• …the north side bus doesn’t run on Saturday;
that’s what it says on the schedule.
• The public transport system is terrible. It’s not on time,
or it just doesn’t come.
• Sometimes people take the bus to the store and take
a taxi back [because of the limit on shopping bags
in buses]. • Sometimes it’s more expensive because taxis have
a limit on their meter.
A 2009 ridership survey conducted by the • Yeah, but at least sometimes it’s people you already know.
Poughkeepsie-Dutchess County Transportation
Council underscored riders’ dissatisfaction with the Although a household’s income certainly affects
frequency and span of service on the city’s two bus transportation options, not having access to a car
systems. Riders reported that accessibility was the is a less important barrier to food security when
public transportation systems’ biggest problem. large, full-service grocery stores are located within
When asked to rate service features, “how often walking distance for all.
buses run (frequency of service), schedule avail-
ability, and when buses operate (span of service)” At the start of the Poughkeepsie Plenty community
received the lowest favorable ratings. food assessment research, Poughkeepsie area large
grocery stores and supermarkets included Stop &
Our survey results showed that about one in ten city Shop, Super Stop & Shop, Price Chopper, Adams
residents (9 percent) relied on getting a ride from Fairacre Farms, Casa Latina, and Mother Earth’s
someone else when doing their shopping. Focus Storehouse. When the Poughkeepsie Plenty research
groups revealed these shoppers’ resourcefulness: commenced, the City of Poughkeepsie had no
family, extended kin, and neighbors were frequently such large store within city limits. As previously
mentioned as sources of rides. Additionally, Spanish- mentioned, in April 2011, an Associated Supermarket
speaking informants shared information about the opened across the street from Casa Latina, a medium-
informal raite system of community taxis: sized Latin goods retailer that previously counted as
the city’s only grocery store. Both of these stores are
• “ Raite” are people in the community who give rides; located at the city’s eastern end — a mile away from
they say, ‘Listen, you need transport, I’ll charge you the central business district, and even farther from
five dollars to go to Stop and Shop.’ That’s what we many residential neighborhoods.
do here in Poughkeepsie.
• It’s better than taxis because there is no language
barrier and it’s cheaper.
15Household Consumer Preferences
One third of households said
City of Poughkeepsie residents take various factors
into account when choosing the store where they it’s very important that a store
usually buy most of their food. First and perhaps accepts WIC or food stamps:
most important, they care about what they eat: among these households,
84 percent read food labels at least sometimes and 20 percent are food insecure
92 percent thought that it is important for their stores without hunger and 21 percent
to have healthy foods. Other important consider- are food insecure with hunger.
ations include: easy to get to (92 percent), better
prices (90 percent), and close to home or work
(90 percent). Majorities of residents cited the
importance of shopping where there is a staff that
understands their needs (65 percent) or where they
can buy food connected to their family background
(53 percent). Over one third (35 percent) said the
store’s acceptance of food stamps is important in
their consideration of where to shop for food.
Figure 7. Factors that Influence Store Preference
Very Important Somewhat important
Not too important Not at all important
Store is easy to get to
Better prices on the food I want
Store has healthy foods
Store is close to home or work
Staff understands my needs
Store accepts WIC/food stamps
Store sells food from my family background
0% 25% 50% 75% 100%
Question wording:
These next questions ask about the store where you usually buy most of the food that people in your household
eat. This may or may not be a grocery store. I’m going to list some reasons why you may choose a store for most
of the food you eat. In choosing a store for most of the food you eat, how would you rate:
16Focus group participants often stated that no single shopping at bigger supermarkets that targeted the
store in or close to the City of Poughkeepsie satis- “Anglo” shopper. They reported that:
fies all these criteria. Additionally, they reported
that some area supermarkets and grocery stores are • Fruit is fresher and goods are less expensive at larger
preferred for their fresh produce but don’t sell many supermarkets. The quality of the product makes up for
non-food household sundries. Not all stores accept the fact that supermarkets are located farther away.
WIC/food stamps. Big box stores are attractive
•It’s not in supermarket’s interest to sell products that
destinations for shoppers seeking to buy in bulk but
these are located well beyond the city limits. The are close to expiring. If you buy a product that has
fact that shoppers must visit multiple stores in and already expired, you will have a hard time returning it
out of the city in order to buy food and household to the bodega, since they sometimes don’t even give
goods cost effectively further underscores the crucial you a receipt.
impact of transportation access and convenience on • There’s better customer service at large supermarkets.
Poughkeepsie households’ food in\security.
City of Poughkeepsie residents were asked, apart
from cost, why they buy certain foods. Two factors
Members of our Spanish-speaking focus group
related to maximizing utility were ranked highest:
reported shopping at bodegas and other corner
86 percent and 75 percent of respondents rated
stores frequently, since many of these in downtown
staying fresh and easy to prepare, respectively, as
Poughkeepsie specialize in Latin foods and goods.
very or somewhat important.
Still, Latino shoppers acknowledged the value of
Figure 8. Factors that Influence Food Choice
Very Important Somewhat important
Not too important Not at all important
Food that stays fresh longer
Food that’s easy to prepare
Food form your family’s ethnicity or culture
Organic food
Brand name foods
0% 25% 50% 75% 100%
Question wording:
Seventy percent of food insecure Now I would like to ask you about types of food you
households said it is very important choose to buy. I’m going to list some possible reasons
they buy food that stays fresh longer; why people buy certain foods other than low prices.
47 percent said it needs to be easy When you choose types of food to buy, how would
you rate:
to prepare
17It’s important that food be organic for 40 percent of households with annual incomes
less than $35,000.
For about half of households, food purchases were foods as important compared with households in
guided by priorities for particular kinds of foods: food lower income brackets.
from family’s ethnic background (51 percent), brand
name (48 percent) and organic (45 percent). These The most direct survey measure of concern about
patterns suggest that while city households may seek nutritional value was a question about attention
out different food types or have different dietary to food labels. Eighty-four percent of City of
preferences, freshness and convenience is important Poughkeepsie consumers take a look at food labels at
for most. least sometimes to determine if food is nutritious or
healthy; 42 percent say that they always do it.
Some food activists associate inclination toward
consumption of organic foods with health and/or This is important. It is often assumed that the incli-
quality. Because organic foods can be more expen- nation to read food labels is influenced not just by
sive than non-organic items, it’s often thought that nutritional education but by overall socioeconomic
buying organic foods is correlated with income. levels in general. As with buying organic food, no
However, our statistical tests revealed no significant statistically significant relationship between reading
relationship between household income and the food labels and income was found. Households in
predisposition toward organic foods. Households any income bracket are, for all intents and purposes,
in higher income brackets are, for all intents and no more or less likely to look at the food labels to
purposes, no more or less likely to rank organic decide if the food is nutritious or healthy.
16%
Figure 9. City of Poughkeepsie Residents Paying Attention to
Food Labels
43% Question wording:
Do you look at the food labels to decide if the food is nutritious or healthy?
41%
A lways S ometimes N
ever
The City of Poughkeepsie’s
Food Retail Landscape
Distribution within the Poughkeepsie urban food
system — the nature and economic viability of
Nearly half (48 percent) of food the City’s food retail sector — provides important
insecure households always look context for understanding local patterns of food
at food labels to decide if food is insecurity. With so few supermarkets located within
nutritious or healthy. or close to Poughkeepsie city limits, smaller retailers
About four in ten (41 percent) like corner stores, bodegas, dollar stores, and
households with annual incomes delicatessens dominate the city’s food retail sector,
particularly in the downtown and western areas.
of less than $35,000 always look,
Smaller food stores significantly contribute to many
as do 42 percent of households residents’ diets, as indicated by the finding in Figure 5.
with annual incomes of $35,000 About one of every 20 households (4 percent) in the
or more. City of Poughkeepsie reported getting most of their
food from these kinds of establishments.
18Nearly half (45 percent) of the Figure 10. Average Prices for Staples
small food stores we observed City Town
sold produce or meat of some kind. $5.00
Others sold ethnic foods or other
specialty items that supermarkets
$4.00
carry less frequently. As a rule,
however, smaller stores gener-
ally offered reduced variety in $3.00
food items compared to super-
markets. Yet the effect of this on
$2.00
food affordability isn’t clear, as
is suggested by the comparison
of average prices among the $1.00
smaller food retailers in the
City of Poughkeepsie and Town
$0.00
of Poughkeepsie supermarkets. Milk Cereal Bread
While a gallon of milk or a box
of cereal cost more on average in
the city’s smaller stores than in have a strong community basis, (see Figure 11). For example, the
town’s supermarkets, the average particularly in relation to the city’s Spicy Peppers produce store on
loaf of bread costs less (not taking Latino, West Indian, and Middle Main Street, a downtown source
into account the reduced variety Eastern immigrants. Ethnic for fresh foods, went out of busi-
of bread products sold in smaller entrepreneurs from these groups ness during our research period.
food stores). Furthermore, about have contributed significantly to More generally, in the 1989-2009
four in ten (40 percent) of the the city’s economic development, period, of 64 such stores operating
city’s smaller food stores accept inhabiting once vacant storefronts at any time within the city’s limits,
EBT and/or WIC benefits, another along Main Street and offering 23 (36 percent) were in business
way that food is made accessible “eyes on the street” with an less than one year; only 22 (24
to low-income residents. interest in maintaining street-side percent) had been open for longer
order. They are potential sources than five years. In fact, of these
Perhaps a more important factor is of local leadership and social 22, only seven remained by 2009:
the quality and nutritional value of capital where outreach to ethnic four delicatessens, two conve-
food sold in the city’s smaller food groups and coordination with city nience stores, and one grocery
stores, which typically emphasize policymakers is concerned. store. Frequent business failure
snacks, soda and processed foods. The city’s smaller food retailers undermines food access among
In smaller stores, fresh food items, face a relatively high rate of busi- the many households who shop
when available for purchase, are ness failure and turnover regularly at these establishments.
often limited in amount. For
instance, while 38 percent of the Figure 11. Years of Operation for Main Street Food Retailers
small food stores we observed
25
sold produce of some kind, only
two stores sold heads of lettuce. [ARE THESE ALL OR JUST CLOSED
And, focus group participants 20 BUSINESSES?]
reported that produce in these
stores sometimes remained on 15
shelves past peak freshness.
Despite these concerns about this 10
aspect of the urban food system,
it’s important to recognize the 5
positive role that smaller food
stores play in the city’s social 0
well-being. These retailers often 1 2 3 to 5 6 to 9 10 or more
19Food insecurity in Poughkeepsie is a local manifestation bus route that runs with a focus on transporting local
of national social problems: poverty, unemployment, residents to and from food stores on a convenient schedule
underemployment, wage levels, and the fragility of the that coincides with the days and times when people are
safety net. Local constituents can make their voices most likely to need public transportation to go food
Policy Recommendations
heard on these issues, but they will not be resolved shopping. The Food Loop might also include farmers
locally. What follows are changes that can be made markets and other sources of healthy foods and could even
locally and regionally to address food security in the incorporate support of regional agriculture by offering
City of Poughkeepsie. seasonal “pick your own” events at participating farms.
These local changes must focus on access to healthy and This is bringing people to food. Healthy food can also be
nutritious foods. Reliance on fast food outlets, bodegas, more efficiently brought to people. One way to do this is
and other neighborhood stores that lack sufficient by partially subsidizing a program that would coordinate
nutritious foods by those who experience food insecurity the delivery, sale, and distribution of affordable healthy
suggests that there is a market failure that can be food in city neighborhoods. A mobile farmers’ market,
mitigated by local policy intervention. wholesale buying cooperative and/or food recovery
initiative might be started. The Food Security Coordinator in
A caveat: it is important to remember that assuring Orange County and the nascent Ulster County Food Policy
access to healthy and nutritious foods is not the same Council are models for this. They provide opportunities for
as the distribution of free foods. There are already many collaboration and guidance on how to leverage private
charitable organizations that have been operating food funding and establish a sustainable program that ensures
pantries and soup kitchens for many years. While the that local and regional food resources, including
work of these organizations is important, the scope of agricultural surpluses, reach food insecure households in
the food insecurity issues in the City of Poughkeepsie is City of Poughkeepsie neighborhoods.
too large and systemic to be remedied through so-called
“emergency” charitable efforts. Rather, the remedy requires Another possibility is to develop a system of incentives
a food system approach. to encourage sale of healthy foods in existing small stores
within the city. There are many possible approaches:
The inconvenient location of full-service food stores economic development initiatives; tax incentives; grant
and a lack of ways to get to them are major contributing programs; or partnerships among local businesses to
factors to food insecurity in the City of Poughkeepsie. purchase nutritious foods collectively, thereby achieving
Access must be the focus. Fortunately, this is an area economies of scale to reduce costs. One innovative pilot
where local intervention can have a meaningful impact. program that might be replicated in the City of
There are two components of this issue: getting people to Poughkeepsie as a public-private partnership is the
healthy and nutritious food and getting the food Michigan “Double Up Food Bucks” program. Through
to people. funding from private and community foundations, this
program offers SNAP recipients the opportunity to stretch
In the short term, something as simple as lifting the bag their benefits if they purchase fresh fruits and vegetables.
limit on City of Poughkeepsie buses to allow for families to Through this program SNAP recipients who shop at a
grocery shop at supermarkets could have an impact. participating location have up to $20 matched with “Food
Currently, City of Poughkeepsie buses limit riders to four Bucks.” The “Food Bucks” can then be redeemed for
bags per passenger. This limit makes it difficult for families Michigan grown fruits and vegetables. If implemented in
to use public transportation to shop for groceries. the City of Poughkeepsie, the program would benefit SNAP
recipients (by providing more nutritious and healthy foods)
In the longer term, the City of Poughkeepsie and Dutchess as well as local farmers. Ideally, the “Double Up Food
County could utilize the Loop Bus and City of Poughkeepsie Bucks” locations would include farmers markets as well as
Transit System to create a “Food Loop.” This would be a the recommended mobile farmes’ market for Poughkeepsie
20thereby encouraging food shopping at locations where Finally it is important that interested advocates remain
more healthy choices are available and affordable. organized, focused, and directed. In order to affect
long-term change to the food insecurity issues that the
The city’s commercial underdevelopment exacerbates City of Poughkeepsie faces, civil society and affected
Policy Recommendations
the problems of food access and food security for many populations need to be central to crafting solutions. The
residents, particularly in the downtown vicinity. This is Poughkeepsie Plenty Food Coalition is a vital partner in
why it important for city leaders and business groups these efforts, as an energized network of individuals and
(like the Chamber of Commerce) to support Main Street’s organizations committed to a vision of change in the City of
smaller food retailers, particularly those run by ethnic Poughkeepsie. The coalition works in an ongoing manner
entrepreneurs. Ethnic entrepreneurs are likely to respond to identify opportunities to launch and coordinate programs,
to consumer demands for culturally appropriate foods, monitor and advocate for a supportive policy environment,
they provide employment and useful information/contacts and build capacity to create change.
for many downtown residents, and their businesses help
maintain an increasingly vital downtown core. These ethnic The issue of healthy food access resonates for residents of
entrepreneurs are at high risk. They are focused on staying the City of Poughkeepsie. City leadership and those who
in business day-to-day and, in general, have little familiarity aspire to lead in the City of Poughkeepsie must commit to
or contacts with city government and elite civic groups. sustained efforts to become a model city that dramatically
Initiatives must therefore be inclusive of these businesses reduces — and ultimately eliminates — food insecurity.
jointly with business, government, and not-for-profit
city leadership.
21Author Bios
Leonard Nevarez is the chair of the Sociology Joshua Simons is a Senior Research Associate for
Department and a professor of Urban Studies at CRREO at SUNY New Paltz. He holds a Bachelor’s
Vassar College. He is the author of New Money, Degree in Political Science, magna cum laude
Nice Town (Routledge, 2003) and Pursuing Quality (2008), from SUNY New Paltz. He specializes in
of Life (Routledge, 2011). Since 2003 he has been geographic information systems, redistricting, and
organizing classroom research for Poughkeepsie shared service analysis. Some of his recent projects
community development organizations such as include the creation of an online interactive map
Poughkeepsie Plenty, Hudson River Housing, and and web site to display information on properties of
Center in the Square. historic significance in the Town and Village of
New Paltz, and serving as the redistricting
Susan Grove, in her past role as Executive Director consultant to the Redistricting Commission of the
of the Poughkeepsie Farm Project, was the Principal City of Oneonta to create a viable redistricting plan
Investigator of the Poughkeepsie Plenty initia- for the city, and document the process. He also
tive — funded by a USDA Food and Nutrition serves as the co-chair of the Policy Working Group
Service Hunger-Free Communities Assessment and of the Poughkeepsie Plenty Food Coalition.
Planning Grant — to conduct a community food
assessment, mobilize community participation in
food system change action planning and launch Sources
a coalition. She now serves as the Coordinator of For a complete list of works cited for this paper
Poughkeepsie Plenty Food Coalition that works to please reference the electronic version on the State
ensure the right for all in the City of Poughkeepsie to University of New York at New Paltz CRREO
access sufficient and nutritious food. In addition, she website: www.newpaltz.edu/crreo
provides services to mission-based organizations to
define and achieve outcomes by facilitating engaging Citation
processes for stakeholders to generate ideas and Nevarez, Leonard, Susan Grove, KT Tobin, and
arrive at shared agreements and actions. Josh Simons (2013), Poughkeepsie Plenty: A
Community Food Assessment (CRREO Discussion
KT Tobin is the Associate Director for CRREO at Brief 11, Winter 2014). New Paltz, NY: State
SUNY New Paltz, where she is also an adjunct University of New York at New Paltz Center for
lecturer in Sociology. At CRREO, she is responsible Research, Regional Education and Outreach.
for designing, conducting, managing, and producing
studies on regional issues and concerns. Recent
publications include: with Brian Obach (Sociology),
Comment
To comment, write to CRREO at
Managing Empirical Sustainability Research in
CRREO@newpaltz.edu.
Social Science Classes and Agriculture Supporting
Communities in the Mid-Hudson Region; and with
Maureen Morrow (Biology), Communicating Student
Research at SUNY New Paltz to State and Local Photo Credits:
Elected Officials. KT is the former Vice President Cover, Pages 9 and 13: Rachael Saltzman
of the New Paltz School Board, and has served on Page 3: Courtesy of the Poughkeepsie Farm
several community committees including New Paltz Project and Green Teens
GreenWorks and New Paltz Flood Aid. Page 6: Joshua Simons
Page 15: Adam E. Moreira
Page 21: Courtesy of Poughkeepsie Plenty
22The Center for Research, Regional Education and
Outreach (CRREO) conducts studies on topics of
regional interest, brings visibility and focus to S TAT E U N I V E R S I T Y O F N E W Y O R K
these matters, fosters communities working
together to better serve citizenry, and advances The State University of New York at New Paltz is a
the public interest in our region. Publication of highly selective college of about 8,000 undergraduate
this Discussion Brief is one way that CRREO and graduate students located in the Mid-Hudson
at New Paltz seeks to contribute to the further Valley between New York City and Albany. One of
development of a vibrant community in our region. the most well-regarded public colleges in the nation,
New Paltz delivers an extraordinary number of high-
quality majors in Business, Liberal Arts & Science,
Acknowledgements Engineering, Fine & Performing Arts and Education.
This report would not have been developed
without the involvement of many people.
Among them are the 2010–2011 students of
the Vassar College community development
course, who conducted the bulk of the
research on the ground; the United Way of
Dutchess and Orange Region, the Leslie
A. Koempel Memorial Fund for Sociology
Fieldwork at Vassar College and the following The Poughkeepsie Plenty Food Coalition is a group of
project partners, which provided financial and individuals and organizations that have envisioned
BEFORE SENDING MATERIALS WITH THIS LOGO TO FINAL PRINT, PLEASE SEND
in-kind matching support: Rana Ali, Dutchess Poughkeepsie as a food city where everyone can
PDF TO: Leydi.Zapata@suny.edu
County Department of Health; Lisa Brawley, secure, prepare, enjoy and benefit from healthy food.
Vassar College; Sam Busselle; Susan Grove,
We are working to organize our community and
Poughkeepsie Farm Project; Brian Riddell,
build a diverse movement for change to ensure the
Dutchess Outreach; Christine Sergent,
right for all residents of the City of Poughkeepsie to
Cornell Cooperative Extension, Dutchess
secure sufficient and nutritious food.
County; Audrey Waltner, Dutchess County
Department of Health; and Ozie Williams,
Dutchess County Department of Health. In
addition, this project benefited from the input
of additional advisors and the help of many
other volunteers, interns and students who
administered household surveys.
The Power of SUNY, the State University of New
PANTONE® PANTONE®
P
PAN T
York’s Strategic Plan adopted in 2010, has as
423 C 641 C
64
one major purpose reinforcing SUNY’s role as
an enduring, enriching presence in communities
across our state. In SUNY, “We want to create a
broader sense of common ground and make a lasting
difference for everyone in the places we call home.”
23You can also read