Population and Housing (Mis)match in Lisbon, 1981-2018. A Challenge for an Aging Society - MDPI
←
→
Page content transcription
If your browser does not render page correctly, please read the page content below
$
         £ ¥€
                social sciences
Article
Population and Housing (Mis)match in Lisbon, 1981–2018.
A Challenge for an Aging Society
Nachatter Singh Garha *                   and Alda Botelho Azevedo

                                           Instituto de Ciências Sociais, Universidade de Lisboa, 1649-004 Lisboa, Portugal; alda.azevedo@ics.ulisboa.pt
                                           * Correspondence: nachatter.singh@ics.ulisboa.pt

                                           Abstract: Over the past four decades, Lisbon’s population has witnessed some notable changes in
                                           its growth, age structure, conjugal patterns and ethnic diversity. These changes have affected the
                                           size, composition and structure of households, which in turn modified the demand for housing in
                                           Lisbon. At the same time, some changes were also made to the housing stock, especially in size,
                                           but also in the replacement of small apartment buildings with large residential apartment blocks.
                                           However, the discrepancies between demographic changes and the housing stock have created new
                                           challenges for the housing market in Lisbon to provide adequate housing to all households in the
                                           city. Using data from the 1981–2011 census obtained from IPUMS International, population estimates
                                           from the National Institute of Statistics (INE) and other secondary sources, this article identifies and
                                           measures the magnitude of (mis)matches between existing housing stock and housing needs of the
                                           population in Lisbon. Theoretically, this article adds to the knowledge about the relationship between
                                           population and housing dynamics in large cities. Empirically, it provides evidence on the existence
                                           and magnitude of (mis)matches in Lisbon’s housing market and explores the underlying dynamics

                                    behind them. Lastly, it offers some policy tools and recommendations to address these (mis)matches.

Citation: Garha, Nachatter Singh,
                                           Keywords: demographics; family dynamics; housing demand; housing stock; Lisbon
and Alda Botelho Azevedo. 2021.
Population and Housing (Mis)match
in Lisbon, 1981–2018. A Challenge for
an Aging Society. Social Sciences 10:
102. https://doi.org/10.3390/
                                           1. Introduction
socsci10030102                                  In recent decades, adequate housing for all has become a major concern in many
                                           European cities, which are experiencing demographic changes induced by the accelerated
Academic Editor: Nigel Parton              aging process and massive immigration from different countries outside the European
                                           Union (Pittini et al. 2017). Most of these housing problems are directly or indirectly related
Received: 6 February 2021                  to the changes in the demographics and speculative construction during the last few
Accepted: 10 March 2021                    decades without taking into consideration the future needs of the population. Whilst
Published: 16 March 2021                   there are many studies on the interaction between financial and property bubbles, the
                                           relationship between housing and demographic cycles is still understudied (Myers and
Publisher’s Note: MDPI stays neutral       Ryu 2008; Myers and Pitkin 2009). In this article, we are going to focus on this interrelation
with regard to jurisdictional claims in
                                           in Lisbon.
published maps and institutional affil-
                                                Like other big cities in Southern Europe, such as Madrid, Barcelona, Milan and Athens,
iations.
                                           in recent years, Lisbon, the capital city and the largest urban agglomeration in Portugal, has
                                           suffered several issues related to access to adequate housing (Arbaci 2019; Branco and Sónia
                                           2018; Tulumello and Allegretti 2020). Since 1981, the municipality of Lisbon has witnessed a
                                           significant decline and rapid aging of its population. In 1981, the total population of Lisbon
Copyright: © 2021 by the authors.          was 807 thousand people, about 9% of the total population of Portugal, and the average
Licensee MDPI, Basel, Switzerland.         age of the population was 37.7 years. In 2019, according to estimates by the National
This article is an open access article     Statistics Institute (INE), its population size decreased to 509.5 thousand residents (4.9%
distributed under the terms and
                                           of the total population) and the average age increased to 45.9 years. During this time, the
conditions of the Creative Commons
                                           typical household size and structure also changed with the near disappearance of complex
Attribution (CC BY) license (https://
                                           households and the increasing number of one-person households. Although housing has
creativecommons.org/licenses/by/
                                           been, since the second half of the twentieth century, one of the main concerns for the local
4.0/).

Soc. Sci. 2021, 10, 102. https://doi.org/10.3390/socsci10030102                                                  https://www.mdpi.com/journal/socsci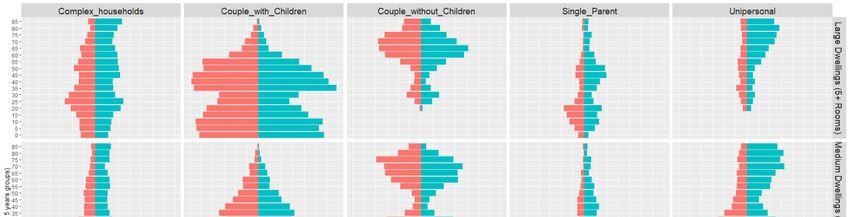
Soc. Sci. 2021, 10, 102                                                                                            2 of 18

                          administration in Lisbon, the massive construction projects started in the late 1970s (Agarez
                          2018) disregarded important demographic trends in the city, namely out-migration (both
                          national and international) and decreasing fertility levels. As a result, Lisbon became a
                          good example to demonstrate how in big cities, demographic dynamics and the housing
                          stock can evolve in opposite directions, leading to an excess of housing stock and yet not
                          meeting the housing needs of the population.
                                Previous studies have shown a two-sided relationship between population dynamics
                          and the housing market in big cities (Mulder 2006). Some researchers have argued that
                          demographic events such as births, migration, union formation and dissolution, disability
                          and death are crucial factors in shaping the supply and demand for housing (Clark and
                          Dieleman 1996; Myers 1990a; Azevedo 2016), while others have highlighted the impact of
                          the size and quality of housing stock and the prevailing tenure regime on the demographic
                          structure of different cities (Castiglioni and Dalla Zuanna 1994; Pinnelli 1995). A sufficient
                          supply of adequate and affordable housing (both for sale and for rent) helps nest-leaving
                          young adults to form new family households and, later, to fulfil their fertility intentions
                          (Vignoli et al. 2013). It also prevents young couples from leaving their hometown and
                          attracts immigrants who increase the size of the population and often make it younger and
                          ethnically diverse (Fransson 2000).
                                The main objective of this study is to identify and measure the magnitude of (mis)matches
                          between the existing housing stock and the housing needs of the population of Lisbon.
                          Our testable hypothesis is that the differentiated demographic and housing trends over
                          the last four decades have created several (mis)matches that affect different age and
                          socio-economic groups in Lisbon differently. Thus, conceptually, this work follows the
                          framework used earlier by Arestis and Gonzalez-Martinez (2017). Methodologically, using
                          a representative sample of Lisbon municipality population and housing as a primary data
                          source (microdata from the IPUMS-International database), we first observed the changes
                          in the structure and household composition of Lisbon’s population in the period from 1981
                          to 2011. Next, we focused on the changes in the size and characteristics of the housing stock
                          and the prevailing tenancy regime in the city. Finally, based on the cross-reference of the
                          demographic and housing stock characteristics, we have identified several (mis)matches in
                          the housing market of Lisbon.
                                This article makes a triple contribution. It adds to the theoretical knowledge on the
                          relationship between population and housing dynamics in big European cities; it provides
                          empirical evidence on the existence and magnitude of (mis)matches in Lisbon’s housing
                          market; and lastly, it provides some policy tools and recommendations to address these
                          (mis)matches. Given that Lisbon shares many of its sociodemographic characteristics (low
                          fertility, aging, erosion of complex households and immigration) and housing issues (size
                          and age of housing stock) with other big European cities, our recommendations can be
                          extrapolated to frame new housing policies in other big cities.
                                The article is structured as follows. Section 2 presents a detailed review of existing
                          studies exploring the relationship between demographics and housing. Section 3 describes
                          the data sources and methods used in this study. Section 4 analyses population and
                          household structure, size and quality of Lisbon’s housing stock. It also highlights the
                          mismatches between population and housing dynamics in Lisbon. Finally, Section 5
                          presents some concluding remarks and a discussion regarding the main aspects of these
                          mismatches and suggests some measures to deal with them.

                          2. Literature Review
                          The Two-Sided Relationship between Population Dynamics and Housing Market
                                In the late 1960s, Campbell (1963, 1966) analyzed the relationship between demo-
                          graphic swings and housing construction cycles and showed the impact of irregularities in
                          the demographic structure on aggregate demand for housing in the United States. Later, in
                          his classic work on Housing Demography, Myers demonstrated that “at different geographic
                          scales, demographic changes provide a solid explanation for many residential processes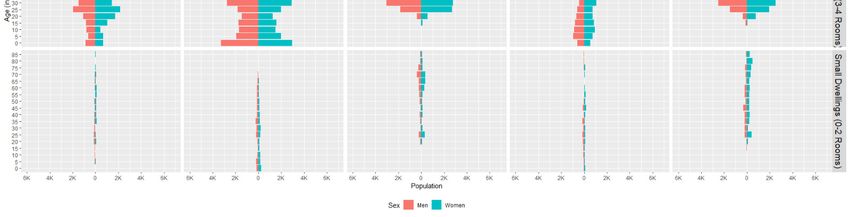
2. Literature Review
The Two-Sided Relationship between Population Dynamics and Housing Market
In the late 1960s, Campbell (1963, 1966) analyzed the relationship between
graphic swings and housing construction cycles and showed the impact of irregu
Soc. Sci. 2021, 10, 102 in the demographic structure on aggregate demand for housing in 3 ofthe
18 United
Later, in his classic work on Housing Demography, Myers demonstrated that “at d
geographic scales, demographic changes provide a solid explanation for many resi
processes that must be taken as a key aspect in the analysis of housing systems”
that must be taken as a p.
1990b, key306).
aspect in the
More analysisMulder
recently, of housing systems”
(2006) (Myers
explained the1990b, p. 306). housi
links between
More recently, Mulder (2006) explained the links between housing and population
population as a two-sided relationship, in which the population influences as a h
two-sided relationship, in which the population influences housing through the demand
through the demand created by nest-leaving young adults, marriage or consensual
created by nest-leaving young
childbirth, adults, marriage
separation or consensual
or divorce, and housingunion, childbirth,
influences separation distribu
the geographic
or divorce, and housing influences the geographic distribution of people and households
people and households through the attraction or deterrence of migrants, facilita
through the attraction or deterrence of migrants, facilitating or hindering nest-leaving of
hindering nest-leaving of young adults and keeping in place or pushing away the r
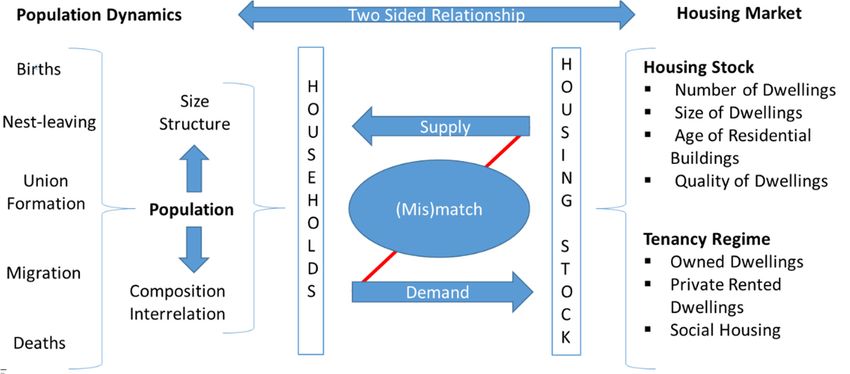
young adults and keeping in place or pushing away the resident population (Figure 1).
population (Figure 1).
Figure 1. Two-sided
Figure relationship
1. Two-sided between
relationship population
between dynamics
population and housing
dynamics market.
and housing Source:
market. Own elaboration.
Source: Own
elaboration.
Among demographic factors, age structure is considered the most importan
that determines
Among demographic the age
factors, interaction
structure between population
is considered and housing
the most important behavior
factor (Myers
that determinesMyers and Pitkin
the interaction 2009). population
between The demand andforhousing
housingbehavior
changes(Myers
with age,1990b;both in qua
Myers and Pitkin and2009).
quantitative
The demandterms for(Marcos
housingandchanges
Módenes 2019).
with age,This
bothchange, at an aggregat
in qualitative
and quantitative determines
terms (Marcosthe total
anddemand
Módenes for2019).
housing Thisunits in theatfuture.
change, Campbell
an aggregate (1963, 1966
level,
determines theanalysis of population
total demand dynamics
for housing units and
in theconstruction cycles in(1963,
future. Campbell the United
1966)States,
in has e
his analysis of sized
population dynamicsofand
the importance ageconstruction cycles inthe
structure in shaping thedemand
United and States, has of hous
supply
emphasized theits importance
impact onofhouse age structure
headshipinand shaping the demand
ownership rates. Inandthesupply
youngofpopulation,
houses the
and its impact onnewhouse headshipisand
households high,ownership
which inrates.turn In the young
increases the population,
demand forthe new flow housing u
of new households is high,
contrast, which
in an agingin turn increases
population, thethebalance
demand for newthe
between housing units.ofInnew hous
formation
contrast, in an aging population, the balance between the formation of new
by young adults and the dissolution of households with the death of the elderly r households
by young adults and the dissolution
equilibrium, which inof households
turn offsets thewith the death
demand for newof the elderlyunits
housing reaches(Myers et al
equilibrium, which in turn offsets the demand for new housing units (Myers
In their study of OECD countries, Lindh and Malmberg (1999, 2008) demonstrat et al. 2002). In
their study of OECD
there countries, Lindh and Malmberg
is a close relationship between the (1999, 2008)
aging demonstrated
process and the that there in dema
reduction
is a close relationship between
new housing. Inthe
an aging
aging process
population,and such
the reduction
as in Lisbon in demand
(Bandeira foretnew al. 2014), a
housing. In an aging population, such as in Lisbon (Bandeira et al. 2014), as
people die or move to retirement homes, more apartments become vacant. This ca more people die
or move to retirement homes, in
to a situation more apartments
which the supply become vacant. units
of housing This can lead to
exceeds a situation
demand, resulting in
in which the supply of housing units exceeds demand, resulting into
derutilization of housing stock and a fall in home equity, in the sense thatunderutilization of new buy
housing stock and a fall in home equity, in the sense that new buyers are willing
willing to pay less due to the oversupply in the housing market (Pitkin and Myers to pay less
due to the oversupply
Disparitiesin the
in housing
the size of market (Pitkin
different and Myers
generations as 2008). Disparities
they progress over intime
the also aff
size of differentdemand
generationsand as they progress
supply of housing over time1999;
(Myers also affect
Myersthe and demand and As
Ryu 2008). supply
cohorts with
of housing (Myers 1999; Myers and Ryu 2008). As cohorts with
population enter adulthood, the demand for housing increases, and asa large population enter
they age and
adulthood, the demand for housing increases, and as they age and begin to die or move
into collective homes, they leave a large number of vacant apartments that increases the
supply of houses in the housing market.
Some researchers have argued that the number, size and composition of households
are more important factors then the total size of population in determining future housing
needs (Mulder 2006). Households are very dynamic units. As people grow and form
relationships, they often move from one household type to another, which in turn changes
their housing needs. The high cost of construction and the long life cycle of dwellings (onceSoc. Sci. 2021, 10, 102 4 of 18
built dwellings can be used for several decades) make the housing stock less flexible to
meet the requirements of highly dynamic population and households. People often find it
difficult to move from one home to another with every change in their life course, such as
marriage, childbirth, disability and the death of the partner, due to financial constraints
and also attachment to their existing homes and neighborhoods. This urge of “aging in
place” (Frey 2007) reduces household’s mobility from one dwelling to another, making the
housing market less responsive to changes in demographic and household structure, and
creates mismatches.
Nest-leaving of young adults is one of the most important steps in the formation of
new households (Fransson 2000). Young adults leave their parent’s home for a variety of
reasons, including education, work, independence or union formation, creating demand for
new affordable housing (Azevedo 2016). Those who leave their parent’s home for education
and work have few choices and are more likely to accept substandard houses with relatively
high rents; however, those who migrate for independence or union formation (marriage
or consensual union) have more options and they can wait until they get a suitable and
affordable house (Mulder 2006). Their choice of housing tenures is subject to several
constraints such as housing availability and affordability, income and cultural aspects
related to young people’s preferences and expectations (Lennartz et al. 2016; Fuster et al.
2019). At the same time, the supply of affordable and easily accessible houses also affects
the nest-leaving age of young adults (Mandic 2008). In their recent study of millennials
in the United States, Bleemer et al. (2014) showed that young adults are more likely to
delay nest-leaving because of the high price of housing, unemployment and student loans.
Similarly, Ermisch and Di Salvo (1997) explained that high rents or mortgages, a limited
supply of affordable houses and high rates of homeownership affect nest-leaving prospects
and make it particularly difficult for young adults to form their own households. After
nest-leaving, marriages or union formations also contribute to increasing the demand for
houses. When people plan to get married, they often like to secure a suitable place for
themselves first. The number of marriages in a year has a positive effect on the demand
for new houses. Similarly, the supply of adequate and affordable houses also affects the
occurrence of marriages. People tend to postpone marriages or union formations when
they do not find adequate housing (Clark 2012).
The birth of a child in a household reduces the per capita space available to all
members in a dwelling. The lack of living space often compels households to search for
larger dwellings, increasing their demand in the housing market (Azevedo et al. 2019a,
2019b). In their study, Feijten and Mulder (2002) showed that couples in the Netherlands
frequently move into a single-family home or an owner-occupied home, after or shortly
before the birth of a child. The number of children born in a given year has both short-
and long-term effects on the housing market. In the short-term, the high number of annual
births increases the aggregate demand for family dwellings, which in turn increases their
purchase price and monthly rents. In the long-term, the demand for small houses increases
as this large cohort reaches the nest-leaving age at the same time, around 20 years after birth.
The supply of suitable and affordable houses also affects the decision to have the first and
subsequent child. In countries where access to suitable housing is difficult, couples often
delay childbearing, which in turn reduces the desired number of children and the total
number of births (Castiglioni and Dalla Zuanna 1994; Pinnelli 1995). Some studies have
also shown that housing plays an important part in relation to divorce. Homeowners in
Germany (Wagner 1997), Australia (Bracher et al. 1993) and Finland (Jalovaara 2002) were
also found to be less likely to divorce than renters. Death in a household also affects the
housing market in several ways. In a one-person household, death adds another dwelling
to the housing stock. Death of a household member, such as a partner, may also indirectly
affect the availability of dwelling, as the remaining household member may face financial
constraints to maintain the dwelling (Fransson 2000).
In most European countries, immigration has become an important determinant
behind all demographic changes (Zaiceva and Zimmermann 2016). Immigration createsSoc. Sci. 2021, 10, 102 5 of 18
demand for dwellings and emigration contributes to their supply in the housing market.
In his seminal research, Campbell (1966, p. 117) highlighted the importance of immigration
in increasing the demand for rental houses in the United States. As migration affects the
demand for housing, the availability and scarcity of houses also affects migration. The
availability of adequate houses for rent may attract migrants or prevent emigration, while
the scarcity of houses may prevent migrants from entering and encourages the emigration
of young adults who wants to leave their parent’s home (Mulder 2006). Similarly, the
proportion of immigrant population also affects the home-ownership rate in big cities.
There is a huge gap between immigrants and natives with respect to homeownership (Borjas
2002). In their research, Myers and Liu (2005) showed that upon arrival, immigrants have
lower homeownership rates on average than people born in the United States; however,
as length of stay increases, homeownership among immigrants also increases. According
to Helderman et al. (2006), homeowners are less likely to migrate than renters, as the
transaction costs of moving are much higher for owners than for renters. This means that
the higher level of homeownership could seriously hamper the spatial mobility of people
from one dwelling to another or from one place to another (McCarthy et al. 2001).
In addition to the demographic factors mentioned above, other socioeconomic and
political factors such as household income, labor market conditions, ethnicity, availability
of housing credit, financial institutions, economic cycles and policy conditions also have
important influence on the housing market (Herbert et al. 2005; Arestis and Gonzalez-
Martinez 2019). However, this article focuses on the two-sided relationship between
demographic factors and housing characteristics that affect the functioning of the housing
market in Lisbon.
3. Data Sources and Method
For this article, the primary data on the demographic and housing characteristics of
the Lisbon population have been extracted from the IPUMS-International (IPUMS 2020)
database (the last four rounds of the census, i.e., 1981, 1991, 2001 and 2011). From the
census records, information on demographic factors (size, age-structure, sex-composition,
civil status, household structure and composition, and migration status of population) and
the characteristics of dwellings (number and size of dwellings, age of residential buildings,
utilities available in different dwellings, and tenancy regime) is obtained to explore the
changes in the demography and the housing market in the municipality of Lisbon. All
information is available and representative of the resident population at the municipal level.
In addition to the census data, information on the recent demographic trends (2011–2018)
has been collected from municipal records published online by INE Portugal.1
A detailed exploratory data analysis (Tukey 1977) of the changes in the population
structure and household composition of Lisbon over the last four decades (1981–2019) has
been carried out and then compared with changes in the size and characteristics of the
housing stock and tenure regime in the city. This helped us to identify and measure the
magnitude of the main (mis)matches in the Lisbon housing market.
4. Results and Discussion
4.1. Population, Households and Housing in Lisbon, 1981–2011
Population and household dynamics are the main aspects of urban change worldwide
(Alonso 1980). In order to study the relationship between population dynamics and housing
market in Lisbon, it is essential to explore the changes in the structure and composition of
population, the changes in the number, size and typology of households, and the evolution
of the housing stock and tenancy regime in the last four decades.
1 More information and access to data of IPUMS-International database can be found at IPUMS International and on municipal records of INE
Portugal at Portal do INE.Soc. Sci. 2021, 10, 102 6 of 18
4.1.1. Population Dynamics
For a long time, Lisbon has been the most densely populated city in Portugal (Veiga
2004). During the twentieth century, the size, structure and composition of its population
have witnessed notable changes towards depopulation, aging and ethnic diversification.
In 1961, its estimated population was 802.2 thousand, which represented 9.7% of the total
population in Portugal. In 1981, the total population reached to its maximum, i.e., 807.9
thousand and then began to decrease drastically, i.e., −17.9% in the 1980s and −15.3%
in the 1990s. It reached to 562.1 thousand in 2001. According to the INE, in 2019, the
estimated population of Lisbon was 509.5 thousand and its share in the total population
was 4.95%, which is the lowest figure in the last century (Table 1). In this article, we have
focused on the demographic changes that have occurred since 1981, because it represents
the maximum number of resident population in Lisbon.
Table 1. Population size, growth rate and proportion of the total Portuguese population in Lisbon, 1900–2019.
Life Ex- Mean Age Total
Lisbon Population Live Births (in 0 000) pectancy at at Child- Fertility
Birth (e0) bearing Rate (TFR)
Year
Decadal
Population % of Total Immigrants
Growth Lisbon Portugal Portugal Portugal Portugal
(in 0 000) Population (%)
(%)
1961 802.2 9.7 −5.2 20.4 217.5 63.9 29.6 3.2
1971 760.2 9.4 6.3 15.7 181.2 66.9 29.0 3.0
1981 807.9 8.7 −17.9 6.7 10.8 152.1 71.7 27.2 2.1
1991 663.4 7.1 −15.3 6.5 6.3 116.3 74.1 27.5 1.6
2001 562.1 5.4 −3.5 8.5 5.8 112.8 76.7 28.7 1.5
2011 542.4 5.1 −6.1 12.1 4.8 96.9 79.7 30.1 1.4
2019 509.5 5.0 4.3 86.2 80.6 31.2 1.4
Source: Own elaboration, with data from census records 1900–2011 and population estimates 2018, Lisbon (INE).
Since 1981, the accelerated depopulation has become a main feature of Lisbon’s
demography. In the period between 1981 and 2019, Lisbon has lost 298.4 thousand people,
approximately 37.2% of its residents. A comparison of the population structure of Lisbon
in 1981 and 2018 shows that most of the depopulation occurred in the age-groups of 0–70
years (−328.4 thousand). However, positive growth is recorded in the age group of 70+
years (+30 thousand). This shows the continuous aging of Lisbon’s population.
According to the census microdata, the mean age of the population in 1981 was 37.7
years, much higher than the national average, i.e., 31.1 years. It increased to 41.1 years in
1991 and 44.3 years in 2001 due to the sustained decline in fertility levels and increased
life expectancy. Between 2001 and 2011, this trend slowed down with sustained national
and international immigration flows to the city. In 2011, it reached 44.5 years (42 for men
and 46.5 for women), which was still higher than the national average (41.8 years), but the
difference narrowed from 6.6 years in 1981 to 2.7 years in 2011. More recently, in 2019, it
was 45.9 years (42.8 years for men and 48.6 years for women), which demonstrates the
continuity of the aging process. Contrary to what happened at the national level in the
1960s, where the emigration of young people was the main driver of population aging
(Bandeira et al. 2014), in Lisbon, aging was mainly due to the increase in the life expectancy
at birth and the rapid decline in fertility. Improvements in living conditions, medical care
and health services contributed to reducing mortality and extending life expectancy. Life
expectancy at birth (e0) has increased remarkably from 63.3 years in 1960 to 80.9 years
in 2018 (Pordata 2020). On average, women in Portugal live 6.5 years more than men.
This gender difference has been more or less constant for the past half century. Regarding
fertility, the total fertility rate (TFR), i.e., the average number of children per women, in
Portugal, drastically decreased from 3.2 children per women in 1960 to 1.4 children in
2018 (Ibid). The fertility decline in the Lisbon metropolitan area was lower than the rest of
Portugal (1.7 children per women in 2018), which was partly due to the concentration ofSoc. Sci. 2021, 10, 102 7 of 18
the immigrant population in Lisbon that has maintained a higher TFR compared to the
native Portuguese population (Oliveira and Gomes 2014; Sousa-Gomes et al. 2016).
The speed of the aging process is also visible from the changing proportion of different
age groups in the total population. The proportion of children (0–14), young adults (15–29)
and adults (30–64) in the total population has decreased from 18.8%, 21.8% and 45.2%
in 1981 to 16.3%, 12.1% and 43.4% in 2019, respectively. However, the proportion of the
elderly (65 years and over) has increased from 14.1% in 1981 to 28.3% in 2019.
In addition to structural changes, since 1981, the population of Lisbon has also become
increasingly diverse with the sustained influx of people from different EU and non-EU
countries (Malheiros and Fonseca 2011). The total number of foreign-born residents in
Lisbon has increased from 49.7 thousand in 1981 to 53.5 thousand in 2011. Despite a small
increase in the actual number, the share of foreign-born residents has increased from 6.7%
in 1981 to 12.1% in 2011. Most of the immigrant population is concentrated in the 25–50
age-groups. It has reduced the depopulation rate in Lisbon in these age groups. The
immigrant population has also diversified significantly with the arrival of immigrants from
countries that have no colonial or cultural ties to Portugal. In 1981, most of the immigrant
population in Lisbon originated from former Portuguese colonies (Angola, Mozambique,
Cape Verde, Brazil and India) and neighboring countries (Spain and France). In 2011,
immigrants from some new countries of origin, like China, Romania, Guinea-Bissau and
Nepal, constituted a considerable part of the total immigrant population in Portugal.
In short, we can conclude that the past four decades have shown that Lisbon is going
through a process of accelerated depopulation, aging and ethnic diversification. Since
these changes in demographic structure and composition have a significant impact on the
formation and dissolution of households, which in turn affects the demand and supply
of houses, it is important to analyze the impact of abovementioned demographic changes
on the transformation of the household structure and the housing needs of the Lisbon
population.
4.1.2. Household Dynamics
The demand for housing is not only determined by the number of people, but also
by the number of households in a city (Mulder 2006). Changes in the formation, size,
structure and composition of households play an important role in shaping future supply
and demand for housing. There are four main forms of household formation: nest-leaving
of young adults, marriage/union formation, divorce or separation, and older people
moving in with their children or nursing homes. The distribution of population in different
household types, such as one-person, couple with or without children, single parent and
complex, is affected by numerous factors, including the age structure of the population,
the level of union formation and dissolution, the average number of children per family,
the cultural norms about housing patterns and the housing system.
The aforementioned demographic changes have a notable impact on the number,
size and structure of households in Lisbon. According to census data, in 1981 the total
number of households in Lisbon was 286 thousand and the average size was 2.8 people
per household. It decreased to 234.5 thousand in 2001, with an average size of 2.4 people
per household. After 2001, despite the decrease in the total population, the total number
of households increased, reaching 243.9 thousand in 2011. Although the average size of
households decreased to 2.2 person. A comparison between the decrease in the number
of households and the population size in Lisbon between 1981 and 2011 shows that the
decrease in population (32.1%) was much greater than the decrease in the number of
households (14.7%). Since 1990, the number of households has remained stagnant, yet the
population is steadily declining. The main driving forces underlying the decline in average
household size are: the increase in the number of one-person households and constant low
fertility over many decades.
In addition to the decline in the number and average size of households, the structure
of households has also undergone notable changes in recent decades. In 1981, 30.5% ofSoc. Sci. 2021, 10, 102 8 of 18
the total population of Lisbon lived in complex households, where they shared dwellings
with members of their extended family or others. In 2011, it decreased to 18.2%. However,
the proportion of one-person households increased from 8.1% in 1981 to 14.7% in 2011.
This increase in the number of one-person households is mainly due to the increase in life
expectancy and the tendency among young adults to spend some time alone in small
apartments, before entering into relationships with others. The proportion of single-parent
households also increased from 4.97% in 1981 to 9.91% in 2011. Most importantly, the
share of couples without children has increased from 12.8% in 1981 to 19.9% in 2011. During
the same period, the proportion of couples with children, which is still the most numerous
household type in Lisbon, decreased from 42.04% in 1981 to 35.7% in 2011. All of these
trends demonstrate that the people in Lisbon are increasingly living in smaller households
of one or two people.
This period has also witnessed a notable change in the age structure and sex composi-
tion of the population in different types of household. The proportion of the population
living in complex households has decreased considerably. However, the decline was much
more pronounced (22 percentage points between 1981 and 2011) for older women compared
to all other age groups. It shows that in 1981 a large proportion of elderly women used
to share dwellings with their children or other relatives, and in 2011 a large proportion of
them live in one-person or group quarter households. In “couple with children” households, the
proportion of both sexes in the adult age-group (15–64 years) has decreased significantly
from 45.4% in 1981 to 39.8% in 2011. In contrast, in “couples without children” households,
the proportion of adult population has increased from 12% in 1981 to 18% in 2011. It shows
that many adults live together, but do not reproduce, which is in line with declining levels
of fertility. The proportion of elderly in “couples without children” households also increased
by about 10 percentage point during 1981–2011, reflecting the increases in life expectancy,
especially for men who used to die much earlier than women. The proportion of women
in “group quarters” has also increased significantly from 3.4% in 1981 to 4.3% in 2011. In
1981, the proportion of children living in single-parent households was 6%, which increased
to 14.5% in 2011. The proportion of adult men and women in single-parent households
also increased from 3.6% and 6.2% in 1981 to 8.5% and 13.1% in 2011, respectively. The
proportion of women in single-parent households has increased remarkably, since in most
cases of separation or divorce, child custody is awarded to mothers. The proportion of
older people in these households has also increased slightly. The share of adult population
of both sexes in one-person households has increased from 8% in 1981 to 13% in 2011. The
most notable increase has been recorded by older women (65 years and over) from 28.1%
in 1981 to 34.3% in 2011. The proportion of older men also increased from 11% in 1981 to
14% in 2011. These changes in household composition have a significant impact on the
demand for housing in Lisbon.
Household formation depends primarily on the emancipation of youth and union
formation (marital or consensual). Therefore, the proportion of young adults (20–34 years)
living with their parents can be a good indicator showing the ease of nest-leaving in
different contexts. In Lisbon, the proportion of young adults aged 30–34 years living with
their parents has doubled from 11% in 1981 to 25.6% in 2001. After 2001, it decreased to
16.7% in 2011. Similarly, in the age group of 25–29 years, this share increased from 21.7%
in 1981 to 44.8% in 2001. In 2011, it also declined to 33%. For the 20–24 age group, it has
increased from 53% in 1981 to 62.5% in 2011. Women in each age group emancipate earlier
than men. These trends are identical to those observed in other south European countries
(Billari et al. 2002). The formation and dissolution of unions also play an important role in
the formation of new households. Any new union formation is very likely to result in a new
couple without children household. Similarly, dissolution of couples leads to a single-parent
household or two one-person households. During the last few decades, people in Lisbon get
married late and divorce more often. In 1981, the proportion of never married people in
the total population was 40.3%, which increased to 45.3% in 2011. However, the proportion
of separated or divorced people multiplied 4 times, from 2.6% in 1981 to 9.3% in 2011.Soc. Sci. 2021, 10, 102 9 of 18
During the same period, the proportion of the widowed population has also increased by 1
percentage point from 7.7% in 1981 to 8.7% in 2011. Only the proportion of the married or
in union population decreased from 49.4% in 1981 to 36.7% in 2011. All these changes have
contributed to the increase in the number of one-person households and the disappearance
of family households.
In summary, it can be concluded that despite a notable decrease in the size of Lisbon’s
population, the number of households has not decreased proportionally. However, the av-
erage size of households has decreased considerably. The proportion of complex households
has decreased and that of one-person and single-parent households has increased notably.
All of these changes have a significant impact on the demand for housing in Lisbon.
4.1.3. Housing Stock and Ownership
The term “housing stock” is commonly used to refer to the total number of dwellings2
for domestic use in an area, region or country. The legacy of family financing, cultural
values related to housing, public policies, privatization and the importance of housing in
the welfare state played an important role in shaping the size and composition of housing
stock in Portugal (Xerez and Fonseca 2016). According to the census data, in 1981, Lisbon
had 239.8 thousand dwellings in its housing stock, which increased to 278.7 thousand in
1991, 293.2 thousand in 2001 and 323.9 thousand in 2011. It shows a steady increase in the
number of dwellings in Lisbon. In 2011, of the total housing stock, 72.8% were exclusively
residential apartments, 10.9% were secondary residences, 15.5% were vacant dwellings,
0.4% were non-residential buildings and the remaining 0.4% were hostels/hotels and group
quarters. Over the past four decades, not only has the size of housing stock increased,
its other characteristics such as age, the number of rooms per house and the quality of
dwellings have also changed considerably. The current housing stock in Lisbon is the result
of several construction cycles over the last century. In 2011, 67.3% of the population and
71.1% of all households lived in dwellings built before 1980. The average age of residential
buildings in Lisbon has increased from 26 years in 1981 to 46 years in 2011. The rapid
progress in technology and changes in demographic structure and lifestyles have changed
the housing requirements of Lisbon’s population that houses built four decades ago do not
meet, which in turn creates various housing problems in the city.
Since 1981, the average size of dwellings in Lisbon’s housing stock has also witnessed
some notable changes. In the 1980s, the housing stock was much more diverse (in terms
of the number of rooms) than in 2011. In 1981, the proportion of small-dwellings (less
than 2 rooms) in the total housing stock was 20.9%, which decreased to 3.4% in 2011.
During the same period, the proportion of medium-dwellings (3–4 rooms) also decreased
from 54.8% in 1981 to 34.1% in 2011. However, the proportion of large dwellings (5+
rooms) increased considerably from 24.6% in 1981 to 62.2% in 2011. The shortage of small
dwellings has a negative impact on the nest-leaving prospects of young adults, who cannot
afford large dwellings. Furthermore, as the age of residential buildings increases, their
potential to maintain a comfortable and healthy life decreases, especially for older people.
Since more than two-thirds of the residential buildings in the municipality of Lisbon were
constructed before 1980, a significant part of them lacks basic services such as central
heating system, air-conditioning and most importantly, elevators, in the case of multi-floor
buildings. According to the 2011 census, 16.1% of all dwellings in Lisbon were without
air-conditioning, 15.1% were without heating system and 44.3% were without elevator. The
lack of these basic amenities has several negative consequences for the inhabitants of these
substandard dwellings. It is a major concern for an aging population.
Regarding homeownership, like other southern European countries, e.g., Italy and
Spain, the high rate of homeownership has been a prominent feature of the Portuguese
housing market (Azevedo 2016). In Portugal, housing has been financed: “through public
2 According to Portuguese census data, “a dwelling is an enclosed and independent place that is built, rebuilt, expanded, transformed or used
exclusively for living purposes during the reference period” (IPUMS, Portuguese Census 2011).Soc. Sci. 2021, 10, 102 10 of 18
funds in the case of social housing, through family financing and through bank loans”
(Xerez and Fonseca 2016). Especially, the role of family in financing of housing through
self-promotion is very crucial (Fahey and Norris 2011; Minas et al. 2013). According to the
2011 census, in Portugal 74% of the dwellings used as main residence were owner-occupied,
18.2% were private rental or sub-rented, and 1.7% were under the social housing schemes.
In fact, in Portugal, the social housing stock is very small and its access is means-tested,
which means that only families with high levels of socioeconomic vulnerability have
access to it (Alves and Andersen 2019). The remaining 6.8% of the dwellings referred to
situations other than those described above (e.g., accommodation provided for free). The
circumstances in Lisbon differ from the national context, with the private and social rental
markets being more relevant than at the national level. In 2011, 51.8% of the dwellings used
as a main residence were owner-occupied, 36% were rented or sub-rented in the private
market, 6.2% referred to social housing, and 6% to other situations.
Contrary to national trends, the proportion of owner-occupied dwellings in Lisbon
was merely 17.6% in 1981. In the 1980s, the political response to the housing shortage
was to encourage homeownership, which influenced the economic and institutional envi-
ronment of the housing market and its regulations to facilitate access to homeownership
(Xerez and Fonseca 2016). Consequently, homeownership became the main investment
for most households in Lisbon (Neves 2000). In the following decades, the proportion of
homeowners increased considerably to 33.5% in 1991, 47.1% in 2001 and 51.8% in 2011.
Currently, more than half of the households have owned dwellings, which reduces the
flexibility of the housing market to meet the needs of the rapidly changing population
and households. More recently, the real estate market in Portugal has started to witness
signs of housing overvaluation due to the recovery of the Portuguese economy from the
economic crisis, the growth of short-term rental market and the interest of foreign investors
in the Portuguese real estate market (Banco de Portugal 2018). The strong preference
for becoming a homeowner and the speculative investments in the housing market has
notably increased the sale price of houses in Lisbon. According to the INE’s Housing Price
Index, the average value of dwellings in Lisbon metropolitan area has increased from 150.4
thousand in 2009 to 209.4 thousand in 2020 (INE 2021a). Similarly, the median value of
per square meter of dwellings in the municipality of Lisbon has increased from EUR 1841
in the second quarter of 2016 to EUR 3227 per square meter in the second quarter of 2020
(INE 2021b).
As per the long-term rental market, the rural exodus of the 1960s and the immigration
caused by the decolonization process in the 1970s increased the demand for long-term
rentals in Lisbon, generating marked social tensions between natives and immigrants
(Pinto 2008; Agarez 2018). The rent freezing legislation of the mid-1960s had made the
rental market very unattractive to homeowners in Portugal (Perista and Baptista 2007). It
affected the supply of long-term rentals in the housing market and increased the rent of
long-term rentals in the city. The 2007–2008 global economic crisis, which led Portugal
to request for financial assistance from the European Commission, the European Central
Bank and the International Monetary Fund, marked the beginning of austerity policies
that liberalized the long-term rental market, relaxed the land-use regulations and created a
tax regime favorable to real estate speculations, which aggravated the problem of access
to housing in Lisbon and other major cities in Portugal (Allegra and Tulumello 2019). A
detailed examination of the long-term rental market in Lisbon shows that the monthly rent
in 65% of the total rent contracts signed before 1975 was less than EUR 100 and in only
2.4% of the contracts the monthly rent exceeded EUR 650. In the 2006–2011 period, the
proportion of rental contracts of less than EUR 100 decreased to 4.12% and that of above
EUR 650 increased to 27.8% (Figure 2). This shows a considerable increase in monthly
house rents in Lisbon. According to recent estimates by INE, the median price of new
rental contracts has increased by 21.2% in Portugal and 24.3% in Lisbon between 2017 and
2019 (INE 2021a).rent in 65% of the total rent contracts signed before 1975 was less than EUR 100 and in
only 2.4% of the contracts the monthly rent exceeded EUR 650. In the 2006–2011 period,
the proportion of rental contracts of less than EUR 100 decreased to 4.12% and that of
above EUR 650 increased to 27.8% (Figure 2). This shows a considerable increase in
Soc. Sci. 2021, 10, 102 monthly house rents in Lisbon. According to recent estimates by INE, the median price of
11 of 18
new rental contracts has increased by 21.2% in Portugal and 24.3% in Lisbon between 2017
and 2019 (INE 2021a).
Figure 2. The
Figure 2. The growth of average
growth of average monthly
monthly rent
rent in
in Lisbon.
Lisbon. Source:
Source: Own
Ownelaboration,
elaboration,with
withdata
datafrom
from
Census records
records 2011.
2011.
4.2. Population and Housing Mis(matches) in Lisbon
4.2. Population and Housing Mis(matches) in Lisbon
In the past four decades, the rapid transformation of demographics (population
In the past four decades, the rapid transformation of demographics (population
structure and household composition) and changes in housing (stock and tenancy regime)
structure and household composition) and changes in housing (stock and tenancy regime)
have created some mismatches in Lisbon’s housing market. Despite a considerable decrease
have created some mismatches in Lisbon’s housing market. Despite a considerable de-
in the size of its population and the number of households, rampant construction from
crease in the size of its population and the number of households, rampant construction
the beginning of the democratic period (after the 1974 revolution) to the 2007–2008 global
from the beginning of the democratic period (after the 1974 revolution) to the 2007–2008
economic crisis, has created a surplus of dwellings in Lisbon. It resulted in a mismatch
global economic crisis, has created a surplus of dwellings in Lisbon. It resulted in a mis-
between the actual demand and supply of housing units, where in 2011 the number of
match between the actual demand and supply of housing units, where in 2011 the number
dwellings was 32.5% higher than the number of households in Lisbon (Figure 3). This
of dwellings was 32.5% higher than the number of households in Lisbon (Figure 3). This
excessive housing stock consists of vacant dwellings, which includes inherited dwellings
excessive
for resale, housing
apartmentsstock
heldconsists
by realofestate
vacant dwellings,
investors and which
banks forincludes
resale,inherited
and second dwellings
homes,
which are occasionally used for vacations (Xerez and Fonseca 2016). This stock of second
for resale, apartments held by real estate investors and banks for resale, and vacant
homes, which
houses, on theare
oneoccasionally used for vacations
hand, has increased (Xerez
the built-up areaandin Fonseca
Lisbon, 2016).
whichThis stock
in turn of
has
vacant houses,
several negativeon the one hand,
consequences forhas
the increased
environment the and
built-up area inofLisbon,
the quality which
life in the city, in
onturn
the
has several negative consequences for the environment and the quality
other hand, incurring a huge annual public and private expenditure on the maintenance of life in the city,
onvacant
of the other hand, incurring
buildings and the aprovision
huge annual public
of basic and private
services such as expenditure
electricity, on the mainte-
water supply
nance of vacant buildings and the provision of basic services such
and sewerage in the neighborhoods where they are located. The average age of Lisbon’s as electricity, water
supply and sewerage in the neighborhoods where they are located. The
population has been increasing and the fertility is decreasing for the last four decades. average age of
Lisbon’s population
Following has been
the arguments raisedincreasing
by Lindhand and the fertility(1999,
Malmberg is decreasing for less
2008), with the last
and four
less
decades.
people Following
entering in thethe
agearguments raisedthe
of nest leaving, bydemand
Lindh andfor Malmberg
new houses(1999, 2008),
in Lisbon with less
is bound to
and less people entering in the age of nest leaving, the demand for new
decrease in the coming years. In that case, these excessive vacant apartments will continuehouses in Lisbon
to be a great burden for the local government.
Over the last four decades, the average size of households in Lisbon has decreased
considerably from 2.8 people per household in 1981 to 2.2 in 2011. At the same time, the
share of large dwellings in the housing stock has increased from 24.6% in 1981 to 62.2%
in 2011 (Figure 4). It shows that the construction waves and real estate planners had
completely ignored the household dynamics of Lisbon. Consequently, the share of small
dwellings in the housing stock has been reduced from 21% in 1981 to 3% in 2011. Since
the change in household size has a direct impact on housing needs (Mulder 2006), it has
created a mismatch between the demand and supply of dwellings of different sizes in
Lisbon. Currently, the shortage of small and affordable houses makes it difficult for young
adults to rent a suitable dwelling for themselves and form new one-person or couple without
children households. Consequently, in 2011, more than 11 percent of all young adults (aged
30–34 years) in Lisbon lived in their parental homes. The growing discontent among youngSoc.
Soc. Sci. 2021, 10,
Sci. 2021, 10, 102
x FOR PEER REVIEW 12 of
12 of 18
18
people
is boundis to
culminating
decrease ininthe
thecoming
form ofyears.
new struggles andthese
In that case, socialexcessive
movements for apartments
vacant the right to
housing
will in Lisbon
continue to be(Tulumello 2019).
a great burden for the local government.
Figure 3. The evolution of family dwellings, household and population in Lisbon, 1981–2011.
Source: Own elaboration, with data from Census records 1981–2011.
Over the last four decades, the average size of households in Lisbon has decreased
considerably from 2.8 people per household in 1981 to 2.2 in 2011. At the same time, the
share of large dwellings in the housing stock has increased from 24.6% in 1981 to 62.2% in
2011 (Figure 4). It shows that the construction waves and real estate planners had com-
pletely ignored the household dynamics of Lisbon. Consequently, the share of small
dwellings in the housing stock has been reduced from 21% in 1981 to 3% in 2011. Since
the change in household size has a direct impact on housing needs (Mulder 2006), it has
created a mismatch between the demand and supply of dwellings of different sizes in
Lisbon. Currently, the shortage of small and affordable houses makes it difficult for young
adults to rent a suitable dwelling for themselves and form new one-person or couple without
children households. Consequently, in 2011, more than 11 percent of all young adults (aged
30–34 years) in Lisbon lived in their parental homes. The growing discontent among
Figure 3. The evolution of family dwellings, household and population in Lisbon, 1981–2011. Source:
young3.people
Figure is culminating
The evolution of family in the formhousehold
dwellings, of new struggles and social
and population movements
in Lisbon, for the
1981–2011.
Own elaboration, with data from Census
from records
Source:
right toOwn elaboration,
housing with
in Lisbon data
(Tulumello 2019).1981–2011.
Census records 1981–2011.
Over the last four decades, the average size of households in Lisbon has decreased
considerably from 2.8 people per household in 1981 to 2.2 in 2011. At the same time, the
share of large dwellings in the housing stock has increased from 24.6% in 1981 to 62.2% in
2011 (Figure 4). It shows that the construction waves and real estate planners had com-
pletely ignored the household dynamics of Lisbon. Consequently, the share of small
dwellings in the housing stock has been reduced from 21% in 1981 to 3% in 2011. Since
the change in household size has a direct impact on housing needs (Mulder 2006), it has
created a mismatch between the demand and supply of dwellings of different sizes in
Lisbon. Currently, the shortage of small and affordable houses makes it difficult for young
adults to rent a suitable dwelling for themselves and form new one-person or couple without
children households. Consequently, in 2011, more than 11 percent of all young adults (aged
30–34 years) in Lisbon lived in their parental homes. The growing discontent among
young people is culminating in the form of new struggles and social movements for the
right to housing in Lisbon (Tulumello 2019).
Figure
Figure 4. Family dwellings
4. Family dwellingssize
sizeininLisbon,
Lisbon,1981–2011.
1981–2011.Source:
Source: Own
Own elaboration,
elaboration, with
with datadata
fromfrom
Census records 1981–2011.
Census records 1981–2011.
This imbalance between supply and demand for housing also leads to simultaneous
over- and under-consumption of dwellings in Lisbon. Due to patterns of low residential
mobility, a characteristic of the Portuguese housing system (Azevedo 2020), some elderly
people live in dwellings larger than necessary for the size of their household, while, at the
same time, disadvantaged groups such as migrant families and young adults live in shared
and/or small dwellings. As a result of the female advantage in life expectancy, the majority
of one-person households in large dwellings are owned by older women (Figure 5). This
drive to “aging in place” (Frey 2007) among Lisbon’s older women, who mostly own large
dwellings, reduces household mobility and makes the housing market less responsive to
changes in demographic and household structure. This mismatch affects the supply of
large dwellings in the housing market and adds constraints for young couples who want
to form families and start having children.
Figure 4. Family dwellings size in Lisbon, 1981–2011. Source: Own elaboration, with data from
Census records 1981–2011.shared and/or small dwellings. As a result of the female advantage in life expectancy, the
majority of one-person households in large dwellings are owned by older women (Figure
5). This drive to “aging in place” (Frey 2007) among Lisbon’s older women, who mostly
own large dwellings, reduces household mobility and makes the housing market less re-
Soc. Sci. 2021, 10, 102 sponsive to changes in demographic and household structure. This mismatch affects the
13 of 18
supply of large dwellings in the housing market and adds constraints for young couples
who want to form families and start having children.
Figure 5.
Figure Relationship between
5. Relationship between the
the size
size of
of dwellings
dwellings and
and household
household type,
type, 2011.
2011. Source:
Source: Own
Own elaboration,
elaboration, with
with data
data from
from
Census records 2011.
The quality
The quality of
of housing
housing inin Lisbon
Lisbon is
is also
also aa major
major concern.
concern. According
According to to 2011
2011 Census
Census
data, 11.4% of Lisbon’s dwellings needed at least medium repairs. This
data, 11.4% of Lisbon’s dwellings needed at least medium repairs. This proportion is even proportion is
even higher among tenants in the private sector (16.8%) and the public
higher among tenants in the private sector (16.8%) and the public housing sector (21.8%).housing sector
(21.8%).
The Theand
elderly elderly and disabled
disabled are moreare more vulnerable
vulnerable to of
to the lack theessential
lack of essential services
services such such
as heat-
ing, air-conditioning, and elevators. In Lisbon, there is a mismatch between the qualitythe
as heating, air-conditioning, and elevators. In Lisbon, there is a mismatch between of
quality of and
dwellings dwellings and the requirements
the requirements of inhabitants,
of inhabitants, leading to manyleading to many
people livingpeople living
in substand-
in substandard
ard housing.
housing. In 2011, 86.8%Inof2011, 86.8%
the total of the total
population overpopulation
65 in Lisbon over
had65dwellings
in Lisbonwith-
had
dwellings without air-conditioning, 15.7% without heating system, and
out air-conditioning, 15.7% without heating system, and 50.7% without elevators (Figure 50.7% without
elevators (Figure 6). All of these deficiencies compromise the health and wellbeing of the
6). All of these deficiencies compromise the health and wellbeing of the elderly (OECD
elderly (OECD 2003). As the number of people over 65 increases rapidly with a constant
2003). As the number of people over 65 increases rapidly with a constant increase in life
increase in life expectancy at birth, this mismatch will create more problems for the elderly
expectancy at birth, this mismatch will create more problems for the elderly population in
population in Lisbon in the coming decades. In fact, a large number of disability problems
Lisbon in the coming decades. In fact, a large number of disability problems in the elderly,
in the elderly, which incurs large health and social costs, are also related to accidents
which incurs large health and social costs, are also related to accidents associated with
associated with falls. In addition to the elderly, many of these substandard houses
Soc. Sci. 2021, 10, x FOR PEER REVIEW 14 are
of 18
falls. In addition to the elderly, many of these substandard houses are occupied by young
occupied by young adults in the 20–35 age group, and most of them are immigrants from
adults in the 20–35 age group, and most of them are immigrants from different non-EU
different non-EU countries.
countries.
Figure
Figure Basic
6. 6. services
Basic inin
services the dwellings
the occupied
dwellings byby
occupied 6565
years and
years over
and people
over inin
people Lisbon, 2011.
Lisbon, Source:
2011. Own
Source: elaboration,
Own elaboration,
with data from Census records
with data from Census records 2011. 2011.
In Lisbon, the size of the housing stock is much larger than the number of house-
holds, creating an excess supply of housing. Normally, the supply is inversely related to
price—when the supply increases, the price goes down—but in Lisbon, despite the large
supply of dwellings, the monthly rents and the purchase prices increase continually. Con-
trary to the findings of Pitkin and Myers (2008), despite the rapid aging of the populationYou can also read