NEW DEMAND PATTERNS FOR PUBLIC TRANSPORT DUE TO DEMOGRAPHIC CHANGE
←
→
Page content transcription
If your browser does not render page correctly, please read the page content below
NEW DEMAND PATTERNS
 FOR PUBLIC TRANSPORT
 DUE TO DEMOGRAPHIC
 CHANGE
                                            Version 2
Working paper
                                              1 2018

Authors:
Doc. Ing.Marián Gogola, PhD.      University of Zilina
Doc. Mgr. Dana Sitanyiová, PhD.   University of Zilina
Ing. Ľubomír Černický, PhD.       University of Zilina
Ing. Milan Veterník, PhD.         University of Zilina
Introduction
According the EU commision the EU is facing unprecedented demographic changes
(an ageing population, low birth rates, changing family structures and migration). In the light
of these challenges it is important, both at EU and national level, to review and adapt existing
policies. The changes on demography has importnat impact on the future demand on all forms
of transport.
The EU strategy [65] called Europe 2020 for smart, sustainable and inclusive growth
sets important targets to lift at least 20 million people out of poverty and social exclusion and
to increase employment of the population aged 20-64 to 75%. The main initiatives of the
Europe 2020 strategy, including the Platform against Poverty and Social Exclusion and the
Agenda for New Skills and Jobs, support efforts to reach these targets.
We know that transport is one of the basic sectors that significantly affect socio-
economic development and growth in living standards. Mobility and its quality is one of the
key elements of assessment standards in the countries of the European Union (EU). In
passenger transport the quality depends largely on satisfying the everyday needs of citizens,
including the level of access to work, schools, shops, accessibility to social care and to leisure
activities. For large urban areas with increasing population it is not problem. But in recent
years, there is an accompanying phenomenon of development, such as in developed countries,
also in Slovakia, Czech republic, Hungaria, Poland and other countries the increase of road
transport which is represented by significant growth of negative impacts on the environment,
increase congestion in urban areas and the growth of road accidents. In passenger traffic the
growth of individual automobile transport is reflected by a significant decline in the
performance of public passenger transport (rail, bus and public urban transport).
Transport is very important for social, cultural and economic success of each
community - from urban centres to rural communities. The traditional interconnection
between economic success transport and mobility has shifted in the last decade due to:
recognition of the adverse effects of motorized transport on the environment,
social exclusion of those who do not own a passenger car,
rising costs and lack of conventional fuels for transport,
or demographic changes.
Exactly, the significant demographic changes which mostly all of European countries
are experiencing in the last decade are characterized by the transition to a new model of
reproductive behaviour of the population. For instance the current population development in
East European countries is characterized by the same process that took place in the developed
Western and Northern Europe from the mid 60s to late 70s. As reflection of the current
situation in terms of travel behaviour are also significant the changes in the demography, such
as age, gender, household composition or income of its members.
The issue of rural areas where is significantly changed the population call for new
approaches. Why? The answer is very simple. Access to health care, education, work and
other services (e.g., shopping centres) for people living and working in rural areas is a key
issue around the world. [49] The term accessibility has several definitions; for example in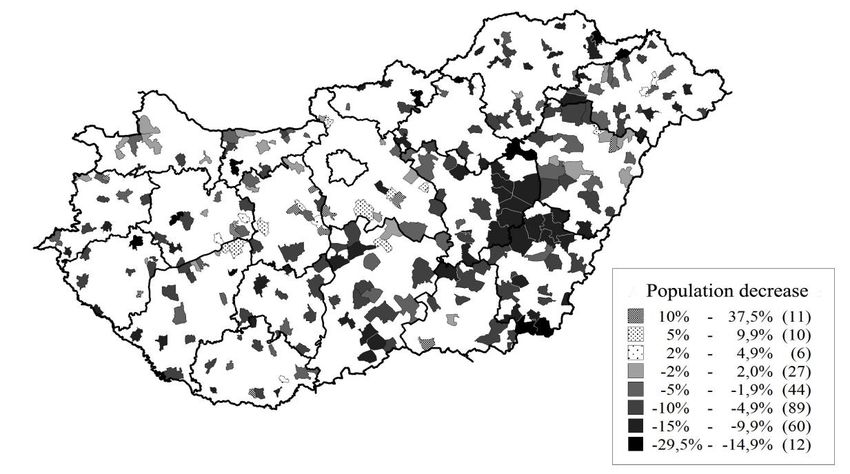
terms of economic and social opportunity, accessibility can be defined as proximity or facility
        for spatial interaction [51]. Here we can find the important taks of transport supply mainly for
        rural areas which are highly dependend on provided transport services or transport
        infrastructure. Accessibility to public transport play important role in social inclusion
        especially for rural areas.

                    1. Demographic and socio-economic changes in selected EU countries
                A large amount of works have studied the impact of socio-demographic variables on
        travel behaviour and found a significant relationship between travel behaviour and variables
        such as age, gender, household composition, household income and so on. [1,2,3]
                Demography is the social science dealing with the study of human populations
        reproduction. It reviews all of the events and processes related to the reproduction of human
        populations. [4]
                Demographic development in Slovakia is characterized by a gradual slowing down
        of population reproduction. The result of that is a deterioration of reproductive rates and age
        structure of the population. The aging process continues, as demonstrated by the higher
        average age of the population of both sexes. In terms of individual continents, Europe is the
        continent with the slowest population growth. In Europe, it showed the smallest population
        growth the Central Europe, where in some countries, e.g. in Hungary or Poland there is
        a decrease in population. Recently, every year there is population declining, also in Romania
        and Bulgaria and some other countries which are not mentioned in the Table 1
        and Figure 1. [5]
                               90
                    Millions

                               80
                               70
                               60
Number of persons

                               50
                               40                                                                     1995
                                                                                                      2000
                               30
                                                                                                      2005
                               20                                                                     2010
                               10                                                                     2015
                                                                                                      2016
                                0

                       Figure 1 Demographic development in selected countries of EU 1995 – 2016 [6]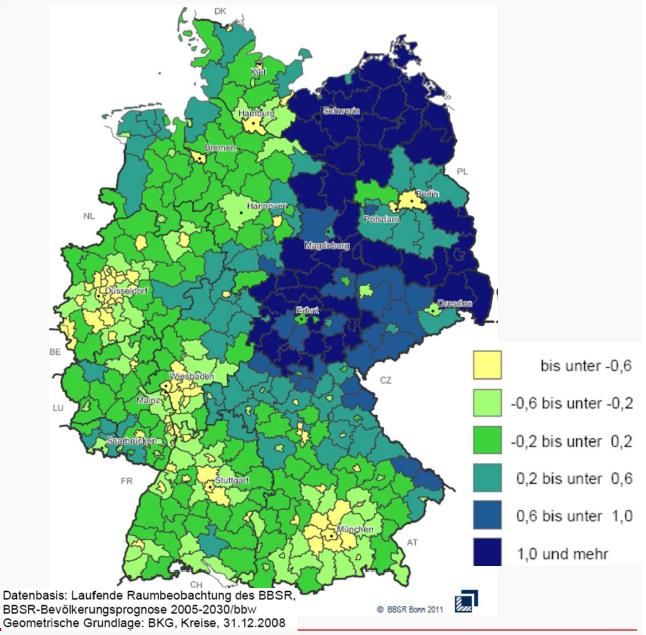
Table 1 Demographic development in selected countries of EU 1995 – 2016 [6]
                                                                                                Change
Krajina\Rok         1995         2000         2005        2010         2015         2016
                                                                                               1995/2016
Poland           38 580 597   38 263 303   38 173 835   38 022 869   38 005 614   37 967 209     -1,59
Romania          22 712 394   22 455 485   21 382 354   20 294 683   19 870 647   19 759 968    -13,00
Hungary          10 336 700   10 221 644   10 097 549   10 014 324   9 855 571    9 830 485      -4,90
Bulgaria         8 427 418     8 190 876    7 688 573   7 421 766    7 202 198    7 153 784     -15,11
Germany          81 538 603   82 163 475   82 500 849   81 802 257   81 197 537   82 162 000     0,76
Czech Republic   10 333 161   10 278 098   10 198 855   10 462 088   10 538 275   10 553 843     2,14
Sweden           8 816 381     8 861 426    9 011 392   9 340 682    9 747 355    9 851 017      11,74
Austria          7 943 489     8 002 186    8 201 359   8 351 643    8 576 261    8 700 471      9,53
Denmark          5 215 718     5 330 020    5 411 405   5 534 738    5 659 715    5 707 251      9,42
Finland          5 098 754     5 171 302    5 236 611   5 351 427    5 471 753    5 487 308      7,62
Slovakia         5 356 207     5 398 657    5 372 685   5 390 410    5 421 349    5 426 252      1,31
                                                                                   Source: Eurostat

  Household size
          Another factor that has an impact on travel behaviour is age. According to several
  studies and statistics, there are differences in the travel behaviour of children, young people,
  adults and older people. These differences occur because they are interested in different types
  of activities. Children are primarily interested in educational and playing activities, young
  people mainly in educational and social activities, adults in work-related activities and the
  pensioners are primarily interested in social and leisure activities. These activities influence
  their travel distance. For example, children’s activities are generally concentrated in a small
  area. Therefore children travel on short distances, because their goals such as primary-
  secondary schools and parks are usually concentrated not far from their homes. It is different
  for adults. Their activities are scattered. Their job can be located at different distances from
  home, they can socialize in parks and restaurants or they can carry out other activities in
  different parts of the city. [26,27]
          The ageing of population will change the households’ structure (smaller family units)
  so that social institutions will be required more and more to replace family care. More
  resources will be needed for structures and services dedicated to people in age: their specific
  needs will have to be addressed in urban planning, infrastructures and services design. [25]

     Figure 2 Distribution of households by size in EU countries for the years 2005-2015 [20]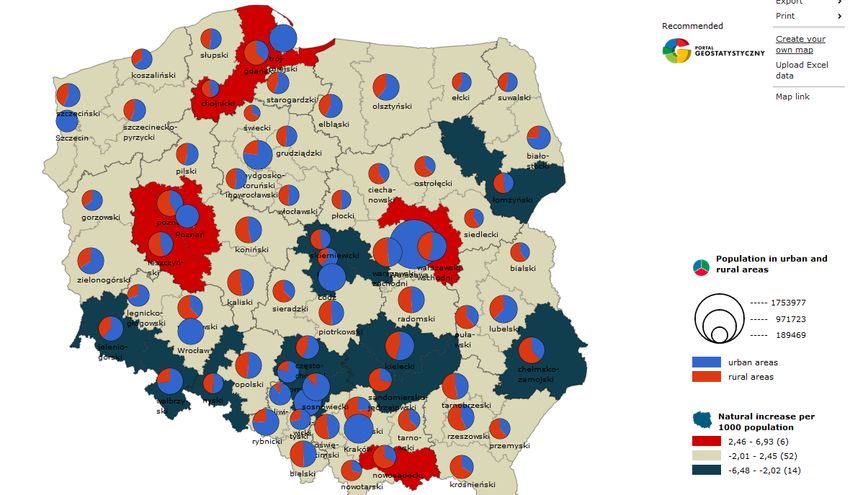
On the following figure 3 we can see the composition of housholds in EU countries.

        Figure 3 Composition of households in individual EU countries in 2015 [20]

                Figure 4 Average household size, comparison 2005 and 2015
                           (average number of households) [20]

Household income
        Household income level is an important variable that affects the travel behaviour of
population. Many studies show that low income of people or households allocates less fund
for travelling, compared to people with high income. That means that people or households
with high income can travel more often and longer because they are able to spend more
money. [21,22] Statistics also show that income level has an effect on the car ownership. High
income allows people to own a car, but this argument is debatable, because some experts have
found that the level of income has a negative correlation to the car ownership. Car ownership
is then influenced by other factors such as household size, cultural habits and so on. [23]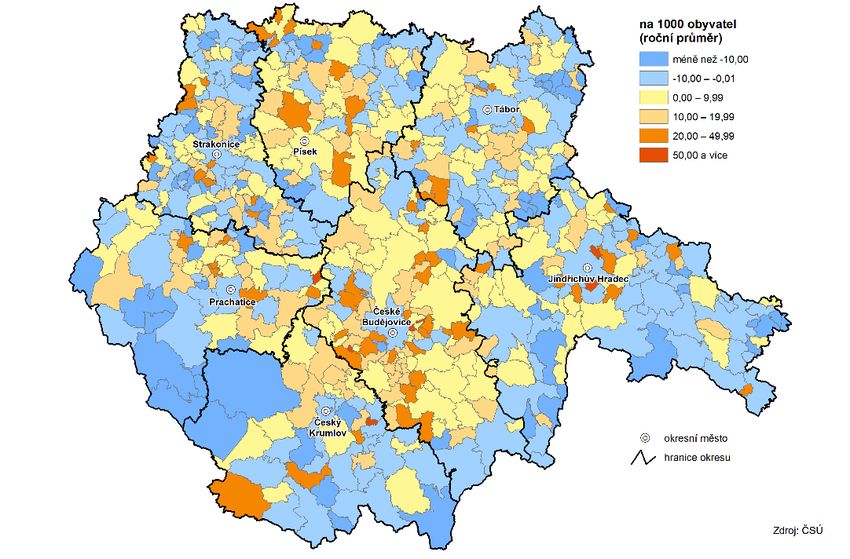
30000

        25000

        20000

        15000

        10000

         5000

              0
                    EU 28 Bulgaria Czech DenmarkGermany Hungary Austria Poland Romania Slovakia Finland Sweden
                                  Republic

                          2005   2006     2007   2008     2009   2010     2011    2012    2013     2014   2015

              Figure 5 Comparison of Average Household Income in Individual Countries
                                         in 2005-2015 [6]
      Table 2 Comparison of Average Household Income in Individual Countries in 2005-2015 [6]
       Year
                  2005       2006       2007     2008       2009        2010     2011      2012       2013       2014     2015
Country
EU 28               :           :          :        :          :    14 879       15 000   15 490     15 472      15 829   16 178
Bulgaria            :        1 379      1 479    2 180      2 828   3 017        2 911    2 859      2 924       3 320    3 332
Czech
                  4 233      4 802      5 423    6 068      7 295       7 058    7 451    7 791       7 694      7 622    7 423
Republic
Denmark       22 116        22 637      23 349   24 154    25 027   25 672       26 944   27 184     27 434      27 861   28 364
Germany       16 395        15 646      17 774   18 304    18 586   18 795       19 043   19 592     19 545      19 712   20 644
Hungary       3 447         3 849       3 936    4 400     4 739    4 241        4 493    4 696      4 449       4 512    4 567
Austria       17 758        17 854      18 156   19 413    20 469   21 058       21 463   21 807     22 073      23 211   23 260
Poland        2 531         3 111       3 502    4 154     5 090    4 402        5 032    5 057      5 174       5 339    5 560
Romania          :             :        1 604    1 954     2 172    2 036        2 089    2 049      2 018       2 158    2 315
Slovakia      2 830         3 313       3 970    4 791     5 671    6 117        6 306    6 927      6 737       6 809    6 930
Finland       17 481        18 304      18 703   19 794    20 962   21 349       21 826   22 699     23 272      23 702   23 763
Sweden        17 501        17 993      18 848   20 573    21 231   19 728       22 498   24 639     26 413      27 120   26 639

                                                                                                      Source: Eurostat

      Unemployment
             Another important factor is the working status. The above mentioned studies show that
      people who work part-time usually travel more than those who work full-time, because they
      are involved in more than one activity, for example shopping, supervising children to school
      or escorting elderly. [24]
             However, there is a significant difference in the case of the unemployed people. As the
      unemployed do not have regular income, their number of daily journeys is also
      decreasing. [25]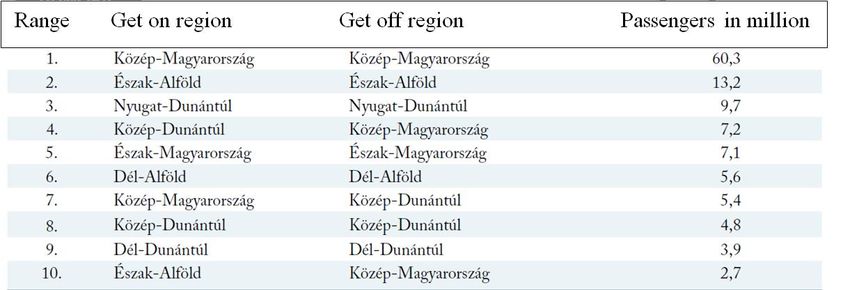
20,0
  18,0
  16,0
  14,0
  12,0
  10,0
   8,0
   6,0
   4,0
   2,0
   0,0
         EU28     Bulgaria    Czech Germany Hungary           Austria     Poland     Romania Slovakia      Finland   Sweden
                             Republic

                2005   2006     2007     2008     2009        2010       2011      2012     2013    2014     2015

            Figure 6 Unemployment in selected EU countries in 2005-2015 [6]
Table 3 Unemployment in selected EU countries in 2005-2015 [6]
         Year
               2005          2006    2007     2008       2009        2010       2011       2012    2013     2014      2015
Country
EU28             9,0           8,2      7,2      7,0       9,0           9,6      9,7       10,5    10,9      10,2      9,4
Bulgaria        10,1           9,0      6,9      5,6       6,8          10,3     11,3       12,3    13,0      11,4      9,2
Czech Republic   7,9           7,1      5,3      4,4       6,7           7,3      6,7        7,0     7,0       6,1      5,1
Germany         11,2          10,1      8,5      7,4       7,6           7,0      5,8        5,4     5,2       5,0      4,6
Hungary          7,2           7,5      7,4      7,8      10,0          11,2     11,0       11,0    10,2       7,7      6,8
Austria          5,6           5,3      4,9      4,1       5,3           4,8      4,6        4,9     5,4       5,6      5,7
Poland          17,9          13,9      9,6      7,1       8,1           9,7      9,7       10,1    10,3       9,0      7,5
Romania          7,1           7,2      6,4      5,6       6,5           7,0      7,2        6,8     7,1       6,8      6,8
Slovakia        16,4          13,5     11,2      9,6      12,1          14,5     13,7       14,0    14,2      13,2     11,5
Finland          8,4           7,7      6,9      6,4       8,2           8,4      7,8        7,7     8,2       8,7      9,4
Sweden           7,7           7,1      6,1      6,2       8,3           8,6      7,8        8,0     8,0       7,9      7,4
                                                                                                        Source: Eurostat

There are also another interesting data provided by Eurostat. For instance the % o people
younger than 60 years and living in the very low work intensity by NUTS 2, see table 4.

Table 4 People living in households with very low work intensity by NUTS 2 regions
(population aged 0 to 59 years)

regions (NUTS2)                                 2012           2013             2014             2015         2016
Jihozápad                                               4,8               5,2              5,8           5,0          4,9
Jihovýchod                                              4,9               3,2              4,3           4,5          4,8
Croatia                                                16,7              14,7             14,6          14,4         13,6
Liguria                                                 7,6               9,4             10,0           8,7 :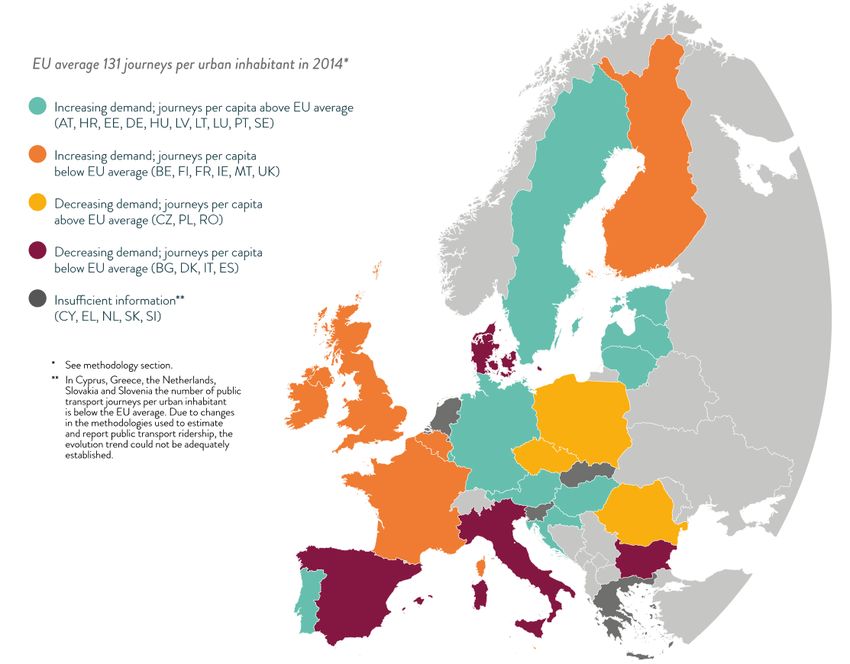
Hungary                                                 13,4            13,5          12,7            9,4          8,1
Közép-Magyarország                                      10,7            12,0          12,8            9,5          7,0
Dunántúl                                                12,3            11,9          11,3            9,0          7,0
Alföld és Észak                                         16,1            15,9          13,7            9,6          9,9
Poland                                                   6,8             7,1           7,3            6,9          6,4
Region Centralny                                         5,5             6,3           6,5            6,2          4,6
Stredné Slovensko                                        7,5             7,5           9,3            9,2          7,1

                                                                                                      Source: Eurostat

The evaluation of At-risk-of-poverty rate by degree of urbanisation especially for rural areas
shows table 5.

Table 5 At-risk-of-poverty rate in % by degree of urbanisation for rural areas of RUMOBIL
countries

GEO/TIME                        2007   2008      2009   2010     2011          2012   2013     2014         2015   2016
European Union (28 countries)     0      0         0    20,5     20,8          19,6   19,9     20,1         19,8     0
Czech Republic                   9,9    8,3       8,5   10,2     11,2          10,4    9,5     10,7          9,1    8,5
Germany                         17,2   18,0      19,2   18,8     17,8          16,2   16,4     15,3         14,5     0
Croatia                           0      0         0    29,0     27,2          26,6   25,6     24,4         26,5   27,0
Italy                           23,9   23,0      22,4   21,4     23,0          24,1   25,4     24,8         20,2     0
Hungary                         16,7   16,2      17,1   17,7     19,2          21,5   21,9     21,0         18,7   18,9
Poland                          22,7   22,5      22,8   23,5     23,4          24,2   25,0     24,1         24,8   23,9
Slovakia                        13,9   13,2      14,6   15,6     16,4          17,2   15,4     16,2         15,0   17,3

                                                                                                      Source: Eurostat

This factor varies from 8 % in Czech republic to 27% in Croatia. Another statics represents
the table 6 that is focused on the income by NUTS 2 regions, see Table 6.

Table 6 Income of households by NUTS 2 regions

                 Region NUTS 2                 2007      2008            2009          2010            2011
                    Jihozápad                 7 200     8 400           7 800         8 000           8 400
                    Jihovýchod                7 100     8 200           7 600         8 000           8 200
                 Sachsen-Anhalt               14 500    15 300          15 200        15 800          16 500
                       Liguria                20 500    20 900          19 700        19 400          19 800
                 Emilia-Romagna               24 500    24 500          22 800        22 500          23 000
                   Észak-Alföld               4 200     4 900           4 400         4 500           4 200
                   Mazowieckie                7 500     8 700           7 700         8 600           8 900
                Stredné Slovensko             5 700     6 700           6 800         7 000           7 300

                                                                                                      Source: Eurostat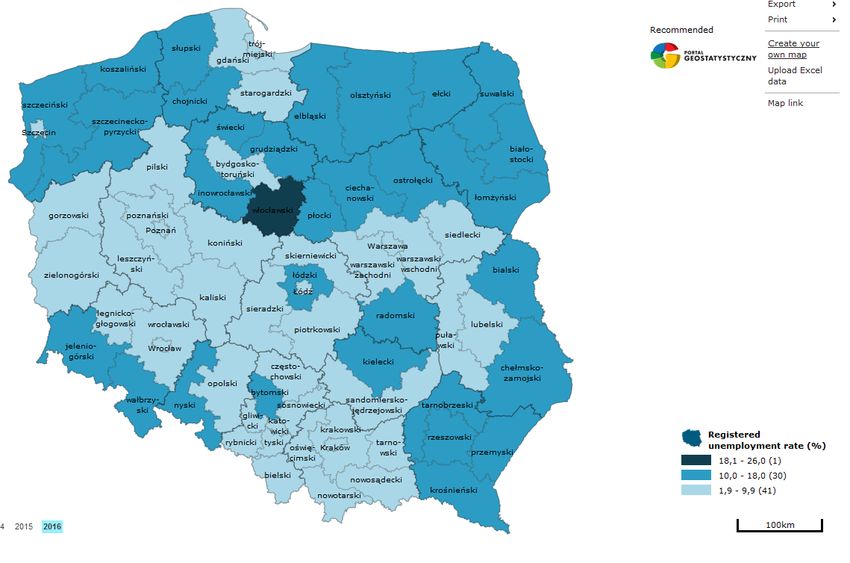
Car ownership
       Car ownership is an important determinant of passenger travel behaviour and it is
fundamentally interconnected with residential location and decision-making regarding
motorised trips. Ownership rates increased significantly during the 70s, and for lower-income
households during the 80s, but flattened and declined in some cases during the 90s.

       The period of growth in per capita vehicle ownership rates coincided with Baby
Boomer’s peak driving years, significant growth in the proportion of women employed
outside the home, rising disposable income, low fuel prices, and suburbanization. The car
ownership rate in Western Europe is reaching saturation point, and a confluence of events and
changes in lifestyle may lead to a possible reduction in the next decades.

        Nowadays people living in urban areas are provided with several public transport and
car sharing options to satisfy their mobility needs, and slow mobility (walking and cycling) is
gaining increasing attention; the ageing population will inevitably modify its long-term
mobility patterns relying more and more on public transport as driving capability will expire;
the observed trends of re-urbanisation and consumers’ increased preference for walkable
neighbourhoods will probably slow down the urban sprawl trends and reduce car dependency;
in addition, (as further explained later on when discussing the change of lifestyle) younger
generations are showing more interest in technological gadgets and social networks rather
than in owing a car. [25]

 50 000 000
 45 000 000
 40 000 000
 35 000 000
 30 000 000
 25 000 000
 20 000 000
 15 000 000
 10 000 000
  5 000 000
         0
              Bulgaria     Czech Germany Hungary     Austria   Poland   Romania Slovakia   Finland    Sweden
                          Republic

              2005       2006   2007   2008   2009    2010     2011     2012   2013   2014     2015

Figure 7 Development of the number of registered cars in selected EU countries in the period
                                     2005-2015 [6]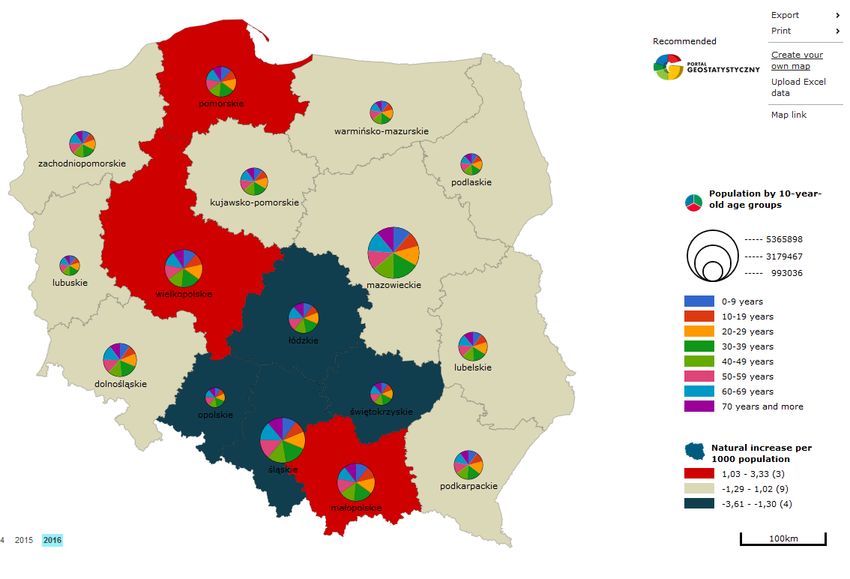
Table 7 Development of the number of registered cars in selected EU countries 2005-2015 [6]
   Year
             2005         2006         2007         2008         2009         2010         2011         2012         2013         2014         2015
Country
Bulgaria   2 538 000    1 768 000    2 082 000    2 366 000    2 502 000    2 602 000    2 695 000    2 807 000    2 910 235    3 013 863        :
Czech
           3 959 000    4 109 000    4 280 000    4 423 000    4 435 000    4 496 000    4 582 000    4 706 000    4 729 185    4 833 386    5 115 316
Republic
Germany    46 090 000   46 570 000       :        41 321 000   41 738 000   42 302 000   42 928 000   43 431 000   43 851 000   44 403 000   45 071 000
Hungary    2 889 000    3 214 000    3 262 000    3 055 000    3 013 720    2 984 060    2 967 810    2 986 030    3 040 732    3 107 695    3 196 856
Austria    4 157 000    4 205 000    4 246 000    4 285 000    4 360 000    4 441 000    4 513 000    4 584 000    4 641 308    4 694 921    4 748 048
Poland     12 339 000   13 384 000   14 589 000   16 080 000   16 495 000   17 240 000   18 125 000   18 744 000   19 389 446   20 003 863   20 723 423
Romania    3 364 000    3 221 000    3 541 000    4 027 000    4 245 000    4 320 000    4 335 000    4 487 000    4 696 000    4 908 000    5 155 000
Slovakia   1 303 700    1 333 700    1 433 900    1 544 900    1 589 000    1 669 100    1 749 300    1 824 200    1 879 800    1 949 100    2 034 574
Finland    2 430 000    2 506 000    2 570 000    2 700 000    2 777 000    2 877 000    2 978 000    3 037 000    3 105 834    3 172 735    3 234 860
Sweden     4 154 000    4 202 000    4 258 000    4 279 000    4 299 950    4 334 390    4 400 550    4 446 349    4 494 661    4 584 711    4 668 262

                                                                                                                   Source: Eurostat

                There is interesting issue regarding the minimum budget cost for transport for people living in
                rural areas which was already investigated by number of studies [45] .

                Automobilization
                        Automobilization development issues include a wide range of factors that need to be
                monitored and evaluated for their impact on society. The increase in the number of cars and
                their intensive use is on the one hand negative, in the form of a negative impact on the
                environment and, on the other, positively affects the development of the economy,
                employment and influence the way people live.

                         Increased use of passenger cars is most pronounced in densely populated areas,
                causing difficulties in the environmental sustainability of the environment, which means that
                it acts predominantly as a negative factor that degrades the environment of predominantly
                cities. In this context, it is necessary to establish an effective level of cooperation between
                individual car and mass passenger transport, which in many cases is a complex task for
                transport planners. Different measures, however, can effectively influence the division of the
                transport work, especially during work journeys, that is, journeys that are regularly repeated
                throughout the day.
700
600
500
400
300
200
100
0
Bulgaria Czech Germany Hungary Austria Poland Romania Slovakia Finland Sweden
Republic
2005 2006 2007 2008 2009 2010 2011 2012 2013 2014 2015
Figure 8 Automobilization in selected EU countries in the period 2005-2015 [6]
Table 8 Automobilization in selected EU countries in the period 2005-2015 [6]
Year
2005 2006 2007 2008 2009 2010 2011 2012 2013 2014 2015
Country
Bulgaria 333 233 277 317 337 353 368 385 402 418 :
Czech Republic 387 401 414 424 424 429 436 448 450 459 485
Germany 559 566 : 504 510 527 534 539 543 547 548
Hungary 287 319 325 305 301 299 299 301 308 315 325
Austria 504 508 511 514 522 530 537 542 546 547 546
Poland 323 351 383 422 434 453 476 492 510 526 546
Romania 158 152 172 197 209 214 216 224 235 247 261
Slovakia 243 248 267 287 295 310 324 337 347 360 375
Finland 462 475 485 507 519 535 551 560 570 580 590
Sweden 459 461 464 462 460 460 464 465 466 470 474
2. Urbanization and suburbanization
The process of urbanization, that is, the movement of the population from rural to the
urban settlements and from the smaller settlements to the larger ones, peaked in the Slovakia
in the early 90s of the last century. The migration of the rural population to the cities in this
period was related to the centrally planned economy of the former Czechoslovak Socialist
Republic, but mainly to the housing development directed at the main settlement centres
where the main investment stocks and job opportunities were concentrated. [8]
The following subchapters describes the situation in particular countries based on the
available data.Slovakia
With abolition of central planning, the migration patterns of the population began to
change. The current migratory processes of the population can be characterized as compaction
of the population into certain municipalities located in the background and the distance to the
centres of gravity. This fact can best be documented on the example of the capital of the
Slovakia – Bratislava. [7]
Figure 9 Population development in Bratislava and the surrounding area [7]
Suburbanization is a process of change in population deployment. Most often it is
defined as the process of moving people to their suburbs or surrounding rural communities.
However, this process should be seen not only as a change in population distribution and
spatial structure of suburban areas but also as a change in the way of life of „suburban“
inhabitants. While most countries in Central and Eastern Europe are experiencing declines in
cities, the trend in the developed countries of Western Europe is exactly the opposite. The
reason is to move people from the town to the countryside, respectively, in Western Europe
the opposite. [9]
In the Slovakia are markant very strong trend urbanization and also suburbanization.
The urbanization is present mainly in big cities as Bratislava where people are moving from
East Slovakia to West Slovakia. Together with this trend there is also strong suburbanization
that means people from cities are moving from towns anc cities to the close villages. For
instance the Bratislava region has strong position from the perspective of number of job
places. This fact causes the attraction of people from other parts of Slovakia. But due to fact
there are higher cost of living in comparison to average of Slovakia, the migrant are searching
for cheaper condition of living. The incoming people are settleing in counties around the city
of Bratislava. Therefore the population in these counties has the increasing tendency, see Fig.
Another importat finding constists in fact that the villages or towns with the highest increase
of populatin are located very close to Bratislava, see Fig.10.The population trend in county of Malacky, Pezinok and Senec
2000 2001
25000
2002 2003
20000
2004 2005
15000
2006 2007
10000
2008 2009
5000
2010 2011
0
Malacky (-05,5%) Pezinok (+02,8%) Senec (+23,9%)
2012 2013
2014 2015
Figure 10 Demographic development in County towns Malacky, Pezinok, and Senec 2000 –
2015
source: Slovak statistics office
2000
10000 90,0
2001
9000 80,0
8000 2002
70,0
7000 2003
60,0
6000 2004
50,0
5000 2005
40,0
4000
2006
30,0
3000
2007
2000 20,0
2008
1000 10,0
0 0,0 2009
2010
2011
2012
Figure 11 The population trend of cities and villages around the Bratislava grouped by
distance from Bratislava [10]source: Slovak statistics office
The same problem is in Zilina county, see Table 9. The Rajec valley is one of the
suburban directions from city of Zilina. The demographic statistics shows the increasing the
number of population of villages where are moving mainly people from Zilina.
Table. 9 Comparison of the population trend of villages and towns in Rajec valley
(yellow colour are marked villages in 20 km distance from Zilina)
town/village 2009 2010 2011 2012 2013 2014 2015 2016
Rajecké Teplice 2 938 2 938 2 868 2 909 2 932 2 948 2 978 2 985
Rajec 6 069 6 067 5 874 5 864 5 889 5 881 5 850 5 824
Lietavská Lúčka 1 790 1 792 1 751 1 760 1 763 1 774 1 779 1 823
Porúbka 455 461 440 440 453 466 481 494
Konská 1 458 1 477 1 459 1 483 1 478 1 505 1 514 1 542
Zbyňov 870 876 829 834 838 835 844 857
Kľače 369 366 376 386 387 391 400 398
source: Slovak statistics office
However, there are also other cases, where the authors describe that people are moving
from rural to urban settlements. This is due in particular to low numbers, respectively no job
opportunities, lack of services, no or very poor quality of public transport, and thus the overall
lower quality of life. Young people will not return to college after leaving for college, so the
villages are slowly going away. One example is the village of Driečna in the east of Slovakia.
Currently, there are 4 inhabitants living in the village, but 500 people lived there 50 years ago.
Because of the waning numbers of inhabitants, they have cancelled business or school over
time. [12]
Situation in rural areas.
There is difference between the Western and Eastern part. In Eastern Slovakia [12] the
population has the decreasing trend, which is caused the migration of young people to areas
with jobs. Therefore also some rural areas in Presov or Kosice region have the problem with
low public transport service. On the opposite, there is Bratislava region which has the
increasing trend of population. There are rural settlements which will count with increasing
population due to attraction of Bratislava. There are many examples of rural areas with
increasing population in last year which are very close to the important city or town [35].Czech Republic
In the Czech Republic, the situation is similar to Slovakia. For example, in České
Budějovice every year the population fall by about 300 inhabitants. On the other hand,
hundreds of people will come to the nearby satellite villages each year. This is also a problem
for schools or parking. Similar problems exist, for example, in the Plzeň Region, Olomouc or
Prague.
The authors of the study “Spatial mobility of commuters – commuting” from the
Faculty of Natural Sciences of Charles University in Prague describe demographic and
socioeconomic developments in 5 municipalities in the Czech Republic. The study shows that
there has been a significant increase in population in the last 10 years, in some cases up to
three and a half times. The reason is a good transport connection between these municipalities
and Prague. Such developments result, for example, in parking problems in the capital of the
Czech Republic – Prague. Based on this, 62 locations were selected to provide parking
facilities, from where the inhabitants of the surrounding cities and villages could continue by
public transport. [13,14]
Figure 12 Population development in 5 municipalities in Czech Republic
source: South Bohemia region
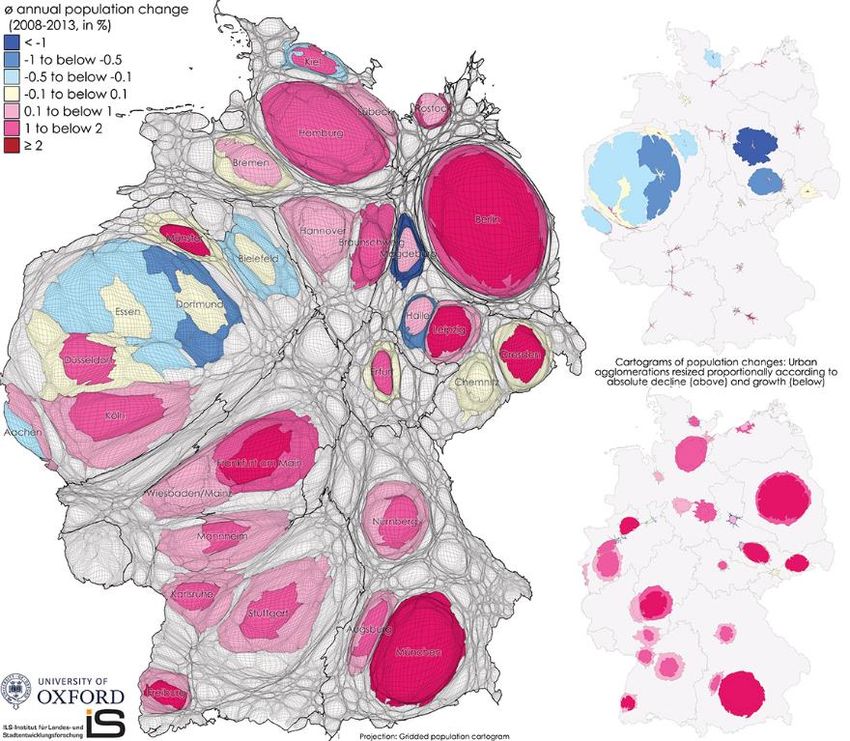
The statistical examples of Region South BohemiaThe South Bohemian region has of 637 834 people. The density is 3,4 persons/km². It is
region with lowest population density in Czech republic. The region has 623 villages and
towns,53 are towns. The settlements is shown in Fig.13.
Fig.13 The settlement in South Bohemia region
source: Czech statistics office
The most population density is in regional capital Ceske Budejovice and then in counties
capital as Strakonice, Písek, Tábor. The lowest density is in county towns which lay in the
border areas (Prachatice, Český Krumlov).Fig. 14 The total increasing/decreasing of population during 2011 -2016 in South Bohemia
region
source: Czech statistics office
The increasing o pupulation diferes from area to area but in general there are increasing of
pupulation mainly near the cities or towns with job places. On the contrary the situation is
different in border areas.
The following examples in Fig. 15 shows the statistics of county of Český Krumlov.
Fig. 15 The natural cahnge of population (left) The migration change in county Cesky
krumlov(right)
source: Czech statistics office
The reason are various but one of them is better standard of living, environment also the
improvement of infrastructure mainly from EU funding. Another fact is also the
unemployment rate which is in this area very low, see Fig.16.
Fig. 16 The map of unemployment rate in South Bohemia source: Czech statistics officePoland
Suburbanization also relates to the Poland. Adam Radzimski, Mical Beim and Bogusz
Modrzewski in their study “Are Cities in Poland Ready for Sustainability? Poznan Case
Study” describes changes over the last 20 years. The city of Poznan is one of the examples of
the suburbanization process and therefore the decrease of the number of inhabitants of the
inner city accompanied by the growth of the whole metropolitan area population. Many new
lands is used without connection to the existing settlement structure, which makes the
provision of public transport services increasingly difficult. This is the reason that private cars
are in most cases the only means of transport that ensures a rapid transfer between the satellite
dwelling and the inner city. [15]
Figure 17 The development of Population Change in the Poznań Metropolitan Area
in 1990 – 2008 [15]Figure 18 The development of the number of passenger cars and the number of passengers
transported by public transport in Poznań [15]
The interesting from Polish statistcs shows the following figures.
Fig. 19 The comparison of population of 10 age groups within PolandSource: Polish Central Statistical office
The comparison of population in rural and urban areas shows that mainly in industrial parts
and region people are living in the cities. On the contrary the areas with agroculture are
characterised mainly with population in rural areas, see Fig. 20.
Fig. 20 The comparison of population in urban and rural areas
Source: Polish Central Statistical office
The highest statistics of unemployment rate is mainly in North and East Poland. The lowest
unemployment rate is in voivodship Mazowiecke.Fig.21 The comparison of unemployment rate in Poland
Source: Polish Central Statistical office
Hungary
Since the mid-1990s, population decline has occurred in Budapest, with more than
10,000 people per year. In 2008, approximately 1.7 million people lived in the capital of
Hungary, which was down 16% compared to 1990.
Figure 22 The population development in Budapest and Budapest agglomeration [16]In Budapest, suburbanization has also changed transport behaviour in a wider
agglomeration for several years since 1990. The number of passenger cars in 2008 reached
886,000 vehicles, or 33 % of all Hungarian passenger cars. In Budapest, 594,000 vehicles
(67%) and 289,000 (in the suburbs) vehicles were registered. Compared to 1990 the total
number of vehicles increased by 15 % in Budapest and up to 121 % in the agglomeration. [16]
Such a development, however, is not only in large cities. Gábor Pirisi and András
Trócsányi in their study have been concerned with reducing the number of inhabitants of
small cities in Hungary. They focused on Hungarian cities with less than 30,000 inhabitants.
The data on the population were taken from the national counting and information database
administered by the Hungarian Central Statistical Office. In total, 259 places were surveyed in
detail from 1870 to 2011. Up to 62% of small cities lost each year about twentieth and 27% of
small cities lost a tenth of their population each year during the decade between 2001
and 2011 (Fig. 16). [17]
Figure 23 Comparison of reducing the number of inhabitants in small Hungarian cities [17]
In Fig. 16 it can be seen that population growth has become exceptional. Growing
small cities or those with a stagnant population are located only on the edge of the
agglomerations, in the Balaton region and in the economically dynamic northwest
region (Fig. 17). In the south-east of Hungary, the demographic situation is much worse than
the average, which shows a faster aging population, very low birth rates, and intra-regional
emigration to surrounding villages. [17]Figure 24 Population change in different regions in Hungary [17]
Szabolcs-Szatmár-Bereg County
The interesting data shows the statistics about the demography in mostly rural area Szabolcs-
Szatmár-Bereg county from 1870 to 2011. In comparison to first evidence of data in 1870
there was increasing of data about 180 %. But in recent years there is evidence of slightly
decreasing of population about 4 % for between 1991-2011. There is higher imigration mainly
from Ukraine and Romania, but migration loss in Szabolcs-Szatmár-Bereg represents 3700
people.
The big problem is also unemployment of the group of people in age between 19-64 years
which represents 51 % of this group that is the highest in Hungary. In the unemployment rate
it represents 9 %.
Tab. 10 The comparison of various demographic characteristics in Szabolcs-Szatmár-Bereg
county from 1870 - 2011
Population as a percentage Annual
Population of the Actual average
density, 1870 previous increase, increase,
Year Population Period
person per decrease decrease (-)
km2 census (-) in
percentages
Present population
1870 299 441 50,4 100,0 – – – –
1880 288 327 48,6 96,3 96,3 1870–1880 -11 114 -0,34
1890 329 131 55,4 109,9 114,2 1881–1890 40 804 1,33
1900 384 060 64,7 127,7 116,2 1891–1900 53 337 1,51
1910 418 482 70,5 139,8 109,0 1901–1910 34 422 0,86
1920 435 119 73,3 145,3 104,0 1911–1920 16 637 0,39
1930 502 136 84,6 167,7 115,4 1921–1930 67 017 1,441941 546 639 92,1 182,6 108,9 1931–1941 44 503 0,85
1949 558 098 94,0 186,4 102,1 1941–1948 11 459 0,26
1960 586 451 98,8 195,8 105,1 1949–1959 28 353 0,45
1970 590 214 99,4 197,1 100,6 1960–1969 3 763 0,06
Permanent population
1980 621 047 104,6 207,4 102,9 1970–1979 17 717 0,29
1990 592 933 99,9 198,0 95,5 1980–1989 -28 114 -0,46
2001 586 158 98,7 195,8 98,9 1990–2001 -6 775 -0,10
2011 572 734 96,5 191,3 97,7 2001–2011 -13 424 -0,21
Resident population
1980 593 829 100,0 198,3 105,0 1970–1979 28 272 0,49
1990 572 301 96,4 191,1 96,4 1980–1989 -21 528 -0,37
2001 582 256 98,1 194,4 101,7 1990–2001 9 955 0,16
2011 559 272 94,2 186,8 96,1 2001–2011 -22 984 -0,37
Source: Hungarian central statistical offfice
In comparison of the population of districts of Nagykálló and Nyíregyházaa we can see the
decreasing trend of population, see tab.11.
Tab. 11 The comparison of population of district Nagykálló and Nyíregyháza between 1970 -
2011
Resident population
Year 2011 Year 2011
Area Hectare population population
per 1 km2 1970 1980 1990 2001 2011 per 1 km2
J08 Nagykállói 37 737 83,1 34 835 34 874 32 248 32 526 30 403 80,6
J10 Nyíregyházi 80 960 204,8 132 213 157 990 162 137 169 091 168 118 207,7
Source: Hungarian central statistical office
Considering the public transport and especially rail passenger transport we can see the
relationship between traffic and particular region, tab.12. For the Northern Great Plain
(Észak-Alföld) region it is 13,2 millions passengers per year 2015.
Table. 12 THE TOP TEN MOST TRAFFICKED REGION PAIRS IN DOMESTIC RAIL
PASSENGER TRANSPORT (2015)Source: Hungarian central statistical office
Germany
At the beginning of the twentieth century, Germany had a total fertility rate (TFR) of
approximately 4.2 children per woman (with a replacement fertility rate of 2.9 children at that
time). The life expectancy of someone born during this time was less than 45 years. The
number of births exceeded the number of deaths by an average of 10.4 per 1,000 residents; the
natural balance in 1900 was +760,000. By the middle of the 1950s the birth rate had
decreased to the new replacement fertility rate of 2.1 children per woman. This phase was
followed by the "baby boom" until the end of the 1960s with peak levels of more than 2.5
children per woman.
The second demographic transition began in Germany at the beginning of the 1970s. It
introduced the long-term trend to a total fertility rate of 1.4 children or less; this level has not
been surpassed since 1991. 1971 was the last year in which the number of births exceeded the
number of deaths. Since then there has been a negative natural balance. The population
growth since then has been dependent upon the level of net immigration. If immigration
decreases, as it did since the middle of the 1990s, or if there is net emigration, as was the case
during the economic crises at the beginning of the 1970s and 1980s, the population in
Germany shrinks. In 2011 the birth deficit grew to -2.3 per 1,000 residents, and the natural
balance sunk even further to -190,000 residents. Nonetheless there was not a population
decline in that year. After many years with increasing population losses due to low or
negative migration balances, the 2011 population in Germany grew slightly for the first time
since 2003 due to the strong growth in net migration. [28]
Approximately half the population of Germany lives in the 30 major urban German
agglomerations, such as Berlin, Hamburg, Munich (München), and Cologne (Köln) but also
in smaller cities including Münster, Freiburg, Leipzig, and Dresden. The gridded cartogram
helps to understand the demographic processes and development that occurred there in recent
years, revealing some distinct trends of re-urbanisation in some of the most densely populated
areas.
Examination of the average annual change in the populations of the selected urban
agglomerations highlights the regional differences in these trends. Contrary to the national
population decline, which is predicted to continue, 26 out of the 30 major agglomerations
show population growth between 2008 and 2013. In 25 of these areas population growth in
the city centre is even higher than in its suburban area. This can be seen as evidence of a very
recent trend of re-urbanisation in these places.
One particularly notable trend is the dynamics in smaller cities such as Freiburg and
Münster, as well as Dresden and Leipzig in East Germany. In addition to high rates of re-
urbanisation, the suburban areas often have stagnating or even declining populations.
The Ruhr area agglomerations are distinctively different from the other areas
described in the overall summary of trends. The stagnating populations in the centres of
Dortmund and Essen are complemented by considerably declining populations in their
surrounding areas. [29]Figure 18 Annual population change in Germany 2008 – 2013 [29]
In Fig. 26 it is possible to see regional demographic changes in the area in Germany.
Despite an influx of 1.2m refugees over the past two years, Germany’s population faces near-
irreversible decline. According to predictions from the UN in 2015, two in five Germans will
be over 60 by 2050 and Europe’s oldest country will have shrunk to 75m from 82m. Since the
1970s, more Germans have been dying than are born. Fewer births and longer lives are a
problem for most rich countries. But the consequences are more acute for Germany, where
birth rates are lower than in Britain and France. [37]
If Germany is a warning for others, its eastern part is a warning for its west. If it were still a
country, East Germany would be the oldest in the world. Nearly 30 years after unification the
region still suffers the aftershock from the fall of the Berlin Wall in 1989, when millions—
mostly young, mostly women—fled for the west. Those who remained had record-low birth
rates. “Kids not born in the ’90s, also didn’t have kids in the 2010s. It’s the echo of the echo,”says Frank Swiaczny from the Federal Institute for Population Research, a think-tank in
Wiesbaden. The east’s population will shrink from 12.5m in 2016 to 8.7m by 2060, according
to government statistics. Saxony-Anhalt, the state to which Bitterfeld-Wolfen belongs, is
ahead of the curve. [37]
Fig. 27 The Germany population forecast [37]
By 2060, Germany will see a population decline of 15 - 20 % (65 - 70 million
inhabitants), according to expert forecasts. The reason will be, in particular, population aging,
internationalization, or a change in the way of life. [19]Figure 28 Regional demographic change in space in Germany 2005 – 2030 [19]
Figure 29 Average annual population growth in % in cities over 500,000 inhabitants
                                  in 1990 – 2015 [18]

     Figure 30 Average annual population growth in % in cities with 200 000 – 300 000
                             inhabitants in 1990 – 2015 [18]

       Of course, even in some German cities there is an unfavorable population
development, such as Neubrandenburg in the northeast of Germany (Fig. 31).. Within the
Land is a major business and economic centre as well as a regional shopping centre of north-
eastern Germany. In 1990, this city had more than 90,000 inhabitants, in 2013 it was only
63,400 and the forecast for the next years is a further decline in the population. [19]
Figure 31 Population development in Neubrandenburg in 1800 – 2025 [19]
There were conducted also some studies which describe the process of social exclusion.
Interesting findings regarding the pheriperalisation was conducted in study by (Leibert,
Golinski,2017), tab.13.
We can see the difference betwenn former East and West Germany even in comparison of
unemployment rate for urban or rural areas. The unemploymwent rate for rural areas is for
instance in West Germany 4,5 %, while in East Germany 10,2 %. Also for example the child
poverty rate is higher in East Germany rural areas 20,7 % in comparison to rural areas in West
Germany 9 %. There are also particular data for Saxony –Anhalt state, so you can see even
higher values for some indicators, see Fig. 13.Tab. 13 The selected indicators of peripheralisation: social exclusion in Germany
Source:[61]
Italy.
Regarding the situation in rural areas in Italy, the National Strategic Plan for Rural
Development (NSP) 2007-2013 distinguishes between four macro-typologies of areas: a)
Urban conglomerations; b) Intensively farmed rural areas; c) Intermediate rural areas; d)Rural areas with general development problems. These areas were identified with some
modification of the OECD methodology for the classification of areas in urban and rural
contexts, which did not allow for sufficient differentiation within the provinces. In Italy the
provinces generally show significant differences across the
country. (See Figure 32).
Fig.32 The indication of rural areas in Italy
Source: :[64]
The rural areas therefore appear with worse condition and accessibility to job places,
education etc.
Interesting facts show various parameters for region Castelfranco Emilia. The trend of total
population has increasing effect about 40 % where in comparison from 1991 to 2011, see
tab.14. The increasing trend is laso related to the mobility to work outside of urban area that
means mainly in rural areas.
Tab. 14 The various indicators of Castelfranco Emilia between 1991 - 2011
Indicator 1991 2001 2011
Resident population 21 247 25 096 31 656
Incidence of surface centers and inhabited areas 7,1 7,6 8,4
Incidence of resident population in sparse rural areas 18,2 15,7 13,3
Demographic density 207,3 244,8 308,8
Social and material vulnerability index 97,6 97,2 98,6
Incidence of young people out of the labor market and
5,5 7,4 11,2
trainingIncidence of disadvantaged families 2,3 2,6 3,0
Population aged less than 6 years 4,1 5,6 7,0
Population aged more than 75 years 8,5 9,0 9,6
Incidence of legally separated and divorced persons 2,1 4,4 6,9
Incidence of foreign residents 8,5 33,9 123,1
Foreign employment rate 72,4 67,1 59,2
Foreign school attendance index 16,7 28,0 38,4
Incidence of housing in property 66,0 72,4 73,7
Daily mobility for study or work 67,9 67,8 69,4
Mobility for study or work outside the municipality area 33,5 34,7 37,2
Mobility for work 106,9 130,0 163,6
Mobility for study 75,7 56,3 48,6
Mobility with private means of transport 64,1 71,9 73,3
Mobility with public means of transport 12,5 8,0 9,8
Slow mobility (feet and bike) 19,1 13,4 14,6
Short mobility 85,5 77,7 78,1
Long mobility 1,6 1,6 4,1
Source: Italian National Institute of Statistics
The similar trend is also in Emilia – Romagna region where the population between 1991 -
2011 has increased about 10 %. But there is the declining trend of population in rural areas
about 30 %.
Tab. 15 The various indicators of Emilia – Romagna Region between 1991 - 2011
Emilia-Romagna Region
Indicators 1991 2001 2011
Resident population 3 910 247 3 983 738 4 342 135
Incidence of surface centers and inhabited areas 6,1 6,5 7,3
Incidence of resident population in sparse rural areas 17,8 15,7 13,1
Demographic density 127,9 152,4 193,4
Social and material vulnerability index 96,60 97,30 98,60
Incidence of young people out of the labor market and
4,20 5,80 8,30
training
Incidence of disadvantaged families 2,60 3,00 3,50
Population aged less than 6 years 3,5 4,7 5,6
Population aged more than 75 years 10,6 11,2 12,0
Incidence of legally separated and divorced persons 2,0 4,7 6,5
Incidence of foreign residents 7,0 39,1 104,1
Foreign employment rate 73,2 68,5 61,1
Foreign school attendance index 16,7 31,7 40,3
Incidence of housing in property 64,9 71,2 72,2Daily mobility for study or work 67,3 67,3 68,9
Mobility for study or work outside the municipality area 23,3 24,5 26,2
Mobility for work 55,1 64,8 79,7
Mobility for study 45,4 33,7 29,1
Mobility with private means 61,6 67,6 69,0
Mobility with public means 13,0 8,8 10,2
Slow mobility (feet and bike) 24,2 16,0 18,5
Short mobility 92,7 83,0 84,4
Long mobility 1,5 1,6 3,6
Source: Italian National Institute of Statistics
The comparison in national scale shows table 16. Here we can see that the population in rural
areas for whole Italy is lower than in discussed regions.
Tab. 16 The various indicators of Emilia – Romagna, Castelfranco Region with average in
Italy
Emilia-
Castelfranco
Indicators Romagna Italy
Emilia
region
59 433
Resident population 31 656 4 342 135
744
Incidence of surface centers and inhabited areas 8,4 7,3 6,4
Incidence of resident population in sparse rural areas 13,3 13,1 9,0
Demographic density 308,8 193,4 196,8
Social and material vulnerability index 98,6 98,60 99,30
Incidence of young people out of the labor market and
11,2 8,30 12,30
training
Incidence of disadvantaged families 3,0 3,50 3,00
Population aged less than 6 years 7,0 5,6 5,6
Population aged more than 75 years 9,6 12,0 10,4
Incidence of legally separated and divorced persons 6,9 6,5 5,4
Incidence of foreign residents 123,1 104,1 67,8
Foreign employment rate 59,2 61,1 58,9
Foreign school attendance index 38,4 40,3 39,5
Incidence of housing in property 73,7 72,2 72,5
Daily mobility for study or work 69,4 68,9 61,4
Mobility for study or work outside the municipality area 37,2 26,2 24,2
Mobility for work 163,6 79,7 85,7
Mobility for study 48,6 29,1 35,2
Mobility with private means 73,3 69,0 64,3
Mobility with public means 9,8 10,2 13,4
Slow mobility (feet and bike) 14,6 18,5 19,1
Short mobility 78,1 84,4 81,4Long mobility 4,1 3,6 5,0
Source: Italian National Institute of Statistics
Conclusion of situation in EU.
Consequences of suburbanization
Suburbanization is one of the possibilities of expanding the city, which has very
diverse consequences on many levels. For a given location, it can be beneficial (e.g.
economic), on the other hand this phenomenon brings many negative consequences, which
can have a lasting and irreversible impact. Therefore, most authors agree that suburbanization
is a negative phenomenon.
The negative consequences include:
1. Government and private investment and operating costs – here it is possible to include
higher infrastructure costs. These include, in particular, the building of different
institutions.
2. Transport costs – for the population, the aggravating factor is a longer travel time and
hence the higher costs associated with car traffic. Adverse consequences may also be
higher social and environmental costs associated with transport, such as noise, dust,
pollution, congestion, etc. For the founders of urban public transport then more
expensive and less efficient transport.
3. Negative impact on the protection of natural habitats.
4. Negative impact on quality of life.
5. Social issues, such as emptying the inner city, unequal distribution of jobs and
people’s homes.
6. In the low populated areas is logically low demand for public transport that lead to
low public transport service supply
In addition to the negative consequences, suburbanization also has some positive
effects. One of the main positive impacts is the economic side. With the new inhabitants, the
economic situation is also coming to the given location, mainly around the strong economical
cities. Building sites requires engineering networks, divorces, new roads, and therefore
investment in infrastructure, benefiting not only residents but also the potential tertiary sector.
[10]
According the Eurostat in 2016, the highest crude rate of natural increase of population was
registered in Ireland (7.1 per 1 000 persons), followed by Cyprus (4.7) and Luxembourg (3.6).
A total of 13 EU Member States had negative rates of natural change, with deaths
outnumbering births the most in Bulgaria (-6.0 per 1 000 persons), Lithuania (-3.7), Romania
(-3.5), Croatia and Latvia (both -3.4) and Hungary (-3.2). In relative terms, Luxembourg (16.2
per 1 000 persons), Sweden (11.9), Malta (11.2), Germany (9.4), and Austria (8.7) had the
highest crude rates of net migration in 2016, while Lithuania (-10.5 per 1 000 persons), Latvia(-6.2), Croatia (-5.4) and Romania (-2.7) recorded the largest negative crude net migration
rates.
Among the 18 EU Member States where the population increased in 2016, 14 recorded both a
natural increase and net migration contributing to their population growth. In Germany,
Spain, Poland and Finland, the positive net migration was the sole driver of population
growth, as natural population change was negative. Of the 10 EU Member States that reported
a reduction in their level of population during 2015, three — Croatia, Latvia and Lithuania —
recorded a decline largely as a result of negative net migration (although this was
supplemented by a relatively low negative rate of natural population change). Conversely, in
Bulgaria, Greece, Hungary, Portugal and Romania the decrease in the level of population was
mostly driven by a negative rate of natural population change (supplemented by a relatively
low negative rate of net migration). In Estonia and Italy, the decline in the population was
solely due to negative natural change, while net migration was positive.
3. The importance of public transport
Providing public transport in low-density areas, which is usually cost-inefficient, has been a
challenge for many governments all over the world. In their quest of finding the right
approach, governments have tried to combine many aspects within a transport system. Of all
these aspects, we distinguish seven “key ingredients” that contribute largely to the success or
failure of such a system. The management of these key ingredients is examined in several
successful cases in the Netherlands. The case studies show that the combination of key
ingredients is crucial for achieving success. Each low-density area can have its own optimal
combination, depending on the wishes of the stakeholders and the circumstances of the
system. However, it appears that the presence of three ingredients is crucial for success: the
presence of financial means, cooperation between stakeholders and flexible supply of
scheduled and on-demand transports. [50]
According the UITP statistics [52] the use of public transport in the EU reached its highest
level since 2000, with a total of 57.9 billion journeys made in 2014 according to UITP's new
Statistics Brief, 'Local public transport in the European Union'. But we can say i tis mainly in
and around the urban areas. 2014 was the first year of distinct growth in demand for public
transport after years of stable demand following the start of the economic crisis in 2008. The
highest total demand in 2014 for bus, tram, metro and suburban rail was recorded in Germany
(10.9bn journeys), UK (7.7bn) and France (7.6bn). Between 2013 and 2014, ‘growth leaders’
France, Italy, Poland and the UK had a combined increase of 600 million journeys, driving up
the total EU figure.
Of the 57.9 billion public transport journeys made in 2014, 55.8% were by bus, 16.1% by
metro, 14.5% by tram and 13.6% by suburban rail. The developments mask significant
national variations, however, which are quite closely linked to national employment figures.
17 EU countries saw higher ridership in 2014 compared to 2010 but only seven had sustained
growth: Austria, France, Germany, Lithuania, Malta, Sweden and the UK. Bulgaria was the
only country where ridership dropped every year since 2000. Encouragingly, countries suchas Spain, Ireland and Italy that have been impacted by the crisis, saw a return to growth in
2014.
Fig. 33 EU-28 Public transport journeys by bus, tram and metro per urban inhabitant
in 2014 and evolution trend in the previous 5 years. [52]
In EU capital cities, the average annual percentage growth in demand (2010-2014) was
highest in Brussels; demand per capita is approximately 2.5 times higher in capital cities than
the national average.
In general there are various approaches regarding the public transport organisations. In many
countries the local or regional public transport is organised by municipalities or their
companies, regional or county government which subsidies the service. The advanced for
integrated organisation of public transport represents the integrated public transport systems
where all regional and urban transport systems are organised by one company so called
integrator or organizator (in Germany, Austria the Public transport unions so called
Verkersverbunds).
For instance also the Czech republic has the good experiences in launching the Integrated
public transport systems. In Slovakia are meanwhile only 2, some in preparation step. But
what is important from legislative framwork is recommendation to have the Public Transport
service plan [60]. In Slovakia it is obliged for eachtown,city or region. This plan determines
the requierements of public transport supply based on the transport demand, mainly on the
changing of socio demographic characteristics.Very similar approach have also in Germany. For instance in Saxony Anhalt in Public
transport plan for 2010 -2025 [59] is also stated goal and the level of public transport service
considering the future forecast. The public transport timetable is planned on the headway
interval (so called taktplan). The plan also stated to goals in updating the transport
infrastructure and maximum travel time to reach important towns, cities in order to get to
work or to schools.
New challenges of Public transport
Public transport is facing a number of challenges and opportunities that result from
changes occurring within the sector itself, as well as from external trends affecting its wider
socio-economic environment. Growing urbanisation leads to an increasing demand for
transport, which requires a corresponding increase in mass transit supply in order to absorb it.
Cities have multiple modal choices at their disposal, most often proposed in a combination –
conventional or automated metro, light rail or tramway, bus or BRT, or waterborne – plus
other less conventional modes such as cable car, tram-train or monorail to meet specific
needs. Within this range, cities can choose the most appropriate modes and take advantage of
potential spill-overs, through coordination and prioritisation. Cities with long-established
public transport systems, particularly ageing rail infrastructure and rolling stock now need
rehabilitation and automation to improve their operational efficiency and capacity. Besides
challenges linked to quantitative growth, public transport must make significant qualitative
improvements in order to become more attractive. Customers expect the same kind of lifestyle
services and connectivity from public transport vehicles and stations as they already have in
their own environment and living space. Such services build on basic requirements, which
include comfort, security and cleanliness. The notion of quality in public transport should also
be created through operational excellence, which includes enhanced frequency, punctuality
and reliability of the service thanks to optimised network design and service performance.
Likewise, smart ticketing and integrated travel information contribute to making public
transport customer/user-friendly, while facilitating accessibility for all citizens. All these tools
offer a huge potential to attract new public transport customers and consequently increase
revenues.
The world is changing fast and urban areas are springing up everywhere, driven by the
growth of cities of all sizes. Combined with rapid economic growth and the emergence of a
large middle class in emerging countries, these trends are shifting the world’s centre of
gravity to the South-East. Globally, some 1,000 cities of more than 500,000 inhabitants are
already facing major mobility problems, due to the near impossibility of providing adequate
infrastructure to keep pace with the ever increasing popularity of the private car. In the
meantime, in Western countries, car use seems to have reached a ceiling. Young people are
apparently now more interested in all the latest mobility solutions than in car ownership. In
urban and rural areas, this is leading to new mobility behaviour. [31] But what in the case of
rural areas?
The statistics shows the different trends in different rural areas, so we would like present
some good examples that can be take for inspiration.
SouthMoravian region.Interesting results provides the study (Stastna et al.,2015) focused on the Integrated
public transport in South Moravian region. he public transport in southern Moravia is ensured
by the Integrated Transport System of the South Moravian Region. This joint venture
company involves 21 state-owned, communal and private companies in unified tariff and time
schedule, operated from one place with mutual continuity of transits. It covers 672 of
673 communes in the region (both urban and rural) and additional 55 communes in
neighboring regions including small overlaps to Slovakia and Austria. It operates on the area
of 8,117 km2 with 1,221,212 inhabitants (2010). There are also examples of villages with
small population and depopulated trend. The system is under permanent checking and
adapting the routes, schedule and other characteristics according to the needs. The system
consists of 331 transits, of it 25 railway lines, 11 tramway lines, 13 trolleybus lines, 79 bus
lines of urban transport in 10 cities and towns (including Brno) and 193 regional bus lines
altogether with about 3500 stops. Railway and tramway lines outbalance in radial directions,
whereas buses mostly on the tangential ones. The system generates more than 20,000 daily
connections. It operates with 1300 vehicles or their combinations. The average number of
public transport connection is according the study 27. The main output from the time
accessibiilty showed that all villages or town are in max.40 minutes from closest urban center.
The output from theis case study shows that the rural areas can have profit on the PT offer
which is based on the integration.
Mittelthüringen
Another interesting example is related to the Public transport union Mittelthüringen. The
Verkehrsverbund Mittelthüringen (VMT) [52] is a consortium of 13 transport companies with
the aim of offering regional local transport as a simple, environmentally friendly and
inexpensive mobility solution. The territory of the VMT includes the cities of Erfurt, Weimar,
Jena and Gera as well as the counties of Gotha, Weimarer Land and the Saale-Holzland-Kreis.
In this case also the passenger from rural areas are benefiting from one public transport
system.
Some studies [40] found out that the rural communities face a range of challenges
associated with accessibility and connectivity which apply in both the physical and virtual
sphere. Constraints in rural transport infrastructure and services are often caused by
limitations in the development and resilience of technological infrastructures. In this context
there is significant disparity between urban and rural communities.
The rural inhabitants are more likely use and need the cars. It is mainly caused by the
accessibility of other forms of transport mode. The statistic (The Association of German
Transport Companies Statistics 2015) shows and confirms the data about modal split in
various types of settlements, see Fig. 29. This statistic provide the interesting information
about the linking of sociodemographics changes and demand for transport [43]You can also read