An Assessment of Urban Park Access Using House-Level Data in Urban China: Through the Lens of Social Equity
←
→
Page content transcription
If your browser does not render page correctly, please read the page content below
International Journal of
           Environmental Research
           and Public Health

Article
An Assessment of Urban Park Access Using
House-Level Data in Urban China: Through
the Lens of Social Equity
Siqi Yu 1, *, Xigang Zhu 1 and Qian He 2
 1    School of Architecture and Urban Planning, Nanjing University, Nanjing 210093, China;
      zhuxigang522@hotmail.com
 2    College of Architecture, Planning, and Public Affairs, University of Texas at Arlington, TX 76019, USA;
      qian.he@mavs.uta.edu
 *    Correspondence: DG1736012@smail.nju.edu.cn

 Received: 24 February 2020; Accepted: 29 March 2020; Published: 31 March 2020

 Abstract: The various benefits of urban green space are gaining increasing attention nowadays.
 Hence, the distribution of green space has become a scrutinized concern for spatial equity among local
 governments and the planning scholars. This study is the first quantitative evaluation of urban park
 accessibility using house-level data in urban China, from the perspective of social equity. We chose
 Nanjing as the empirical case and examined 2709 real estate units and 79 parks within the city.
 Accessibility is measured by the 10-min walking distance from homes to the adjacent urban parks.
 Using the Street Network Analysis model in ArcGIS and the statistical methods in SPSS, the result
 shows that 60.5% of the real estates in Nanjing are located within a 10-min walk to access urban parks.
 However, this accessibility is positively correlated with housing prices, and negatively correlated
 with the age of the buildings, holding all other factors constant. While affluent homeowners capture a
 high-quality green amenity, newly-built low-income communities, where most residents are classified
 as a vulnerable population, have the lowest percentage of accessible green space. This study reveals
 the existing spatial disparities of urban park accessibility among different socio-economic groups in
 Nanjing, China. Additionally, we found that urban redevelopment projects with greening and the
 large-scale affordable housing construction are pricing out the urban poor and rural immigrants from
 the inner city to the urban peripheral areas. This will reduce the accessibility to urban parks and
 other public service facilities among the lower income families, and exacerbate the inequality among
 the rich and the poor in terms of their quality of life. Main findings of this study can inform policy
 decisions regarding equitable park provision in the construction of the green city and the sustainable
 development in urban China and other developing countries.

 Keywords: public park; green space; accessibility; spatial differentiation; social justice;
 environmental equity

1. Introduction
     Green space, including any kind of vegetation covers such as parks, urban forest, gardens,
greenways, and tree canopy covers is not only a key ecological factor but also provides various
benefits in health, economy, society, and environment to alleviate some of the negative effects of
urbanization [1–6]. For instance, green space can improve air quality [1] and reduce flooding risk,
heat island effect, and greenhouse gas emission [2]; it provides habitat that supports biodiversity [3]
and encourages residents to participate in outdoor sports [4], reducing the rates of disease associated
with air pollution [5]; high-quality green space strengthens the identity of an area, making it a more
attractive work and living space, and thereby enhance local economic potential and land use value [6].

Int. J. Environ. Res. Public Health 2020, 17, 2349; doi:10.3390/ijerph17072349       www.mdpi.com/journal/ijerph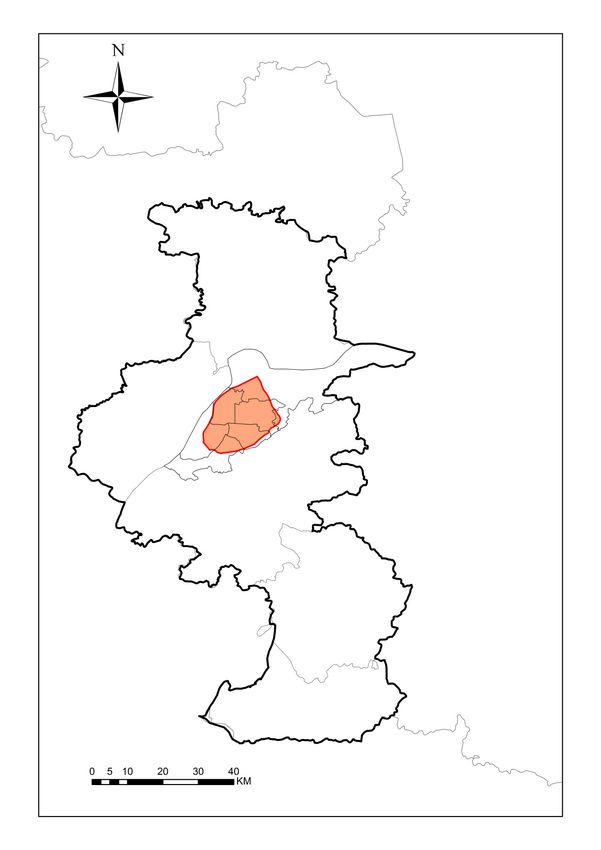
Int. J. Environ. Res. Public Health 2020, 17, 2349                                                   2 of 19

      The increasing attention on green space benefits raises a question for urban sustainable
development: With the support of public funding, are urban parks always equitably distributed within
cities? To address this issue, there are a considerable amount of studies about the distribution of
the urban park among different social groups based on income, age, gender, racial characteristics,
political power, and other axes [7–15]. In this vein, compared with the white and wealthy, minority
races and low-income groups are less likely to receive urban parks or recreational projects in their
communities [7–9]. Nevertheless, some studies contend that public facilities such as urban parks are
evenly distributed in which disadvantaged groups gather [10–13]. One possible explanation for these
different outcomes could be the inconsistency of evaluation metrics. The local variations in the measure
of accessibility, such as park proximity, acres of parks, and park quality could impact the outcome of
the calculation [14] and the priority of these metrics varies across different socio-economic groups [15].
Moreover, traditional aggregated data and the unit of analysis, like zip codes, may be inadequate in
the evaluation of social equity, especially for highly localized services, for example, parks, gardens,
and playgrounds. Therefore, Hewko suggested that finer resolution data like house level should be
integrated to better indicate the spatial distribution of individuals [16].
      In the context of Chinese cities, social inequality has become one of the most scrutinized issues,
even though the accessibility of public facilities and spatial equity are new concepts. In fact, studies
suggest that China has transformed from relative egalitarianism into a society characterized by a
widening income gap since the reform of the socialist market economy [17]. Continued socio-economic
inequality has also led to housing segregation along with rising housing values and deteriorated housing
affordability [18]. After the 1998 housing reform characterized by privatization and marketization,
large-scale and high-frequency replacement of residential population occurs under the filtering
mechanism of housing prices. Residents with the similar consumption capacity and stratum traits
can gather in specific urban spaces to form homogeneous neighborhoods, while further different
socio-economic groups are isolated from each other [19–25]. Consequently, the growing spatial
segregation between the rich and the poor has intuitively raised concerns about whether public
resources, such as urban parks, are equitably available among multiple socio-economic statuses.
To date, there is little empirical evidence on the assessment of the urban park’s accessibility from
a spatial equity perspective, even though environmental justice is closely related to the goals of
China’s sustainable development policy [15]. Among the existing studies, most are limited by the
aggregated data at a relatively coarse scale, such as the “Jiedao” (sub-district) level, and fail to capture
the micro-scale issues among the different social groups [13,26,27]. In addition, their data on the
socio-economic attributes of the residents originate from the National Census in China. However,
the latest National Census was conducted in 2010, which would be hard to reflect current urban
socio-spatial structure [13,27].
      This article is the first quantitative evaluation of urban public parks’ accessibility among the
multiple socio-economic groups in the context of residential segregation in urban China. We chose
Nanjing as the empirical case and evaluated the accessibility to urban parks using the 10-min walk
from home as the threshold. With the aid of the Street Network Analysis model in ArcGIS and the SPSS
statistical analysis method, taking housing attributes as indicators for socio-economic characteristics,
our study then illustrated the spatial distribution of different groups and urban parks from the
perspective of social equity. The result of this study provides important implications for municipal
decision-making in the improvement of the built environment and the allocation of urban services
and amenities. It can also inform policy decisions regarding promoting social justice and sustainable
development in China, especially among the current era of Ecological Civilization.
      This paper is structured as follows: Part two is the existing literature on the assessment of
social equity regarding access to green space. We further analyze the major discussions on social
inequality issues in urban China to develop our theoretical framework. The third section explains the
methodology used in this study and our data sources. Part four presents the analysis and results, and
Int. J. Environ. Res. Public Health 2020, 17, 2349 3 of 19
the last section summarizes the main findings than can inform policy decisions regarding equitable
park provision.
2. Literature Review
With the increasing attention to practical policymaking, the issue of equal access to public services
or amenities has then become of great importance for both planning scholars and local governments,
comprising parks, playgrounds, public transportation, and food outlets. Among these amenities, urban
park is a vital element of sustainable landscape with its environmental, social, and economic benefits
to the urban area [1–6]. Moreover, as one type of public goods supported by public funding, urban
parks are the key target for these researches of equal access. From the perspective of social equity and
environmental justice, researches emphasize whether public services are distributed in an equal pattern
among multiple socio-economic groups. This “equity mapping” reflects the relationship between the
spatial distribution of public services and the residential location of different socio-economic groups,
especially the elderly, minority races, low-income households, and the disadvantaged population who
are in need of better access [8].
A few articles and reports reviewed the association between the distribution of parks and
vulnerable groups [7–15]. Through one of the most comprehensive studies, the National Recreation and
Park Association notes that there is consistent evidence of disproportion in park provision in the USA,
where park services in low-income communities with people of color are significantly lower than in the
white and wealthy groups [9]. However, some research contend that there is an impartial distribution
of public facilities such as urban parks in areas where disadvantaged groups gather. As detailed
in Macintyre’s study, disadvantaged neighborhoods are in fact favored in terms of accessibility to
health-promotion facilities compared to other groups [10]. Using empirical evidence from Chicago,
Mladenka’s study highlights that race is not a determining factor in the distribution of parks, however,
the social class may be [11]. On the contrary, Koehler indicates that the determinants of public facilities
are more exposed to professional decision-making processes [12].
One possible explanation for this difference could be the inconsistency of evaluation metrics.
The measure of park proximity, acres of parks, and park quality could impact the outcome of the
evaluation [14]; additionally, the priority of these metrics varies across different socio-economic
groups [15]. Some studies evaluate whether the distance to the nearest park or playground is related to
demographic variables [7,28,29] and how much difference of the land value there is between within and
outside of a quarter-mile buffer from a park [30,31]. However, park proximity describes the distance
from a residential location to the nearest park, which mainly reveals the possibility of walking to the
park, regardless of public access influenced by the size and quality of the park. Rigolon further studies
49 empirical researches and thought in terms of the access to parks there were inconclusive findings
for proximity, but striking imparity for acreage and quality [14].
Moreover, geographic scale is an integral part of these researches and practices in urban spatial
equity. In a growing body of studies, measuring spatial distribution based on various scales or
geographical partitions can lead to different results [7–15,32–34]. Most spatial equity researches are still
limited to the use of large-scale aggregate data such as zip code that often fail to capture the micro-scale
issues of social groups and communities. Aggregate data may be particularly inadequate when the
evaluation involves highly localized services, such as parks, gardens, and playgrounds. Therefore,
Hewko suggests that future research should integrate finer resolution data to better present the spatial
distribution of individuals in the neighborhood, thereby reducing clustering errors [16].
In many western countries, geo-referenced data on urban infrastructure services, such as road
networks and house locations, is available to accurately estimate the origin-to-destination distance at
house levels nowadays [32]. Besides, some housing surveys include various characteristics, which
are related to the socio-economic status of households. The data of the real estate market containing
the social attributes of the residents can reflect the social space structure and evolving trend of the
city so that the spatial relationship between households and urban services can be estimated [19–25].Int. J. Environ. Res. Public Health 2020, 17, 2349 4 of 19
Hence, it is possible to improve the accuracy and reliability of the spatial equity assessment of urban
amenities and services.
In China’s context, although the accessibility of public facilities and spatial equity are both new
concepts, it is no doubt that social inequality has become one of the most scrutinized fields since
the reform of the socialist market economy. In fact, studies suggest that after economic reform in
1979, China’s market has transformed from relative egalitarianism into a society characterized by
a widening income gap [17]. The current researches on inequality mainly focus on the income gap
between different social classes [35], housing inequality [18], the uneven supply of facilities in different
regions [36], and the unequal level of individual social achievements [37].
There are abundant researches indicating that there is residential socio-spatial differentiation
and that the choice of urban housing could reflect the socio-demographic status for the residents
in urban China [19–25]. Housing prices not only reflect the features of urban spatial structure and
residential spatial segregation [19] but can also draw the mapping of disparities in economic status
and class attributes, among multiple purchasing groups [20]. The differences among the growth of
urban housing prices also affect the social wealth distribution and the choice of housing locations for
potential buyers and further promote the re-differentiation of the urban socio-economic groups [21].
In other words, the consumption of housing could represent class-structuration in urban China, and
the differentiation of housing prices, or the spatial heterogeneity of urban houses, actually reflects
socio-spatial inequality [22,23]. As a result, the data of a secondary market of housing prices are often
used by some scholars to demonstrate the structure of urban residential space [24,25]. For example,
Song (2010) used the housing price as an indicator to describe the gentrification process and residential
differentiation in Nanjing [25].
A crucial component of social equality research is the needs of marginalized groups. Within the
vulnerable groups in urban China, existing literature mainly identified two types of the new urban
poor: The laid-off workers and rural migrants [13,38,39]. The laid-off workers lack enough skills and
education, thus it is very hard for them to find new jobs or to leave the poor areas [38]. Meanwhile,
the rural migrants are more likely to engage in low-paid and dangerous jobs compared to the local
residents [39]. Moreover, continued socio-economic inequality led to housing segregation, due to the
low affordability of the new urban poor [18]. The consequence of the residential segregation is that the
laid-off workers and rural migrants are more likely to live in poor areas, which further increases the
possibility of poverty [38].
To date, there is little empirical evidence on the assessment of the urban park’s accessibility
from a spatial equity perspective, even though environmental justice is closely related to the goals of
China’s sustainable development policy [15]. Using data from 285 prefecture cities across the nation in
China, Chen reveals a negative correlation between economic development and urban public green
space, which indicates that access to urban green space in China’s megacities is worsening [26]. Some
researchers note spatial mismatch exists between the distribution of urban public parks and that of
socially vulnerable groups in Changting [27]. Nevertheless, Xiao chooses Shanghai as the case study
city and finds that vulnerable groups are favored over more affluent citizens regarding access to urban
parks [13]. These studies, however, ignore the population distribution pattern or assume that different
groups are evenly distributed in statistical units, which to a certain extent affects the evaluation results.
This shortage is directly related to the application of aggregated data. To address this modifiable
areal unit problem, Yin introduced an accessibility evaluation on the house scale in Chinese cities for
the first time [40]. However, due to the lack of information on housing attributes, there is no direct
correspondence analysis in his study.
Currently, the question of whether different social groups can use urban parks fairly is still waiting
to be answered. In a densely populated environment like urban China, it is rarely known whether
marginalized groups are having a lower quality of public services, given that China has always lacked
green space and the quality of services provided to the entire population is rather low [13]. Therefore,Int. J. Environ. Res. Public Health 2020, 17, 2349 5 of 19
Int. J. Environ. Res. Public Health 2020, 17, x FOR PEER REVIEW 5 of 19
it is extremely important to incorporate an equity-oriented approach to assess the urban parks in
3. Methodology
Chinese urban settings.
3.
3.1.Methodology
Study Area
This paper
3.1. Study Area took Nanjing (31°14′—32°37′N, 118°22′—119°14′E) as the study area. It is one of the
most populous and developed cities in eastern China. In 2018, the population of Nanjing was
This paper
8,430,000, took
and the Nanjing
urban (31◦areas
built-up 140 –32◦ 370 N, 118◦ 220 –119◦ 140 E) as the study area. It is one of the
were 817 km2 [41]. This megacity is surrounded by mountains
most
and rivers, such as Xuanwu Lake, Qinhuai China.
populous and developed cities in eastern In 2018,
River, and theMountain,
Zijin populationandof Nanjing was 8,430,000,
has abundant green
and the urban built-up areas were 817 km 2 [41]. This megacity is surrounded by mountains and rivers,
resources. With the rapid expansion of urban land, Nanjing municipal government has supported
such as Xuanwu
increasing greenLake,
spaceQinhuai
as part River,
of its and
urbanZijin Mountain,
green and has planning
infrastructure abundant efforts
green resources.
launched With the
in 2013,
rapid expansion of urban land, Nanjing municipal government has supported
making the green coverage rate reaching 45% in 2018 [41]. Specifically, the green space of theincreasing green space
as part of its urban
metropolitan green infrastructure
area increased from 8250 planning
hectares in efforts
2010launched
to 35,756 in 2013, making
hectares in 2018the green
while coverage
urban park
rate reaching 45% in 2018 [41]. Specifically, the green space of the metropolitan
area increased from 1725 hectares to 7207 hectares according to the Nanjing Statistical Yearbook area increased from
8250 hectares in 2010 to 35,756 hectares in 2018 while urban park area increased from 1725 hectares to
(2010–2018).
7207 Our
hectares
studyaccording
focuses toonthe
theNanjing Statistical
main urban area Yearbook
with a high (2010–2018).
population concentration and a long
history of development, which is enclosed by the external ringpopulation
Our study focuses on the main urban area with a high road (Figureconcentration
1). This areaand a long
comprises
history of development,
six administrative which
districts: is enclosed
Gulou, Xuanwu,byQinhuai,
the external
Jianye,ring road (Figure
Yuhuatai, 1). This
and Qixia. area comprises
Among them, the
six
area enclosed by the city wall of the Ming Dynasty is called the inner city. Before the 21stthem,
administrative districts: Gulou, Xuanwu, Qinhuai, Jianye, Yuhuatai, and Qixia. Among the
century,
area enclosed by the city wall of the Ming Dynasty is called the inner city. Before the
this inner area of 41 km2 was once inhabited by about 1.5 million people and was the main container 21st century, this
inner
of Nanjing's 41 km2 wasculture,
area ofpopulation, once inhabited
business,byeducation,
about 1.5 and
million people
medical and was
services [25].the main container of
Nanjing’s population, culture, business, education, and medical services [25].
China
Jiangsu
Anhui
Legend
Nanjing City
Nanjing Municipality
Study Area
Figure 1. Location of Nanjing, China.
Figure 1. Location of Nanjing, China.
3.2. Data Source
3.2. Data Source
In our study, two categories of spatial statistics were required to conduct the analysis upon
accessibility to urban
In our study, parks
two on the house
categories level, statistics
of spatial namely park and
were housingto
required data. For the
conduct park
the data, aupon
analysis total
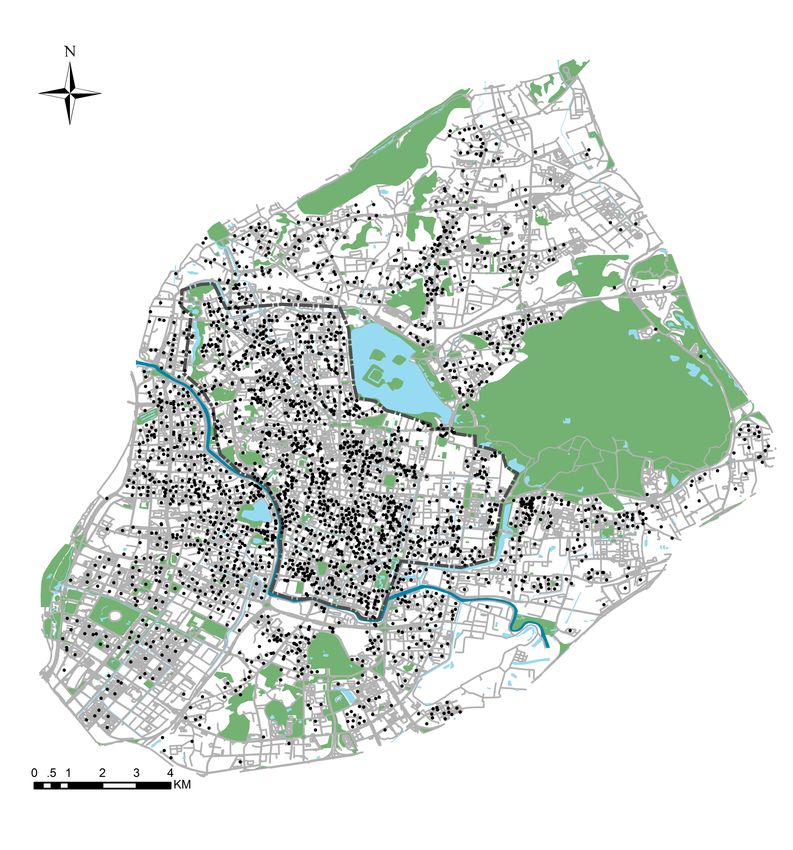
accessibility to urban parks on the house level, namely park and housing data. For the park data, a
total of 79 parks in the central area of Nanjing were included Figure 2. We used the Autonavi electronic
navigation map (AMAP) to extract the parks, which contained the latest data and fine granularity [42].
Int. J. Environ. Res. Public Health 2020, 17, x; doi: FOR PEER REVIEW www.mdpi.com/journal/ijerph
5Int. J. Environ. Res. Public Health 2020, 17, 2349 6 of 19
of 79 parks in the central area of Nanjing were included Figure 2. We used the Autonavi electronic
navigation map (AMAP) to extract the parks, which contained the latest data and fine granularity [42].
AMAP is one of China’s most popular navigation maps and its data come from commercial remote
sensing satellites. Then, we merged the same park for those where the extents were interrupted by a
road and assigned the attributes of parks by manual identification. Considering the function of parks is
based on service quality with a certain threshold, we then check the consistency between the parks that
we extracted and the ones listed on the current parks by the official. Specifically, these selected parks in
our study all are included in the “Plan of Urban Green Space System, Nanjing City (2017–2035)” which
is officially published by Nanjing Municipality in 2018 [41]. Consequently, unnamed green spaces
along the street with isolation functions were not considered in this study. Furthermore, private green
areas such as in the gated communities and golf clubs were also not included. Finally, we used spatial
modeling methods including GIS and remote sensing technology and selected 79 city parks which
covered a total area of 250 km2 for this research.
Housing data were collected in December 2018 from the SOFANG website [43]. Since large-scale
aggregate data failed to reflect the socio-economic status of residents under the rapid urbanization
in China, the evidence of a housing market would be used to describe the socio-spatial structure
to improve the accuracy and reliability of the spatial equity assessment [19–25]. These data of real
estate properties were pre-processed to remove any abnormal values and ultimately obtained 2609
records representative of the housing in Nanjing (Figure 2). Their attributes contain the name of real
estate, housing price in the second-hand transaction market, the administrative division, age of the
building, Home Owner Association fee (HOA fee), community size (number of dwelling buildings in
the community), and coordinates of latitude and longitude. Table 1 summarizes all the variables used
in this study and general descriptive statistics, with a total of 2609 samples.
At last, the present land-use map and street-level road network map of Nanjing (2018) were
corrected by combining the data from the fieldwork through the manual inspection. Through digital
processing and spatial coordinate system calibration, data features including the parks, houses, rivers,
and roads were then converted into GIS vector data to establish the integrated GIS database for further
accessibility examination.
Table 1. Descriptive statistics.
Minimum Maximum Mean Std. Deviation
Housing Price (USD/m2 ) 963 19,973 5099 12,981.94
Age of Building 73 0 21 10.44
HOA Fee (USD/m2 ) 0 1.29 0.13 0.90
Community Size 1 166 10 11.14
N = 2609.Int. J. Environ. Res. Public Health 2020, 17, x FOR PEER REVIEW 7 of 19
Int. J. Environ. Res. Public Health 2020, 17, 2349 7 of 19
Legend
Housing Location
Urban Parks
City Wall
Street Network
Figure 2. The distribution of parks and housing units in the study area.
Figure
3.3. Network Analysis 2. The distribution of parks and housing units in the study area.
Method
3.3. Network
3.3.1. Analysis
Measure MethodMethod
of Accessibility
3.3.1. In this descriptive
Measure Method ofresearch, we calculated the accessibility of urban parks using the network
Accessibility
analysis method. Accessibility refers to the quantitative expression of the desire and ability of residents
In this descriptive
to overcome obstacles suchresearch, we calculated
as distance, travel time,the and
accessibility
expenses of to urban
reach aparks
service using theor
facility network
activity
analysis method. Accessibility refers to the quantitative expression of the
venue [7]. Since the 1950s, accessibility analysis has been widely used to study the rationality of the desire and ability of
residents to overcome obstacles such as distance, travel time, and expenses to reach
spatial layout of public facilities such as urban green space [7,16,31,33,44]. The accessibility has been a service facility
or activity by
evaluated venue
many [7]. Since through
scholars the 1950s, accessibility
a variety analysis
of methods, has been
mainly widely
including used
buffer to study
zone, minimum the
rationality of the spatial layout of public facilities such as urban green space
distance, gravity index, and travel cost [7,44]. The calculation of the minimum distance method is [7,16,31,33,44]. The
accessibility has been
relatively simple, andevaluated
it has beenby manyused
widely scholars through studies.
in empirical a varietyHowever,
of methods, mainly including
its limitations are also
buffer
obviouszone, minimum
because distance,
the use gravity distance
of Euclidean index, and travelfrom
differs cost the
[7,44]. Theroutes
travel calculation of the minimum
of residents in reality.
distance methodofisthe
The calculation relatively simple,method
gravity model and it has beencomplicated,
is more widely usedconsidering
in empirical thestudies.
impact However, its
of the metrics
limitations are also obvious because the use of Euclidean distance differs from
varies on urban park access such as park proximity, acres of parks, and park quality, but the Euclidean the travel routes of
residents
distance isin still
reality.
usedThe calculation
to take of theThe
a measure. gravity
travelmodel methodisiscomplicated
cost method more complicated, considering
to calculate. In this
the impact of the metrics varies on urban park access such as park proximity, acres
method, the network distance is used to minimize the total cost of travel between origin and destination, of parks, and park
quality,
which isbut
close the Euclidean
to the distance
actual travel is still
distance used
of the to take With
residents. a measure.
the rapid The travel cost ofmethod
development computer is
complicated to calculate. In this method, the network distance is used to minimize
hardware and the improvement of GIS functions, the travel distance method is showing great potential the total cost of
travel
in the between
accessibilityorigin and destination,
evaluation whichHence,
of urban parks. is closewetomeasured
the actualthe travel distance
distance of the
cost that residents.
people spent
With the rapid
to reach nearbydevelopment
parks by walkingof computer
with thehardware
aid of the and the improvement
network of GIS functions,
analysis in ArcGIS platform. the travel
distance method is showing great potential in the accessibility evaluation of urban parks. Hence, we
measured the distance cost that people spent to reach nearby parks by walking with the aid of the
network analysis in ArcGIS platform.
Int. J. Environ. Res. Public Health 2020, 17, x; doi: FOR PEER REVIEW www.mdpi.com/journal/ijerph
7Int. J. Environ. Res. Public Health 2020, 17, 2349 8 of 19
3.3.2. Standards of Accessibility Level
Considering residents are unwilling to access public urban parks that require a long travel
journey, the threshold distance on accessing urban parks is of great concern [28]. Therefore, the
level of urban park access can be divided based on the time cost to obtain park green space services.
The U.S. Department of Transportation’s 2012 National Survey of Bicyclist and Pedestrian Attitudes
and Behavior shows that 61% of residents surveyed are willing to walk for an average of 1.3 miles for
exercise, leisure, entertainment, and walking their dogs, which is equivalent to the 10-min round-trip
walk to a park located a half-mile from home [45]. The 10-min walk from home is also used as the
evaluation standard for urban park access in the U.S. Park Score Index [46]. Since China does not have
a survey of this type at the national level, drawing on existing research and practices in the United
States, a 10-min walk is selected as an accessibility indicator, and the service of urban parks is divided
into five levels as shown in Table 2.
Table 2. Reference standards of time-cost accessibility levels.
Accessibility Level Time Cost Distance Valuation
Very Good 0.75 mi 1
3.3.3. Technology Route
As for the technology route, the process of accessibility evaluation is specifically as follows: Firstly,
create a network dataset accurate to a street feature in ArcGIS; secondly, calculate the intersection of
urban park and streets, and determine them as the park entrances. The official park entrances may
not cover all the paths through which people get into the park due to the fact that many parks are
not gated in China. Therefore, we adopt the intersection of the street and urban parks to define the
entrance of the park rather than use the official entrance in order to assure the validity; thirdly, use the
ArcGIS network analysis to calculate the time from the house to the nearest park. We use the gate of
the community as the entrance for the gated communities. Meanwhile, for the open community, we
chose the intersection of the street and the community boundary as the entrance; at last, classify the
accessibility levels according to the time cost of the nearest park green space service obtained by the
residential community.
4. Result and Discussion
4.1. Results of Park Access Assessment
Table 3 shows the statistics results of the percentage within a 10-min walk to park in the 2609 real
estates in Nanjing. In general, 60.44% of Nanjing’s real estates live within a 10-min walk of a park.
A large proportion of residents’ units (42.32%) can enter a park within 5–10 min’ walk of home. Only
11% of real estates take more than 15 min to a park. In the inner city, the percent of real estates within a
10-min walk to park is 72.37%, while the suburb accounts for 49.86%. In particular, no residents of the
inner city could access a park for more than 15 min.Int. J. Environ. Res. Public Health 2020, 17, 2349 9 of 19
Table 3. Statistics results of accessibility in Nanjing.
District Total Inner-City Suburb
Accessibility level Sum 2609 1227 1382
Number 473 277 196
Very good access (15 min)
Percentage 10.66% 0.00% 20.12%
Number 1577 888 689
Within a 10-min walk
Percentage 60.44% 72.37% 49.86%
To compare these accessibility levels in Nanjing, we introduce the Park Score index in the United
States. Developed by the Trust for Public Land, Park Score is a comprehensive index that describes the
quality of urban park systems and the component of park access in this index is frequently used as an
indicator for spatial equity in many academic studies [47–50]. According to the Park Score index, in
the 100 largest cities in America, the range of accessibility within the 10-min walk of home is from 28%
to 100%, with a median of 65%. In contrast, the level of accessibility in Nanjing is very nearly the same
as the national media in the U.S. Among them, the accessibility of the inner city is even higher than the
average level, but in the meantime, the result in the suburbs is slightly lower. Consequently, most
residents in Nanjing can conveniently enjoy the benefits of green space and the inner-city residents
have higher access to urban parks.
Figure 3 is the spatial distribution map of accessibility evaluation of 79 public parks. From the
perspective of urban spatial structure, the areas with high accessibility are mainly concentrated in “one
belt, four zones” in Nanjing: The one belt refers to the Qinhuai River, and the four zones include Zijin
Mountain, Xuanwu Lake, Yuhuatai Scenic Area, and Hexi New Town. As a form of public investment,
these areas with high urban park access are significantly exposed to local municipal endeavors. As a
result of urban river restoration projects led by the municipal government over many years, a series
of riverside parks appear along the Qinhuai River, the mother river of Nanjing. This urban green
belt not only benefits nearby residents tremendously, but Nanjing Municipal Government also won
the “Special Habitat Honor” which is the first time an official agency in China was awarded by the
United Nations. Xuanwu Lake, Zijin Mountain, and Yuhuatai Scenic Area are well-known historical
parks with a long history under the management of the Nanjing Municipal Bureau of Parks as a
crucial part of the urban green infrastructure system. Promoted and maintained by mega-events,
including the 10th National Games of 2005 and the 2010 Nanjing Youth Olympic Games, Hexi New
Town is a newly-built urban area after 2000 and intends to be a modern landmark in Nanjing [51].
With the state-sponsored starting point, after the bureaucratic decision-making process, the landscape
of this district is elaborately designed with various green spaces and makes residents high access to
urban parks.Int. J. Environ. Res. Public Health 2020, 17, 2349 10 of 19
Int. J. Environ. Res. Public Health 2020, 17, x FOR PEER REVIEW 10 of 19
Xuanwu Lake Zijin Mountain
Hexi New Town.
Legend
Yuhuatai Scenic Area
Within a 5-min walk
Within a 10-min walk
Urban parks
0 2 km
Housing location
Theevaluation
Figure3.3.The
Figure evaluationofofAccessibility
Accessibilityamong
among7979public
publicparks
parksininNanjing.
Nanjing.
4.2.Correlation
4.2. Correlationbetween
betweenHousing
HousingAttributes
AttributesandandAccessibility
Accessibility
InInthis
thispart,
part,we
weexamine
examinethe thecorrelation
correlationbetween
betweenhousing
housingattributes
attributesand
andaccessibility
accessibilityininNanjing.
Nanjing.
First, the diagnostic test for collinearity is performed to mitigate potential biases in
First, the diagnostic test for collinearity is performed to mitigate potential biases in advance. The fouradvance. The four
attributesofofhousing
attributes housingdatadatacontain
containhousing
housingprice,
price,age
ageofofthe
thebuilding,
building,HOA
HOAfee, fee,and
andcommunity
communitysize. size.
The variance inflation factors (VIF) for all variables of housing attributes range from
The variance inflation factors (VIF) for all variables of housing attributes range from 3.21 to 5.85, less 3.21 to 5.85, less
than 8 (a suggested cut-off number for multicollinearity), indicating that no serious
than 8 (a suggested cut-off number for multicollinearity), indicating that no serious multicollinearity multicollinearity
couldbe
could bedetected
detectedamongst
amongstall all independent
independent variables
variables [52].
[52]. Second,
Second,the theaccessibility
accessibilitylevel
leveland
andthe the
housing characteristics are normalized by using a range standardization method.
housing characteristics are normalized by using a range standardization method. Based on the SPSS Based on the SPSS
platform,we
platform, wethen
thenapplied
appliedthe thecorrelation
correlationanalysis
analysiswith
withSpearman's
Spearman’srank rankcorrelation
correlationcoefficient
coefficientandand
Kendall’s rank correlation coefficient to analyze the relationships between
Kendall's rank correlation coefficient to analyze the relationships between housing attributes and housing attributes and
accessibilityin
accessibility in the
the 2609
2609 real
realestates
estatesofofNanjing.
Nanjing. And
And thethe
correlation testtest
correlation usesuses
a two-sided test. The
a two-sided test.result
The
is shown in Table 4.
result is shown in Table 4.
Table 4. Correlation between accessibility and housing attributes in Nanjing.
Housing Attributes Analysis Method N Correlation Coefficient
Spearman rank correlation 2609 0.127**
Housing Price
Kendall rank correlation 2609 0.097**
Spearman rank correlation 2609 −0.160**
Age of the building
Kendall rank correlation 2609 −0.123**
Spearman rank correlation 2292 −0.013
HOA Fee
Kendall rank correlation 2292 −0.010
Spearman rank correlation 2609 −0.089
Community Size
Kendall rank correlation 2609 −0.069
** Correlation is significant at the 0.01 level
Int. J. Environ. Res. Public Health 2020, 17, x; doi: FOR PEER REVIEW www.mdpi.com/journal/ijerph
10Int. J. Environ. Res. Public Health 2020, 17, 2349 11 of 19
Table 4. Correlation between accessibility and housing attributes in Nanjing.
Housing Attributes Analysis Method N Correlation Coefficient
Spearman rank correlation 2609 0.127 **
Housing Price
Kendall rank correlation 2609 0.097 **
Spearman rank correlation 2609 −0.160 **
Age of the building
Kendall rank correlation 2609 −0.123 **
Spearman rank correlation 2292 −0.013
HOA Fee
Kendall rank correlation 2292 −0.010
Spearman rank correlation 2609 −0.089
Community Size
Kendall rank correlation 2609 −0.069
** Correlation is significant at the 0.01 level.
Through the sequencing variable correlation analysis, firstly, there is a positive correlation between
the accessibility level and the housing price, significant at the 0.01 level. There is a tendency to
improve in accessibility, as residential housing prices rise. That is, the residents living in luxury real
estates enjoy better green space services. Secondly, the age of the building is significantly negatively
correlated to the level of accessibility. The older the residential community, the higher the accessibility
of urban parks, revealing that urban residents in the old areas have better access to urban parks than
the newly-built districts. Finally, regarding the HOA fee and community size, there is no significant
correlation between these two variables.
4.3. Unequal Residential Distributions and Park Access
For a country with the implementation of housing privatization policy, evidence from the housing
markets can help describe the socio-spatial prospects instead, due to circumstances lacking statistics
on the urban population [25,53]. After the 1998 housing reform characterized by privatization and
marketization, large-scale and high-frequency replacement of residential population occurs under the
filtering mechanism of housing prices in urban China. The proportion of private housing in Chinese
cities and towns was up to 96% nowadays. This article hereby used housing data from the secondary
market as indicators for the distribution of social groups. For the purpose to analyze the spatial pattern
between social groups and park access, we applied geostatistical interpolation techniques into housing
price and age of the building respectively to quantify the spatial autocorrelation, and then overlay the
park access distribution onto the mapped spatial distributions of two variables.
The overlay analysis of the accessibility and housing price distribution in Nanjing (Figure 4)
illustrates that there exists a spatial disparity of green space service in social groups under different
living conditions. The areas with higher accessibility are coincident with the high price points, and the
housing prices are comparatively lower in the areas that are not covered by the 10-min walk from home
to urban parks. For example, in the inner city, high housing prices appeared near Xuanwu Lake and
Zijin Mountain. Adjacent to the natural resources, these communities enjoy a high-quality landscape
and were referred to as one of the wealthy communities where privileged residents gather in the early
time. Another point of high housing price in the suburb is the Hexi New Town in the southwest
of Nanjing, which is a new-built central business district in recent years. Driven by mega-events
mentioned before, large-scale infrastructure investment is injected to transform a marginal space
into a new town rapidly. With the characteristics of the high starting point of the new construction,
convenient facilities and high living quality, this district has become the hot pot of the housing selection
among the new-rich stratum in Nanjing.
In fact, after the reform of the housing system in 1998, the traditional residential unit system mode
under a planned economy was dissolved, and the newly-built gated housing became the mainstream in
the living space for citizens in urban China. Under the influence of marketization, residents can freelyInt. J. Environ. Res. Public Health 2020, 17, 2349 12 of 19
choose location and type of housing in the housing market and the value of real estates is activated.
Studies have shown that the positive externalities of green spaces will drive the value of real estates in
surrounding areas [28,54–56], which is 8% to 20% in the United States [54] and 8.6% in Guangzhou [55].
In this situation, most residents have the same preference for green space but only the privileged family
has greater spending power. Therefore, the conflict between urban residents’ demand for access to
parks and their ability to afford it generates social segregation on the access to urban parks among
different socio-economic statuses: As the rich keep congregating in the community with better green
space service where the less-advantaged people could not afford.
Int. J. Environ. Res. Public Health 2020, 17, x FOR PEER REVIEW 12 of 19
Legend
Housing Price:
High Low
Within a 5-min walk
0 2 km
Within a 10-min walk
Figure 4. The
The distribution
distribution of
of park
park Accessibility
Accessibility and
and the
the housing prices in Nanjing.
Figure 5 shows the accessibility and housing built–year distribution in Nanjing. The The distribution
distribution
pattern indicates that the housing age of of Nanjing
Nanjing isis decreasing
decreasing from
from the
the center
center toto the
theperiphery.
periphery. Also,
Also,
most
most of the old communities
communities were concentrated in the
concentrated in the inner inner city of Nanjing with
with high urban park
urban park
access while
whilemanymanyunderserved
underserved neighborhoods
neighborhoods are are
in the
in suburbs, as shown
the suburbs, in the figure.
as shown in the One possible
figure. One
explanation for this outcome could be the continuity and accumulation
possible explanation for this outcome could be the continuity and accumulation of urbanof urban development based on
historical factors.
development based Nanjing, an ancient
on historical capital
factors. with a long
Nanjing, history of
an ancient city construction,
capital with a long has manyofgreen
history city
resources thathas
construction, belong
many to green
the Scenic and Historic
resources Interest
that belong Area,
to the suchand
Scenic as Xuanwu
Historic Lake andArea,
Interest MingsuchPalace
as
Park. With the local municipal endeavors over the decades, these historical
Xuanwu Lake and Ming Palace Park. With the local municipal endeavors over the decades, these city parks have undergone
multiple rounds
historical of environmental
city parks have undergone improvements.
multiple roundsTheseofgreen areas provide
environmental qualified parks
improvements. and green
These green
space services to surrounding residents and play an important role in the
areas provide qualified parks and green space services to surrounding residents and play an contemporary urban green
space system.
important roleFurthermore, in the aspect
in the contemporary of residential
urban green space locations, the old
system. town within
Furthermore, in the
theancient
aspectcity
of
wall was a major
residential concentration
locations, areawithin
the old town for thethe
current
ancientpopulation
city wall and
was urban
a major development
concentration before
areathe
for21st
the
century.population
current At that time before
and housing
urban reform in
development 1998, the
before institutions offered
21st century. Atfree
thathousing as welfare
time before housingfor
their employees
reform in 1998, and the socialoffered
institutions stratification in the cities
free housing as was not reflected
welfare for theirinemployees
the living space.
and theThe social
social
stratification in the cities was not reflected in the living space. The social system of equalization
results in the fairness of public resource allocation. Consequently, the majority of the dwellings in the
inner city generally have evenly high accessibility to green parks.
Nowadays, this planning legacy of China’s socialist era may still indirectly benefit marginalized
residents. Some studies reveal that vulnerable groups, such as rural migrants and disadvantagedInt. J. Environ. Res. Public Health 2020, 17, 2349 13 of 19
system of equalization results in the fairness of public resource allocation. Consequently, the majority
of the dwellings in the inner city generally have evenly high accessibility to green parks.
Nowadays, this planning legacy of China’s socialist era may still indirectly benefit marginalized
residents. Some studies reveal that vulnerable groups, such as rural migrants and disadvantaged
families, are clustered in the district with lower housing costs, primarily being consisted by decrepit
settlements and dilapidated communities in the downtown [13,38,39]. Although these groups are not
explicitly stated as the primary target groups, the location advantage of the old housing projects allows
them to have access to urban parks in the inner city.
On the contrary, in the 21st century, the urban area in Nanjing expanded rapidly and a large
Int. J. Environ. Res. Public Health 2020, 17, x FOR PEER REVIEW 13 of 19
number of commodity housing was quickly built. The development in the suburbs with car-oriented
road networks and homogeneous land use is characterized by high strength, fast speed, and large scale.
road networks and homogeneous land use is characterized by high strength, fast speed, and large
Pursuing the rapid pace of development and high productivity, the provision of urban public service
scale. Pursuing the rapid pace of development and high productivity, the provision of urban public
facilities is relatively lagging behind, especially for high-quality urban parks. As shown in the Figure 5,
service facilities is relatively lagging behind, especially for high-quality urban parks. As shown in the
for example, the number of urban parks is relatively scarce and the coverage of green space services
Figure 5, for example, the number of urban parks is relatively scarce and the coverage of green space
is insufficient in the northern district of the city, including Baota Street and Xiaoshi Street in Gulou
services is insufficient in the northern district of the city, including Baota Street and Xiaoshi Street in
District, Maixuqiao Street and Yanziji Street in Qixia District, and some areas in the northwest of Hexi
Gulou District, Maixuqiao Street and Yanziji Street in Qixia District, and some areas in the northwest of
district. As a result, urban park service in inner-city old neighborhoods is on the whole much better
Hexi district. As a result, urban park service in inner-city old neighborhoods is on the whole much better
than the newly-built districts in the suburb, except for some wealthy communities mentioned before.
than the newly-built districts in the suburb, except for some wealthy communities mentioned before.
Legend
Age of building:
Old New
Within a 5-min walk
0 2 km
Within a 10-min walk
The distribution
Figure 5. The
Figure distribution of
of park
park accessibility
accessibility and
and the
the year-built
year-built of housings in Nanjing.
4.4. Accessibility
4.4. Accessibility to
to Parks
Parks among
among the
the Vulnerable
Vulnerable Groups
Groups
In order
In order to
to further
further explore
explore the
the correlation
correlation between housing prices,
between housing prices, age
age of
of the
the building, and
building, and
accessibility, these
accessibility, these communities
communities are
are divided
divided into
into five
five partitions
partitions of equal size
of equal size according
according toto the
the housing
housing
price using the quinquepartite method of income in China [57]. Then, housing prices in the
price using the quinquepartite method of income in China [57]. Then, housing prices in the top 20%, top 20%,
20% to
20% to 80%,
80%, and
and the
the bottom
bottom 20%
20% could
could respectively
respectively represent
represent high
high income,
income, middle
middle income,
income, and
and low
low
income, since housing attainment through the market depends to a large extent on disposable
personal income [58]. The age of the building is divided into three sections, comprising before the
1998 housing reform, 1998 to 2008, and 2009 to the present. We summary the ratio of accessibility in
a 10-minute walk.
Results from the chi-square tests in SPSS reveal statistically significant trends among the incomeInt. J. Environ. Res. Public Health 2020, 17, 2349 14 of 19
income, since housing attainment through the market depends to a large extent on disposable personal
income [58]. The age of the building is divided into three sections, comprising before the 1998 housing
reform, 1998 to 2008, and 2009 to the present. We summary the ratio of accessibility in a 10-min walk.
Results from the chi-square tests in SPSS reveal statistically significant trends among the income
groups (Table 5), indicating that affluent and middle-class residents tend to have a higher percentage
of green spaces within the 10-min walking distance than low-income neighborhoods. Furthermore, the
newly-built low-income communities have the lowest percentage of accessible green space, which is
only half of the median of the overall accessibility to urban parks in Nanjing.
Table 5. Ratio of accessibility in a 10-min walk of different housing attributes in Nanjing.
Year of Built Low Income Middle Income High Income Average Pearson Chi-Square
Before 1998 51.16% 66.56% 80.42% 65.67% 51.573 **
1999–2008 34.00% 60.46% 67.27% 56.89% 41.802 **
After 2009 33.80% 48.67% 49.57% 46.36% 5.674 *
Average 43.87% 63.00% 69.35% 60.44% 81.575 **
* Indicates p-value < 0.05. ** Indicates p-value < 0.001.
There are mainly two types of residents living in the newly-built low-income communities,
including the laid-off workers moving from the inner city and new migrants from the rural
areas [13,38,39]. In the inner city, urban redevelopment with greening has become a filtering mechanism
for urban living space transformation, causing the disadvantaged urban residents to move from the
inner city and to the newly-built low-income communities in the suburb. For the sake of the rental
gap, the government, investors and property developers choose the inner space with rich green space
resources to launch the process of urban renewal. This renewal process takes urban green space as the
engine to meet the preference of the middle class, leading to the increase of the property value and
rents and the exclusion of the disadvantaged residents, being priced out by the sky-rocketing housing
cost. Several authors define this process in which the improvement in urban parks has fueled the
displacement of local residents as green gentrification [59–61].
For instance, in 2002, the urban river restoration projects of the Qinhuai River were launched
in Nanjing to address the water pollution problem. By the end of 2009, the project had achieved a
total investment of more than $60 million, involving several sub-projects such as water conservancy,
environmental protection, housing settlements, and landscape construction. Due to these projects,
the Qinhuai River was transformed into a new green belt with a series of riverside parks. However,
the waterfront space has become the hot spot of private investors after the river pollution problem
was solved, with its beautiful natural scenery and profound cultural atmosphere. High-end gated
communities gradually appear around the Qinhuai River. Meanwhile, the traditional houses in the
waterfront area, often lived by laid-off workers, were demolished in the process of river renewal.
Unfortunately, the government compensation for these local low-income residents was far from enough
to repurchase the newly-built apartments, which led to the relocation and displacement of these
vulnerable residents. According to official statistics, more than 6000 residents in the area around the
Qinhuai River were excluded and resettled to low-income communities in the periphery of the city
during this redevelopment process. These high-quality urban parks and green space services are
captured by residents of newly-built privileged communities, while indigenous disadvantaged residents
are selectively filtered out in the process of green gentrification. As a result, to increase green space
access with displacing or excluding underserved communities gives rise to environmental inequality.
Moreover, it is difficult for rural immigrants to purchase a housing unit through the real estate
market after the reform of the housing commercialization reform facing rising housing costs and
deteriorated housing affordability. Therefore, affordable housing has become one of the most salient
urban social programs in the national policy agenda since 2007. The city governments supportInt. J. Environ. Res. Public Health 2020, 17, 2349 15 of 19
large-scale affordable housing construction in urban peripheral areas aimed to solve the housing
problem of rural immigrants. As the common characteristics of these affordable housing projects, they
are usually located in the outer area of the city, have relatively lower housing prices, and are usually
constructed on a large scale.
However, while the rapid development of affordable housing enabled the low-income groups
to find their own living, major urban public service facilities, such as parks and green spaces, have
not been distributed simultaneously. Consequently, it becomes inconvenient for vulnerable groups
to receive the physical, mental, and social benefits afforded by park space, which exacerbates the
trend of the unfair spatial distribution of urban green space. Our study illustrates that most of the
affordable housing projects in Nanjing are located outside of the 10-min walking distance to the green
space, revealing the lack of access to enjoy urban parks. For instance, located in the northeast corner of
the central Nanjing city, Dingjiazhuang has a total of 3.1 million square meters of affordable housing.
This affordable housing project fails to take the accessibility of urban parks, despite the fact that they
do fulfill the housing demands of the newly-immigrated residents.
5. Discussion
With the growing demand of urban residents for a better living environment, the benefits of
green space as a type of public goods has received more and more attention [1–6]. Considerable
studies indicate that similar to income inequality, housing inequality in urban China is increasing, and
there is residential socio-spatial differentiation and that the choice of urban housing could reflect the
socio-demographic status for the residents [17–25]. Furthermore, a question for urban sustainability
planning is emerging about whether the unequal residential distribution of social groups would affect
their access to public facilities, such as green space. In response to this issue, taking Nanjing as an
example, we selected a 10-min walking distance as the residents’ threshold preference and calculated
the accessibility of the green space at the house scale using ArcGIS street network analysis. Our research
found this accessibility of urban parks is positively correlated with housing prices, and negatively
correlated with the age of the buildings, holding all other factors constant. While affluent homeowners
capture a high-quality green amenity, newly-built low-income communities, where most residents are
vulnerable population, have the lowest percentage of accessible green space.
As a result of China’s transition to a market economy, the implementation of housing
commodification and housing subsidy monetization policies has led to an active and dynamic
real estate market in China. With the improvement of living standards, residents tend to pursue a
high-quality living environment. Green space evolves into a rival commodity and captures the affluent
residents with high affordability, which remodels the community atmosphere adjacent. The gap in
access to green space among socio-economic groups has gradually widened. In addition, for the
vulnerable groups, particularly for the urban poor and rural immigrants living in the dilapidated
districts, are being displaced by the inner redevelopment in the form of “demolishing the old and
constructing the new”. They were forced to move from the former living areas in the inner city to
large-scale affordable houses in urban peripheral areas which lack public service facilities, such as
parks and green spaces. This process of displacement and relocation exacerbates the trend of the unfair
spatial distribution of urban green space and worsens the inequity among different socio-economic
groups regarding their quality of life.
5.1. Local Implication and Research Prospects
Although many government officials, planners, and private investors have carried out greening
projects from the perspective of green cities and sustainable planning, little attention has been paid to
the inequitable distribution of parks and green space in urban China. Most structured proposals are
difficult to guarantee all resident’s benefits and their accessibility to the green space. Summarizing the
urban master plan and sustainability plan formulated by Nanjing Municipality in the past 10 years, it
was found that only 40% mentioned social equity, and only 10% of the work adopted a clear expressionYou can also read