Movements and home ranges of translocated and resident lions - Leo Foundation
←
→
Page content transcription
If your browser does not render page correctly, please read the page content below
Movements and home ranges of
     translocated and resident lions
(Panthera leo melanochaita) in relation
 to the translocation potential in Meru
          National Park, Kenya.
Master Project submitted to obtain the degree of Master in Biology,
     specialisation Biodiversity: conservation and restoration.

                       Gert-Jan Goeminne
             Promotor: Prof. Dr. Ir. Hans H. de Iongh
                 Supervisor: Msc. Luka Narisha

                      University of Antwerp
                        Faculty of Science
                      Department of Biology
                    Academic year 2019-2020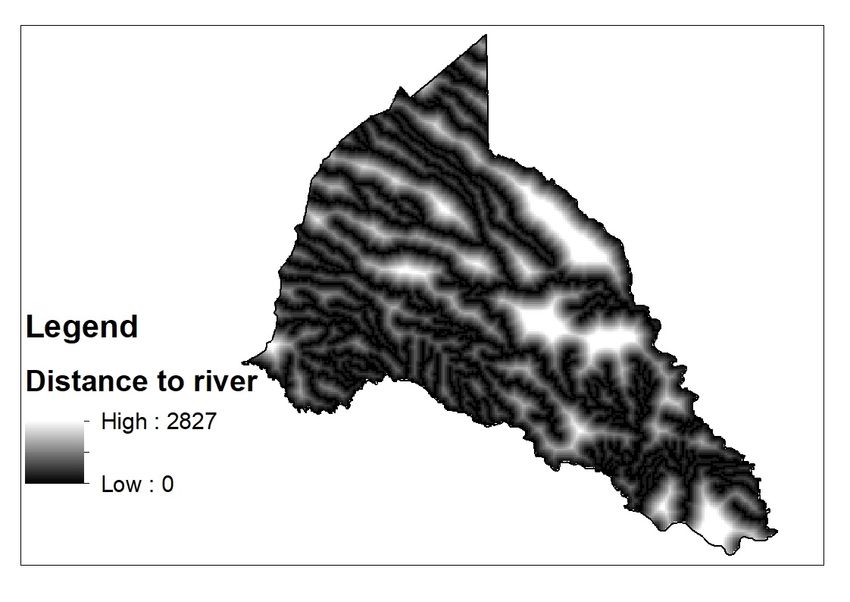
Abstract

The number of human-wildlife conflicts has steadily increased in recent years, due
to habitat loss and growing human populations. Translocation of problem animals
has often been suggested as a possible solution, because of its non-lethal character
and relative cost-efficiency. The location of release and pre-release handling (soft
vs. hard release) are considered to be the most important factors for translocations
to be successful. In this thesis, differences in behaviour between resident lions and
translocated lions were examined for Meru National Park (MNP) in Kenya, a park
regularly used by Kenyan Wildlife Services (KWS) as a translocation site for problem
lions. Additionally, an ecological translocation suitability analysis for lion translocations
was performed. Both the movements and home ranges of resident and translocated lions
were compared, based on the data of five satellite collared lions. For the home ranges
both the home range size and the time of establishment were compared. The ecological
suitability analysis was performed using different ecological variables to quantify the
ecological suitability of different areas in the park. The weight of each variable was
adapted from literature and later optimized with Bayesian statistics. Home ranges
and movements differed strongly between resident and translocated lions with the
exception of one translocated male, which showed similar behaviour to resident lions.
This male was observed to have joined a local resident pride. The two other problem
lions showed large movements outside the park and both died within a few months.
The developed method for the optimization of the ecological suitability analysis seemed
to be useful and could be a possible tool to determine the translocation potential of a
park. However, to give more reliable results, a more extensive data set would be needed,
in order to improve the outcome of the method for the future.

                                             i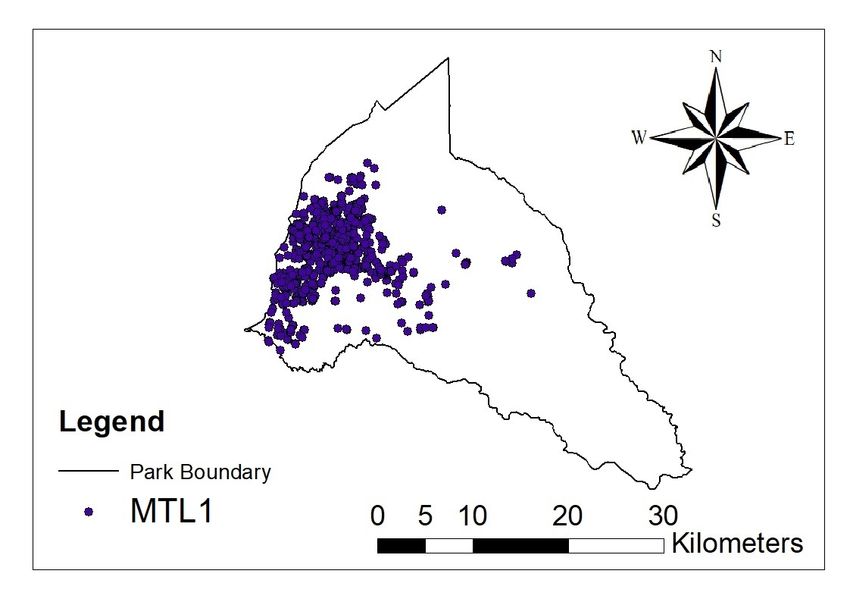
Summary

The translocation of carnivores has often been proposed as a possible strategy to prevent
human-wildlife conflicts. However, very limited data is available to determine the
success of this strategy in the case of problem lions. In this research, the difference
in behavior between resident and translocated problem lions in Meru National Park
(MNP) has been determined. Movements and home range of a total of five satellite
collared lions were available, two being resident lions and three being translocated
problem lions. Firstly, movements, home range size and establishment of a new territory
by the lions were analyzed. Secondly, an ecological translocation suitability analysis
was performed based on literature and optimized using Bayesian statistics.
    The analysis showed that resident and translocated problem lions move differently,
barring one translocated problem lion. This individual (MTL1) was the only successful
translocation, joining an existing pride territory, surviving for more than a year and even
reproducing in the same pride. Not only was there a difference in the average potential
minimum distance traveled in a day (24h) but also in the standard deviation of the
distance translocated problem lions traveled, indicating more variation. However, none
of the differences were found to be significant which could be due to the lack of data.
The difference in movements also resulted in larger home ranges for unsuccessfully
translocated problem lions, compared to the resident lions and MTL1. The same trend
can be found in the home range establishment. Again the unsuccessfully translocated
problem lions were never able to establish a new territory while MTL1 only needed two
months to establish his home range, resident lions took only one month to do so.
    The performed ecological translocation suitability analysis for lion translocation,
based on literature, was able to give a prediction on the translocation potential of MNP.
Later, this analysis was optimized using Bayesian statistics. The analysis showed that
all the ecological variables found in the literature were significant in predicting the
translocation potential of an area. However, there was a difference in the importance of
the different ecological variables compared to the analysis based on literature. Since
only limited data were available for this analysis, more research needs to be done to
make accurate predictions on the translocation potential of the park.
    This research contributes to the PhD thesis of Luka Narisha and was supervised by
the University of Antwerp, the University of Leiden and the Kenya Wildlife Service.

                                            ii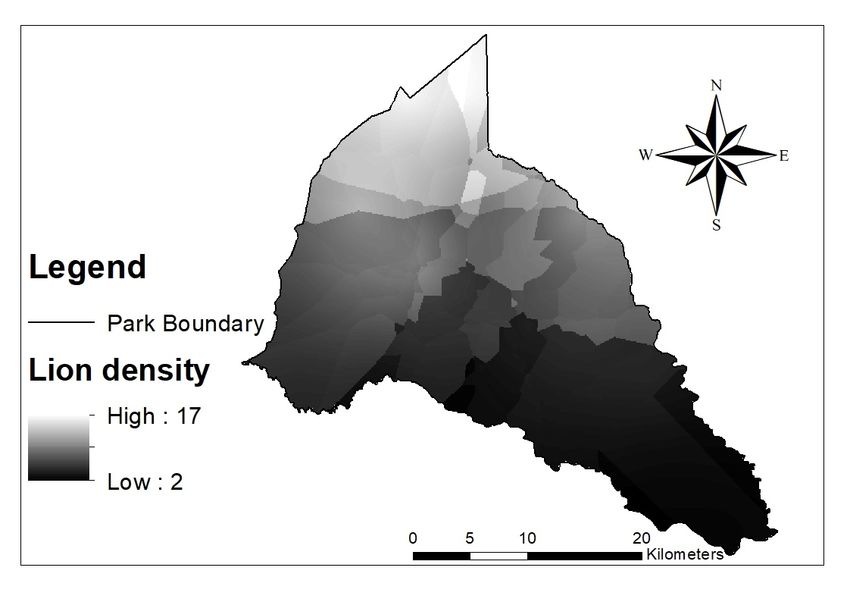
Contents

1   Introduction                                                                                            1
    1.1   Conservations status . . . . . . . . . . . . . . . . . . . . . . . . . . . . . . . . . . .        1
    1.2   Home range and movements . . . . . . . . . . . . . . . . . . . . . . . . . . . . . .              3
    1.3   Human-carnivore conflicts . . . . . . . . . . . . . . . . . . . . . . . . . . . . . . . .         4
          1.3.1   Lion Translocation . . . . . . . . . . . . . . . . . . . . . . . . . . . . . . . .        4
          1.3.2   Ecological translocation suitability . . . . . . . . . . . . . . . . . . . . . . .        5
    1.4   Research objectives . . . . . . . . . . . . . . . . . . . . . . . . . . . . . . . . . . . .       5

2   Material and Methods                                                                                    7
    2.1   Study site . . . . . . . . . . . . . . . . . . . . . . . . . . . . . . . . . . . . . . . . . .    7
    2.2   Lion collaring . . . . . . . . . . . . . . . . . . . . . . . . . . . . . . . . . . . . . . .      8
    2.3   Movements and home ranges . . . . . . . . . . . . . . . . . . . . . . . . . . . . . .             8
    2.4   Statistical analysis . . . . . . . . . . . . . . . . . . . . . . . . . . . . . . . . . . . . .    9
    2.5   Ecological translocation suitability . . . . . . . . . . . . . . . . . . . . . . . . . . .       10
          2.5.1   Ecological variables . . . . . . . . . . . . . . . . . . . . . . . . . . . . . . .       10
          2.5.2   Validation of literature based weights . . . . . . . . . . . . . . . . . . . . .         13
          2.5.3   Weight optimisation . . . . . . . . . . . . . . . . . . . . . . . . . . . . . . .        14
          2.5.4   Weight selection . . . . . . . . . . . . . . . . . . . . . . . . . . . . . . . . .       14

3   Results                                                                                                16
    3.1   Lion collaring . . . . . . . . . . . . . . . . . . . . . . . . . . . . . . . . . . . . . . .     16
    3.2   Movements . . . . . . . . . . . . . . . . . . . . . . . . . . . . . . . . . . . . . . . .        16
    3.3   Home ranges . . . . . . . . . . . . . . . . . . . . . . . . . . . . . . . . . . . . . . . .      18
    3.4   Home range establishment . . . . . . . . . . . . . . . . . . . . . . . . . . . . . . . .         24
    3.5   Ecological translocation suitability . . . . . . . . . . . . . . . . . . . . . . . . . . .       24

4   Discussion                                                                                             28
    4.1   Movements and home ranges . . . . . . . . . . . . . . . . . . . . . . . . . . . . . .            28
    4.2   Ecological translocation suitability . . . . . . . . . . . . . . . . . . . . . . . . . . .       31
    Appendix 1 . . . . . . . . . . . . . . . . . . . . . . . . . . . . . . . . . . . . . . . . . . . .     42
    Appendix 2 . . . . . . . . . . . . . . . . . . . . . . . . . . . . . . . . . . . . . . . . . . . .     43
    Appendix 3 . . . . . . . . . . . . . . . . . . . . . . . . . . . . . . . . . . . . . . . . . . . .     44

                                                     iii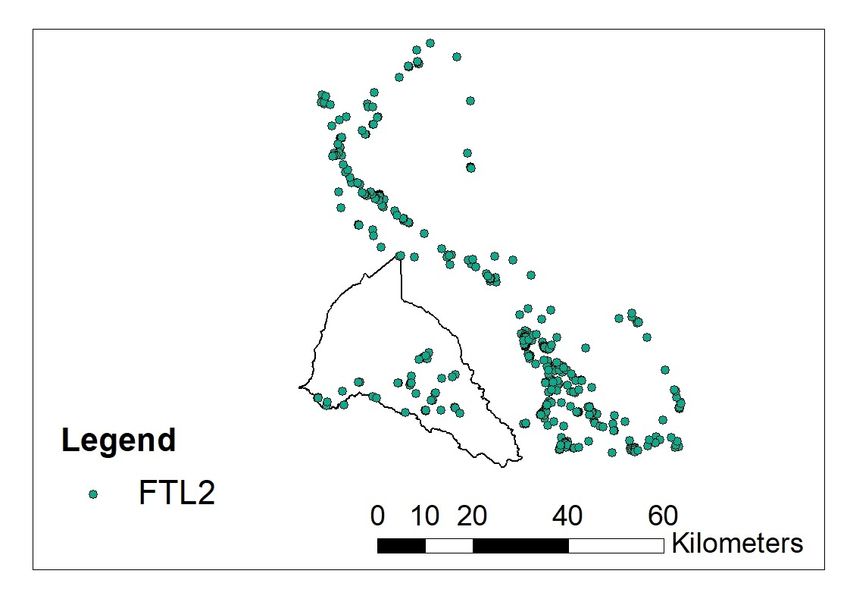
Chapter 1

Introduction

1.1    Conservations status

Large carnivores, like the African lion (Panthera leo) L., Leopard (Panhtera pardus) and
Cheetah (Acinonyx jubatus) are in decline worldwide (Inskip & Zimmermann, 2009).
However, trends differ geographically (Chapron et al., 2014). The decline in carnivore
populations has many causes like prey depletion (Craigie et al., 2010; Lindsey et al.,
2013), habitat destruction (Björklund, 2003), demand for traditional African and Chinese
medicines (Williams, 2015), illegal trade and poorly regulated sport hunting (Becker
et al., 2013). However, the biggest threat to large carnivores is suggested to be the growth
of human populations, the consequential habitat loss for many predator species and
the increase in human-wildlife conflicts (Bales et al., 2005). Human-wildlife conflicts
often include the predation on livestock, which causes economic damage and elicits
a negative attitude of the local inhabitants towards wildlife. This often results in the
retaliatory killing of the predators (Mills, 1998; Nowell et al., 1996). As human popu-
lations are expected to increase further in the coming years, especially in developing
countries, competition for natural resources and the associated human-wildlife conflicts
are expected to increase (Messmer, 2000). Muntifering et al. (2006) found that large car-
nivores are the most vulnerable to extinction caused by human influences. Apart from
human-wildlife conflicts, biological factors like low densities, small population sizes
and large home ranges cause large carnivores to suffer first when human populations
expand into their habitat (Cardillo et al., 2005). Since large carnivores are at the top of
the food chain, their population size will always be smaller than the population size of
their prey (Sillero-Zubiri & Laurenson, 2001).
    The historical distribution of the lion covered Africa, Europe, the Middle East and
Southwest Asia, in all habitats except very dry deserts and very moist forests(Nowell
et al., 1996). During the first century AD, lions disappeared from Europe and between
1800 and 1950 they disappeared from North Africa, the Middle East and most of Asia

                                             1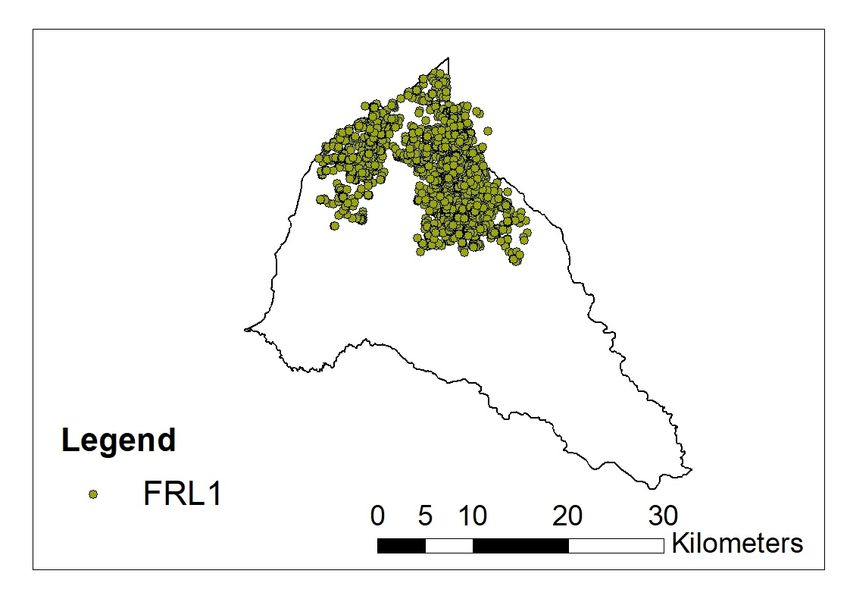
INTRODUCTION

(Fig. 1.1) (Nowell et al., 1996). Nowadays, lions can only be found in savannah habitats
across sub-Sahara Africa as well as a small population in the Gir Reserve India and are
mostly associated with protected areas and managed hunting areas (Nowell et al., 1996;
Dolrenry et al., 2014; Riggio et al., 2013). Currently, 27 countries have a free-ranging lion
population in Africa, of which only nine countries have a lion population exceeding
1,000 individuals (Riggio et al., 2013). Riggio et al. (2013) estimates the global lion
population at 32,000 lions divided over 67 Lion Conservation Units. However, the exact
number of lions is not known since lions are difficult to count and population estimates
are essentially imprecise (Bauer, 2008).

Figure 1.1: The historical and recent distribution of lions (Panthera Leo) in Africa
(Bauer, 2008).

     Previously, lions were split into two subspecies, namely the African lion (Panthera
leo leo) and the Asian lion Panthera leo persica), however, this taxonomy has been recently
adapted (Kitchener et al., 2017). Recent studies implicate that lion populations of
Western and Central Africa are more related to the Asiatic lion than populations of
Eastern and Southern Africa. Therefore, a new taxonomy has been accepted for the
African lion, two subspecies are now recognized by the IUCN Cat Specialist Group,
Panthera leo leo, in Western, Central Africa and India and Panthera leo melanochaita, in
Eastern and Southern Africa (Kitchener et al., 2017).
     The lion is globally still classified as vulnerable on the global IUCN Red List. Depend-
ing on the region considered, lions range from being classified as Regionally Critically
Endangered to Least Concerned. For example, in West Africa, the lion population meets
the criteria for Regionally Critically Endangered and in India, lions are classified as

2                                      Master thesis                   Gert-Jan Goeminne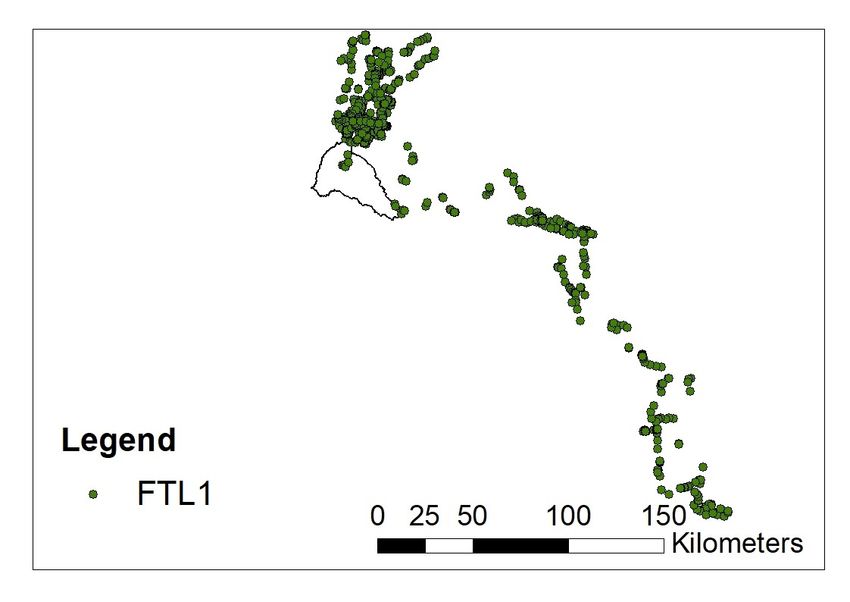
INTRODUCTION

Regionally Endangered while they are also considered Regionally Endangered in East
Africa (Bauer et al., 2015; Henschel et al., 2014). Nonetheless, in South Africa, lions are
considered to be of Least Concern (Bauer et al., 2015; Miller et al., 2016). The variation in
regional Red List status is the result of different trends in different regions, like in West,
East and Central Africa, with decreasing trends, in contrast to the populations in India
and South Africa where trends are increasing (Bauer et al., 2015).

1.2     Home range and movements
A home range can be described as: “The area transversed by an individual in its normal
activities of food gathering, mating and caring for the young” (Burt, 1943). Generally,
the home range of carnivores is as large as necessary but as small as possible to contain
enough resources to satisfy the energy needs of the pride, therefore, larger prides need
a larger home range (Gittleman & Harvey, 1982; Macdonald, 1983; Kruuk & Macdonald,
1985). The upper limit is often determined by the energy cost of protecting the home
range against other lions, while the lower limit is set by the availability of resources
(Bertram, 1973). However, anthropogenic effects and geographical boundaries also
shape home ranges (Davidson et al., 2012; Oriol-Cotterill et al., 2015). The core of the
home range is often protected more forcefully against rivals and is often defined as the
lions’ territory (Schaller, 2009). Males can protect their pride by chasing away rivals
and scent marking their territory with urine (Funston et al., 1998; Packer et al., 1991).
The security of the territory is maintained by patrolling the borders, scent-marking with
urine by the pride males and roaring, the latter by both males en females (Bertram, 1973;
Funston et al., 1998).
    Lions are opportunistic predators, therefore, seasonal shifts in prey preference have
been observed, causing home range size changes at different time scales (Loveridge
et al., 2009; Owen-Smith, 2008; Lesilau et al., 2019). Apart from shifts in prey diversity,
seasonal shifts in prey density can also cause the expansion or contraction of home
ranges. Where prey is more concentrated around water sources in the dry season,
densities decrease in the wet season, causing lion home ranges to increase, in order to
contain sufficient resources (Bauer & De Iongh, 2005; Loveridge et al., 2009; Tuqa et al.,
2014; Gittleman & Harvey, 1982; Ogutu & Dublin, 2002; Patterson et al., 2004). Lion
home ranges vary considerably in size, between different study areas and can range
from 20-45 km2 in, for example, Lake Manyara National Park and the Ngorongoro
Crater in Tanzania (Schaller, 2009; Hanby & Bygott, 1987) to as much as 2,075 km2 in
arid ecosystems as Etosha National Park in Namibia (Stander, 1991). Even inside a
national park home range sizes can differ between prides, in Makalali reserve, home
range sizes vary between 24.9 km2 and 106.8 km2 (Druce et al., 2004). Furthermore,
intraspecific differences in home range sizes are also found. While the home range size

Gert-Jan Goeminne                      Master thesis                                        3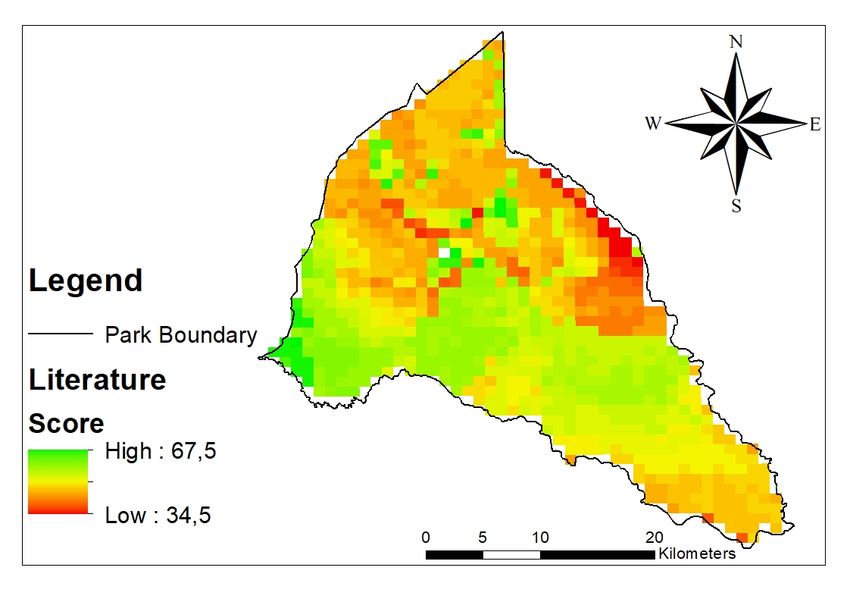
INTRODUCTION

of male lions depends on both resources and access to females. Female home ranges
depend almost solely on the available resources and the presence of cubs (Schaller,
2009). Therefore, it is possible for a male lions’ home range to cover the home range of
two or more female prides (Orsdol et al., 1985; Funston et al., 2003). Additionally, nomad
males generally have larger home ranges due to the fact that they avoid the territories
of pride males and move over longer distances (Loveridge et al., 2009).
    Similar to the home range, the potential minimum distance travelled by lions is
found to be negatively correlated with prey densities and surface water availability
(Ogutu & Dublin, 2002; Tuqa et al., 2014). Most activity peaks are found at dusk and at
down (Lesilau et al., 2019), where lions can be observed hunting, mating and feeding
during all times of the day, depending on ambient temperatures (Schaller, 2009). Diurnal
movements can also be the result of the location of their resting site. When they come
in contact with large herbivores like African buffalos (Syncerus caffer) or elephants
(Loxodonta africanus), the lions often get chased away (Hayward & Hayward, 2007).
The same can happen when tourists harass the lions or drive too close (Hayward &
Hayward, 2007). Large variations exist but, on average, lions spend two hours a day
walking and 40 to 50 minutes a day eating, the rest of the day lions are largely inactive
(Schaller, 2009). When multiple coalitions are present in an area, it is possible that both
coalitions have a different activity pattern (Hayward & Hayward, 2007). In this case, the
dominant coalition has first choice when to be active, while the subordinate coalition is
active during other periods, to avoid competition with the dominant coalition (Hayward
& Hayward, 2007).

1.3     Human-carnivore conflicts

1.3.1   Lion Translocation
Since many of the problem animals are considered endangered, non-lethal solutions
for human-carnivore conflicts are often preferred by conservation organisations such
as KWS (Bradley et al., 2005). Translocation is a method where wild individuals are
transferred from one place to another, both areas being part of the current or historic
range of the species (Fontúrbel & Simonetti, 2011; Miller et al., 1999). It is a possible
solution for human-wildlife conflicts, but it is also used by wildlife managers to achieve
enforcement or reintroduction of species populations (Fischer & Lindenmayer, 2000;
Treves & Karanth, 2003). Apart from the clear potential advantages to translocations,
there is no consensus about their effectiveness (Fischer & Lindenmayer, 2000; Bradley
et al., 2005; Goodrich & Miquelle, 2005). When animals are translocated to new territories,
survival might be compromised due to homing behavior and having to establish a
new territory in an environment often housing a resident population (Bradley et al.,

4                                     Master thesis                   Gert-Jan Goeminne
INTRODUCTION

2005; Stamps & Swaisgood, 2007). Furthermore, translocations can often be ineffective
since translocated problem animals often cause high rates of livestock attacks after
their translocations (Treves & Karanth, 2003). However, Weise et al. (2015) found that
translocated problem leopards and lions, do not cause more livestock attacks after their
translocation but they found that translocating problem leopards and lions often causes
other leopards and lions to replace these translocated animals and start preying on
livestock, inducing local source-sink dynamics.

1.3.2   Ecological translocation suitability
Weise et al. (2015) found that the success of translocations of leopards in Namibia
depends for a large part on the location of release and the method of release (soft
versus hard release). They were able to develop an ecological translocation suitability
analysis, determining the possible release sites for leopards. The ecological translocation
suitability analysis was based on resident leopard densities in the area, where locations
with zero leopards or with too high densities were considered unsuitable. A 50 km
buffer around urban centers was constructed and finally, areas smaller than the square
of the longest measured distance travelled by a translocated leopard, before settling
in an area, were taken out of the ecological translocation suitability analysis. Based
on this ecological translocation suitability analysis they predicted 87 suitable leopard
translocation sites in Namibia, in total covering 117,613 km2 . They also found less
homing behavior for animals translocated with a soft release, from an acclimatization
pen, compared to hard-release, straight into the new environment.
    Due to its remote character, Meru National Park (MNP) has often been used as a
translocation site for problem animals in Kenya (Hans de Iongh, personal communi-
cation, January 2019). Since 2012, a total of 13 problem lions have been translocated
to MNP (Appendix 3). Although it is known that not all translocations were success-
ful, Kenyan Wildlife Service (KWS) is planning to continue this translocation policy
(Narisha, 2018). Very few studies have been published on the subject of problem lion
translocations and very little is known about the success of the translocations.

1.4     Research objectives
Species extinction and the resulted loss of biodiversity is a global environmental problem
(Heywood et al., 1995; Myers et al., 1979; Pimm et al., 2001). Even though there is some
discussion about the rate of extinction, most authors agree that human development
accelerates extinction between 1,000 to 10,000 times the ’background’ extinction (May
et al., 1995). As a consequence, the ecological, spiritual and economical function of these
species is lost forever (May et al., 1995).

Gert-Jan Goeminne                     Master thesis                                      5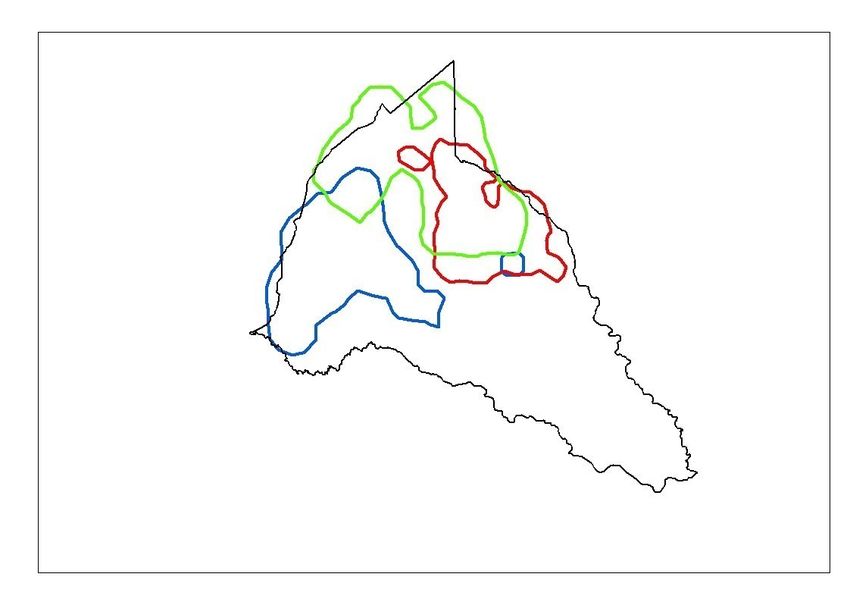
INTRODUCTION

    This research contributes to the PhD of Luka Narisha (Kenya Wildlife Services)
assigned to CML, Leiden University. It is the first PhD performed in MNP, concerning
lions. It is a collaboration between KWS, Born Free, Leo, CML and UA. Home ranges
and movements have been studied before in other national parks like Nairobi National
Park, however, MNP offers a very specific study area. Together with Tsavo National
Park it is the main site in Kenya to which problem lions have been translocated. This
makes it possible to study the effectiveness of problem lion translocations as a mitigation
strategy for problem lions. This is different from the reintroduction of lions in areas
where lions became extinct.
    The goal of this research is to define the differences in both home ranges and move-
ments between resident and translocated problem lions and their possible interaction.
Furthermore, I intend to predict the potential of MNP as a translocation site, for fu-
ture lion translocations. Firstly, I hypothesize that home ranges and movements differ
between resident and translocated problem lions, in the first few months after the
translocation. I expect translocated problem lions to have a larger home range than
resident lions. Secondly, I hypothesize that MNP has a good potential as a translocation
site for future translocations, due to the fact that it is still recovering from high degrees
of poaching in the past and therefore the full carrying capacity has not been reached yet.
Expanding our knowledge on the behavior of translocated problem lions and defining
which factors influence the success or failure of translocation will be crucial for a sound
translocation policy. I have defined the following research questions:

    1. Lion movements and home range in time and space:

        (a) What are the movements for the different lions?
        (b) Which factors influence movements?
        (c) What are the home range estimators for the different lions?
       (d) How often do lions leave the park?
        (e) How long does it take for the lions to establish a home range?
        (f) Is there a difference in home range between resident and translocated prob-
            lem lions?

    2. Ecological translocation suitability for translocation in the park:

        (a) What is the carrying capacity for lions in the park?
        (b) Which factors influence the carrying capacity for lions?
        (c) What is the potential of the park as a translocation site for problem lions?
       (d) Which area in the park is still suitable for translocation?

6                                      Master thesis                     Gert-Jan Goeminne
Chapter 2
Material and Methods
2.1 Study site
The study site, MNP, offers a highly biodiverse ecosystem and is located at the base of
the Nyambene Hills in the heart of Kenya, about 360 km north-east of Nairobi, close
to the foothills of Mount Kenya. MNP was established in 1957 as a game reserve until
it became a National Park in 1967 (Narisha, 2018). The Park covers 884 km2 and is
surrounded by Kora National Park, Bisanadi reserve and Rahole reserve, as well as
community lands (Sitienei et al., 2014). As a whole, MNP is part of a protected area
covering around 4000 km2 , located in the Eastern Province from 37◦ 59’ 55” to 38◦ 25’
22.76”E and 0◦ 19’ 8”N to 0◦ 5’ 24”S, hence crossing the equator (Narisha, 2018).
MNP is characterized by very high biodiversity, with different carnivore species
including African wild dog (Lycaon pictus), cheetah (Acinonyx jubatus), leopard (Panthera
pardus), spotted hyena (Crocuta crocuta), striped hyena (Hyaena hyaena) and African
lion (Panthera leo melanochaita). Besides many species of carnivores, herbivores such
as African elephants (Loxodonta africana), black rhinoceros (Diceros bicornis), white
rhinoceros (Ceratotherium simum) and Grevys zebra (Equus grevvi) appear in MNP
(Narisha, 2018). Large conservation areas, such as the Meru Conservation Area (MCA),
are important for the protection of large-scale processes that take place in nature, as
well as for conserving important biodiversity corridors protecting migratory species
and species with large home ranges (IUCN, 2009).
The climate in MNP is hot and arid with low humidity and, due to its position near
the equator, the park experiences fairly uniform temperatures. Temperatures range
from 32 ◦ C during the day to 17 ◦ C at night. Two rainy seasons can be differentiated,
with the long rainy season taking place from March to May, and the short rainy season
from October to December. Precipitation varies throughout the park and is the highest
along the western border of the park, leading to zones that remain green throughout
the year. Lowest precipitation is found in the southern part of the park giving rise
7MATERIAL AND METHODS to a much drier area (Narisha, 2018). Broadly, three different vegetation types can be distinguished. First, Acacia-wooded grassland, which can be found in the eastern part of the park, dominated by Acacia species, along rivers and swampy areas other, mostly Hyphaene coriacea can be found (fig. 2.1f (Bekele et al., 2006). The western part of the park is covered by Combretum-wooded grassland. Here, Combretum species dominate the upland parts, while the riverine vegetation is dominated by Lawsonia inermis. Some swampy areas in this part of the park are dominated by Acacia trees, while most of the swamp floor is covered by the grass Chloris gayana. Finally, the southern region consists of Acacia-Commiphora bushland. Appearing in small areas of the park are other habitat types, including riverine forests, inselbergs, groundwater forest and swamps (Bekele et al., 2006). 2.2 Lion collaring The study of the home ranges was done using four satellite-GPS/VHF collars of Sa- vannah Tracking by Born Free and one iridium-satellite GPS collar of African Wildlife Tracking (Fig. 3.1). A total of five lions were collared, three of which were translocated problem lions from other areas (Table. 3.1). The collars were programmed to record the GPS position of each lion every hour. However, we experienced that for the collars of Savannah Tracking, when the lions were in thick bushes, the GPS location was not always recorded. Lions could also be located using the VHF-receiver and opportunistic encounters. However, this proved to be more challenging than expected due to the dense nature of the vegetation in MNP. During fieldwork we were not able to use the VHF receiver. 2.3 Movements and home ranges Movements were analyzed using Microsoft Office Excel 2010 (Microsoft, U.S.A). The distance between two data points was calculated as a straight line between these data points. Distances were divided by the number of hours between the GPS fixes, hereby calculating the average potential minimum distance (m) per hour. In order to correct for the times no signal was emitted. Since the potential minimum distance uses a straight line it may be an underestimation of the actual travelled distance. In order to calculate the average potential minimum daily travelled distance, the sum of all the average potential minimum distance during 24 hours was taken. Home ranges were constructed using RStudio v.1.1.447. Both Kernel Density Esti- mates and Minimum Convex Polygons were used to calculate the home range. The Kernel Density Estimator represents a surface area on an x-y plane and plots the GPS 8 Master thesis Gert-Jan Goeminne
MATERIAL AND METHODS

fixes as a three-dimensional ”hill”, the kernel, on the x-y plane (Boitani & Fuller, 2000).
The kernel is higher where the density of the GPS fixes is higher, the width of the kernel
can be adjusted to prevent over smoothing and was calculated using the reference
bandwidth parameter (hre f ) (Boitani & Fuller, 2000). Even though the Kernel Density
Estimator is often considered the best method to calculate home ranges, this method is
very sensitive to over smoothing (Powell et al., 1997; Seaman & Powell, 1996; Worton,
1989). As a consequence, home ranges were also calculated using the Minimum Convex
Polygon estimation. The Minimum Convex Polygon is defined as the smallest convex
polygon that encompasses all lion locations (Boitani & Fuller, 2000). The Kernel Density
estimator was calculated twice, once removing 5% of the outliers (95% Kernel Den-
sity Estimator) and once removing 50% of the outliers (50% Kernel Density Estimator)
which is considered the core home range. The same was done for the Minimum Convex
Polygon, however, here the 100% Minimum Convex Polygon was added where all
of the data points were used in calculating the home range, hereby not correcting for
exploratory behavior (Boitani & Fuller, 2000). After calculating the home ranges in
RStudio v.1.1.447, they were plotted in ArcGIS v.10.3 to calculate the percentage outside
the boundaries of MNP.
    The establishment of the home ranges was calculated using the Minimum Convex
Polygon. The home ranges were calculated starting with the first five GPS fixes, after
which the same was done adding the following GPS fixes. This was repeated until the
total amount of GPS fixes were used. Briers-Louw et al. (2019) defined the establishment
of a home range as the time it takes a lion to reach a home range, within 10% of his
home after one year. Since none of the collars of the lions in this research emitted a
signal for over a year, the definition was set to the moment the 95% Minimum Convex
Polygon reached a maximum.

2.4    Statistical analysis

Statistical analyses were carried out in RStudio v.1.1.447. Normal distribution of the
data was calculated using the Shapiro-Wilk test. In order to calculate the differences in
movements between males and females and between translocated and resident lions, a
generalized linear mixed (GLM) effect ecological translocation suitability analysis was
used (R package lmerTest). Both gender and origin were used as fixed factors and the
different individuals were added as a random factor. However, because of the small
sample size and the lack of males in the group of resident lions, it was not possible to
test for an interaction between gender and origin. Results are considered statistically
significant for p¡0.05. Differences in home ranges were not calculated due to the very
limited sample size.

Gert-Jan Goeminne                     Master thesis                                      9
MATERIAL AND METHODS
2.5 Ecological translocation suitability
In order to perform the ecological translocation suitability analysis, the park was di-
vided into pixels, each having a surface area of 0.858 m2 . For each pixel, a value was
determined for seven different ecological variables. Variations in each of the variables
were scaled in terms of lion preference from 10-90 with increments of 10, assuming no
conditions are perfect, and nothing is impossible (Appendix 1). The seven different
ecological variables were given a weighted value depending on their importance in lion
ecology. The weights were determined based on an ecological translocation suitabil-
ity analysis constructed by Lemeris (2013) and adapted for lions based on literature.
Using the Raster Calculator in ArcGIS v.10.3 a final map was constructed showing the
weighted average of the ecological parameters for different locations in MNP. Three
different scenarios are considered where different tolerances were assumed for lions.
The scenario with the highest tolerance translocated problem lions would tolerate areas
with an ecological translocation suitability score of 40 and above, while in the scenario
with the lowest tolerance, lions would need areas with an ecological translocation suit-
ability score of at least 60 to survive. When medium tolerance was assumed, the lions
would stay in areas with an ecological translocation suitability score of 50 and above.
2.5.1 Ecological variables
The ecological variables altitude (Fig. 2.1c), precipitation (Fig. 2.1d), distance to rivers
(Fig. 2.1e), vegetation (Fig. 2.1f) and prey diversity (Appendix 2) were included in
the final ecological translocation suitability analysis for their obvious influence on the
suitability of the area for lion translocations. Since the current ecological translocation
suitability analysis was intended only for MNP, which is a protected area, only ecological
variables were taken into account, assuming no human influences inside a protected
area. More complex ecological variables, like the lion density factor (Fig. 2.1a) and the
hyena density factor (Fig. 2.1b), were also used in the ecological translocation suitability
analysis, following the method developed by Lemeris (2013).
Prey species densities affect the ecological translocation suitability positively as
higher prey densities can support higher lion densities (Hayward et al., 2007). Therefore,
both the prey densities and the lion densities were used to calculate the lion density
factor, which was also included as one of the variables in the ecological translocation
suitability analysis. In order to calculate the lion density factor, the carrying capacity
for lions in the park was divided by the measured lion densities. Hence, the lion
density factor can be defined as the rate up to which the carrying capacity has been
reached. The carrying capacity is defined as the maximum number of lions that available
resources in MNP can support and was calculated based on the prey species densities
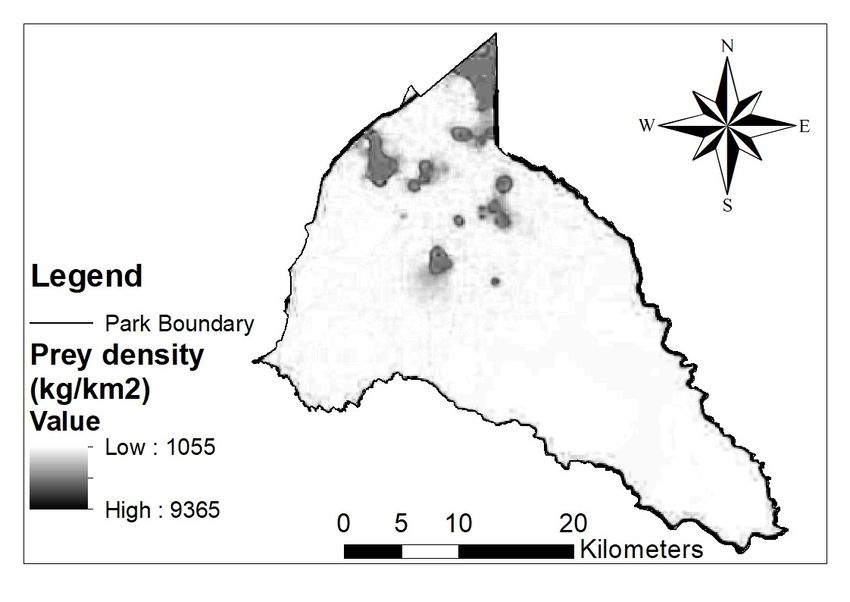
10 Master thesis Gert-Jan GoeminneMATERIAL AND METHODS (a) Lion density in lion/100km2 (Bundotich (b) Hyena density in hyenas/100km2 (Bun- et al., 2016) dotich et al., 2016) (c) Altitude in m (WRI, 2019) (d) Precipitation in mm (WRI, 2019) (e) Distance to rivers in m (Bundotich et al., (f) Vegetation (Bekele et al., 2006) 2016) Figure 2.1: Representation of variables used for the translocation ecological translo- cation suitability analysis for lions in MNP (Bekele et al., 2006; WRI, 2019; Bun- dotich et al., 2016) (Fig. 2.2) (Hayward et al., 2007). Lion densities in itself give little information about the competition in an area. Whenever carrying capacity is low, high lion densities will cause high competition, however when carrying capacity is high, high lion densities may not necessarily cause high competition. Therefore, it was decided to include the Gert-Jan Goeminne Master thesis 11
MATERIAL AND METHODS

carrying capacity in the ecological translocation suitability analysis. Carrying capacity,
however, is hard to quantify since it is a very dynamic concept that can change from
year to year (Byron et al., 2011) and its estimation will always be partially theoretical.
Despite this limitation, carrying capacity was added to the ecological translocation
suitability analysis because of the important information it contains, which more than
compensated for the slight decrease in ecological translocation suitability analysis
robustness. Lion carrying capacity was calculated following the procedure of Hayward
et al. (2007) with the formula:

                                   y = 10(−2.158+0.377x)                               (2.1)

   where y is the carrying capacity for lions (lion km−2 ) and x is the log10 of the prey
biomass (kg km−2 ), including giraffe (Giraffa camelopardalis), common zebra (Equus
quagga), gemsbok (Oryx gazelle) and buffalo. Blue wildebeest (Connochaetes taurinus)
was not included since it is not present in MNP. Data on prey densities (Fig. 2.2) were
obtained from Bundotich et al. (2016).

Figure 2.2: Prey density for lions in MNP, including giraffe, common zebra, gems-
bok and buffalo (Bundotich et al., 2016).

    The effect of the lion and spotted hyena density factor is more complex to determine
than the other ecological variables. On the one hand, a high lion or spotted hyena
density factor has a negative effect on the ecological translocation suitability of the park
as they increase competition. A low spotted hyena density factor, on the other hand,
has very little effect on the translocation ecological translocation suitability analysis,
while a low lion density factor would again have a negative effect due to the lack of
possible mates. This may cause the translocated problem lion to move out of the area

12                                    Master thesis                    Gert-Jan Goeminne
MATERIAL AND METHODS
in search of a potential mate. Medium lion and spotted hyena density factors were
expected to have a positive effect on the ecological translocation suitability, since small
groups of hyenas are not able to prevent getting their kills stolen by lions, in this way
benefiting the lion population, while a medium lion density factor reduces competition,
yet provide sufficient potential mates.
Some of the variables could be scored immediately, while others had to be adjusted
before they contained the needed information for the ecological translocation suitability
analysis. Prey diversity, for example, was calculated for the different vegetation types
using transect counts. The number of recorded prey species was then divided by the
total number of prey species in the park, following the procedure of Hayward et al.
(2007), with the addition of dik-dik (Madoqua), gerenuk (Litocranius walleri) and Grevy-
zebra, to determine which species are considered prey species. The distance to rivers
(m) raster (Fig. 2.1e) was generated using the Euclidean Distance function in ArcGIS
v. 10.3. Lion and hyena densities were calculated based on call back data found by
Bundotich et al. (2016). The callback data were plotted on a map and using the kriging-
tool in ArcGIS v. 10.3 the data were extrapolated over the whole park. The ratio of
the measured hyena densities to lion densities in the park was calculated using the
Raster Calculator function in ArcGIS v. 10.3, since the ratio gives more information
about competition than plain densities. Measured lion densities were divided by the
previously calculated carrying capacity, again using the Raster Calculator function in
ArcGIS v. 10.3, to estimate the percentage of the carrying capacity that is reached.
Data on prey diversity in MNP were collected during a three-month period from
the beginning of February to the end of April through prey counts in a total of seven
transects of 2km each (Bal, 2020). A shapefile containing the river network was obtained
from KWS. Altitude, as well as precipitation data, were abstracted from shapefiles,
made available by the World Recourses Institute (WRI, 2019). Information about the
different vegetation types was extracted from Bekele et al. (2006).
2.5.2 Validation of literature based weights
In order to provide a rough validation of the accuracy of the ecological translocation
suitability analysis based on literature, the output was compared to the data of the
translocated problem lions. In total, 1,427 GPS locations of a translocated problem
lions were obtained from KWS. A histogram was created, starting from an ecological
translocation suitability score of 30 to an ecological translocation suitability score of 70,
with increments of 5. The upper and lower limit of the analysis were defined based on
the scores obtained from the ecological translocation suitability analysis adapted from
literature. For each bar, the total number of GPS locations of translocated lions, recorded
in these areas was divided by the calculated surface to estimate if the translocated lions
Gert-Jan Goeminne Master thesis 13MATERIAL AND METHODS
selected for areas with a higher ecological translocation suitability score.
2.5.3 Weight optimisation
Optimizing the weights of the ecological translocation suitability analysis was done by
using Bayesian statistics (Van Oijen et al., 2005). Firstly, an ideal histogram with eight
bars was created, again starting with an ecological translocation suitability score 30
and ending with an ecological translocation suitability score of 70. The ideal histogram
represents the density of GPS recordings, calculated by dividing the number of GPS
recordings in each pixel by the number of pixels with a certain ecological suitability
score. Ideal values for the histogram were calculated based on the available data. A
linear increase of the density was expected starting from zero, with the same average
density of GPS recordings as the actual data. This results in an ideal histogram starting
from zero and ending at two times the average density of GPS recordings, with a step
wise increase of (2 * the average density) / (number of bars - 1).
Secondly, random weights were generated for the different ecological variables, each
time calculating a histogram with the same axes as the ideal histogram. Thereafter,
the difference between the ideal histogram and the newly generated histogram was
calculated based on the log likelihood (Van Oijen et al., 2005). This process was repeated
with slightly different weights, however, when the last generated histogram differs
more from the ideal histogram than the previous attempt the newly generated weights
were no longer used and new weights were generated based on the best attempt. This
loop was repeated 10,000 times, in this way optimizing the weights. Finally, the best
fitting weights were used to do an ecological translocation suitability analysis.
2.5.4 Weight selection
Table 2.1: Estimates of ecological variables with their weighted value, contributing
to the ecological suitability analysis for translocated lions.
Ecological variable Weight (Literature) Source Weight (Bayesian)
Lion density factor 0.25 Lemeris (2013) 0.20
Hyena density factor 0.10 Trinkel & Kastberger (2005) 0.18
Prey diversity 0.05 Lemeris (2013) 0.20
Vegetation 0.15 Spong (2002) 0.10
Distance to the river 0.15 de Boer et al. (2010) 0.06
Precipitation 0.15 Celesia et al. (2010) 0.06
Altitude 0.15 Celesia et al. (2010) 0.17
For the weights based on literature the highest weight was assigned to the lion den-
sity (0.25) while prey diversity had the lowest importance for the ecological suitability
analysis (0.05). Vegetation, distance to rivers, precipitation and altitude got assigned a
14 Master thesis Gert-Jan GoeminneMATERIAL AND METHODS
weight of 0.15 while hyena density was assigned a weight of 0.10. These weights give
the following equation for our ecological suitability analysis (Table 2.1):
Ecological suitability = 0.25 ∗ Lion density f actor + 0.15 ∗ Vegetation+
0.15 ∗ Distance to the river + 0.15 ∗ Altitude + 0.15 ∗ Precipitation+ (2.2)
0.10 ∗ Hyena density f actor + 0.05 ∗ Prey diversity
After using Bayesian statistics to optimize the weights based on the available data,
all seven ecological variables were found to be significant. However, prey diversity
was assigned a weight equal to the lion density factor (0.20), while both distance to
the river and precipitation were assigned the lowest weight of 0.06. Vegetation was
assigned a weight of 0.10, slightly lower than the weight adapted from literature. Hyena
density factor on the other hand was assigned a weight slightly higher than the weights
adapted from literature (0.18). Finally, altitude was assigned a weight of 0.17, similar to
the weight adapted from literature. Resulting in the following equation:
Ecological suitability = 0.20 ∗ Lion density f actor + 0.10 ∗ Vegetation+
0.06 ∗ Distance to the river + 0.17 ∗ Altitude + 0.06 ∗ Precipitation+ (2.3)
0.18 ∗ Hyena density f actor + 0.20 ∗ Prey diversity
with each parameter expressed in its assigned score (Appendix 1).
Gert-Jan Goeminne Master thesis 15Chapter 3
Results
3.1 Lion collaring
As shown in table 3.1 the lions were not all collared during the same period. One lioness
was collared in 2016, all other lions were collared in 2018. FRL1 (Virginia) was collared
in 2016 but the collar stopped working in October of that year and started working
again in September of 2017, therefore data of the full time period she was collared are
not available. Of the three translocated problem lions, two lions died within a year after
translocation, FTL1 (Sericho) was killed by farmers and FTL2 (Tall Boy) of unknown
causes. Therefore, their translocation is considered unsuccessful. MTL1 (Solio) however,
did survive more than a year after his translocation, after a few months he integrated
with an existing pride by defeating the pride male and even got to reproduce. His
translocation is therefore considered successful (Weise et al., 2015; Briers-Louw et al.,
2019; Yiu et al., 2015).
Table 3.1: Available data of lion collaring in Meru National Park with the number
fixes representing the number of fixes used in this research.
Nickname ID Gender Translocated Origin Collaring End of collar No. of fixes (n)
Solio MTL1 m yes Mt. Kenya Holiday Homes 11/07/2018 (active) 1394
Sericho † FTL1 f yes Sericho 28/02/2018 30/09/2018 † 2256
Tall boy † FTL2 f yes Mutara ranch 13/07/2018 06/10/2018 † 615
Virginia FRL1 f no MNP 12/05/2016 22/01/2018 5397
G-coy FRL2 f no MNP 08/09/2018 10/03/2019 4352
† Deceased lion
3.2 Movements
When analysing the average potential minimum distance travelled during a day (24h) it
became clear that both FTL1 (Sericho) and FTL2 (Tall Boy) travelled greater distances
than the three other lions (Table 3.2). Apart from travelling greater distances they also
16RESULTS
(a) GPS fixes for MTL1 (Solio) (translocated) (b) GPS fixes for FTL1 (Sericho) (translo-
cated)
(c) GPS fixes for FTL2 (Tall Boy) (translo- (d) GPS fixes for FRL1 (Virginia) (resident)
cated)
(e) GPS fixes for FRL2 (G-coy) (resident)
Figure 3.1: GPS fixes for the collared lions in MNP
had a greater standard deviation, indicating more variation in potential minimum
distance they travelled.
Differences in average potential minimum distance travelled in 24h, between males
and females were not significant (Fig. 3.2, p = 0.0836). Similarly, average potential mini-
mum distance travelled (24h) between translocated and non-translocated individuals
were not significant either (Fig. 3.2, p = 0.0852).
Gert-Jan Goeminne Master thesis 17RESULTS
Table 3.2: Overview of average (±s.d.) in meters travelled per 24hr for the collared
lions in Meru National Park.
Nickname ID Gender Translocated Average (±s.d.) No. of fixes (n)
(m)
Solio MTL1 m yes 4467 ± 3029 1394
Sericho FTL1 f yes 7704 ± 6892 2256
Tall boy FTL2 f yes 9569 ± 7207 615
Virginia FRL1 f no 5242 ± 3592 5397
G-coy FRL2 f no 5575 ± 3635 4352
Figure 3.2: Average potential minimum distance (m) travelled in a day (24h) ± s.d.
Similar to the average potential minimum distance travelled in 24h, differences in
average potential minimum distance travelled during three hour intervals of the day,
were analysed. Fig. 3.3 clearly shows that during day light, lions in MNP travelled
less than during the night. Apart from MTL1 (Solio), the translocated problem lions
travelled greater distances during the most active hours, compared to the resident lions.
However, differences between translocated and resident lions were not significant (p =
0.0814) and neither were the differences between males and females (p = 0.0661).
3.3 Home ranges
Table 3.3 shows the home range (100% Minimum Convex Polygon, 95% Minimum
Convex Polygon and 95% Kernel Density Estimation) and core home range (50% Mini-
mum Convex Polygon and 50% Kernel Density Estimation) of the five collared lions
in MNP. The average home range of the unsuccessfully translocated problem lions,
using the 95% Minimum Convex Polygon estimate, equaled 10,735 ± 9,788 km2 while
the average home range for resident lions was 199 ± 76 km2 . When using the 95%
Kernel Density Estimation home ranges of translocated problem lions were found to
be 13,208 ± 11,968 km2 and 187 ± 71 km2 for resident lions. Average home ranges
18 Master thesis Gert-Jan GoeminneRESULTS
Figure 3.3: Average potential minimum distances (m) per hour travelled during 3-
hour time periods.
differed clearly between translocated and resident lions, except for MTL1 (Solio). For
example, the 95% Kernel Density Estimation home range of the translocated problem
lion FTL1 (Sericho) was found to be 158 times bigger than the 95% Kernel Density
Estimation home range of FRL2 (G-coy), a resident lion. Similarly, core home ranges of
two translocated problem lions, FTL2 (Tall Boy) and FTL1 (Sericho), were found to be
much larger compared to the other three lions. In the same way as the home range, the
50% Kernel Density Estimation core home range of FTL1 (Sericho) was found to be 105
times larger compared to the 50% Kernel Density Estimation core home range of FRL2
(G-coy). Despite being translocated, MTL1’s (Solio) home range and core home range
had around the same size as the home range and core home range of resident lions. The
home ranges and core home range are shown in figure 3.4.
Table 3.3: Home range and core home range estimates for the collared lions in Meru
National Park, using Minimum Convex Polygon and Kernel Density Estimations.
Nickname ID Gender Translocated MCP100 MCP95 MCP50 KDE95 KDE50
(km2 ) (km2 ) (km2 ) (km2 ) (km2 )
Solio MTL1 m yes 344.44 184.53 43.43 193.49 33.72
Sericho FTL1 f yes 18214.88 17655.77 4752.07 21670.33 2503.72
Tall Boy FTL2 f yes 4317.43 3813.81 1091.97 4744.73 981.06
Virginia FRL1 f no 293.42 253.19 124.35 236.86 46.15
G-coy FRL2 f no 213.57 145.11 34.18 136.88 24.19
As shown in Table 3.4 and Fig. 3.4 parts of the lions home ranges and core home
ranges surpasses the boundaries of the park (Fig. 3.4). For the translocated problem
lions FTL1 (Sericho) and FTL2 (Tall Boy) the proportions outside of the park were
found to be larger than for the other lions, with FTL1 (Sericho) with 96.07% of its
95% Kernel Density Estimation outside the park. In comparison, for the resident lions
Gert-Jan Goeminne Master thesis 19RESULTS
FRL1 (Virginia) had the highest proportion of its home range outside the boundaries of
the park, 13.52% of its 95% Kernel Density Estimation surpasses the park boundaries.
Similarly, for the core home range estimates both FTL2 (Tall Boy) and FTL1 (Sericho)
were found to have 95.58% and 93.62% of their 50% Kernel Density Estimation core
home range outside of the Park respectively. Again, with 12.55%, FRL1 (Virginia) was
the resident lion with the largest proportion of its 50% Kernel Density Estimation core
home range outside the park. Conversely to the other translocated problem lions, MTL1
(Solio) was found to only have 5.34% of its 95% Kernel Density Estimation outside of
the park and 0% of its 50% Kernel Density Estimation core home range.
Table 3.4: Proportion of the home range and core home range estimates for the col-
lared lions, using Minimum Convex Polygon and Kernel Density Estimations, out-
side Meru National Park.
Nickname ID Gender Translocated MCP100 MCP95 MCP50 KDE95 KDE50
Solio MTL1 m yes 0.11% 0.10% 0.00% 5.34% 0.00%
Sericho FTL1 f yes 97.97% 97.91% 94.34% 96.07% 93.62%
Tall boy FTL2 f yes 81.72% 79.40% 74.94% 85.18% 95.58%
Virginia FRL1 f no 12.24% 13.52% 8.52% 16.91% 12.55%
G-coy FRL2 f no 9.46% 5.87% 0.00% 5.36% 0.00%
20 Master thesis Gert-Jan GoeminneRESULTS (a) Minimum Convex Polygons for MTL1 (b) Kernel Density Estimates for MTL1 (So- (Solio) (translocated) lio) (translocated) (c) Minimum Convex Polygons for FTL1 (d) Kernel Density Estimates for FTL1 (Seri- (Sericho) (translocated) cho) (translocated) (e) Minimum Convex Polygons for FTL2 (Tall (f) Kernel Density Estimates for FTL2 (Tall Boy) (translocated) Boy) (translocated) Gert-Jan Goeminne Master thesis 21
RESULTS

(g) Minimum Convex Polygons for FRL1 (Vir- (h) Kernel Density Estimates for FRL1 (Vir-
ginia) (resident)                          ginia) (resident)

(i) Minimum Convex Polygons for FRL2 (G- (j) Kernel Density Estimates for Frl2 (G-coy)
coy) (resident)                          (resident)

Figure 3.4: Home ranges and core home ranges (95% and 50% Kernel Density Esti-
mates (KDE) and 100%, 95% and 50% Minimum Convex Polygons (MCP)).

    Between the home ranges of the lions that did not move outside of the park bound-
aries there was overlap of home range (Fig.3.5). Both the 95% Minimum Convex Polygon
(Fig. 3.5a) and 95% Kernel Density Estimate (Fig. 3.5b) home range show the same
trend. Most of the overlap was between both resident lions FRL2 (G-coy) and FRL1
(Virginia), while there was some overlap between the successfully translocated problem
lion MTL1 (Solio) and FRL1 (Virginia), home ranges of MTL1 (Solio) and FRL2 (G-coy)
did not overlap.

22                                  Master thesis                 Gert-Jan Goeminne
RESULTS (a) Overlap in 95% Minimum Convex Poly- (b) Overlap in 95% Kernel Density Estimate gon home range home range Figure 3.5: Home ranges overlap in the form of 95% Minimum Convex Polygons (a) and 95% Kernel Density Estimates (b) for the lions that stayed inside the park, namely, resident lions FRL2 (G-coy) and FRL1 (Virginia) and successfully translo- cated problem lion MTL1 (Solio). Gert-Jan Goeminne Master thesis 23
RESULTS

3.4    Home range establishment
Both FTL1 (Sericho) (Fig. 3.6b) and FTL2 (Tall Boy) (Fig. 3.6c) had a constantly increasing
home range (95% Minimum Convex Polygon), in contrast to MTL1 (Solio) (Fig. 3.6a)
This lion is the only translocated problem lion, who’s home range started to decline
after two months. The home range of resident lion FRL2 (G-coy) (Fig. 3.6d) started
declining one month after release. The same trend was found for the core home range
(50% Minimum Convex Polygon). However, FTL2’s (Tall Boy) core home range seems
to become smaller from time to time. Due to the missing data on FRL1 (Virginia) (Fig.
3.1d) both the home range and core home range will not be discussed.

(a) Home range assymptote for MTL1 (Solio)     (b) Home range assymptote for FTL1 (Seri-
(translocated)                                 cho) (translocated)

(c) Home range assymptote for FTL2 (Tall       (d) Home range assymptote for FRL2 (G-coy)
Boy) (translocated)                            (resident)

Figure 3.6: Home range and core home range assymptotes in the form of 100%, 95%
and 50% Minimum Convex Polygons (MCP).

3.5    Ecological translocation suitability
A total carrying capacity of 80 lions was calculated for the entire MNP, based on prey
biomass. Local carrying capacities ranged from 10 lions per 100km2 to 22 lions per
100km2 . The highest carrying capacity was found in the southern part of the park,
where small patches with higher prey densities were available (Fig. 3.7). Apart from

24                                    Master thesis                   Gert-Jan Goeminne
RESULTS

Figure 3.7: Carrying capacity for lions (lions/100km2 ) in MNP based on the prey
densities of giraffe, gemsbok, common zebra and buffalo.

these local maxima, carrying capacity was rather low in the rest of the park.
    Ecological translocation suitability scores in MNP varied between 34.5 and 67.5 for
the analysis adapted from literature and between 36.2 and 65.7 for the best fit ecological
translocation suitability analysis. The constructed ecological translocation suitability
analyses (Fig. 3.8a,b) showed a low score for lion translocation suitability in both the
northern and southern part of the park, whereas the central part of the park showed
a higher translocation suitability score. Highest translocation suitability scores were
found in the western part of the park and lowest scores were found in the north-eastern
side of the park. As shown in figure 3.8c,d the histogram calculated with the best fit
weights differed less from the ideal histogram than the histogram based on the weights
adapted from literature.
    In the ecological translocation suitability analysis adapted from literature the high
tolerance scenario (Fig. 3.9a) a total area of 800 km2 was found to be suitable for
translocation, while the low tolerance scenario (Fig. 3.9e) yielded a total area of only
33 km2 as suitable. The medium tolerance scenario (Fig. 3.9c) gave a total suitable
area of 429 km2 , with the largest patch being 335 km2 and some other small patches
divided over the park. The best fit ecological translocation suitability analysis yielded a
favourable area of 807 km2 for the high tolerance scenario (Fig. 3.9b), an area of 380 km2
for the medium tolerance scenario (Fig. 3.9f). Finally, in the medium tolerance scenario
(Fig. 3.9d) an area of 30 km2 was found to be favourable.

Gert-Jan Goeminne                     Master thesis                                     25
RESULTS
(a) Calculated ecological translocation suit- (b) Calculated ecological translocation suit-
ability for MNP adapted from literature. ability for MNP optimized with Bayesian
statistics (Best fit).
(c) The number of recorded GPS locations (d) The frequency polygon for the ideal, lit-
divided by the surface area for eight incre- erature and best fit histograms.
ments of five, between a calculated ecologi-
cal translocation suitability score of 30 to 70
for the ideal, literature and best fit.
Figure 3.8: The final ecological translocation suitability analysis for MNP based on
seven different ecological variables. (a) the ecological translocation suitability of
MNP, (b) ecological translocation suitability of MNP with GPS locations of the sur-
viving translocated problem lion. (c) The division of the GPS locations between
different increments of the ecological translocation suitability score, divided by the
surface area covered by these increments.
26 Master thesis Gert-Jan GoeminneRESULTS (a) High tolerance scenario where a score of (b) High tolerance scenario where a score of 40 and above is suitable (literature). 40 and above is suitable (best fit). (c) Medium tolerance scenario where a score (d) Medium tolerance scenario where a score of 50 and above is suitable (literature). of 50 and above is suitable (best fit). (e) High tolerance scenario where a score of (f) High tolerance scenario where a score of 60 and above is suitable(literature). 60 and above is suitable (best fit). Figure 3.9: Three different scenarios for lion translocation, based on the calculated translocation score, assuming different tolerances of lions for both the ecological translocation suitability analysis adapted from literature and the best fit determined with Bayesian statistics. Gert-Jan Goeminne Master thesis 27
You can also read