Activation of Adaptive Immune Cells is an Early Response to Hyperthermic Intraperitoneal Chemotherapy Treatment in Ovarian Cancer - Research Square
←
→
Page content transcription
If your browser does not render page correctly, please read the page content below
Activation of Adaptive Immune Cells is an Early Response to Hyperthermic Intraperitoneal Chemotherapy Treatment in Ovarian Cancer Ofer Reizes ( Reizeso@ccf.org ) Cleveland Clinic https://orcid.org/0000-0003-0075-6871 Tyler Alban Lerner Research Institute Max Horowitz Cleveland Clinic Danielle Chau Cleveland Clinic Zahraa Alali Cleveland Clinic Emily Esakov Cleveland Clinic Goutam Dey Cleveland Clinic Changjin Hong Cleveland Clinic Tae Hyun Hwang Cleveland Clinic https://orcid.org/0000-0002-6668-7269 Vladimir Makarov Memorial Sloan Kettering Cancer Center Justin Lathia Cleveland Clinic https://orcid.org/0000-0003-3168-7290 Peng Qi Cleveland Clinic https://orcid.org/0000-0003-4661-8212 Jennifer Yu Cleveland Clinic Chad Michener Cleveland Clinic Timothy Chan Memorial Sloan Kettering Cancer Center https://orcid.org/0000-0002-9265-0283 Robert DeBernardo
Cleveland Clinic Article Keywords: hyperthermic intraperitoneal chemotherapy, ovarian cancer, adaptive immune cells DOI: https://doi.org/10.21203/rs.3.rs-701286/v1 License: This work is licensed under a Creative Commons Attribution 4.0 International License. Read Full License
Activation of Adaptive Immune Cells is an Early Response to Hyperthermic
Intraperitoneal Chemotherapy Treatment in Ovarian Cancer

Tyler J. Alban1*, Max Horowitz2*, Danielle Chau2*, Zahraa Alali3, Emily Esakov3, Goutam Dey3, Changjin
Hong4, Tae Hyun Hwang4,7, Vlad Makarov1, Justin D. Lathia3,7, Peng Qi5, Jennifer S. Yu5,6,7, Chad M.
Michener2,7, Timothy A. Chan1,7, Robert L. DeBernardo2,7, #, Ofer Reizes3,7. #

Affiliations.
1
 Center for Immunotherapy and Precision Immuno-Oncology, Cleveland Clinic Lerner Research
Institute, Cleveland, OH
2
    Department of Gynecologic Oncology, Cleveland Clinic Women’s Health Institute, Cleveland, OH
3
 Department of Cardiovascular and Metabolic Sciences, Cleveland Clinic Lerner Research Institute,
Cleveland, OH
4
Department of Quantitative Health Sciences, Cleveland Clinic Lerner Research Institute, Cleveland,
OH
5
    Department of Radiation Oncology, Cleveland Clinic Taussig Cancer Institute, Cleveland, OH
6
    Department of Cancer Biology, Cleveland Clinic Lerner Research Institute, Cleveland, OH
7
 Case Comprehensive Cancer Center, Case Western Reserve University School of Medicine,
Cleveland, OH

*co-first author
#
    co-senior author

Correspondence should be addressed to:
Ofer Reizes, Ph.D.
Cardiovascular and Metabolic Sciences
Cleveland Clinic Lerner Research Institute
9500 Euclid Ave., NC10
Cleveland, OH 44195

Email: reizeso@ccf.org
Direct: 216-445-0880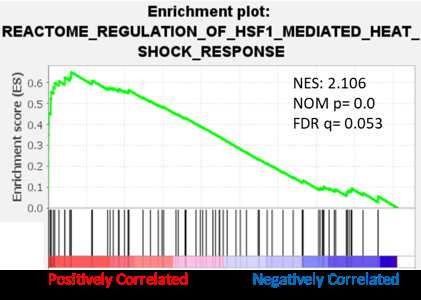
Abstract
Hyperthermic intraperitoneal chemotherapy (HIPEC) has significantly increased the survival of epithelial ovarian

(EOC) patients and is being adopted as a standard clinical approach for managing these tumors. However, while

the clinical results are encouraging, there is a need to understand the cellular and molecular mechanisms

underlying the HIPEC response to develop biomarkers and new therapeutic strategies to extend overall patient

survival. We undertook a comprehensive analysis of HIPEC and hyperthermia in cell culture, mouse MODELS,

and human PATIENTS. Ovarian cancer cell lines and patient-derived xenografts treated with heat and cisplatin

revealed increased cisplatin adducts and DNA damage with limited increase in cisplatin sensitivity. RNA-

sequencing analysis of EOC cells treated with heat and cisplatin for 90 minutes revealed a robust heat shock

response and immune pathway activation, which resolved by 72 hours. The rapid heat shock response in

malignant cells led us to employ an innovative clinical strategy to harvest matched tumor specimen from high

grade serous ovarian cancer patients at time of interval debulking before and immediately after HIPEC to define

the cellular and molecular tumor microenvironment during treatment. In patients treated with HIPEC, single cell

(sc)RNA-sequencing demonstrated a robust increase in heat shock response which was highly increased in sub-

populations of CD8+ T cells, B cells, and dendritic cells and not in tumor cells. Additionally, this analysis identified

rapid increases in MHCI and MHCII levels post treatment, suggesting priming antigen presentation. Using a

mouse model that we developed to study HIPEC treatment, we show hyperthermic cisplatin leads to increased

efficacy compared to normothermic cisplatin treatment and importantly requires an intact immune system. This

supports the (sc)RNA-sequencing findings that heat activation targets immune cells during HIPEC. Our findings

provide the foundation for future studies focused on the immune system to delineate how HIPEC orchestrates

the cellular and molecular response to improve overall patient survival with potential to identify new therapeutic

strategies for further extending survival.
Introduction
Epithelial ovarian cancer (EOC) is the most lethal gynecologic cancer with an average survival of two years. It is

estimated that 21,750 cases of EOC will be diagnosed and that 13,940 patients will die with EOC in the US in

2020. The poor survival is in part due to advanced stage at diagnosis (III-IV), which is observed in 80% of patients

with EOC; (5-year cancer-specific survival 42% and 26%, respectively)1. The mainstay of therapy is “optimal

surgery” leaving minimal residual disease in combination with platinum- and taxane-based chemotherapy. While

most women with advanced disease enter remission, the vast majority of patients will experience disease

recurrence and ultimately develop resistance to platinum-based (as well as non-platinum-based) chemotherapy

and succumb to their disease2. The recent emergence of intravenous (IV) and oral targeted agents (e.g. anti-

angiogenics and PARP inhibitors) has led to improvement in progression free survival (PFS), yet none of these

drugs have impacted overall survival (OS), highlighting the critical clinical need for new therapeutic strategies2.

The most significant improvement in OS for patients with advanced EOC has come from administration of

platinum- and taxane-based chemotherapy directly into the abdominal cavity (IP therapy)3. Despite significant

improvement in PFS and OS with this intervention, and National Comprehensive Cancer Network (NCCN)

recommendations, widespread adoption of IP therapy has been limited by its toxicity and perceived procedural

difficulties in its administration (e.g. need for in-patient administration and catheter-related issues)2. Hyperthermic

intraperitoneal chemotherapy (HIPEC) overcomes many of the issues with conventional IP therapy. HIPEC is

chemotherapy that is heated to 42C and administered into the abdomen once optimal surgical resection of tumor

is completed. In a well-designed randomized controlled trial, the addition of HIPEC at time of interval debulking

surgery in patients with advanced EOC was shown to extend OS by nearly 12 months as compared to patients

receiving identical treatment without HIPEC4. A second randomized controlled trial demonstrated significant

improvement in both PFS and OS in women with ovarian cancer that undergo surgery and HIPEC at recurrence

with patients receiving HIPEC surviving 26.7 months compared to 13.4 months with surgery alone. Interestingly,

patients that have developed resistance to platinum agents when given intravenously respond to HIPEC using

platinum drug with survival outcomes equal to platinum responsive tumors5.

Despite its proven clinical benefit, the mechanism of action of HIPEC remain unclear. Cell-based studies focused

on applying hyperthermia to cultured EOC cells6 provide insights into the molecular pathways activated by heat,

however they fail capture the complexity of the tumor microenvironment, including a functional immune system,
making generalizability to human disease potentially more difficult. Indeed, the immune system has been

proposed to impact HIPEC7 and hyperthermic treatment of CD8 T cells leads to metabolic activation and

therapeutic benefit in a myeloid leukemia model8. The pre-clinical HIPEC models, including mouse and rat focus

on treatment modalities with limited mechanistic insights9, 10. As such, we undertook a systems based strategy

to investigate the underlying mechanisms of HIPEC with a focus on the complex human tumor

microenvironments during treatment6. We analyzed the kinetics of direct heat induction on EOC cells followed

by a comprehensive analysis of patient tumors at the single cell transcriptomic level to provide the first analysis

of EOC tumor landscape during HIPEC treatment. The studies are complemented by our novel in vivo mouse

model that recapitulates the efficacy of HIPEC. We provide direct evidence for the role of select immune cells in

benefit of HIPEC on patient survival.
Results.

Hyperthermic cisplatin treatment of epithelial ovarian cancer cells leads to rapid increase in
cisplatin adducts and DNA damage.
One mechanism for HIPEC treatment efficacy in patients with advanced EOC is the thermal induction

of cisplatin sensitivity. Here, we modeled HIPEC treatment in tissue culture by heating cisplatin-

resistant epithelial ovarian cancer cells (A2780CP) to 42C in presence of varying concentrations of

cisplatin or vehicle. In parallel, we incubated control cells at 37C in presence or absence of cisplatin.

Following heat shock, cells were incubated an additional 72 hours in the presence of varying

concentrations of cisplatin or absence followed by cell proliferation assay (Fig. 1A). There was little to

no significant effect of heat on the efficacy of cisplatin. We further tested the impact of 42C treatment

in four additional EOC lines including OV81, OV81CP, ID8, and ID8-VEGF. Using these models there

was modest impact of heated cisplatin on OV81CP and ID8-VEGF (Supplemental Fig. 1 A-D). To

assess cisplatin adduct formation, EOC cells were treated with cisplatin at 42C or 37C for 90 minutes,

24, 48, and 72 hours (Fig. 1B). At 90 minutes, a 2-fold increase in cisplatin adducts was detected in

42C group compared to 37C, however no difference was observed between 42C and 37C at 24, 48, or

72 hours. We next followed cisplatin adduct formation with an analysis of DNA damage based on

gH2AX expression and nuclear foci formation. A significant increase in gH2AX expression was observed

in cisplatin-treated groups at 72 hours in both 37C and 42C treated A2780CP and mouse EOC ID8 cells

(Fig. 1C). Moreover, cells treated with hyperthermic cisplatin exhibited the greatest increase in gH2AX

expression compared to all other conditions. gH2AX foci formation was significantly increased in cells

treated with vehicle or cisplatin at 37C or 42C (Fig. 1D) and quantified by nuclear fluorescence intensity

(Fig. 1E). To test for transcriptomic changes in EOC cells treated at 42C in presence and absence of

cisplatin, A2780CP cells were treated based on our hyperthermia protocol and harvested at 90 minutes

and 72 hours. RNA was isolated and processed for RNAseq followed by differential expression and

pathway analysis. Within 90 minutes of heat treatment, A2780CP cells exhibited rapid induction of heat

shock response genes, including HSPA6, and pathways compared to normothermic treated cells (Fig.

1F and Supplemental Fig. 1 E, F). Additional pathways activated by hyperthermic cisplatin included
hypoxia, TNFa, and stress pathways (Supplemental Fig. 1F). By 72 hours the heat shock response

was attenuated (Fig. 1G) and only the FGF2 pathway remained significantly induced in the C42 cells

(Supplemental Fig. 1G). Analysis of vehicle-treated cells at 42C compared to 37C revealed a similar

rapid induction of heat shock response in 90 minutes that was attenuated by 72 hours (Supplemental

Fig. 2A, B). Hallmark pathway analysis and gene set enrichment analysis of V42 and C42 treated cells

at 90 minutes indicated induction of DNA repair pathways including p53, and UV response

(Supplemental Fig. 2C, D) that was attenuated by 72 hours (Supplemental Fig. 2E). Notably, C42

compared to V42 did not reveal a significant difference in gene expression at 90 minutes

(Supplemental Fig. 2F), but by 72 hours there was a significant induction of genes/pathways

associated with DNA sensing, p53, and apoptosis (Supplemental Fig. 2G-J). Collectively, our data

reveal induction of heat shock and DNA repair pathways occurs within 90 minutes of heat treatment.

However, activation of these pathways is not sufficient to impact cell survival in cisplatin-naïve or -

resistant EOC.
Fig. 1
A.120 A2780
B.
A2780CP
Proliferation (% veh)
120 80
Proliferation (% veh)
C42 ns
100 42C x 0 min
Cisplatin Adducts
42C x 0 min 100
fmol Pt/µg DNA
C37 ns
80 42C x 90 min 60
42C x 90 min 80
✱
60 60 40 ns
IC50 = 1.1 uM IC50 = 7.9 uM
40 (95% CI 0.9-1.3) 40 (95% CI 6.7-9.3)
IC50 = 1.0 uM 20
20 20 IC50 = 6.5 uM
(95% CI 0.8-1.3) (95% CI 5.5-7.6)
0 0 0
0.01 0.1 1 10 100 1000 0.01 0.1 1 10 100 1000 1.5 24.0 48.0 72.0
Cisplatin (µM) Cisplatin (µM) Hours
C. A2780CP D.
V37 V42 C37 C42 V37 V42 C37 C42
gH2AX
gH2AX
Tubulin
ID8
V37 V42 C37 C42
DAPI
gH2AX
Cyclo B C42 over C37- 90 Minutes
F. 300
DNAJB1 HSPA6
-log10(adjusted p-value)
E. 250
*
HSPA1B
100,000
Cell Fluorescence
80,000 200 FOS
ZFAND2A
HSPA1A
Total
60,000 150
LEAP2
40,000 20 RFPL2
ZRSR2P1
20,000 10 GJA9-MYCBP
0 0
V37 V42 C37 C42 -10 -5 0 5 10 15
Effect Size: log2(fold-change)
G. C42 over C37- 72 Hours H.
300
-log10(adjusted p-value)
250
200
150
FGF1
20
10 RAB3C GJA9-MYCBP
SPCS2P4
0
-10 -5 0 5 10 15
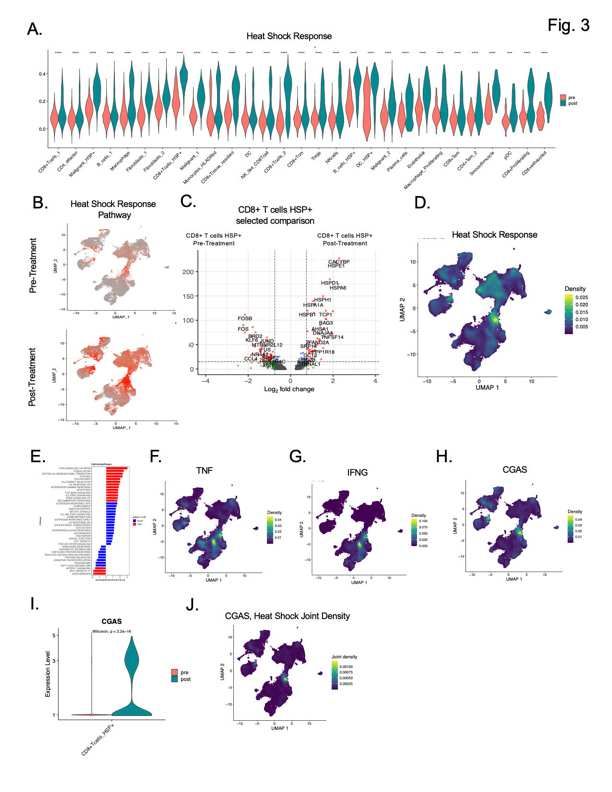
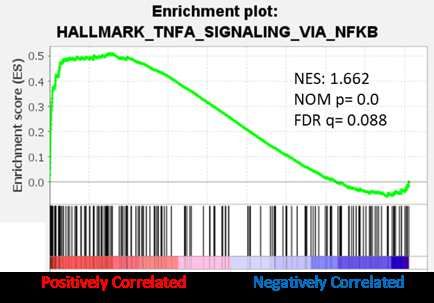
Effect Size: log2(fold-change)Fig. 1. Hyperthermic treatment increases DNA damage and with no effect on cell viability in response to cisplatin in chemo resistant epithelial ovarian cancer cells. A. A2780 and A2780CP were treated for 90 minutes with cisplatin at 42C or 37C followed by 72 hours incubation with cisplatin at 37C. Representative data from an experiment that was repeated 3 times, n = 6 replicates per condition. No statistical significance. B. Cisplatin adduct formation is induced in heat treated A2780CP cells at 90 minutes compared to normothermic control cells. C. gH2AX expression analysis following 72 heat or normothermic treatment in vehicle (V37, V42) and cisplatin (C37, C42) treated A2780CP and ID8 EOC. Representative immunoblot from an experiment repeated 3 times. Tubulin and Cyclophilin B used as loading control. D. gH2AX foci formation at 72 hours in A2780CP EOC cells treated at 42C or 37C for 90 minutes in presence of vehicle (V37, V42) or cisplatin (C37, C42) and foci quantified based on fluorescence/cell. Experiment was repeated at least 3 times. V42 is significantly different from all other groups (* p< 0.0001). F. Volcano plot at 90 minutes comparing 42C plus cisplatin to 37C plus cisplatin in A2780CP cells. G. Volcano plot at 72 hours comparing 42C plus heat to 37C plus heat in A2780CP cells. H. Gene Set Enrichment analysis of RNAseq identifies heat shock and TNFa pathways. Single Cell RNA Sequencing identifies diverse tumor microenvironment in ovarian tumors from the omentum. Patients with advanced EOC receiving neoadjuvant platinum-based chemotherapy and were planned for interval debulking surgery with HIPEC were consented for enrollment in our IRB-approved protocol, in which omental tumors were collected pre- and post-HIPEC and processed for single cell RNA sequencing (schematic, Figure 2A). All patients were diagnosed with high grade serous ovarian cancer underwent surgery at the Cleveland Clinic (Table 1). To date, 2 patients remain in remission, 2 recurred, and 1 is deceased. Standard quality control exclusion was applied, and a total of 69,200 cells from pre and post HIPEC tissues were analyzed. Unbiased cellular clustering resulted in identification of 6 unique clusters, which were consistent among the ten specimens, as visualized based on graph-based Uniform Manifold Approximation and Projection (UMAP) (Figure 2B). We annotated the cell populations that comprised the unique clusters based on the top differential gene expression of established canonical cell markers identifying the general cell types prior to our more detailed identification (see methods section) (Figure 2C, Supplemental Figure 3,4 Supplemental Table 2). The clusters include lymphocytes, B cells, monocytes, fibroblasts, endothelial, and epithelial/malignant cells. RNA-seq analysis of all transcripts indicates increased expression of heat shock pathway post treatment, consistent with the concept of HIPEC treatment (Fig. 2C). Further, gene set enrichment analysis of the log fold change genes between post and pre-treatment identified increased inflammatory pathways in post-treatment samples (Fig. 2D). Analysis of the Heat shock Response Pathway using
the Gene Ontology (GO) Biological processes Response to Heat pathway consisting of 161 curated

genes demonstrated a significant difference between all pre-treatment cells vs. all post-treatment cells

in the study (Fig. 2E).     In seeking to further understand how each cell type within the tumor

microenvironment is altered during HIPEC treatment we subclustered cells based on their RNA

expression and identified 19 unique cell types (Fig. 2F). As expected in the 90-minute window between

matched samples there was little change in the relative abundance pre-to-post treatment (Fig. 2G),

and paired sample statistical analysis did not show any significant changes in population frequencies

(Supplemental Fig. 5).

                 Table 1. HIPEC Patient Demographics and Status

              Patient          A              B               C               D              E
               Age at
                              64              86             61              63             68
              Surgery

                          High Grade      High Grade     High Grade      High Grade     High Grade
            Tumor Type      Serous          Serous         Serous          Serous         Serous
                          Carcinoma       Carcinoma      Carcinoma       Carcinoma      Carcinoma

               Stage          IIIC           IIIB            IIIC            IIIC          IIIC1
             Grade of
                               3              3               3               3              3
              Tumor
              Tumor
                           Omentum        Omentum         Omentum         Omentum        Omentum
             Location

             Ethnicity    Not-Hispanic   Not-Hispanic    Not-Hispanic    Not-Hispanic   Not-Hispanic

                                                                                          African
               Race          White          White           White           White
                                                                                         American

                                            Breast
                                           Cancer
                Co-                         (1982);                                       Stroke;
                          Depression;                                   Hypertension;
            morbidities                    Cardiac          none                       Hypertension;
                          Hypertension                                  Hypothyroidism
            at Surgery                   (Pacemaker-                                    Depression
                                             A-fib);
                                         Hypertension;

                                         Recurrence-     Recurrence-                    Recurrence-
              status       Remission      pelvic and      scans and       Remission      scans and
                                         CA125 rising    CA125 rising                   CA125 rising

            Alive/Dead       Alive           Alive          Alive           Alive          Dead
Fig. 2
scRNA-seq 5 patients with 2
A. B. timepoints each (n=60,990 cells)
10
monocyte epithelial
5
fibroblast
B_cells
UMAP_2
0
Endothelial
−5
lymphocyte
−10
C. Differential expression
D. −10 −5 0
UMAP_1
5 10
Post-Treatment vs. Pre-treatment
halmarkpathways
E.
Pre-Treatment Post-Treatment ALLOGRAFT REJECTION
INTERFERON GAMMA RESPONSE
TNFA SIGNALING VIA NFKB
INFLAMMATORY RESPONSE
IL6 JAK STAT3 SIGNALING
Heatshock Response
IL2 STAT5 SIGNALING
300 ISG15 NUDC CACYBP HSPA6 COMPLEMENT Wilcoxon, p < 2.2e−16
INTERFERON ALPHA RESPONSE
CXCL14 HEME METABOLISM
TFPI2 DNA REPAIR
KRAS SIGNALING UP
CRTAM CCDC80 MITOTIC SPINDLE
NKG7
UV RESPONSE UP
APICAL JUNCTION
0.4
GZMB ANGIOGENESIS
200 RARRES1 P53 PATHWAY
G2M CHECKPOINT
− Log10 P
JUN pvalue < 0.05
Pathway
E2F TARGETS
PLCG2 S100A8 PEROXISOME FALSE
AL627171.2 ANDROGEN RESPONSE TRUE pre
CCL4L2 REACTIVE OXYGEN SPECIES PATHWAY 0.2
CCL3 ESTROGEN RESPONSE EARLY
HYPOXIA
post
GNLY GLYCOLYSIS
MTORC1 SIGNALING
100 SPP1 LYZ ESTROGEN RESPONSE LATE
APOPTOSIS
IER5 CHOLESTEROL HOMEOSTASIS
ADIPOGENESIS
UV RESPONSE DN
0.0
CTSC COAGULATION
UNFOLDED PROTEIN RESPONSE
FATTY ACID METABOLISM
MYC TARGETS V1
0 MYOGENESIS
EPITHELIAL MESENCHYMAL TRANSITION
e
st
XENOBIOTIC METABOLISM pr
−2.5 0.0 2.5
po
−2 −1 0 1 2 3
Normalized Enrichment Score
Log2 fold change Identity
F. G.
29 cell types identified via unsupervised Paired comparison identifies changes in heat
clustering shock positive immune cells post treatment
100
Monocytes_HLADRint
CD8+exhausted
10 CD8+Proliferating
pDC
Macrophage DC Fibroblasts_1 Malignant_1 Smooothmuscle
CD4+Tem_2
Macrophage_Proliferating 80 CD8+Tem
Malignant_2 Macrophage_Proliferating
5 pDC Fibroblasts_2 Endothelial
Malignant_HSP+ Plasma_cells Plasma_cells
DC_HSP+ Malignant_2
CD8+Proliferating DC_HSP+
UMAP_2
60
Percent Total Cells
B_cells_HSP+
B_cells_HSP+ Smooothmuscle NKcells
0 Endothelial Tregs
B_cells_1 CD8+exhausted CD8+Tcm
CD8+Tcells_2
CD8+Tcells_HSP+
NK_like_CD8Tcell
40 DC
CD4+Tem_2 CD8+Tissue_resident CD8+Tissue_resident
−5 CD8+Tcells_2 Monocytes_HLADRint
Malignant_1
CD4_effector
CD8+Tcells_1 CD8+Tcells_HSP+
CD8+Tcm
Fibroblasts_2
Tregs 20 Fibroblasts_1
Macrophage
−10 NK_like_CD8Tcell B_cells_1
CD8+Tem Malignant_HSP+
CD4_effector
CD8+Tcells_1
NKcells
0
pre
post
−10 −5 0 5 10
UMAP_1
Fig. 2. Single Cell RNAseq analysis of pre- and post-HIPEC treated specimen identifies heat
shock responsive immune cells. A. Schematic representation of the flow of tissues collection and
processing for single cell RNA sequencing. A tumor specimen is taken immediately before and after
HIPEC administration (90 minutes) at the time of interval debulking surgery. Specimens are obtained
from the same site (omentum) to reduce variability. Tumor samples are dissociated into a single cellsuspension and followed by scRNA-seq to identify cell types and gene expression profile. B. UMAP representing n=10 samples from n=5 patients with 2 timepoints each, showing the general cell type classifications B. C. Differential gene expression comparing Post-Treatment and Pre-Treatment samples n=5 for each group. D. Hallmark pathway analysis using GSEA (gene set enrichment analysis) and the HALLMARK gene sets based of the differential expression analysis of post vs pre- treatment samples overall. E. Pathway analysis of the Gene Ontology biological process Response to Heat pathway gene set n=161 genes analyzed and scored for each cell from all n=5 samples pre- treatment and n=5 samples post-treatment. F UMAP representing the unsupervised clustering analysis of all n=10 samples with detailed naming based on gene expression. G comparison of the overall percentages of each cell type present for all pre n=5 and all post n=5 treatment samples. HIPEC induces a rapid heat shock response in CD8 T cells. After identification of the heat shock pathway increases, we sought to understand which cell type or types were most responsive to heat. In scoring each of the 29 unique cell types for heat shock response GO pathway pre and post treatment we identified significant increases in all populations (Fig. 3A, Supplemental Fig 6), with the highest signal coming from CD8+ T cells we termed HSP+ (heat shock protein positive). We performed a cell cycle scoring within Seurat V4 and determined the CD8 T cells were in G2/M phases suggesting they are highly proliferative within the tumor microenvironment (Supplemental Fig. 7A). Visualization via UMAP representation shows that while this population exists both pre and post treatment, it is robustly increased post treatment (Supplemental Fig. 3B). Differential expression of the CD8+ T cells HSP+ pre and post treatment demonstrated that the majority of the signal is derived post treatment (Fig. 3C). Density plot analysis of the UMAP further represents the focal intensity of the Heat Shock pathway in these T cells as well as a weak and more general response in the epithelial and fibroblast populations (Fig. 3D). Pathway analysis of the differential expression analysis post vs pre-treatment demonstrated a robust increase in immune activation pathways (Fig. 3E) including TNF alpha (Fig. 3F) and Interferon Gamma (Fig. 3G) signaling, which was further verified as being related to the HSP+ CD8 population. Furthermore, we sought to determine the source of CD8 T cell immune activation by heat and reasoned that one possibility might be that the DNA damage caused by heat, that we observed in vitro, could act to signal CD8 activation through the cGAS/STING pathways. Analysis of CGAS expression demonstrated that the HSP+ CD8 T cells upregulated CGAS expression compared to other cells and upregulated it post treatment (Fig. 3 H, I).
Furthermore, joint density mapping of CGAS expression and Heat shock response pathway

demonstrated a co-expression of the two pathways specifically in the HSP+ CD8 T cell population (Fig.

3J).
Fig. 3. A. Heat shock pathway was scored for each individual cell for the n=5 samples pre-treatment
and n=5 samples post treatment and graphed via violin plots for distribution across all cell types
identified. B. UMAP representation of the sample cells pre and post treatment, colored by their
expression level of the GO biological process response to heat pathway. C. Differential expression
analysis of the n=5 pre and n=5 post treatment CD8+ T cell HSP+ subset. D. Density plot
representing the distribution of cells expressing the GO biological process response to heat pathway.
Hallmark pathway analysis from the differential gene expression of HSP+ CD8 T cells post vs pre-
treatment graphed as NES score on the x-axis and colored by the p-value with red showing p
Fig. 4
A. Subset DC_HSP+ cells
B. DC_HSP+ Differential Expression C. halmarkpathways
Post-Treatment vs Pre-Treatment TNFA SIGNALING VIA NFKB
COAGULATION
INFLAMMATORY RESPONSE
KRAS SIGNALING DN
DC_HSP+ DC_HSP+ MITOTIC SPINDLE
KRAS SIGNALING UP
Pre-Treatment
E nh anced V ol cano Post-Treatment INTERFERON GAMMA RESPONSE
ANDROGEN RESPONSE
60 PROTEIN SECRETION
CHOLESTEROL HOMEOSTASIS
APICAL JUNCTION
INTERFERON ALPHA RESPONSE
10 PI3K AKT MTOR SIGNALING
HSPA6 UV RESPONSE DN
HSPA1B PEROXISOME
IL6 JAK STAT3 SIGNALING
IL2 STAT5 SIGNALING
5 BILE ACID METABOLISM
40 CACYBP G2M CHECKPOINT
ESTROGEN RESPONSE EARLY
HSPB1 pvalue < 0.05
Pathway
HEME METABOLISM
UMAP_2
− Log10 P
Selected Cells FKBP4 DNA REPAIR FALSE
0 ALLOGRAFT REJECTION TRUE
Other TIMP1 TGF BETA SIGNALING
DC_HSP+ UBB COMPLEMENT
CD55 VCAN E2F TARGETS
UV RESPONSE UP
ARL4C STIP1 HYPOXIA
−5 20 KLF6 SNX3 LYZ P53 PATHWAY
FCN1 ANGIOGENESIS
SPP1 SRGN UNFOLDED PROTEIN RESPONSE
NRP2 FUS HLA−DRB1 ESTROGEN RESPONSE LATE
APOPTOSIS
−10 REACTIVE OXYGEN SPECIES PATHWAY
MYOGENESIS
EPITHELIAL MESENCHYMAL TRANSITION
XENOBIOTIC METABOLISM
ADIPOGENESIS
0 FATTY ACID METABOLISM
MTORC1 SIGNALING
−10 −5 0 5 10 MYC TARGETS V1
UMAP_1 −2 0 2 GLYCOLYSIS
OXIDATIVE PHOSPHORYLATION
Log2 fold change −2 −1 0 1 2 3
Normalized Enrichment Score
D. E.
CGAS HLA−A HLA−B
Wilcoxon, p = 1.9e−07 100 Wilcoxon, p = 7.2e−09 Wilcoxon, p < 2.2e−16
100
5
3
Expression Level
Expression Level
Expression Level
pre 10 pre pre
10
post post post
1
1 1
+
SP
+
+
SP
SP
_H
_H
_H
C
C
C
D
D
D
Identity Identity Identity
HLA−C HLA−DRA
Wilcoxon, p < 2.2e−16 Wilcoxon, p < 2.2e−16
30
100
Expression Level
Expression Level
10
pre pre
post post
10
3
1
1
+
SP
+
SP
_H
_H
C
C
D
D
Identity Identity
Fig. 4. cGAS inflammatory pathway is induced in dendritic cells of HIPEC specimen. A.
Representative UMAP showing the cells that were selected for sub-setting the Dendritic Cell
population defined by its heat shock positive protein signature. Differential expression analysis of the
n=5 pre and n=5 post treatment Dendritic Cells HSP+ cell subset. Hallmark pathway analysis from the
differential gene expression of HSP+ Dendritic cells post vs pre-treatment graphed as NES score on
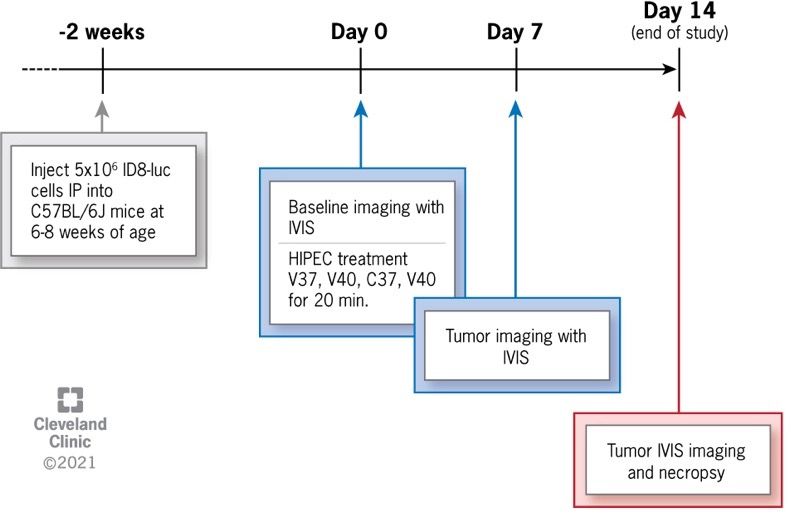
the x-axis and colored by the p-value with red showing pHyperthermic cisplatin administration in an EOC mouse model leads to tumor growth inhibition dependent on immune cells. In seeking to determine the importance of the immune system in HIPEC treatment response, we generated a rapid, medium-throughput mouse model of HIPEC. In this model, an IP injection of cisplatin into tumor-bearing mice is made while applying 40C heat to the abdomen. Heat is maintained for up to 30 minutes. Subsequently, tumor growth is monitored over a 2 week period with weekly injections of cisplatin (Fig. 5A). C57Bl/6J immune competent mice injected with ID8-luc cells were treated with vehicle at normothermic (V37), hyperthermic (V42), and cisplatin at normothermic (C37) or hyperthermic (C40) conditions. Vehicle treated mice exhibited no difference in overall tumor growth (Fig. 5B). In contrast, mice treated with cisplatin exhibited a dose dependent suppression of tumor growth with significantly greater suppression of tumor growth in 40C treated mice (Fig 5B). Our scRNAseq findings point to rapid induction heat shock and inflammatory response in immune cells including CD8+ T cells, B cells, and dendritic cells (DCs). At endpoint, we harvested tumors and processed samples for flow cytometry of immune and myeloid cells. We observed tumor infiltration of CD3+ T cells with a higher proportion of CD8+ T cells within 24 hours in 40C treatment that was significantly higher than 37C treated mice (Fig. 5C). The increase in CD8+ T cells was heat dependent as we did not detect a difference between vehicle (V40) and cisplatin (C40) treated tumors (Fig. 5C). By 2 weeks, tumors from mice treated with hyperthermic cisplatin exhibited greatest infiltration of CD3+, CD4+, CD8+, and regulatory T cells compared to V40, C37, and V37 treated mice (Fig. 5D). This suggests short term (20 min) hyperthermic cisplatin exposure can lead to long term immune response that is maintained with continued cisplatin exposure. In contrast, we did not observe difference in myeloid populations after 24 hour or 2 weeks (Supplemental Fig. 8A, B). These results led us to hypothesize that the immune system is necessary for hyperthermic cisplatin benefit. To test the impact of the immune system, we repeated the study in immune deficient NSG mice. Mice were injected with ID8-luc cells and monitored for tumor growth followed by hyperthermic or normothermic treatment in presence or absence of IP cisplatin. In contrast to immune competent mice, NSG mice exhibited no benefit of hyperthermic treatment on efficacy of cisplatin (Fig. 5E). These findings support the
hypothesis that the efficacy of hyperthermic chemotherapy treatment of peritoneal tumors depends in
part on an intact immune system.
Fig. 5
A.
B. 60 ns
C.
Lymphoid Cells in ID8 Tumors Post 24 Hours HIPEC
60
50 V37
37C ✱
Change in Total Flux (x107)
40C V40
%CD45 + (Gated on
Live Single Cells)
(photons/second)
C37
40 40
C40
✱
✱
30
20
✱
20 ✱
0
ls
ls
ls
ls
ls
10
el
el
el
el
el
C
C
C
C
C
T
.1
T
T
T
K1
y
3+
4+
8+
or
D
D
D
N
at
C
C
C
ul
0
eg
R
0 0.05 5
Cisplatin (mg/kg)
D. E. 60
Lymphoid Cells in ID8 Tumors Post 2 Weeks HIPEC ns
50 37C
60
Change in Total Flux (x107)
40C
V37
(photons/second)
V40 40
%CD45 + (Gated on
C37
Live Single Cells)
40 ✱
C40
✱✱
30
✱
20 ✱ ns
✱ ✱✱ 20
✱ ✱
✱✱
ns
10
0
ls
ls
ls
ls
lls
el
el
el
el
ce
C
C
C
C
0
.1
T
T
T
T
K1
y
3+
4+
8+
0 1 3
or
N
D
D
D
at
C
C
C
ul
Cisplatin (mg/kg)
eg
RFigure 5. Treatment of mouse epithelial ovarian cancer with heated cisplatin leads to increased efficacy in immune competent but not in immune deficient mice. A. Detailed schematic of animal HIPEC protocol. ID8-luc, a EOC mouse line, is inoculated into immune competent C57BL/6 or immune deficient NSG mice intraperitoneally. Tumor establishment and growth is confirmed using In Vivo Imaging System (IVIS) optical spectrum. Varying concentrations of cisplatin is injected and superficial hyperthermia at 40C or normothermia (37C) is applied using an FDA approved hyperthermia unit (BSD500) for 20 minutes. IVIS assessment is performed weekly thereafter to monitor tumor size and growth following the treatment. B. Effect of hyperthermic cisplatin treatment of murine EOC model in immune competent C57Bl/6J mice. Tumor bearing C57Bl/6J mice are treated for 20 minutes with no heat (37C) plus varying concentrations of cisplatin (0, 0.05, 5 mg/kg) or heat (40C) plus varying concentrations of cisplatin (0, 0.05, 5 mg/kg). Change in tumor growth relative to normothermic controls is shown. Representative data from experiments replicated 3 times. (n = 6/condition, * p < 0.05). C. Lymphoid and myeloid population analysis two weeks post normothermic and hyperthermic cisplatin treatment. Lymphoid populations are enriched in ID8 tumors following HIPEC treatment. C. 24 hours following HIPEC therapy, CD3, CD4, and CD8 T Cells were enriched in tumors treated with heat and cisplatin (C40) compared to cisplatin treatment alone (C37). D. 2 weeks following HIPEC therapy CD3, CD4, Regulatory, CD8, T cells were enriched in tumors treated with heat and cisplatin (C40) compared to cisplatin treatment alone (C37) and compared to heat alone (V40). n=5 mice per group *p
Discussion.
Cell culture studies reveal rapid induction of DNA damage pathways but limited insights on

patient outcomes. Our findings highlight the limitation in elucidating the mechanisms of hyperthermia

and cisplatin in an isolated system such as a cell culture system. We show a rapid induction of heat

shock response within 90 minutes as well as cisplatin increase in DNA damage. The increase in

cisplatin adduct formation within 90 minutes of heat treatment is consistent with studies indicating

hyperthermia enhances chemotherapy absorption11, 12. Despite the increase in DNA damage, we found

limited impact on cell viability and modest improvement in sensitization to cisplatin in EOC cells. These

findings are consistent with studies on impact of hyperthermia on cancer cell behaviors13. Single-cell

RNAseq analysis provided key insights on the rapid, within 90 minutes, induction of heat shock

response. Indeed, induction of heat shock pathways is observed in other systems with similar kinetics.

The ability to detect heat shock response within 90 minutes provided rationale and feasibility to examine

the impact of hyperthermia in clinical tumor specimen.

scRNAseq identifies landscape of ovarian cancers in the omentum. Human EOC tumors are

heterogeneous, containing diverse cellular populations (e.g. differentiated tumor cells, fibroblasts,

inflammatory cells, endothelial cells, cancer stem cells (CSCs)) in a highly dynamic microenvironment

that regulates tumor growth14. Our single cell RNAseq analysis focused on omental tumor tissue before

and after HIPEC to reduce sample to sample variability. We opted not to perform bulk RNA-seq as

gene expression changes are lost as RNA is extracted en masse from the tumor and changes in gene

expression over-represent the most abundant cell types15. In contrast, scRNA-seq allows for

measurement of gene expression changes within all identified cell types within a heterogeneous

tumor16. With this strategy, we identified the major populations including epithelial ovarian cancer cells,

cancer-associated fibroblasts, stromal cells, and multiple immune cell populations17. In this regard

scRNA-seq is ideally suited to analyze HIPEC-induced gene expression within a complex tumor

microenvironment To our knowledge, this approach has never been applied to the study solid tumors

in humans18.
The studies are unprecedented allowing us to identify the cells at various stages of the cell cycle and

we determined that regardless of treatment the lymphocytes are highly proliferative within the tumor.

By analyzing primary patient tumors pre- and immediately post-HIPEC, we identified the immune cell

populations are most sensitive to heated cisplatin treatment in the tumors.

HIPEC treatment activates primarily B-, T-, and antigen presenting dendritic cells. HIPEC

mechanism of action is poorly defined and here we identify rapid activation of the immune system. We

define the tumor microenvironment in the omentum and identify the major cells that comprise the tumor

allowing us to define the cellular and molecular heterogeneity. Analysis of heat shock response

pathways within the cellular populations indicates that a subset of cells is responsive to hyperthermia19.

It is striking that the malignant epithelial cells are not the cells most heat responsive. The heat

responsive populations were a subset of CD8+ T cells, B cells, and dendritic cells. The evidence for a

role of the adaptive immune response is complemented by our mouse findings indicating an intact

immune system is necessary for efficacy in a mouse model of HIPEC. This is a particularly important

finding as there is a growing understanding that hyperthermia enhances immune response via multiple

mechanisms including disruption of immune suppression20. Our studies advance these findings and

potentially lead to HIPEC treatment in combination with immunotherapy.

Mouse model provides pre-clinical proof of concept for essential role of immune system. Studies

on HIPEC animal models provide a paradigm for exploring the impact of hyperthermia and cisplatin on

the tumor microenvironment with potential for application of related agents9, 10. This provides much

needed strategy to bridge the gap between in vitro work exploring HIPEC mechanism and the limitations

of working with patient tumor within the context of standardized HIPEC therapy. The development of

this noninvasive paradigm in mice provides us an opportunity to test treatment strategies for patients

with advanced EOC and provide a basis for targeted drug design and development of cancer

therapeutics.

We determined that hyperthermic cisplatin treatment of immune-competent mice injected with murine

epithelial ovarian cancer exhibit significant attenuation of tumor growth compared to normothermic
cisplatin treatment. This model provides an opportunity to address questions that can be applied to the

clinic. For example, what is the relative contribution of heat and cisplatin? Our findings indicate that

heat alone is not sufficient for the survival benefit, rather it is the combination with cisplatin. Our data

provide pre-clinical insight to this question and demonstrates that, in fact, hyperthermia augments the

tumorstatic effects of cisplatin and hyperthermia alone has no impact on tumor growth.

HIPEC link to cGAS-STING and antitumor activity. Our single cell RNAseq findings that the cytosolic

DNA sensor, cGAS, is induced in heat shock induced CD8+ T, B, and dendritic immune cells provides

new insights on the interplay between DNA damage pathways and activation of antitumor immunity.

cGAS is a cytosolic DNA sensor that activates Stimulator of Interferon Genes (STING) with downstream

activation of interferon and inflammatory pathways21. Thus, cGAS-STING signaling has emerged as a

pathway for pharmaceutical intervention22, 23. These findings complement the literature and identify a

new mechanism to activate antitumor activity via hyperthermia treatment in combination with activation

of DNA damage. Importantly, there are multiple therapeutic modalities that could provide enhanced

response including DNA damage agents (e.g. PARP, ATM, Checkpoint kinase, Topoisomerase, DNA

crosslinking) as well as anti-metabolite and microtubule targeting pharmaceuticals21. Checkpoint

kinase, Topoisomerase, DNA crosslinking) as well as anti-metabolite and microtubule targeting

pharmaceuticals21. Cisplatin and paclitaxel (a microtubule – stabilizing agent) have shown efficacy in

combination with hyperthermia in patients in retrospective analyses (DeBernardo, R., personal

communication).

Identification of novel therapeutic strategies and understanding their mechanism of action is a priority

for EOC. Here, we undertook a comprehensive strategy to interrogate the underlying mechanism of

HIPEC with a focus on clinical specimens obtained pre- and post-treatment and identified a primary

mechanism of HIPEC to be activation of CD8 T cells. These new insights may indicate utility in

combination immunotherapeutic approaches in EOC, using hypothermic treatment alongside longer-

term immune activating approaches such as immune checkpoint inhibitors. During these investigations

we also developed and utilized a novel noninvasive murine model to investigate the impact of
hyperthermic cisplatin in vivo. The development of this noninvasive paradigm in mice provided us the

opportunity to study the immunologic impacts of HIPEC and will allow for future development of

therapeutics.
Acknowledgements.
We gratefully appreciate the insights from the Reizes and Lathia laboratories. The studies were

facilitated by shared lab resources at the Lerner Research Institute including the digital imaging

microscopy, flow cytometry, genomics, and small animal imaging. These studies were supported by

the VeloSano Bike to Cure, Cleveland Clinic Center of Excellence in Gynecologic Cancer, and The

Laura J. Fogarty Endowed Chair in Uterine Cancer Research. We would like to thank Dr. John J, Turchi

and Pamela S. VanderVere-Carozza, in the Departments of Medicine and Biochemistry& Molecular

Biology, Indiana University School of Medicine for the cisplatin adduct analysis in A2780CP cells. This

work utilized the Leica SP8 confocal microscope that was purchased with funding from National

Institutes of Health SIG grant 1S10OD019972-01 and the PerkinElmer IVIS Spectrum CT In Vivo

Imager that was purchased with funding from National Institutes of Health SIG grant 1S10OD018205-

01A1.

Author contributions

TJA supported the scRNAseq analysis and wrote sections of the manuscript
MH performed all the in vitro studies and critically reviewed the manuscript
DC performed the mouse studies and critically reviewed the manuscript
ZA developed the mouse hyperthermia model and critically reviewed the manuscript
EE performed the bioinformatics analysis, developed the immune profiling panels, and wrote parts of
the manuscript
GD assisted in the cisplatin in vitro analysis and critically reviewed the manuscript
CH analyzed the sequencing data from in vitro and scRNAseq studies
THH analyzed the sequencing data from in vitro and scRNAseq studies
VK developed scRNAseq algorithms for human studies
JDL provided insights throughout the development of the studies from initial in vitro studies through
mouse studies and critically reviewed the manuscript
PQ assisted in development of mouse hyperthermia model
JSY provided insights on development of mouse hyperthermia model and critically reviewed the
manuscript
CMM provided surgical specimen, critically reviewed the specimen collection strategy, and reviewed
the manuscript
TAC assisted in immune analysis of scRNAseq data and critically reviewed the manuscript
RLD conceived the surgical strategy for specimen collection of scRNAseq, wrote parts of manuscript,
and critically reviewed manuscript
OR conceived, organized, and wrote the manuscript
Competing interests

Authors report no conflicts of interests.
Methods
Materials and Reagents.
A2780, A2780CP, OV81, OV81CP (human), ID8, and ID8-VEGF (syngeneic) EOC cell lines were
cultured in Dulbecco Modified Eagle Medium (DMEM) media containing heat inactivated 10% FBS
(Atlas Biologicals Cat # F-0500-D, Lot F31E18D1) and grown under standard conditions. All cell lines
were checked routinely to ensure mycoplasma free conditions.

In vitro Cisplatin Sensitivity Studies.
Cells were plated at 1,000 cells per well (96-well plate) and treated with either cisplatin (0.1, 0.3, 1, 3,

10, 30 µM; Spectrum Chemical) or vehicle (normal saline) at either 370C or 420C for 90 minutes. Cells

were then transferred to 37C for an additional 72 hours. Cell viability was measured using Cell Titer

Glo (Promega). n = 6/condition, data analyzed using PRISM 9.0.

Cisplatin adduct analysis
A2780CP cells were treated with hyperthermia and cisplatin. After treatment, cells were frozen in

freezing media until DNA extraction. DNA was extracted from cells by lysis and spooling as previously

described24, a modified protocol based on Laird et al, 199125. Briefly, cells were pelleted and washed

once with PBS. Cells were resuspended in lysis buffer and incubated overnight at 37 degrees C. After

lysis, an equal volume of isopropanol was added, and DNA was spooled onto a closed Pasteur pipet.

DNA was washed with 70% EtOH and resuspended in water. DNA (30 μg) was hydrolyzed overnight

in 1% nitric acid at 70°C in a 200-μl total volume. Samples were analyzed by inductively coupled

plasma-mass spectrometry (ICP-MS) at Keystone Bioanalytical North Wells, PA).

Western Blot Analysis
Immunoblot experiments were performed based on our established methods26. Briefly, cells were

grown in 100 mm dishes and treated with vehicle or cisplatin, placed in 37°C or 42°C incubator for 90

minutes then incubated for 72 hours at 37°C. Following treatment, cells were washed with cold D-PBS

and lysed in NP-40 lysis buffer (Invitrogen, USA) containing 250 mM NaCl, 50 mM Tris, pH 7.4, 50 mM

NaF, 1 mM Na3VO4, 5 mM EDTA, 1% Nonidet™ P40 (NP40), and 0.02% NaN3. PMSF and protease

inhibitor cocktails (Sigma, USA) were added freshly. During lysis, samples were vortexed occasionally

and maintained on ice for one hour. Samples were harvested and centrifuged at 10,000 rpm for 10 min
at 4°C. After centrifugation, clarified protein lysates were collected and protein concentrations

determined using BCA kit (Thermo Scientific, USA). β-mercapto ethanol containing 6×Laemmli dye was

added to the lysates, samples were then boiled for 6 min, and resolved on SDS-PAGE (Bio-Rad, USA).

After gel electrophoresis, proteins were immobilized onto PVDF membranes (Millipore, USA) by wet

transfer method overnight at 4°C. Membranes were blocked in blocking buffer containing 5% bovine

serum albumin in TBST (Tris-buffered saline containing 0.1% tween 20) for 1 hr at room temperature.

Membranes were incubated in primary antibodies, gH2AX. (1:1000, Cell signaling, USA) and GAPDH

(1:6000, Proteintech, USA) overnight at 4°C, followed by three washes with TBST, and incubated with

secondary antibodies for one hour at RT. After a final 3 washes in TBST, membranes were incubated

in chemiluminescence solution (PerkinElmer, USA) and images were captured by GE Amersham

Imager 600 system (GE Healthcare, USA).

Immunofluorescence Staining.
To visualize gH2AX foci, cells were processed based established methods with few modifications27.

Briefly, cells were grown on glass coverslips in 6-well plates and following treatment, were washed

once with D-PBS. Cells were fixed in 4% paraformaldehyde (Electron Microscopy Sciences, USA) in

D-PBS for 10 minutes at room temperature. Following fixation, cells were washed two times with D-

PBS and incubated in 0.01% triton X-100 solution for 5 min. Cells were then washed and blocked with

buffer containing 2% Goat serum (Thermo Scientific, USA) and 3% BSA (GoldBio, USA) in TBST (Tris-

buffered saline containing 0.1% tween 20) followed by incubation with anti-gH2AX antibody (Phospho-

Histone H2A.X, Ser139, Cell signaling, USA) overnight at 4C. Cells were washed with TBST four times

and incubated with Alexa Fluor 568 conjugated secondary antibody (Invitrogen, USA) for one hour at

room temperature and washed with TBST for three times. Coverslips were mounted on glass slides

using Vectashield mounting media containing DAPI (Vector Lab, USA). Images were captured by

confocal Leica Microscope in oil emersion. Image J software was utilized for foci counting.

RNA Isolation and Sequencing.
Following RNA isolation, cDNA libraries were prepared by the LRI Genomics Core facility and sent to

Macrogen Inc. for RNA sequencing. Differential Gene Expression Analysis from RNA-Seq Data was

performed as follows:

An average of 60.6 M paired-end reads in 150bp sequenced from 24 samples. After either Illumina

universal adapters or lower quality bases at the 3-prime end are trimmed (cutadapt 1.1628, the average

read length is shortened to 137bp. The quality-controlled RNA-seq reads are converted to

transcriptome abundant matrix in the format of TPM (Transcripts Per Kilobase Million29)

via Salmon v0.14.130 with 'libType=A' and all others remain in a default setting. The Salmon reference

genome sequence index is built on a reference (GRCm38.p01) with a gene model (human GENCODE

v.29) covering a total of 205,870 transcripts. The differential gene expression analysis is conducted

with DESeq2 v1.22.231 where size factor and dispersion estimation were performed with default

settings. In total, 8 DEG analyses are performed between two sample groups (i.e., C37-72h vs. C42-

72h, V37-72h vs. C37-72h, V37-90 vs. C37-90, V42-72h vs. C42-72h, C37-90 vs C42-90, V37-72h vs.

V42-72h, V37-90 vs. V42-90, and V42-90 vs. C42-90) and all DEG with FDR (false discovery rate via

Benjamini and Hochberg multiple testing adjustment) < 0.05.

GSEA Analysis.
We initially applied GSEA (utilizing GSEA software, a joint project of UC San Diego and Broad Institute)

to the following gene set comparisons: V42 over V37, C42 over C37, and C42 over V42 treated CP70

cells (Chip platform:Human_ENSEMBL_Gene_ID_MSigDB.v7.4.chip ), to summarize well-defined

biological conditions of the original founder sets. The h.all.v7.4.symbols.gmt (Hallmark),

c2.cp.biocarta.v7.4.symbols.gmt      (BioCarta),    c2.cp.kegg.v7.4.symbols.gmt       (KEGG),       and

c2.cp.reactome.v7.4.symbols.gmt (Reactome) datasets were obtained from the GSEA website MsigDB

database. Enrichment analysis was performed by default weighted enrichment statistics, with the

random combinatorial count set as 1,000 and the exclusion of gene sets with size larger than 500 and

smaller than 15 genes. For interpretation, a p value of < 1% and a false discovery rate (FDR) q value
of ≤ 25% was considered significant. The Enrichment Scores (ES) were adjusted for variation in gene

set size then represented by normalized enrichment scores (NES).

Mouse studies.
All studies were performed under an approved Institutional Animal Care and Use Committee (IACUC)

protocol. Mouse epithelial ovarian cancer expressing luciferase (ID8-luc) were generated in the lab as

previously described32. ID8-luc were cultured in in Dulbecco Modified 345 Eagle Medium (DMEM)

media containing heat inactivated 5% FBS (Atlas Biologicals Cat # F-0500-D, 346 Lot F31E18D1) and

grown under standard conditions. 6-8 week old female C57BL/6J mice and NSG (NOD-scid) mice from

The Jackson Laboratory (Bar Harbor, ME) were injected intraperitoneally with 5x10⁶ ID8-luc cells. Once

engrafted, mice were randomized into treatment groups.

Hyperthermia and chemotherapy administration.
To apply heat, mice were anesthetized with isoflurane for immobilization. Mice then received an

intraperitoneal injection of either PBS (vehicle) or cisplatin (1, 3 mg/kg). Hyperthermia was delivered

using the FDA- approved BSD500 instrument (Pyrexar). The peritoneal cavity was heated to 40oC for

20 minutes using a single microwave antenna (915 MHz) affixed under the abdominopelvic region of

each mouse. Abdominal temperature was measured with individual thermistor sensors for each mouse.

Mice were then placed prone on a circulating water bolus set at 40oC to optimize heating the

abdominopelvic region specifically and to minimize the risk of thermal burn. Mice were monitored for

signs of hyperventilation or stress.

In vivo imaging.
Two weeks after cell inoculation, mice were injected with D-luciferin intraperitoneally (Goldbio LUCK-

1G, 150mg/kg in 200mL) and anesthetized with inhaled isoflurane. After 5 minutes, mice were placed

in IVIS Lumina (PerkinElmer) system to obtain bioluminescence images. The analysis of the images

was done using Living Image Software, and the intensity of the signal (total flux) was recorded. This

process was repeated weekly until endpoint.

Ethical approval and specimen collection- This study was approved by the Institutional Review

Board (IRB) of Cleveland Clinic. Five female patients with high grade serous carcinoma were recruited

and consented (Median age of 64) (Table 1). Tumor specimen was harvested at the time of interval
debulking surgery and immediately after HIPEC administration (90 minutes). Specimens were obtained

from the same site (omentum) to ensure for similar tumor microenvironment.

Tumor Dissociation- A total of ten tumor specimens were dissociated into a single cell suspension

using a Papain Dissociation System (The Worthington Papain Dissociation System, kit# LK003153)

according to the manufacturer’s protocol. A single cell suspension of each sample is then stored frozen

at -80 C. Prior to sc-RNA sequencing, dissociated samples were thawed in 37C (water bath),

centrifuged, and suspended in 10% FBS containing DMEM media.

Single cell RNA-sequencing analysis- scRNA-seq libraries were generated utilizing the Chromium

Single Cell 3’ V3 Kit (10X genomics) according to manufacture instruction. Following library preparation,

sequencing was performed using Illumina (NovaSeq6000), and the raw data generated was aligned to

GRCh38-3.0.0 using CellRanger 3.1.0. Sequencing depth and cellranger outputs were recorded and

included (supplemental table 1). Post data alignment Seurat Version 4 in R version 4.0.1 was used for

all downstream analysis and data integration. For each cell, the percentage of mitochondrial and

ribosomal genes were calculated and then SCTtransform function was utilized to normalize the data

and regress out the percent mitochondrial and percent ribosomal genes. Next, cells with more than

6000 features of RNA and less then 300 features of RNA were removed along with those cells which

had greater than 30 percent mitochondrial gene content. Post removal of debris, Ribosomal, and

Mitochondiral genes were removed prior to normalization with Seurat SCTransform normalization and

rpca reduction. Using SCT counts a UMAP was then generated for all samples with overlapping

identities based on biological differences. Clusters were subsequently manually identified using top
                                                                            33
markers of previously published datasets on single cell ovarian cancer           additionally top markers of
                                   34
cell populations were used along        with expert immunologist verification of population identify using

known gene expression of Myeloid, T-cell, and Epithelial cell markers and their expression or lack of

expression on clusters (Supplemental figure 3). When more than one population was present with no

obvious or known identifiers, which would constitute this population as a subset, these populations

were generically termed with ana underscore and a unique number. The abundance of each population
was recorded as a percentage of total cells in the sample and then compared in the overall pre vs post analysis. These studies used a paired T-Test with Wilcoxon identifying no significant differences in the abundance of cell populations. Density and Joint Density is graphed using Nebulosa R package and volcano plots produced using EnhancedVolcano R package. Gene and Pathway Enrichment Analysis-Differential gene expression was performed using Seurat comparing all pre-treatment (n=5) vs all post-treatment (n=5) samples with the raw RNA counts with a log fold change threshold of 1. For sub analyses, the data was subset based on cell identity of interest and then compared pre-treatment vs post-treatment for all samples. Output from this differential expression analysis was then used for Volcano plots using (Enhanced Volcano version 3.11 in R version 4.0). The data output from differential gene expression were then used for Gene Set Enrichment Analysis (GSEA) with the c7.al.v7.1 Hallmark geneset. GSEA was performed by clusterProfiler version 3.11 with the differential gene expression list ordered by adjusted P values and Average Fold Change prior to input and a cutoff p-value of 1. NES and -log10 p value were then graphed to represent the pathways that are increased post treatment (Red) and those pathways that were higher pre-treatment (Blue). Flow Cytometry Upon murine necropsy, single cell dissociated tumor samples were stored in freeze media (10% DMSO in FBS, Atlas Biologicals) at –80C. All single cells suspensions were thawed on ice, washed once with 2%BSA in PBS and stained with live/dead Blue Viability dye (Invitrogen) and then blocked in FACS buffer (PBS, 2% BSA) containing FcR blocking reagent at 1:50 (Miltenyi Biotec) for 15 minutes. Subsequently, cells were incubated with antibodies at 1:100 dilution for 20 minutes before being washed and suspended in FACS buffer for analysis. Cell populations were analyzed using a Cytek TM Aurora (CytekBio), and following un-mixing, populations were separated and quantified using FlowJo software (Tree Star Inc.). Gating methods for myeloid and lymphoid populations were performed following standardized gating strategies previously described35, 36. For a complete gating strategy please see Supplemental Figure 8.
You can also read