Fuel Cells for Auxiliary Power in Trucks: Requirements, Benefits, and Marketability - ITS Publications
←
→
Page content transcription
If your browser does not render page correctly, please read the page content below
Fuel Cells for Auxiliary Power in Trucks:
Requirements, Benefits, and Marketability

              UCD-ITS-RR-03-04

                     July 2003

                 Nicholas Lutsey

          Institute of Transportation Studies
                  One Shields Avenue
                University of California
                Davis, California 95616
        Tel: 530-752-0247 Fax: 530-752-6572
              http://www.its.ucdavis.edu/
         email: itspublications@ucdavis.edu
Fuel Cells for Auxiliary Power in Trucks:
Requirements, Benefits, and Marketability
By
NICHOLAS PAUL LUTSEY
B.S. (Cornell University) 2001
THESIS
Submitted in partial satisfaction of the requirements for the degree of
MASTER OF SCIENCE
In
Transportation Technology and Policy
In the
OFFICE OF GRADUATE STUDIES
of the
UNIVERSITY OF CALIFORNIA
DAVIS
Approved:
______________________________________________
______________________________________________
______________________________________________
Committee in Charge
2003
iACKNOWLEDGMENTS
I am grateful to colleagues John Wallace, whose genius produced the majority of the
MATLAB/Simulink programming used herein, and David Grupp, who has kept us all
honest in our research. Drs. C.J. Brodrick, Daniel Sperling, and Harry A. Dwyer have all
been fantastic mentors throughout my time at ITS-Davis.
iiABSTRACT
Public agencies and the trucking industry have recognized the idling of heavy-duty trucks
as a considerable problem. Several potential technical solutions are in development,
including the utilization of auxiliary power units (APUs). Using fuel cell APUs could be
a promising alternative to idling with substantial fuel consumption, emissions, cost, and
noise benefits, while serving as a niche for relatively early fuel cell technology market
introduction. This paper, using a probabilistic Monte Carlo framework, reports on efforts
to characterize existing data on idling trucks, develop an ADVISOR-based vehicle APU
model that accurately depicts how utilizing fuel cell APUs to replace heavy-duty truck
idling could be implemented, quantify energy consumption reductions, and analyze the
economic benefits of the APU. The analysis shows that if fuel cell research targets for
APUs are met over the next decade, a market in the tens of thousands of units may be
possible in the line-haul trucking industry, and substantial diesel consumption reductions
would result.
iiiTable of Contents
LIST OF TABLES AND FIGURES ........................................................................................................... v
ABBREVIATIONS AND ACRONYMS.................................................................................................... vi
INTRODUCTION ........................................................................................................................................ 1
Context of the Problem.............................................................................................................................. 1
Objectives .................................................................................................................................................. 1
BACKGROUND........................................................................................................................................... 2
RESEARCH METHOD............................................................................................................................... 3
Overview ................................................................................................................................................... 3
Establishment of Vehicle Duty Cycles ...................................................................................................... 6
Pilot Survey........................................................................................................................................... 6
Driving vs. Stationary Engine Run-time ............................................................................................... 6
Accessory Power Cycle for Stationary Truck ....................................................................................... 8
Engine Speed at Idle ........................................................................................................................... 13
Model Development ................................................................................................................................ 14
Vehicle Duty Cycles ............................................................................................................................ 14
Calibration of Engine Data Maps....................................................................................................... 15
Creation of APU module and control strategy.................................................................................... 18
Fuel cell performance map ................................................................................................................. 19
APU Sizing.......................................................................................................................................... 20
Net Present Value .................................................................................................................................... 21
RESULTS.................................................................................................................................................... 23
Baseline Scenario..................................................................................................................................... 23
Fuel Cell APU Scenario........................................................................................................................... 24
Potential Diesel Savings .......................................................................................................................... 25
Total Diesel Reduction ............................................................................................................................ 27
Payback Period for SOFC APU............................................................................................................... 27
SOFC Cost............................................................................................................................................... 29
CONCLUSIONS......................................................................................................................................... 30
REFERENCES ........................................................................................................................................... 32
APPENDIX A: 2002 pilot survey .............................................................................................................. 36
APPENDIX B: ADVISOR Electrical System Features........................................................................... 37
APPENDIX C: Idling Emissions Data...................................................................................................... 39
APPENDIX D Solid Oxide Fuel Cell (SOFC) Characteristics and Assumptions ................................. 42
APPENDIX E Diesel Fuel Price ................................................................................................................ 45
ivLIST OF TABLES AND FIGURES
TABLES:
Table 1 Idling Estimates for Heavy Duty Trucks from Available Studies .............................................. 7
Table 2 Accessories in Truck Cabins, Reported in Two Pilot Surveys .................................................. 10
Table 3 Estimations for Key Characteristics for Average Truck Idling................................................ 11
Table 4 Summary of Statistical Characteristics for Model Inputs (n=1000)......................................... 14
Table 5 Idling Emissions Testing .............................................................................................................. 18
Table 6 Summary of Key Variables for NPV Analysis ........................................................................... 23
Table 7 Summary of Baseline Idling Characteristics .............................................................................. 24
Table 8 Summary of APU Characteristics Over Stationary Truck Accessory Cycle........................... 25
FIGURES:
Figure 1 Schematic Representation of Overview of this Report .............................................................. 5
Figure 2 Distribution of Runs Generated for Monte Carlo Simulation for Daily Idling Duration
(hrs/day)............................................................................................................................................... 8
Figure 3 Systems Diagram for Idling and APU Subsystems Each Providing Same Cabin Services..... 9
Figure 4 Distribution of Runs Generated for Monte Carlo Simulation for Average Accessory Power
Load (kW).......................................................................................................................................... 12
Figure 5 Estimated Accessory Power Profiles for Idling Scenario (Electrical and Mechanical) and
APU Electric Load over Duration of Stationary Period................................................................ 13
Figure 6 Distribution of Runs Generated for Monte Carlo Simulation for Engine Idle Speed (rpm) 13
Figure 7 Engine Fuel Maps - Before and After Extrapolating for Missing Data.................................. 15
Figure 8 Estimated Fuel Consumption with Varying Engine Speed (rpm) and Accessory Loading
(bhp) (TMC, 1995) ............................................................................................................................ 16
Figure 9 Fuel Consumption at Idle: ADVISOR Results with Empirical Data (fitted to linear
regression lines)................................................................................................................................. 17
Figure 10 Fuel Efficiency Curves for SOFC Systems of 1 -9 kW Peak Power (Stratanova, 2002)...... 20
Figure 11 Distribution of Idling Fuel Consumption from ADVISOR Output ...................................... 23
Figure 12 Distributions of Diesel Consumption at Idle, in Annual Gallons per Truck and as
Percentage of Total Fuel................................................................................................................... 24
Figure 13 Distributions of FC APU Fuel Consumption and Stack Efficiency Over Transient
Accessory Cycle from ADVISOR Output....................................................................................... 25
Figure 14 Distribution of Potential Fuel Consumption Reduction for SOFC APU in lieu of Idling
Engine, as Percent of Idled Fuel ...................................................................................................... 26
Figure 15 Distribution of Potential Fuel Consumption Reduction for SOFC APU in lieu of Idling
Engine, in Annual Diesel Gallons Saved ......................................................................................... 26
Figure 16 Estimates for Total Potential Idled Diesel Reduction Due to Percentage of Trucks
Equipped with SOFC APUs, Indexed by Diesel Savings per Truck............................................. 27
Figure 17 Estimates for Cumulative Percent (and Number) of Line-Haul Trucks with Given Payback
Period ................................................................................................................................................. 28
Figure 18 Estimates for Total Potential Idled Diesel Reduction Due to Percentage of Trucks
Equipped with SOFC APUs, Indexed by Payback Period ............................................................ 29
Figure 19 Estimation of Number of Line-Haul Trucks With Two-Year (or less) Payback Periods, as
Function of Fuel Cell APU Cost With Varying Economic Assumptions...................................... 30
vABBREVIATIONS AND ACRONYMS
AC: Alternating current
A/C: Air conditioning
ADVISOR: ADvanced VehIcle SimulatOR modeling software
APU: Auxiliary power unit
ARB-HDETL: California Air Resources Board’s Heavy Duty Emissions Testing
Laboratory
ATA: American Trucking Associations
ATL: Automotive Testing Laboratories, Inc
CARB: California Air Resources Board
CaTTS: California Truck Testing S****
CSM-CIFER: Colorado School of Mines – Colorado Institute for Fuel and Emissions
Research
DC: Direct current
DOE: U.S. Department of Energy
EIA: Energy Information Administration
EnvCanada: Environment Canada, Inc
hp: horsepower
ITS-Davis: Institute of Transportation Studies, University of California, Davis
kW: kilowatt
NEDPG: National Energy Policy Development Group
NPV: Net present value
NREL: National Renewable Energy Laboratory
PEMFC: Proton exchange membrane (or polymer electrolyte membrane) fuel cell
RPM: Revolutions per minute
SAE: Society for Automotive Engineers
SOFC: Solid oxide fuel cell
SwRI: Southwest Research Institute
TAC: Texas Administrative Code
TMC: Technology & Maintenance Council
UC-Davis: University of California at Davis
WVURC: West Virginia University Research Corporation
WVU-THDVETL: West Virginia University- Transportable Heavy Duty Vehicle
Emissions Testing Laboratory
viINTRODUCTION
Context of the Problem
Heavy-duty trucks commonly haul freight over very long distances, with time and fuel as
two key concerns. Drivers regularly sleep in their truck cabins, which are equipped
similar to small mobile homes with beds, electrical appliances, heating, and cooling.
Often in order to power cabin appliances and maintain cabin climate in seasonal weather,
a truck’s main propulsion engine is utilized. The net result is less than optimal, for the
main engine, which has been developed and optimized to run at 300+ horsepower to haul
a loaded 40-ton vehicle, can simply be powering an air conditioner and a light bulb.
The negative consequences of this practice of idling have been recognized and are
now being targeted for change. At a truck or fleet level, this fuel inefficiency results in
large fuel expenditure for an industry where profit margins are generally thin. Along
with these direct fuel costs, indirect costs come from the increased maintenance and
overhaul cost incurred by regularly idled engines (Stodolsky et al, 2000). Some
neighborhoods restrict engine idling duration to minimize noise, smoke, and emissions,
and at a regional level, diesel engine idling bans are promulgated in plans to attain
national ambient air standards (Levinson, 2001; TAC, 2001). The resulting fuel
consumption from the hundreds of thousands of idled engines has been targeted by a
national program to reduce petroleum dependence (NEPDG, 2001).
Several technical solutions are in development to replace the operation of main
propulsion engines for the roughly 400,000 line-haul tractor-trailers in the U.S. with
sleeper cabs. To meet the demands of most drivers, the most widely successful solution
must be able to efficiently provide heating, cooling, and electricity for vehicles while
they are at truckstops, loading docks, and remote locations. Argonne National
Laboratory published a broad survey of these alternatives, including a direct diesel-fired
heater, a diesel powered APU, thermal storage, and electrification. Key conclusions of
this study included highlighting the prohibitive disadvantages and limited market
acceptance of these alternatives and supporting the exploration into fuel cell APUs
(Stodolsky et al, 2000).
The use of fuel cell APUs could be a promising alternative to idling, with
substantial fuel consumption, emissions, cost, and noise benefits. The use of solid oxide
fuel cells in particular, could offer these potential benefits by still operating on the
accustomed diesel fuel that is distributed through existing infrastructure. Utilizing fuel
cells in this application, in addition to potentially providing cost-competitive solution to a
recognized problem, could offer a niche market as a stepping-stone to larger fuel cell
production scales (Lutsey et al, 2003).
Objectives
Although the deleterious effects of idling are understood, there has not yet been a
comprehensive analysis on the integration of the fuel cell APU with the conventional
vehicle electrical systems and the resulting expected fuel and emissions benefits. This
report bridges this gap with the modeling of a heavy-duty truck and it stationary power
needs. In addition, much of the work on idling line-haul trucks, in light of wide
distributions in key variables, reports on average or typical trucks and estimates
1aggregate consequences and potential benefits. This report incorporates the widely
dispersed data probabilistically, thereby including all types of driving behavior, in order
to estimate potential benefits for fuel usage and cost savings on a disaggregate level.
Doing so allows characterization of the potential market for fuel cell APUs in the line-
haul truck application, including definition into variables of market size and fuel cell
research targets.
Although the key objective of this paper is to assess the potential of a new
market-unproven technology at solving a particular problem, there are also
methodological goals. Along the way, the creation of a representative stationary duty
cycle for line-haul trucks was a necessary objective. The procedure also includes the
demonstration of the versatility of the ADVISOR vehicle model as a platform for more
sophisticated and specific modeling questions and the quantification of potential benefits
of this system probabilistically with the Monte Carlo method.
BACKGROUND
Currently the state of fuel cell technology as vehicle APUs is at a demonstration, or
proof-of-concept, level of maturity. Several vehicle APU demonstrations have been made
and are ongoing. For example, seeking to meet the high electrical demands of their
luxury sedans, BMW has worked with International Fuel Cells (now UTC Fuel Cells) on
a proton exchange membrane fuel cell (PEMFC), before working on solid oxide fuel cell
(SOFC) systems with Delphi Automotive Systems and Global Thermoelectic Inc.
(Tachtler, Dietsch, and Gotz, 2000; Zizelman, Shaffer, and Mukerjee, 2002). Freightliner
LLC and XCELLSiS (now part of Ballard) demonstrated a hydrogen-fueled PEMFC
APU in a Class 8 truck and are investigating liquid-fueled APUs (Brodrick et al, 2000;
Venturi and Martin, 2001). Southwest Research Institute, SunLine Services Group, and
the National Automotive Center have demonstrated a fuel cell APU system on a Class 8
truck (Montemayor, 2001). The Institute of Transportation Studies at the University of
California at Davis (ITS-Davis) is engaged in a multi-year project that will demonstrate
PEMFC and SOFC technologies as APUs.
More generally SOFC APU technology work is getting primed to meet the
requirements of three key markets simultaneously. Initiated by the U.S. Department of
Energy, the Solid State Energy Conversion Alliance aims to introduce a SOFC that
delvers a peak power of 3-10 kW for a cost of $400/kW to satisfy the demands of 1)
vehicle APUs, 2) residential electricity generation, and 3) military applications (Surdoval,
Singhal, and McVay, 2001). With this multiple market approach, the Alliance aims to
take advantage of larger production scales in the hundreds of thousands of units in the
2011 timeframe. Under SECA, multi-year, multimillion dollar contracts have been
granted to groups including Cummins Power Generation, McDermott Technology, Inc.,
Delphi, Battelle, Honeywell, and Siemens Westinghouse Power Corporation (Surdoval,
2002). A large technical consulting report indicates that SECA’s targets for cost and
performance are achievable in the given timeframe (Arthur D. Little, Inc., 2001)
Some attempts have been made in assessing the viability of APUs as possible
alternatives to idling vehicles. Argonne National Laboratory published a broad survey of
the potential benefits of technology alternatives to idling truck engines, including options
of a direct-fired heater, a diesel powered APU, and electrification. Key conclusions
included highlighting the prohibitive disadvantages and limited market acceptance of
2these alternatives and supporting the exploration into fuel cell APUs (Stodolsky et al,
2000). An older study estimated the potential benefits specifically from truckstop
electrification to power truck accessories (Van den Berg, 1996). Both used rough
estimates for idling behavior and estimated nationwide benefits for typical drivers. The
only attempt at evaluating the potential benefits of fuel cell APUs to supplant idling was
done by Broderick et al, which included crude estimations and used sensitivity analysis to
deal with the prevalent uncertainty (2002b). This study, citing the importance of fuel
consumption at idle in its calculations, reported that PEM fuel cells in truck APU markets
could have 2-5 year payback periods for average drivers (Brodrick et al, 2002b).
RESEARCH METHOD
Overview
This research entails the establishment of a representative line-haul duty cycle, the
characterization of existing data on idling for incorporation into the model, the
development of a model of a truck with a fuel cell APU, the probabilistic treatment of all
input and output data for this model using the Monte Carlo method, and the resulting
assessment of fuel cell APU market targets for line-haul trucks. A schematic
representation of the research methods employed here is given as Figure 1.
In the absence of rigorous driver behavior data, a representative stationary duty
cycle is estimated. This cycle utilizes survey data from previous work conducted in part
by the author (published as Brodrick et al, 2001) and an original pilot survey conducted
in summer 2002. In addition, input parameters to the model are based on researching
empirical vehicle data, other available survey results, and industry estimates and will be
described in turn. With the range of resources required to characterize fuel, emissions,
and driver behavioral characteristics, it is clear that the analysis has considerable
uncertainty and variability involved. To reflect this wide variety of input parameters, a
probabilistic, instead of the more common deterministic, method was employed. Where
deterministic analyses carry calculations for the average (or “base case” or “best guess”),
the Monte Carlo method maintains the degree of uncertainty of individual inputs by
propagating a proper range and distribution of values through the analysis, albeit with
added computational complexity.
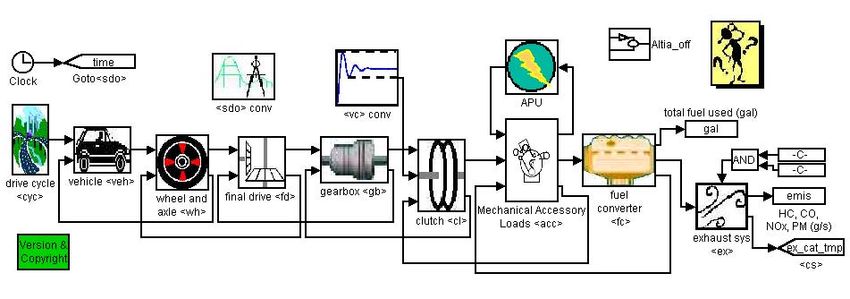
The ADVISOR-based vehicle APU model is used to depict how utilizing fuel cell
APUs to replace heavy-duty truck idling is likely to be implemented. The modeling
development strategy is a result of collaboration between the author and John Wallace, a
colleague at ITS-Davis, who ultimately led the model programming in
MATLAB/Simulink the computer platform. Our model is a modification of the 2002
edition of ADVISOR (or ADvanced VehIcle SimulatiOR software program), which was
developed by the U.S. Department of Energy’s National Renewable Energy Laboratory
and is publicly available (NREL, 2002). The flexibility of the model is a real asset,
making it modification-friendly for users with specific modeling tasks. Taking advantage
of the model versatility, a fuel cell APU module was added and integrated with the
existing systems, engine maps were added and altered to better accommodate idling
characteristics (low torque, low engine rpm), and the appropriate stationary cycle
characteristics were introduced.
3With appropriate distributions as inputs, the corresponding model results too are
distributions of output values. Besides acknowledging more adequately the uncertainties
of a model, probabilistic methods recognize and distinguish between typical and atypical
drivers. This is especially important because the market for an innovative auxiliary
power device is not all truck drivers or even necessarily “typical” drivers. Perhaps it is a
much smaller subset of this population of truck owners that stands to benefit most and
would therefore qualify as the potential market. Monte Carlo allows us to distinguish and
quantify this market, and correspondingly formulate the desirable fuel cell market targets
for these line-haul truck owners.
4160 100% 160 100%
Frequency
Establish Outputs
120 80% 80%
Cumulative % 120
Frequency
Frequency
60% Frequency 60%
80
40%
Vehicle Duty 80
Cumulative % 40% Total potential
40
20% Cycle 40
20% diesel savings
0 0% 0 0% with SOFC APU
Stationary
0
0
0
0
0
00
00
00
0.3
5
0.6
5
0.9
5
1.2
5
1.5
5
20
40
60
80
0.4
0.7
1.0
1.3
1.6
characteristics
10
12
14
Engine RPM at Idle Diesel Consumption at Idle (gal/hr)
Characterize
100 100% 160 100%
Existing Driving
80 80% 120 80% Net Present
Idling Data
Frequency
characteristics
Frequency
60%
Value Economic
60 60% Frequency
Frequency 80
40 40% Cumulative % 40%
Analysis
Cumulative %
40
Idling engine 20 20%
20%
characteristics
0 0%
0 0%
Payback period
ADVISOR 0% 3% 6% 9% 12
% 5% 8% 1%
1 1 2
for line-haul
0
0.9
1.8
2.7
3.6
5
5.4
6.3
7.2
4.
Accessory Average Accessory Load at Idle (kW)
Vehicle Model Percentage of Diesel Consumed at Idle
trucks with SOFC
power needs 160 100% 250 100%
200 80% APU
80%
Frequency
120 150 Frequency 60%
Frequency
Frequency
SOFC APU 80
Cumulative %
60% 100 Cumulative % 40% Potential market
modeling data
50 20%
40%
0 0%
penetration for
40
20%
SOFC APUs in
0
0
00
00
00
36 0
00
48 0
00
M 0
e
60
0
0
0
or
0 0%
line-haul trucks
12
18
24
30
42
54
Potential Diesel Fuel Consumption Decrease
0
3
6
9
12
15
18
21
Idle Hours per Day from Idling Engine to SOFC APU (gal/truck-yr)
Figure 1 Schematic Representation of Overview of this Report
5Establishment of Vehicle Duty Cycles
This modeling task requires an input of a range of duty cycles that reflect driver behavior
for both driving and idling situations. Specifically, accurate information about driving
(speed versus time) and accessory loading (power versus time) are desired for line-haul
trucks. However, well-defined, statistical data on line-haul truck driver behavior are not
available (Stodolsky et al, 2000, Brodrick et al, 2001). Several informal, non-rigorous
studies and fleet surveys have been conducted and are applied to our analysis here. Input
requires data on vehicle accessory power (devices and duration used) required and the
proportion of time driving to that spent idling in order to accurately assess the potential
benefits of installing an APU system. An original small pilot survey was conducted at a
nearby truck rest area to complement a previous ITS-Davis survey (Brodrick et al, 2001)
and the sparse research that is available in this area of characterizing driver behavior.
This section reveals how all available research was utilized to characterize the driver
behavior characteristics that are relevant to the modeling assessment. Distributions are
created for variables that will be treated probabilistically in the analysis.
Pilot Survey
A literature search of available data left an incomplete picture of driver behavior.
Specifically, the 1) duration and power of cabin accessories used during idling need
further refinement and the 2) average hours of idling and driving per day. A smaller pilot
survey was used to help examine these issues. The survey form is reproduced as
Appendix A. Inquiring about the last 24 hours, instead of a “typical day,” was opted for
to reduce potential problems associated with memory bias. Also, this choice ensured that
the survey would capture those off-days that the driver was not on the road.
Two student researchers went to the nearby public rest area just off highway I-80,
near Sacramento, to solicit information from Class 8 trucks drivers. The survey was
verbally administered to the drivers, with driver responses filled in by researchers. The
surveyors received an approximate response rate of 10-15% until 29 surveys were
completed in full throughout one workday.
Potential problems with the data are numerous. The sample size is very small,
introducing high variability as well as a higher chance for biases. The single geographic
location for one day jeopardizes the generalizability of the data over the space and
seasons, considering the importance of climate on driver behavior. Because the survey
was only used for general guidance in association with all other available data and
generous probabilistic ranges were applied later in the modeling stages, these problems
are not thought to be substantial.
Driving vs. Stationary Engine Run-time
The driving portion of the truck duty cycle is more straightforward to replicate in the
model than are the stationary (idling) vehicle characteristics. The US Highway Federal
Emissions Testing Cycle is the most apt candidate to represent the highway driving that
commonly persists for line-haul trucks, short of a rigorous study to develop a more true
cycle for line-haul Class 8 tractor-trailers. This being the case, this speed vs. time cycle
(shown in Appendix B) was chosen to represent the driving section of the truck cycle.
Data from an American Trucking Associations (ATA) survey of motor carrier members
6reported an average of 9.1 hours driving per day (ATA, 2000). Similarly, our pilot
survey respondents reported an average of 9.3 hours driving per day.
Our survey revealed that truck use patterns are widely diverse. For example, 17%
of drivers in our survey reported that they never idled their engines when resting, while
another 17% idled their engines over 10 hours that day. The survey average was about 5
hours idling per truck per day. The reported average was in line with other estimates, as
summarized in Table 1. The American Trucking Associations’ Technology and
Maintenance Council (TMC) used 6 hours per day for its daily idling duration for long-
distance, freight-hauling, heavy duty trucks (TMC, 1995). Stodolsky et al, pointing out
the seasonality of idling, use 10 hrs/day during winter (85 days) and 4.5 hours per day the
rest of the working year (218 days); this equates to a base case of 6 hours per year (2000).
There are also some estimates that are presumed to be highly correlative. A
California Air Resources Board-sponsored study logged total hours where trucks were at
rest, as a percentage of total engine run time. With 84 trucks logged over a total of 1,600
hours, the average idling time was found to be about 42% of total engine-on time
(Maldonado, 2002). This equates to approximately 7 hours of idling for every 9 – 10
hours day of driving; although no distinction is made regarding which stops were
necessary, unavoidable stops (e.g., red lights) versus which ones were unnecessary,
avoidable (e.g., idling while resting). Based on another source, the reported in-truck
sleeping time is about 5 hours per day (Webasto, 2001). Based on these sources, a driver
who idles 5 to 6 hours per day appears to be “typical,” but a wide range of idling duration
is applied to the model.
Table 1 Idling Estimates for Heavy Duty Trucks from Available Studies
Estimated average
idling duration a
Study Comments
Percent of
Hours
engine run-
per day
time
TMC, 1995 6 40 Estimation used in calculations
Informal estimates from fleets (Given here is
Stodolsky et al,
6 40 the “base case” for driver with 10 hrs/day in 85
2000 (basecase)
winter days, 4.5 hours/day for 218 days)
Based on average sleeping time in truck, not
Webasto, 2001 5 36
actual time with engine idling
Datalogs of 84 trucks over 1600 total hours in
Maldonado, 2002 6.5 42 California fleets, without distinction between
nondiscretionary and avoidable resting idling
Small sample (n=29) of Class 8 tractor-trailers
Pilot Survey 5.0 35
in northern California
Assumed “typical” line-haul HD truck driver
“Typical” 5.5 38
for this analysis
a
unless otherwise stated in study, 9 hours driving per day is assumed
For several reasons, a distribution of idling duration was applied. As briefly
commented on in Table 1, none of the available studies offers a rigorous statistical
collection of data that can inform conclusively about line-haul trucking in the US for this
7study. Some are based on industry estimates that may not be generalizable for different
fleet sizes and independent owner-operators. Another is based on average time slept in
truck cabins, regardless of how often engine is at idle or accessories are in use. The one
study involving datalogging does not offer adequate distinction between when hotel
loads, like climate control and accessories, are required.
In the absence of comprehensive data, a range of values must be applied. Using
the pilot survey data in order to generate inputs, a distribution of behavior was created
with a mean of 5.5 hours, taken from the Table 1 average of available idling estimates,
and standard deviation of 5.1, taken from the 2002 pilot survey. Again this large
distribution reflects the genuine diversity of driver behavior and/or the lack of rigorous
statistical data. Figure 2 shows a histogram with the values randomly-generated from
within this distribution to be used in model runs.
160 100%
120 80%
Frequency
Frequency
60%
Cumulative %
80
40%
40
20%
0 0%
12
15
18
21
0
3
6
9
Idle Hours per Day
Figure 2 Distribution of Runs Generated for Monte Carlo Simulation for Daily
Idling Duration (hrs/day)
Accessory Power Cycle for Stationary Truck
After estimating the fraction of time driving and idling, further understanding of energy
flow aboard the vehicle is required. Although power is distinctly exchanged from vehicle
subsystems in the forms of mechanical shaft power, voltage (DC and AC, with different
voltages), and heating and cooling, these systems are currently modeled generically as
power (W) with efficiencies addressed accordingly. The power characteristics for the
electrical and climate control devices for the two systems of interest, 1) baseline main
engine idling and 2) fuel cell auxiliary power in lieu of idling, vary slightly. The main
objective in creating these two cycles was to maintain the same ability in both systems to
provide the same services (electricity for appliances, cooling, and heating), shown
schematically in Figure 3.
8Idling subsystems Fuel cell APU subsystems
POx
Diesel H20
Anode CO2 +
Inverter Cabin Power*
(W) Cathode
Accessory
Alternator
Engine
Fan Television 300 Air
. Microwave 1200
Batteries Refrig./cooler 300 AC
Engine AC loads
Light Bulb 60
loads
Coffee maker 900
Batteries
Other 100
C Stereo 30
Inverter
CB radio 10
Cond
Evap
Dash-readout 50 DC
Air DC loads
Pers. comp. 50
loads
Cond. Lamp (DC) 30
Cell Phone 10
Heat (Fan) 2400 AC
Engine air Heat
Cooling 2100
cond. pump
Figure 3 Systems Diagram for Idling and APU Subsystems Each Providing Same
Cabin Services
Baseline Engine Idling Accessories. As a starting point, it is necessary to determine
what appliances require power in truck cabins. Our survey results for the likelihood of
drivers to have various accessories are shown in Table 2, along with our results from the
previous survey (Brodrick et al, 2001). The way the surveys were crafted does not allow
for a perfectly straightforward comparison; however, the results do show that the two
driver samples appear to have similarly equipped cabins.
9Table 2 Accessories in Truck Cabins, Reported in Two Pilot Surveys
Percentage of trucks with the
following accessories
2001 Pilot 2002 Mini-
Accessory
Surveya Pilot Survey
Stereo 96% 86%
TV 60% 21%
Computer 35%b 28%c
CB radio 90% 86%
Lamp (built-in) 84% 66%
AC light bulb N/A 41%
Refrigerator 52% 48%
Coffee maker 14% 7%
Microwave 12% 10%
A/C powered by engine 92% 93%
Electric A/C 7% 0%
Heat from engine 94% N/A
Heat from other source 2% N/A
Stove using battery 9% N/A
Stove using other source 3% N/A
VCR 9% N/A
Cell phones N/A 28%
“Other” 5% N/A
Power-take-off 13% N/A
a
from Brodrick et al., 2001
b
no distinction between PC and dash-readout/company computer was made
c
dash-readout/company computer percentage is given; 10.3% of trucks had personal computers
Modeling the baseline scenario, engine idling to power electronic and climate
control devices, is not a trivial matter in an unmodified ADVISOR. Although the model
does have some accessory power load information, it is lacking in some of the
accessories that are crucially important for our analysis. For example, because the
ADVISOR model is geared toward handling a driving vehicle, many standard auxiliaries
like the engine cooling fan, the air brakes, and the alternator are included; however, many
of the stationary aftermarket accessories (TV, microwave, etc.) for idling truck drivers
are not included. Using our survey data on the frequency of use of the accessories and
available data on their power demand, energy flows are modeled for the at-rest vehicle.
Modeling the loading of accessories with a constant average load would
misrepresent the way electricity flows on-board the vehicle. Because the engine at idle
and fuel cell have variable efficiencies for given power outputs, a more accurate cycle
over time was created, based on the reported idling times, the reported accessory-use
times (while the vehicle was at idle), and the estimated power demands of the
accessories. These characteristics are shown in Table 3.
The main goal in creating two scenario cycles was to maintain the same ability in
both systems to provide the same services (electricity for appliances, cooling, and
heating). Estimates for accessory power draws were derived from several sources,
including some field measurements of voltage and current from idling trucks at
10Sacramento Select Trucks. Heating the cabin draws excess engine heat, while drawing
up to 300 W of electrical energy to power fans to transport this heated air into the cabin.
The cabin air conditioning requires variable shaft energy (from about 1.3 to 3.0 kW at
600 to 1200 rpm). Similarly, the engine cooling fan draws between 700 and 3 kW over
idling speed ranges, and it is assumed to run 40% of the idling time. Electrical power for
accessories shown in Table 3 are the loads “seen” at the accessory and do not account for
the alternator efficiency losses.
Table 3 Estimations for Key Characteristics for Average Truck Idling
Power for Power for fuel
Fraction of
Accessory used during idle time idling cell APU case
idle time
basecase (W) (W)
Stereo (stock, in dashboard) 0.31 30 30
CB radio 0.39 10 10
Television 0.05 300 300
Dash-read/company comp. 0.19 50 50
Personal computer 0.01 50 50
Microwave 0.01 1200 1200
Refrigerator/Electric Cooler 0.26 300 300
Overhead lamp (built-in DC) 0.15 30 30
Light Bulb (AC) 0.04 60 60
Coffee maker 0.01 900 900
Electric Blanket(Other) 0.06 100 100
Cell Phone(Other) 0.32 10 10
*
Cabin air conditioning 0.32 2100 1700
Cabin heating 0.32 300 2400
*
Engine cooling fan 0.40 1800 0
*
These are taken from ADVISOR model, for an engine speed = 850 rpm. In reality and in the model these
power magnitudes vary with idling rpm
Because the way engine systems are separated and the method that they interface
with one another in ADVISOR, the electric accessories, whose electricity runs through
the alternator and batteries, were separated from shaft-driven accessories (compressor for
A/C and the engine fan). The “typical” driver at idle had an estimated average power
draw of about 2.1 kW, and the standard deviation was a relatively high 1.4 kW. Figure 4
shows the distribution of values randomly-selected from within this distribution. The
average power value, and the proportion each simulated driver (i.e. each Monte Carlo
trial) is away from this value, was used to scale the entire electrical accessory profile.
11100 100%
80 80%
Frequency 60 60%
Frequency
40 Cumulative % 40%
20 20%
0 0%
9
8
7
6
5
4
3
2
0
0.
3.
6.
1.
2.
4.
5.
7.
Average Accessory Load at Idle (kW)
Figure 4 Distribution of Runs Generated for Monte Carlo Simulation for Average
Accessory Power Load (kW)
Fuel Cell APU System Accessories. Several of the power loads for accessories in Table
3 are not equivalent for the baseline idling and fuel cell APU systems. For example, the
fuel cell APU system does not have the opportunity to utilize excess engine heat for cab
climate control. Although in the case of the SOFC, there may be usable excess heat, the
model assumes that the fuel cell system can only provide electric power. This decision is
conservative, but justified due to the current uncertainties regarding fuel cell technologies
and the strong possibility for mismatch between available excess SOFC heat and desired
cabin heating. Instead, we assume the specifications of off-the-shelf technology,
powered by fuel cell electricity, to provide heating and cooling to the cabin. We used
specifications provided by Cruisair® for a 115 V AC heat pump: 10,000 Btu/hr for
cooling from 14.8 Amps (~1.7 kW) of electricity and 6,825 Btu/h for heating from 20.3
amps (~2.4 kW). An initial spike of about 4.4 kW is required at startup (Allen, 2002).
The procedure used to transform the characteristics of Table 3 into a power vs.
time cycle is similar to that utilized by ADVISOR for other accessories, based on duty
cycle estimations of SAE report J1343 on accessory power requirements (SAE, 2000).
Accessories shift on and off, roughly according to how a user or control device in the
real-world toggles them. The way they toggle must account for some loading situations
with many appliances on at once. However, inconsistencies, such as running a heater and
air conditioning simultaneously, are of course avoided.
Figure 5 shows estimations of the power-time traces applied to the ADVISOR
model. Truly the traces are slightly different for each driver as a result of the engine
speed (which determines power of air conditioning and engine cooling fan, as well as the
alternator efficiency) and the variance in accessory use by driver, as shown above in
Figure 3. ADVISOR’s model accounted for engine speed (rpm)-dependent variables, and
the differences in individual drivers’ average accessories were accounted for by scaling
the magnitude of the loads of Figure 4 with their difference from the average power of
2.1. For example, for a driver with an average accessory loading of 1 kW, the profiles of
Figure 5 would remain similar in shape while decreasing by about a half. Developing the
profile for the fuel cell APU, the heat pump values are all divided by 0.85, the assumed
DC-AC inverter efficiency, in order to determine the amount of net power to be delivered
by the fuel cell. The average for electric power over the fuel cell APU cycle is about 1.8
kW for the APU cycle shown in Figure 5.
12Estimated total power at idle (W)
5000
Estimated mechanical load at idle (W)
4500 Estimated electrical load for APU (W)
4000
3500
Power (W)
3000
2500
2000
1500
1000
500
0
0 1 2 3 4 5
Time (hrs)
Figure 5 Estimated Accessory Power Profiles for Idling Scenario (Electrical and
Mechanical) and APU Electric Load over Duration of Stationary Period
Engine Speed at Idle
Engine rpm varies substantially in the field (Brodrick et al, 2001). This adjustable engine
setting has a profound effect on idling fuel consumption (Brodrick at al, 2002b; Irick et
al. 2002). This parameter was initially tested for sensitivity in the model, and found to be
important. As a result, the variable of rpm was applied probabilistically as shown in
Figure 6, using values from the Brodrick et al (2001) pilot survey – mean of 850 rpm,
standard deviation 170 rpm, and minimum 400 rpm.
160 100%
Frequency
120 80%
Cumulative %
Frequency
60%
80
40%
40 20%
0 0%
00
00
00
0
0
0
0
0
20
40
60
80
10
12
14
Engine RPM at Idle
Figure 6 Distribution of Runs Generated for Monte Carlo Simulation for Engine
Idle Speed (rpm)
The histograms of Figures 2, 4, and 6 show the distributions of the model input
values. The Microsoft Excel random number generator was used to create these
13distributions. Because of practical real-world constraints, some filters were used to
modify some of these inputs. Namely, negative values for idling duration and accessory
power during idle were changed to zero, and engine speeds less than 400 rpm were
changed to 400, which was the minimum value reported in our 2001 pilot survey
(Brodrick et al, 2001). As a result of this filtering of the randomly generated trial inputs,
the statistical variables (i.e., mean, median, standard deviation) are changed somewhat, as
shown in Table 4.
Table 4 Summary of Statistical Characteristics for Model Inputs (n=1000)
Daily Idling Average Accessory
Engine Speed Power During Idling
Duration
at Idle (rpm) *
(hrs/day) Period (kW)
mean 859.4 5.97 2.07
median 859.9 5.57 2.05
st. dev 167.4 4.51 1.31
*
These loads are for the APU system. The magnitudes are different for the engine idling scenario, as discussed above.
Model Development
A prominent reason for modeling the fuel cell APU-equipped tractor-trailer system in
ADVISOR is the model’s flexibility in accepting different data types. The model,
although it has much data for a wide variety of different vehicle subsystems, needed
enhancements in several key areas for usefulness in addressing our problem. Figure 1
illustrates the conceptual framework of the model and our modifications to it. There
were five key areas of modification: 1) Creation of a representative vehicle duty cycle, 2)
inputting engine-specific emissions and fuel consumption maps, 3) addition and
integration of the APU module with control strategy, 4) estimation of fuel cell
performance data, and 5) appropriate sizing of the fuel cell APU. Fuel consumption and
emissions estimates are the outputs of the vehicle simulation model.
Vehicle Duty Cycles
The power-time trace created for the idling portion of the drive cycle was shown above in
Figure 5. The driving portion of the cycle (Figure 1) and the stationary cycle were
concatenated, and then shrunk for the sake of the second-by-second model. The federal
highway cycle is defined as 766 seconds; therefore a 9-hour drive cycle is decreased by a
factor 42.3. Modeling a 5.5-hour stationary cycle requires similarly scaling to 468
seconds.
Generally, the default ADVISOR accessories cycle on (full-power) and off (zero
power) according to a given frequency and duration. Several components are more
dynamic. For example, the 2002 model has a look-up table to reflect the alternator
operation for varying electric power delivered and engine power. Also, the air
conditioning and engine cooling fan systems operate as functions of the engine speed
(rpm). Pertinent characteristics of the ADVISOR electrical accessory system are
tabulated in more detail in Appendix B.
14Calibration of Engine Data Maps
Data that is perfectly applicable to the engine systems for our study were not available,
and engine data maps (i.e., emissions and fuel consumption vs. torque and engine speed)
are notoriously difficult to obtain. The ADVISOR heavy-duty truck model is equipped
with a Detroit Diesel 330-kW engine component with a fuel consumption map, but
excludes the accompanying emissions data. Since engine manufacturers of this power
class declined to provide these emissions maps, total emission benefits were estimated by
scaling up available engine emissions maps from a 1999 engine with a peak power of 209
kW that were already in our possession.
These emissions maps that are available are not fully comprehensive. As is
normally the case, there are data gaps in the maps, particularly for low torque and rpm
values of engine operation – those points that are especially relevant for our idling
situations. As a result, a variety of methods was employed to approximate emissions and
fuel rates in these areas, and calibration was done to ensure a baseline performance that is
comparable to existing empirical data. The engine maps were ultimately approximated
by linearly extrapolating the existing grams/second from the maps to lower torque values
for given engine rpm. Other extrapolating techniques, including keeping grams/kWH
and grams/second constant with engine rpm and grams/second linear with torque at
constant rpm, were also explored. The engine maps for fuel consumption, before and
after extrapolating, are shown in Figure 7.
100 100
Max. Torque Max. Torque
90 90
80 80
70 70
Engine Load (%)
Engine Load (%)
60 60
50
50
40
40
30
30
20
20
10
10
600 800 1000 1200 1400 1600 1800 2000 2200 600 800 1000 1200 1400 1600 1800 2000 2200
Engine Speed (RPM) Engine Speed (RPM)
Figure 7 Engine Fuel Maps - Before and After Extrapolating for Missing Data
Baseline Fuel Consumption. Although there is not comprehensive statistical data on
how line-haul trucks consume diesel fuel at idle, the key variables are known. Those key
variables are engine speed (rpm) and accessory brake horsepower (bhp). The American
Trucking Associations’ Truck Maintenance Council estimates the relationship between
rpm, bhp, and gallons of diesel per hour, shown in Figure 8. These curves are similar to
existing trucks, but may be generally too high because they are based on pre-1995 truck
data. As a result, available data on newer trucks was used to validate and calibrate the
fuel consumption results of our model.
15Figure 8 Estimated Fuel Consumption with Varying Engine Speed (rpm) and
Accessory Loading (bhp) (TMC, 1995)
Much of the testing done on idling engines intentionally involves disengaging all
nonessential accessories for reasons of replicablility and consistency. There are only two
known sources that specifically tested idling engines over a range of engine speeds and
accessory loadings (including “hotel loads”). Previous ITS-Davis work investigated the
effects of accessory loading and engine rpm on fuel and emissions. The study concluded
that both of these factors had substantial effects (Brodrick et al, 2002). Another group
has found similar effects for fuel consumption (Irick et al, 2002). Plotting data from the
Irick et al (2002) and Brodrick et al (2002), strong positive correlations emerge between
idling fuel consumption (in gallons of diesel per hour) and engine rpm and accessory
loading. As seen in Figure 8, there are near linear increases (R2 values of 0.72 to 0.98 for
each accessory loading line) of fuel consumption with rpm, with higher trendlines for
increased accessory loading.
Along with empirical data points, ADVISOR outputs for idling fuel consumption
are shown on Figure 9. These points appeared to validate that our baseline model for fuel
consumption is accurate in capturing the correct relationship for fuel consumption rate
with respect to engine speed. The model was than calibrated by adjusting the points in
the engine data maps in the extrapolated regions for low torques. In a previous survey,
respondents reported engine speed during idling for accessory use (Brodrick et al, 2001).
The middle range from the survey of 700 to 1000 rpm corresponds to 0.7 to 1.05 gallons
of diesel per hour, equivalent to the industry cited average values.
161.6
1.4
R2 = 0.72
1.2
R2 = 0.88
Fuel consumption
R2 = 0.98
1.0
(gal/hr)
0.8
0.6
ADVISOR (A/C plus acc.)
Data (with A/C)
0.4
Data (Fan Only)
0.2 Data (No acc.)
ADVISOR (before calibration)
0.0
500 600 700 800 900 1000 1100 1200 1300
Engine RPM
Figure 9 Fuel Consumption at Idle: ADVISOR Results with Empirical Data (fitted
to linear regression lines)
Emissions maps. Several impediments lie in the way of developing an accurate,
interactive emissions modeling capability for varying idling situations. Steady-state
engine emissions maps, and especially ones that are well-defined at very low torque and
engine speed points (where idling occurs) are very difficult to obtain. Furthermore,
because of the inherently transient nature of emissions, empirical data is crucial to
calibrate the model and validate the results. There are some small studies that suggest
that engine speed and accessory loading may play a large role in emissions as for fuel
consumption (Brodrick et al, 2002b, Irick et al, 2002, WVURC, 2002). However, the
bulk of the rest of idle emissions testing (McCormick et al., 2000; Traver, 2002;
WVURC, 2002) has been conducted without these conditions and ample data were not
available to show well defined relationships such as those in Figure 9 above. EPA work
in this area is ongoing. January 2, 2003, EPA released a report from testing of a variety
of heavy-duty vehicles for long periods under various load conditions (Lim, 2002). The
EPA report is the most comprehensive in its inclusion of different idling conditions, truck
model years, and testing modes, but the study only includes the emissions of carbon
dioxide (CO2) and oxides of nitrogen (NOx). Table 5 highlights the idle emissions tests
that have been done with brief comments on procedural differences.
17Table 5 Idling Emissions Testing
Modes
Study Trucks or Comments on testing procedure
tests
Class 8 trucks 1990-1997 model year. 36K-443K mi.
Tested hot, within 20 min. of chassis dyno driving cycle.
McCormick et
10 1 Measured over 20 min period. Ambient 20C. Elev.
al., 2000
1609 m above sea level. Without testing for effects of
accessory loading.
Traver, 2002 Ford L-9000 tractor, 106K mi. Cummins M11-280E+,
280 hp diesel engine. Tested at 6 facilities, data from
Lab A 1 2 one was later omitted: (ARB-HDETL in LA, CA;
CaTTS in Richmond, CA; CSM-CIFER in Golden,
Lab B 1 3 CO; EnvCanada in Ottawa, Ontario; SwRI in San
Lab D 1 3 Antonio, TX; WVU-THDVETL in Riverside, CA). No
Lab E 1 3 Accessory loading.
Lab F 1 9
1995 Mack CH 613 tractor, Mack E7-400 engine 728
in^3, 400 hp @ 1800 rpm; 10 minutes per idling mode;
at WVU-THDVETL. Reported emission values for
WVURC, 2002 1 8 collections were with the lights, air conditioning, and
other accessories were off. Engine cooling fan,
alternator, air brake compressor, and AC compressor
varied throughout.
1999 Freightliner Century Class 450-hp tested over 5
Brodrick et al, modes (with several tests per mode) with varying rpm
1 5
2002 (600 and 1050), with varying accessory loading, and
following several types of driving cycles.
Over 30 unique tests at engine speeds from 600 to 1200
rpm, with variable accessory loadings (heat, air
Lim, 2002 9 42
conditioning), with span of extreme ambient conditions.
Truck model years from 1980s to 2001.
Due to the limitations of idling emissions data (e.g., lack of emissions rates that
are dynamically related to accessory loading and rpm variance), further calculations on
truck emissions would be questionable. For this reason and because of the secondary
importance of emissions (as compared with fuel and cost benefits) in this analysis,
presentation of model results for annual truck emissions is forgone at this point. Data
from the idling emissions testing are shown in Appendix C.
Creation of APU module and control strategy
ADVISOR was originally constructed with some ability to model the idling of the main
diesel engine. ADVISOR’s engine/accessory control strategy was modified to
accommodate engine-off APU operation. The APU block contains a fuel cell system
performance relationship discussed in the following section.
The APU block checks the state of the engine (on/off), takes the stationary
accessory load as an input, uses both the TIAX fuel cell performance data and subroutine
(described later), and outputs the power achieved, fuel consumed, and emissions
18produced during the process. This model has been created to be flexible enough to use
several different types of APUs, including a fuel cell, diesel generator, or large battery
pack, as well as predict their performance over any combined driving/idling cycle. A key
issue is how the APU and the existing electrical system (primarily the battery) interact, or
when each one supplies power to the accessories. Characteristics of the strategy include–
• APU is off when driving, APU turns on when vehicle is at rest.
• When vehicle is at rest, the APU-battery system acts out the following subroutine:
APU delivers all accessory power up to its peak power.
When APU cannot deliver all required power, the battery delivers the
difference.
If the battery state-of-charge (SOC) is below its initial state of charge, and the
accessory loading is below the APU peak power, the APU increases its output
to charge the battery. The excess power from the APU is proportional the
difference of initial SOC and current SOC.
The characteristics, particularly with respect to start-up time, of the SOFC system
may require modification from this strategy. Even if there is a long start-up, it may be a
relatively small problem for this application. It may be reasonable to assume drivers,
knowing roughly when they will take their rest press the “warm-up” button a half-hour in
advance. For this start-up period, a certain minimum power draw would be required. In
light of uncertainties about the still developing SOFC technology and how such issues
will ultimately be resolved, the strategy above was retained. The chosen control strategy
has the ability to utilize the battery to “peak-shave” on brief occasions where the APU
can not supply power to the demanded load (e.g., when the air conditioner first turns on).
Fuel cell performance map
The ADVISOR APU model inputs fuel cell performance data from TIAX, LLC (formerly
Arthur D. Little) for a diesel-fueled solid oxide fuel cell (SOFC) system with a reformer.
Although a more rigorous fuel cell model would include transient effects on the reformer,
the air supply subsystem, fuel flow and utilization rates, and any other supporting and
parasitic loads, this study does not. Doing so is beyond the scope of this work. Instead
the model relies on the work of TIAX for fuel cell performance characteristics.
The fuel cell system was modeled with efficiency vs. load relationships. As
shown in Figure 10, these relationships differ slightly for systems of different fuel cell
peak power. These curves reflect the improved balance-of-plant efficiency with larger
systems – as peak power increases, the power required for parasitics, heat loss, and
auxiliary subsystems (reformer, air compressor, etc.) increases more gradually. More
discussion on the SOFC system and model is given in Appendix D.
19You can also read