Energy- and Cost-Efficient 5G Networks in Rural Areas - YITING YU - KTH ROYAL INSTITUTE OF TECHNOLOGY SCHOOL OF INFORMATION AND COMMUNICATION ...
←
→
Page content transcription
If your browser does not render page correctly, please read the page content below

DEGREE PROJECT IN ELECTRICAL ENGINEERING,
SECOND CYCLE, 30 CREDITS
STOCKHOLM, SWEDEN 2016

Energy- and Cost-Efficient
5G Networks in Rural Areas
YITING YU

KTH ROYAL INSTITUTE OF TECHNOLOGY
SCHOOL OF INFORMATION AND COMMUNICATION TECHNOLOGY
Energy- and Cost-Efficient 5G Networks in
              Rural Areas

                         Student:

                        Yiting Yu

                       Supervisors:

              Sibel Tombaz, Ki Won Sung

                        Examiner:

                    Anders Västberg

    School of Information and Communication Technology,

            KTH - Royal Institute of Technology

                    Stockholm, Sweden

                      September 2016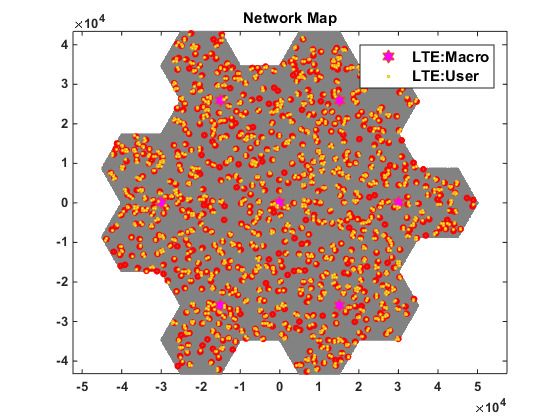
Abstract
    Energy- and cost-efficiency is becoming a criteria of ever increasing
importance in the design of 5G wireless solutions, especially for suburban
and rural areas where the realistic barrier of providing mobile broadband
service lies in the economic drawback of low revenue potential. Thus net-
work operators are highly sensitive to the energy performance and eco-
nomic affordability of potential solutions in futuristic 5G wireless network.
    In this thesis, we investigate the energy performance of 5G wireless
networks with two key technical components (massive beamforming and
ultra-lean design) in a rural environment for two real-life cases commonly
faced by network operators: (1) A hardware upgrade to 5G in existing
LTE sites (2) 5G greenfield deployments. The results are compared with
a currently deployed LTE network in rural environment.
    Furthermore, we conduct economic viability evaluations in a study of
energy-cost trade-off in rural scenario to derive the condition when the
proposed energy-efficient 5G solutions are also cost-efficient. The analysis
are performed separately in two cases based on different methods.
    The simulation results indicate that 5G systems provides much bet-
ter energy performance compared with LTE systems, achieving maximum
56% and 64% reduction in daily average area power consumption in hard-
ware upgrade case and greenfield deployment case respectively. The sig-
nificant saving mainly comes from the incorporated effect of beamforming
technology and possibility of longer sleep durations.
    For cost-efficiency, a hardware upgrade to 5G is economically highly
motivated in higher energy-pricing regions or in systems with longer sleep
durations. In greenfield deployments, the analysis result shows that it
is always cost-efficient to deploy 5G solutions other than LTE solutions
in rural areas despite of the variation in regional energy prices, network
lifetime expectation and the DTX factor in 5G solutions.

                                      I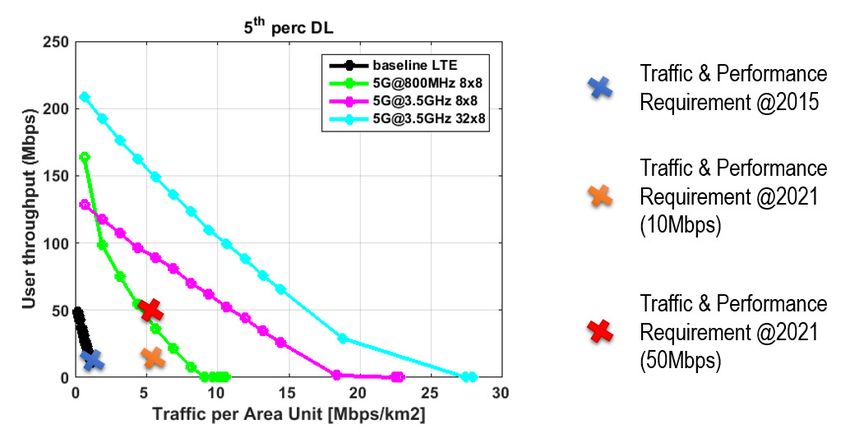
Abstrakt
Energi- och kostnadseffektivitet blir ett kriterium av ständigt ökande bety-
delse i utformningen av 5G trådlösa lösningar, särskilt för förorts- och lands-
bygdsområden där den realistiska hinder att ge mobilt bredband ligger i den
ekonomiska nackdelen med låg intäktspotential . Således nätoperatörer är my-
cket känsliga för energi och ekonomiska överkomliga till potentiella lösningar i
futuristiska 5G trådlöst nätverk.

I denna avhandling undersöker vi energiprestanda av 5G trådlösa nätverk med
två viktiga tekniska komponenter (massiv strålformning och ultra-lean design) i
en lantlig miljö för två verkliga fall som nätoperatörerna vanligen står inför: (1)
uppgraderingar av maskinvara till 5G i befintliga LTE platser (2) 5G greenfield
distributioner. Resultaten jämförs med en idag sköts LTE-nät i lantlig miljö.

Dessutom genomför vi ekonomiska utvärderingar i en studie av energikostnader
avvägning på landsbygden scenario att härleda villkoret när de föreslagna energi-
effektiva 5G lösningar är också kostnadseffektivt. Analysen genomförs separat
i två fall på olika metoder.

Simuleringsresultaten visar att 5G system ger mycket bättre energiprestanda
jämfört med LTE system. 5G uppnår en minskning 56 % och 64 % i genom-
snittlig daglig område strömförbrukning i hårdvara uppgradering fall och gröna
driftsättning fallet respektive. Den betydande besparing kommer främst från
den innefattade effekten av strålformning teknik och möjlighet till längre sömn
löptider.

För kostnadseffektivitet, är en hårdvara uppgradering till 5G ekonomiskt my-
cket motiverade i högre regionerna energi prissättning eller i system med längre
sömn löptider. Greenfield distributioner visar analysresultatet att det alltid
är kostnadseffektivt att distribuera andra än LTE lösningar på landsbygden 5G
lösningar trots variationen i regionala energipriser, nätverk livstid förväntan och
DTX faktor i 5G lösningar.

                                           III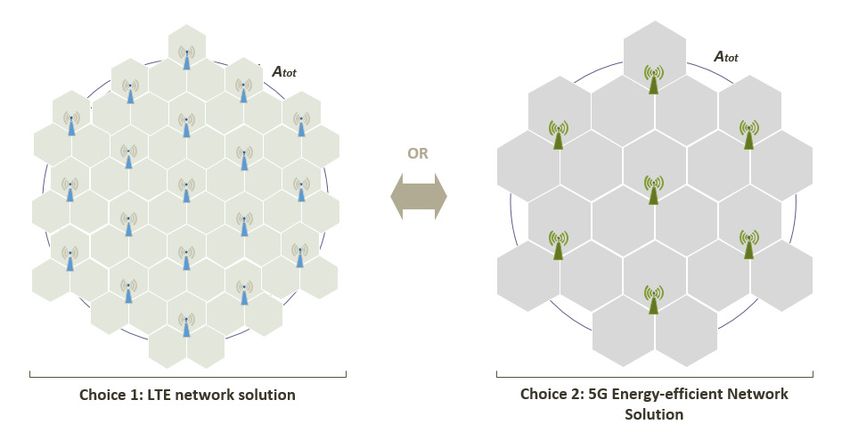
Acknowledgment

I would like to thank the Department of Communication Systems (CoS) in KTH
for receiving me as a master student, and energy performance & sustainability
team in Ericsson Research in Stockholm, Sweden for providing this valuable
opportunity with laboratory facilities and all other kinds of support throughout
my thesis project experience.

In particular, I would like to give my sincere gratitude to Sibel Tombaz, my
supervisor at Ericsson Research, for her countless support, inspiration and pa-
tience guiding me through the whole process. Even through you have a very
full schedule, your door has always been open for me and you always answer
my questions with great patience and help me stay on the right track. I gain
precious learning from you on how to design and perform researches as an in-
dependent researcher, which I would keep with me for my whole career.

I would like show my greatest appreciation to Ki Won Sung, my academic
supervisor at KTH, for supervising my thesis project with great patience and
sharing with me the vast amount of knowledge in academic field, which greatly
helps to improve the quality of this thesis work.

I would like to thank Anders Västberg, my thesis examiner at KTH, for exam-
ining and advising my thesis project. I appreciate your worthful comments and
advises throughout my thesis work.

I also wish to thank everyone else who has kindly helped me and contributed
to this thesis work with useful advises. Special thanks to everyone in energy
performance team in Ericsson Research who has welcomed me with warm smiles
and lovely fikas.

                                       V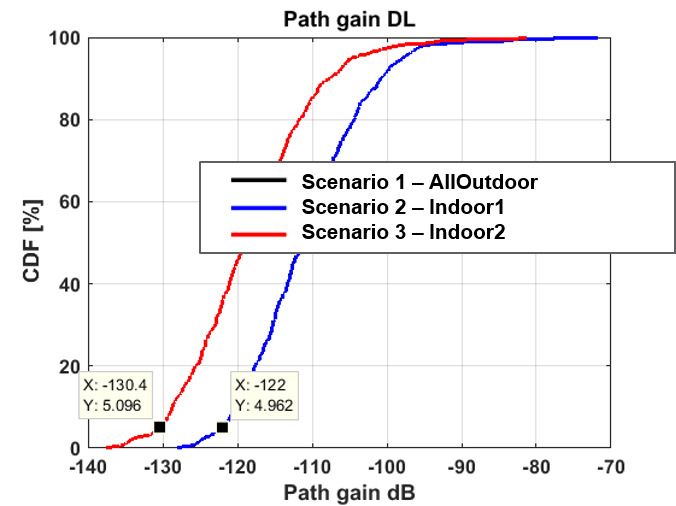
Contents
1 Introduction                                                                                            1
  1.1 Background . . . . . . . . . . . . . . . . . .      .   .   .   .   .   .   .   .   .   .   .   .   2
       1.1.1 Why Focus on Rural Areas . . . . .           .   .   .   .   .   .   .   .   .   .   .   .   2
       1.1.2 Benefits, Ethics and Sustainability .        .   .   .   .   .   .   .   .   .   .   .   .   2
       1.1.3 Challenges and Obstacles . . . . . .         .   .   .   .   .   .   .   .   .   .   .   .   3
  1.2 Previous Work and Research Gaps . . . . .           .   .   .   .   .   .   .   .   .   .   .   .   4
       1.2.1 Main Projects and Activities on 5G           .   .   .   .   .   .   .   .   .   .   .   .   4
       1.2.2 Studies on Energy-Efficient solutions        .   .   .   .   .   .   .   .   .   .   .   .   4
       1.2.3 Low Attention on Cost-Efficiency . .         .   .   .   .   .   .   .   .   .   .   .   .   5
       1.2.4 Rural Studies . . . . . . . . . . . . .      .   .   .   .   .   .   .   .   .   .   .   .   5
  1.3 Problem Formulation . . . . . . . . . . . . .       .   .   .   .   .   .   .   .   .   .   .   .   6
  1.4 Methodology . . . . . . . . . . . . . . . . .       .   .   .   .   .   .   .   .   .   .   .   .   6
  1.5 Delimitation . . . . . . . . . . . . . . . . . .    .   .   .   .   .   .   .   .   .   .   .   .   7
  1.6 Outline . . . . . . . . . . . . . . . . . . . .     .   .   .   .   .   .   .   .   .   .   .   .   7

2 A Overview of 5G Technologies for Rural Areas                                                           8
  2.1 UE Specific Beamforming . . . . . . . . . . . . . . . . . . . . . .                                 8
  2.2 Ultra-lean Design . . . . . . . . . . . . . . . . . . . . . . . . . . .                             9

3 Energy and Cost Performance Evaluation Methodology                                                      11
  3.1 System-level Performance Evaluation . . . . . . . . . . . .                         .   .   .   .   11
  3.2 Energy Performance Evaluation Methodology . . . . . . .                             .   .   .   .   12
      3.2.1 Power Consumption Model for LTE Networks . . .                                .   .   .   .   12
      3.2.2 Power Consumption Model for 5G Networks . . . .                               .   .   .   .   13
      3.2.3 Feasible Load Model . . . . . . . . . . . . . . . . .                         .   .   .   .   14
      3.2.4 Daily Average Area Power Consumption . . . . . .                              .   .   .   .   15
  3.3 Cost Performance Analysis Methodology . . . . . . . . . .                           .   .   .   .   16
      3.3.1 Total cost Model . . . . . . . . . . . . . . . . . . .                        .   .   .   .   17
      3.3.2 Methodology for Economic Viability Analysis . . .                             .   .   .   .   17
  3.4 Defining Energy- and Cost-Efficient Solutions . . . . . . .                         .   .   .   .   21

4 Network Layout and System Models                                                                        23
  4.1 Rural Environment . . . . . . . . . . . . .     .   .   .   .   .   .   .   .   .   .   .   .   .   23
      4.1.1 ITU Indian Rural Model . . . . . .        .   .   .   .   .   .   .   .   .   .   .   .   .   23
      4.1.2 Traffic Modeling in Rural Scenario        .   .   .   .   .   .   .   .   .   .   .   .   .   23
  4.2 Network Layout . . . . . . . . . . . . . . .    .   .   .   .   .   .   .   .   .   .   .   .   .   26
  4.3 Propagation Model . . . . . . . . . . . . .     .   .   .   .   .   .   .   .   .   .   .   .   .   27

5 Simulations                                                                                             28
  5.1 Simulation Setup . . . . . . . . . . . . . .    .   .   .   .   .   .   .   .   .   .   .   .   .   28
  5.2 Defining the Baseline Deployment . . . .        .   .   .   .   .   .   .   .   .   .   .   .   .   29
      5.2.1 Defining the Optimal Antenna Tilt         .   .   .   .   .   .   .   .   .   .   .   .   .   30
      5.2.2 Network Dimensioning . . . . . . .        .   .   .   .   .   .   .   .   .   .   .   .   .   31

6 Simulation Results                                                     33
  6.1 How Does LTE Perform in Rural Areas? . . . . . . . . . . . . . . 33
  6.2 How Does 5G Help in the Rural Scenario? . . . . . . . . . . . . . 33
      6.2.1 Impact of Antenna Arrays . . . . . . . . . . . . . . . . . . 33

                                       VII
6.2.2 Impact of Operating Frequencies . . . . . . . . . . . . . . 35
6.2.3 Benefit of More Antenna Elements . . . . . . . . . . . . . 36
6.3 How Does 5G Perform in Rural Areas? . . . . . . . . . . . . . . . 38
6.3.1 Case Study 1: Existing Deployments . . . . . . . . . . . . 38
6.3.2 Case Study 2: Greenfield Deployments . . . . . . . . . . . 42
7 Conclusion and Future Work 46
VIIIList of Figures
1 Concepts of UE-specific beamforming . . . . . . . . . . . . . . . 9
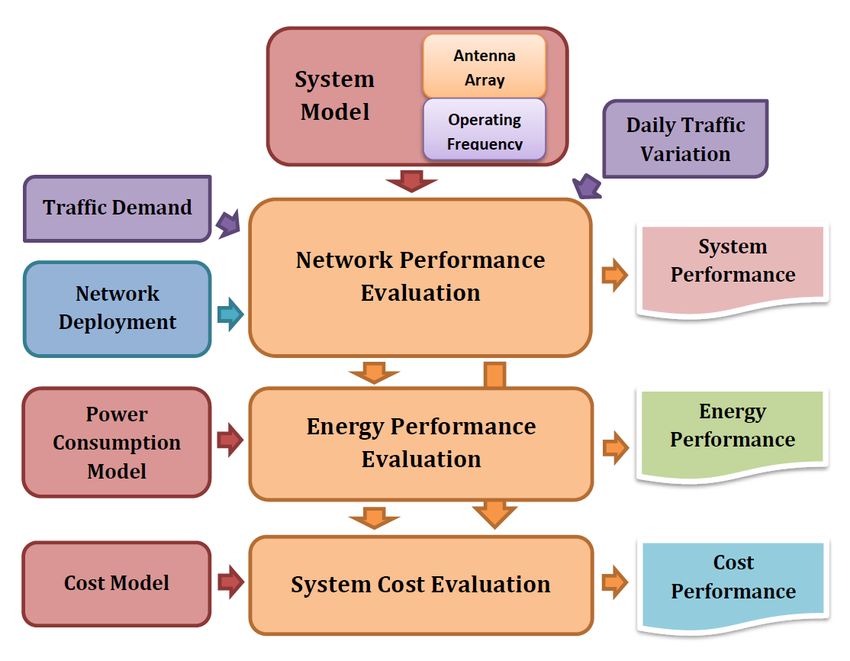
2 Methodological framework of system-level evaluation . . . . . . . 11
3 Process to derive daily average area power consumption . . . . . 16
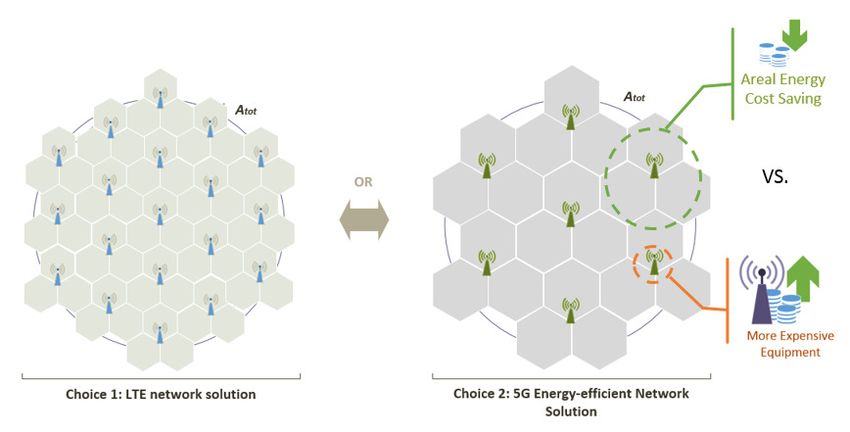
4 Case study 1 - hardware upgrade in existing networks . . . . . . 18
5 Case study 2 - greenfield deployments . . . . . . . . . . . . . . . 20
6 Methodological framework of defining network deployment . . . . 22
7 ITU Indian Rural Model . . . . . . . . . . . . . . . . . . . . . . . 24
8 Derive the long-term traffic model in rural areas . . . . . . . . . 26
9 Network layout for the simulation . . . . . . . . . . . . . . . . . . 26
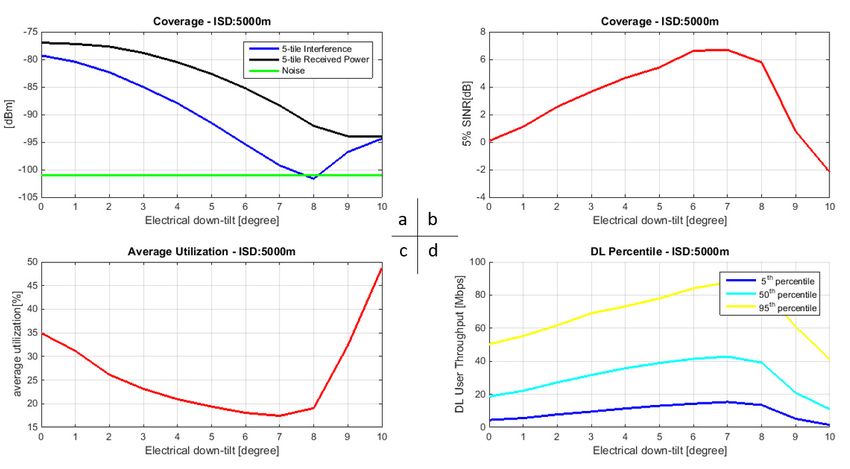
10 DL system performance for different electrical downtilt degrees:
(a) cell-edge user received signal, interference and noise (b) cov-
erage: 5th percentile SINR (c) 5th percentile utilization (d) ca-
pacity: user throughput. . . . . . . . . . . . . . . . . . . . . . . . 30
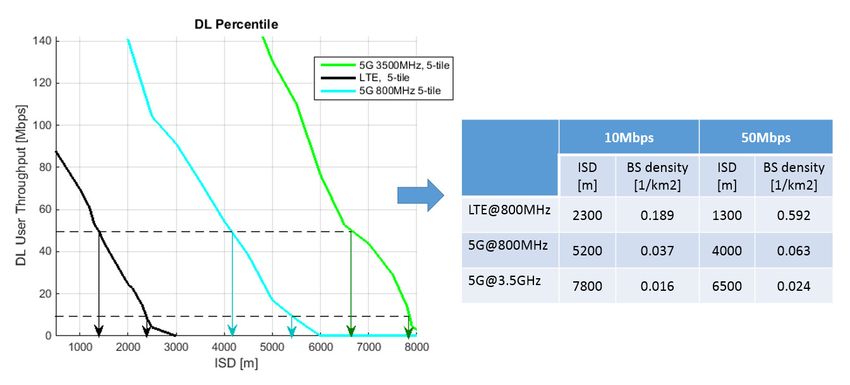
11 5th, 50th and 95th percentile DL user throughput vs. ISD under
area traffic demand in 2015 . . . . . . . . . . . . . . . . . . . . . 32
12 Energy performance of baseline LTE system . . . . . . . . . . . . 33
13 DL system performance of 5G@3.5 GHz networks with different
antenna array structures . . . . . . . . . . . . . . . . . . . . . . . 34
14 DL system performance comparison of systems operating at dif-
ferent frequencies with same antenna structure . . . . . . . . . . 35
15 DL system performance comparison of systems operating at dif-
ferent frequencies with different number of elements packed in
similar antenna area . . . . . . . . . . . . . . . . . . . . . . . . . 37
16 Case study 1 - hardware upgrade in existing networks . . . . . . 38
17 5th percentile DL user throughput vs. area served traffic for
different systems in case study 1 . . . . . . . . . . . . . . . . . . 39
18 Energy performance of different systems in case study 1 . . . . . 40
19 Break-even cost of upgrading in case study 1 . . . . . . . . . . . 41
20 Time of return analysis in different energy pricing regions . . . . 42
21 Result of running network re-dimensioning under traffic and per-
formance requirement for 2021 . . . . . . . . . . . . . . . . . . . 43
22 Energy performance of different systems in case study 2 . . . . . 44
23 Economic Pros and Cons analysis of 5G greenfield solutions . . . 44
24 Result of break-even cost in case study 2 . . . . . . . . . . . . . . 45
25 Comparing ITU Indian rural model with uniform user distribution 51
26 Sanity check of locating 80% users indoor . . . . . . . . . . . . . 52
IXList of Tables
1 Parameter of UE model in rural environment . . . . . . . . . . . 23
2 Traffic essential from Ericsson Mobility Report 2016 [1] . . . . . 24
3 Ratio of devices . . . . . . . . . . . . . . . . . . . . . . . . . . . . 24
4 Result of traffic modeling in rural scenario . . . . . . . . . . . . . 25
5 Traffic and performance requirement in rural scenario . . . . . . 28
6 Simulation assumptions . . . . . . . . . . . . . . . . . . . . . . . 29
7 Optimal tilt for different inter-site distances . . . . . . . . . . . . 31
8 Requirements for running network dimensioning of baseline de-
ployment . . . . . . . . . . . . . . . . . . . . . . . . . . . . . . . 31
9 Size of antenna in different systems . . . . . . . . . . . . . . . . . 36
10 Antenna structure and antenna size in each systems . . . . . . . 36
11 Requirements for running network re-dimensioning . . . . . . . . 42
12 Experiment design for sanity check of indoor users locating . . . 52
13 Energy performance of extensions in LTE network . . . . . . . . 53
XList of Acronyms
2G second generation
3G third generation
5G fifth generation
APC area power consumption
APRU average revenue per user
BS base station
CAPEX capital expenditures
CDF Cumulative Distribution Function
DL down-link
DTX discontinuous transmission
E3 F energy efficiency evaluation framework
EARTH Energy Aware Radio and netWork TecHnologies
EU European Union
FDD Frequency Division Duplex
ISD inter-site distance
LTE long term evolution
MIMO Multiple Input Multiple Output
NGMN Next Generation Mobile Networks Alliance
OPEX operational expenditures
RB resource block
RF radio frequency
RX receiver
SNR signal to noise ratio
SINR signal to interference plus noise ratio
TDD Time Division Duplex
TTI time transmission interval
TX transmitter
UE user equipment
UL up-link
XI1 Introduction
“5G is an end-to-end ecosystem to enable a fully mobile and connected society.
It empowers value creation towards customers and partners, through existing
and emerging use cases, delivered with consistent experience, and enabled by
sustainable business models.”
– NGMN 5G Vision [2]
Fifth generation (5G) network is the next step of revolution in mobile communi-
cation and will be a fundamental enabler of a better connected networked soci-
ety. By supporting new protocols, new users, new devices and new applications,
it promises an evolved platform for information sharing to anyone/anything any-
time and anywhere [2]. However, this greatly increases the requirement on the
network capacity and performance. According to the EU project METIS-II
D1.1 [3], mobile data traffic is foreseen with a thousandfold increase in 2020
compared with traffic in 2014, and subscribers will be expecting 50Mbps as user
experienced data rate essentially everywhere. The network operators need to
provide services with performance guaranteed for all use cases under different
network scenarios. One challenge comes in network operating in rural areas.
Because of low potential revenue in rural areas - only $262 per square mile in
rural areas compared with $248,000 per square mile in urban areas [4], it be-
comes a headache problem for network operators to serve the rural areas: How
to cover large service areas with sparse network infrastructure and to meet the
ever increasing demand in massive capacity and high end user data rate?
Besides improved requirements on performance and capacity, 5G vision also
promises socio-economic transformations of mobile communication networks in
multiple aspects. Energy-efficient is one key target in those transformations for
sustainability and well-being of global mobile networks. Today, the energy costs
to run a mobile network are for some operators comparable with personnel costs
[2, 5]. This drives network operators to look for energy-efficient and highly cost
effective solutions. New technical components introduced in future 5G network,
including UE (user equipment) specific beamforming and ultra-lean design of
the system, were proved to be a promising enabler to gain significant energy
saving (when still satisfying performance requirement) in superdense and dense
urban scenarios in previous work [6]. However, little related work was found
to evaluate the effect of those state-of-art technologies in capacity enhancement
and energy performance targeting suburban and remote rural areas.
This thesis focuses on the energy- and cost-efficiency potential of 5G to offer in
rural areas. We investigate achievable energy saving in both areas with exit-
ing network grids and areas without any internet connectivity in rural scenario.
While cell densification is promising for boosting capacity in future urban en-
vironment, it is a more complicated dilemma in the rural case. Wide coverage
solutions as well as flexible, energy and cost efficient solutions need to be found
to provide ubiquitous coverage in rural areas and, at the same time, to meet
the ever-increasing traffic demand in future wireless network.
11.1 Background
Ever since the introduction of mobile wireless service, the group of mobile service
users is extending with an inconceivable trend on the global map. According to
Ericsson Mobility Report 2016 [1], worldwide mobile subscription has reached
7.3 billion in 2015 and the forecast of total mobile subscription in 2021 is 9.1
billion, almost at the same level of world population forecast in 2021. A great
enabler of this trend is the future 5G network, which is proposing a “fully
connected society” with new application for all kinds of devices, with the vision
of providing unlimited access to information and sharing of data anywhere and
anytime for anyone and anything [7].
However, the fact is not as optimistic as this vision. According to GSMA global
mobile economic report 2015 [8], at the end of 2014, mobile operators reached
approximately 85% of the global population, and most of the still unconnected
population live in rural areas. Even in rural areas with mobile access to the
internet, for example in rural Indian, people are still struggling to stay socially
connected by 2G voice calls, SMS-es and “missed calls” [9]. “3G never really
took off in rural Indian”, concluded by [9], because of economic reason of low
low average revenue per user (ARPU) in rural scenario and operating difficul-
ties to provide good quality service with high data rate. It is challenging to
provide a consistent user experience with high quality and the capacity as well
as functionality of network in rural areas. As can be observed, the rural areas
is becoming the obstacle of global mobility and the 5G vision.
1.1.1 Why Focus on Rural Areas
A cross-nation study of mobile broadband affordability in ethic perspective [10]
pointed out that affordable broadband internet connectivity should be consid-
ered as a vital aspect in social justice and 5G is at the danger of losing its
next million users entirely without affordable wireless access [11]. It is widely
observed in global map the close relation of internet connectivity gap and GDP
growth gap between urban and rural communities. The rapid growth in internet
connectivity and mobile internet access has accelerated the economic boost in
the urban communities around the world, and it in turns leads to improvements
in public service sectors, such as education, health, and banking, and attract
investment in business and industrialization, which motivates further develop-
ment of the region [11]. Thus there is an urgent need for continuous efforts
from governments and information and communication community to devote
in development of mobile broadband access network and related researches to
connect the remote rural areas.
1.1.2 Benefits, Ethics and Sustainability
• Benefit on the road towards 5G
5G network promises a vision of high data-rate experience at any time
anywhere. As shown in previous session, the rural area is the bottleneck
of geometry availability, which raises an urgent need for researches and
studies especially targeting deployment problems in rural scenarios.
2• Social justice
Affordable mobile access to internet in all areas is considered to be one
important component of social justice that cannot be compromised due to
economical reasons, just as the equal rights to other important resources
for everyone like water, electricity and education. Low revenue per user
in rural area compared with case in urban scenarios has been dragging
down the development of mobile network in rural areas for years. With
growing attention and support from governmental and academical filed,
the goal of this thesis is to motivate network operators to better drive
network development in rural areas, by proposing and evaluating cost-
efficient solutions targeting rural scenario.
• Environmental friendly and sustainable development
Energy consumption and carbon-dioxide (CO2 ) emission level have be-
come important KPI in design and evaluation of wireless access network.
This thesis focuses on the energy efficiency of system-level solutions to
operate wireless network in rural area, following the framework of energy
efficient network design proposed in [5], answering the call for sustainable
and environmental friendly development.
1.1.3 Challenges and Obstacles
• Lack of infrastructure
Due to the reasons described in previous subsection, the development of
wireless network in rural areas is left far behind in reality. Network condi-
tions in rural areas, especially the sparse network infrastructures, created
obstacle to meet ever-increasing capacity demands of the users. Because of
the low user density as well as low ARPU compared with urban scenario,
cell densification is not a good option to overcome coverage and capacity
problem in rural scenario.
• Lack of use cases for rural scenario in standardization projects
The discussion of the rural access problem [12] has been missing from the
concern list in many recent projects of 5G network standardization. The
authoritative 5G white paper published by the Next Generation Mobile
Networks Alliance (NGMN) [2] concluded many use cases for urban sce-
narios in future evolution, but offered little for rural scenarios. Specific use
cases and simulation models for rural scenario are also missing in METIS-
II (Mobile and wireless communications Enablers for the Twenty-twenty
Information Society-II) D2.1 deliverable document [13].
• Lack of interest on rural studies
There is also an imbalance in the quantity and scope of research in perfor-
mance analysis of radio network deployment targeting dense urban, urban
and rural areas. The majority of studies focus on the analysis of advanced
technologies of 5G network in urban scenarios, however, different limi-
tation applies in rural scenarios, which may invalidate some conclusions
from urban case study. User density in rural areas is much lower com-
pared with urban areas, and user distribution cannot be considered as
3uniform distribution. Coverage problem needs to be taken of, with the
minimum data rate requirement satisfied at the same time. Thus it is vi-
tal to investigate network deployment solutions and evaluate the network
performance, especially energy-efficiency and cost-efficiency on a realistic
rural environment setup.
1.2 Previous Work and Research Gaps
To provide a general review of achievements in the topic area, this session in-
cludes related researches and projects aiming to address energy efficiency issue,
previous attempts on utilizing 5G technologies to derive energy efficient solu-
tions, as well as relevant studies on rural areas and finally the research gap that
motivates this thesis.
1.2.1 Main Projects and Activities on 5G
Standing on the threshold of a generation shift in communication world, enor-
mous efforts have been made from both ICT community and industry promot-
ing 5G network. Regional programs and activities, for example the EU project
METIS-II and alliances like NGMN, are working actively to develop the overall
5G radio access network design and to provide scenarios and use cases to illus-
trate and tackle key challenges faced on the road towards “a connected society”.
According to a study on 5G activities [14], enormous performance improvements
are expected out of 5G network from its key technical enhancement in more flex-
ible spectrum usage (enhanced carrier aggregation, spectrum sharing, new spec-
trum beyond 6GHz), evolved multi-antenna technologies (massive MIMO [15],
UE-specific beamforming) and network densification (small cells [16], device-to-
device communication [17]).
From the industry with strong 5G R&D initiatives, Ericsson [7], Huawei [18],
Samsung [19] and Nokia [20] also published white papers identifying their vision
and requirements of 5G network, and presenting key technical components to
enable new features, i.e. Internet of Things (IoT) and Everything on the Cloud.
Traffic forecast and service requirement for system-level simulation is carefully
chosen in this thesis based on the performance and traffic requirements from
the industrial 5G white papers.
1.2.2 Studies on Energy-Efficient solutions
As a response to the rising attention on energy efficiency issue, various energy-
efficient solutions were investigated based on energy efficiency evaluation frame-
work proposed by EU green projects in recent years. For example, the EARTH
energy efficiency evaluation framework (E3 F) proposed in [21] provides the base
station (BS) power model and the long-term large-scale traffic models, which
served as a basis to realistically evaluate the energy-efficiency of LTE networks
over large geographical regions, including both urban and rural areas.
On the methodology level, [5] presented a framework to design and evaluate
performance of system-level energy-efficient solution for wireless network and
4proposed a cost evaluation framework for the viability of energy efficient solu-
tions, which are adapted and used in this thesis.
Some LTE extension technologies were investigated to reduce energy consump-
tion. [22] presented antenna muting and psi-omni technology as energy saving
solution in LTE network and observed maximum 45% energy saving traded with
10% lost in performance in low traffic mode. A system-level evaluation on ef-
fect of different degree of antenna tilt in LTE mobile network [23] shows 13%
improvement in energy efficiency when optimal electrical tilt is applied.
With growing focus on socio-economic transformations of ICT industry, more
energy-efficient technologies are exposed in 5G evolution. Authors of [24] showed
the enormous potential of cell discontinuous transmission (DTX) technology in
energy saving for dense network with low cell load. Authors of [15] studied
the improved energy performance of Beamforming when incorporated with cell
DTX and the study [6] provided a concrete numerical report of energy saving
capacity of 5G network simulated in an Asian city scenario.
1.2.3 Low Attention on Cost-Efficiency
Compared with efforts on energy-efficiency analysis, cost-efficiency issue is com-
monly ignored in recent investigation of 5G solutions, for example, none of
fore-mentioned attempts included a session of cost evaluation. One investiga-
tion in cost-efficiency was conducted in ultra-dense LTE network, presented a
minimized-cost solution in the trade-off of energy and infrastructure cost [25].
However, with bottleneck of low revenue, the potential investment in network
deployment in the rural areas is comparatively limited, which makes it more
sensitive to the total cost and thus cost-efficiency of deployment solutions is
considered as one of the most important issue in this thesis.
1.2.4 Rural Studies
With raising attention in promoting ICT industry to provide connectivity to
next billions of the world, a number of studies have been done focusing on
problems and challenges to provide services in rural areas. Authors of [9, 11]
provide a view from rural Africa and rural Indian respectively, pointing out
that the economical drawback is the key reason of stagnant situation of the
development and update of mobile broadband network, and more importantly,
the urgency of developing low-cost solutions to provide mobile access in rural
areas in future wireless network.
Although, as mentioned in section 1.1.3, the rural areas has been, to some
extent, ignored by the majority of 5G researches and projects, International
Telecommunication Union (ITU) and the EU project METIS-II offered some
building blocks to simulate and study 5G design in rural scenario: ITU proposes
the ITU Indian rural model [26] with characteristic of village-based clustered
user distribution, which serves as one vital building block of rural environment
in this thesis. METIS-II D1.1 [3] includes rural scenario in UC3 Broadband
Coverage Everywhere in which KPIs and requirements of 5G network to offer in
scarcely populated areas are defined. METIS-II D2.1 [13] provides a deployment
5setup for rural macro deployment scenario for system-level simulation.
In conclusion of previous works, there is a lack of studies in the area of utiliz-
ing 5G in rural areas to enable cost- and energy-efficient solutions to provide
ubiquitous coverage. Moreover, a realistic rural environment model is needed
to validate the system-level evaluation and analysis of the rural use case. All
of those will be included in this thesis project, together with a system-level
evaluation of the energy performance and the total cost of systems.
1.3 Problem Formulation
Based on the challenges and problems described in previous sessions, the re-
search question this thesis aims to answer at the end of the work is:
How can 5G enable energy- and cost-efficient solutions in rural areas
to compensate for the economic drawback of low ARPU, and at the same
time provide good quality service for users that meets essential performance
requirement?
Based on this main goal, more specific research questions are defined as follow-
ing:
1. How can LTE provide ubiquitous coverage in rural areas, and Q1: how
much energy does this LTE network consume?
2. How the key technology components of 5G, i.e. Beamforming and ultra-
lean design, can enable economically sustainable rural coverage?
Brownfield If all the LTE sites are replaced with 5G sites:
Q2: How much energy 5G can save through energy-efficient solutions?
Q3: What is maximum acceptable price for a technical rollover to 5G
in existing LTE networks and it still brings total cost saving during the
network lifetime to deploy hardware upgrade solutions?
Greenfield In futuristic network planning for rural areas, if we trade the
performance gain of 5G solutions with coverage extension:
Q4: How much energy 5G can save through clean-of-state energy-efficient
deployments?
Q5: What is maximum acceptable price for a 5G base station (BS) and it
still makes profit during network lifetime to deploy 5G greenfield energy-
efficient solutions?
1.4 Methodology
To answer the research questions stated in problem statement, this thesis inves-
tigate the realistic deployment problems in rural areas based on the framework
proposed in [5] to design and evaluate system-level energy-efficient solutions
in wireless networks. As discussed in [27], it always gives misleading results
if energy-efficient solutions are derived based on maximizing a chosen energy
6efficiency metric, for example the “most popular energy-efficiency metric” -
bit/Joule. To obtain valid and reliable results, this thesis chooses the method
of numerical study based on system-level simulations.
• Quantitative Experimental Research method [28] is used in this thesis to
establish the system with concerned features to study causes and affects
among dependent variables in the network and its environment. Analytical
Research method [28] is applied on the findings of established systems to
make critical evaluations based on system performance evaluation models,
to study the trade-off problem and aid the decision making for solutions.
• To derive energy-efficient and cost-efficient solutions, Experiments [28]
is used as data collection method to quantitatively evaluate the energy
performance and cost performance, represented by the total power con-
sumption and the total cost of the system respectively, of various designed
systems with identified deployment that meets the traffic and performance
requirements and derive one solution with the minimum total energy con-
sumption or total cost.
• Computational Mathematics [28] is used as data analysis method. En-
ergy saving of each system-level solution is quantitatively calculated with
respect to a baseline deployment that is assumed to be an LTE system
providing service under current traffic and performance requirement.
• The simulation is carried out using an internal Ericsson state-of-the-art
radio access network (RAN) simulator written in Matlab.
1.5 Delimitation
Alternative deployment is not included in the scope of this thesis. We consider
hexagonal cells to simplify the system-level evaluation framework and to focus
on the energy-efficiency and cost-efficiency performance of 5G solutions in rural
scenario.
1.6 Outline
The structure of this thesis is arranged as following: Chapter 2 briefly introduces
the two key technical components considered in 5G wireless networks; Chapter
3 introduces the methodological structure this thesis applies and specific mod-
els used to perform energy-efficiency and cost-efficiency evaluations; Chapter 4
mainly explains how we model the rural environment and includes other system
models used in simulations. Chapter 5 describes the simulation cases and simu-
lation setup. Simulation results are presented in chapter 6 with comparison and
analysis. Finally, the key conclusions of this thesis are summarized in chapter
7 together with a discussion of possible future work.
72 A Overview of 5G Technologies for Rural Ar-
eas
We are stepping into a new age of mobile communication where everything is
expected to be connected: high speed information sharing shall be enabled be-
tween all kinds of devices, i.e cell phones, tablets, smart watches and wearables,
at anytime and no matter where we go. Thus, to meet the ever-increasing user
demand in high data rate service with seamless connectivity, 5G wireless access
must extend far beyond the previous generations of mobile networks with rev-
olutionary solutions utilizing new radio access technologies. In [7], 5G wireless
access is defined as “a overall wireless access solution” to handle various require-
ments and demand that faced by mobile service beyond 2020. other than just
some new technologies. The new capacities and requirements of 5G wireless
access are summarized as [7]:
• Massive system capacity
• Ultra-high availability
• High data rate guaranteed service everywhere
• Low device cost and energy consumption
• High network energy performance
In general, the overall 5G wireless access solution consists of two key compo-
nents: the backwards compatible LTE extensions operating on existing spec-
trum, and the new radio access technology initially targeting new spectrum
above 6GHz for large bandwidth availability [7]. In this thesis, we include two
key technical components of 5G wireless access in our 5G energy-efficient solu-
tions, which are (1) UE specific beamforming (2) ultra-lean design, to investigate
the incorporated effect of those two technologies in end-user performance and
system energy-efficiency and cost-efficiency.
2.1 UE Specific Beamforming
One key character that distinguish 5G wireless access from previous generations
is “high frequencies above 6GHz”. Operation over higher frequencies exposes
challenges of worse propagation environment with increased free space path loss
and building penetration loss, however it also creates significant opportunities
to better utilize advanced antenna technologies. When going for higher frequen-
cies, the size of corresponding antenna element becomes smaller, which brings
great potential to pack more antenna elements in small antenna area [29] and
enable the forming of narrower beams in signal transmission, which makes it
easier to steer the beam to intended user to maximize useful signal strength and
reduce interference to other users. That is the basic idea behind UE specific
beamforming. A simplified model is included here to illustrate the mapping of
antenna pattern to the beamforming gain as following
Asphere 16
gM B = = (1)
Amain beam sin θ sin ϕ
8in which the beamforming gain gM B within the main beam is determined by
azimuthal half-power beam-width θ and elevation half-power beam-width ϕ, as
shown in Fig.1b. Antenna gain for area outside the main beam is denoted as
gSB , which is considered to be very low. As can be observed in Eq.(1), the
beamforming gain increases significantly while the signal beam get narrower.
(a) UE specific beamforming (b) Elliptical area antenna pattern
Figure 1: Concepts of UE-specific beamforming
In this thesis, the beamforming gain is applied through a grid-of-beams (GoB)
beamforming model proposed in [6]. The beam grid is created by applying
azimuth DFT vectors over the antenna rows and elevation DFT vectors over
the antenna columns. As concluded in [6], the beam is selected based on the
highest beamforming gain thus the beamforming gain of a candidate beam in a
give cell can be calculated through Eq.(2).
g = wH Rw (2)
in which w and R denote the candidate beamforming weight vector and the
channel covariance matrix between the BS antenna elements and the first an-
tenna in the UE respectively. A mapping of antenna structure setup to the
beamforming gain in GoB model was observed in previous researches, which
shows that the GoB beamforming gain increases linearly with the number of
antenna array, reaching 5-6 dB with 4 antenna arrays and 8-9 dB with 8 an-
tenna arrays.
2.2 Ultra-lean Design
Besides expectations on high system capacity and vast connectivity, another
important requirement raised upon 5G wireless network focuses on system ef-
ficiency and network energy consumption. As a matter of fact, not all signals
transmitted though network are used for user data transmission. By minimizing
any transmissions not directly related to the delivery of user data [7], such as
synchronization signals and various system and control information, an ultra-
lean design of 5G network not only helps to extend the benefit of beamforming
by replacing the broadcast that cannot be utilized by UE specific beamforming
9with dedicated signaling [29] , it also contributes to a higher level of energy
saving when applying cell DTX technology.
With cell DTX technology, a BS can be put into sleep mode when there is no
data to transfer to reduce idle time power consumption [24]. The basic approach
is to disable some components that are not needed. Since in cell DTX technology
the cell is not completely switched off in sleep mode, the sleep capacity of a eval-
uated system is highly related to its consecutive empty transmission duration,
denoted as DTX duration. Due to comparatively large amount of mandatory
signals in LTE system, its DTX duration is below 0.2 ms [7], which prevents cells
from long and deep sleep. Thus the cell DTX factor in LTE systems is generally
estimated as 0.84. With ultra-lean design in 5G systems, the DTX duration is
significantly extended, as a result of minimizing non-user-date transmission, to
around 100ms [29]. Thus cell DTX factor in 5G systems is improved to 0.29.
The cell DTX factor basically represents the energy saving capacity in reducing
idle mode transmission power consumption through cell DTX technology and by
incorporating the cell DTX factor into power consumption models, the impact
of ultra-lean design in 5G wireless networks is modeled and included in system
simulations.
103 Energy and Cost Performance Evaluation Method-
ology
This section includes the framework of system performance evaluation applied
in this thesis, models used to evaluate energy and cost performance of systems,
and the methodology to define energy- and cost-efficient solutions of candidate
systems in rural scenarios.
3.1 System-level Performance Evaluation
To provide realistic assessments of the energy efficiency of designed systems in
the rural scenario on the long term, the widely used EARTH energy efficiency
evaluation framework (E3 F) [21] is adopted in this thesis. Based on the global
E3 F framework, the network-level assessment report of is generated with two
components:
• Short-term small-scale evaluation [21] of all deployments in the rural envi-
ronment, which provides a set of results of network performance including
cell utilization, user throughput ,et al. over a variation of offered traffic
in the rural scenario.
• Long-term large-scale traffic model [21] that gives daily traffic profile in
the rural scenario, in terms of hourly served traffic in the range of 24
hours. The long-term traffic profile is generated by applying daily traffic
variation profile [30] to the peak traffic demand in the rural scenario.
With traffic demands at each hour corresponding to certain load points, or in
other words the utilization statuses in the system, a daily report for each perfor-
mance metric is generated by weighted summing of the short term results [21].
Figure 2: Methodological framework of system-level evaluation
11Network evaluation of small-scale deployments is carried out by system-level
simulations in this thesis. The methodological framework of system-level eval-
uation is illustrated in Fig.2. To obtain more reliable and realistic evaluation
results of systems in the simulation, following blocks are included in the simu-
lation framework:
• Feasible load model [24]
As proofed in the urban scenario [6], the incorporated effect of UE-specific
beamforming and cell DTX in energy saving is mainly benefited from
longer and more effective sleep. UE- specific beamforming greatly boost
cell performance, triggering more effective transmission and leading to
lower load level of the system, which is further utilized by cell DTX tech-
nology in reducing total power consumption. To evaluate this incorpo-
rated effect of 5G technologies in power consumption of the systems in
rural scenario, the feasible load model is included in the internal loop of
system-level simulation in this study.
• Daily traffic variation
Daily traffic variation is a statistical traffic profile presented in INFSO-
ICT-247733 EARTH Deliverable D2.3 [30] to describe traffic demand fluc-
tuations of a network over a day based on internal surveys on operator
traffic data within the EARTH project. It is included in energy perfor-
mance evaluation to obtain more precise estimation of daily average power
consumption of designed systems.
3.2 Energy Performance Evaluation Methodology
One key merit in the expected outcomes of the system-level evaluation is the
energy performance. In the discussion of how to measure energy efficiency on
the design of energy-efficient wireless networks, the traditionally well-accepted
energy efficiency metrics, for example the bit/Joule value, are shown to be in-
adequate for network-level simulations [6]. It could even mislead the decision
making unless requirements on network capacity and coverage are carefully de-
fined [27]. Thus, in this thesis the energy efficient design is not selected based
on a single criteria of maximizing one chosen metric. Instead, we follow the
framework proposed in [5] to design and evaluate system-level energy-efficient
and cost-efficient solutions in wireless networks.
In this sub-session, we introduce the power consumption models used to eval-
uated the energy performance of LTE systems and 5G systems respectively.
Following the energy-efficient network solution evaluation framework [6], the
energy performance of evaluated systems is defined as the daily average area
power consumption, denoted by kW/km2 .
3.2.1 Power Consumption Model for LTE Networks
The EARTH power model [21] is used in this thesis to evaluate the base station
power consumption of LTE systems. The linear expression of the BS power
12consumption [6] is
∆p Ptx + P0
if the BS is transmitting (active)
LT E
PBS = NT RX P0 if the BS is transmitting (active) (3)
δP0 if Ptx = 0, with cell DTX
where NT RX stands for the total number of transceivers and Ptx represents the
transmit power per transceiver. Here δ denotes the cell DTX capacity of LTE
networks, with 0 < δ < 1.
Based on the status of the BS considered in the calculation, the BS power
LT E
consumption PBS can be divided into two parts:
1. The baseline power consumption P0 that stands for the power consumption
caused by, i.e, site cooling and signal processing, which occurs despite that
the BS is transmitting or not.
2. If the BS is transmitting, the transmission power Ptx is added to the total
power consumption. This part of power consumption is also defined as
traffic load dependent power consumption, in which ∆p denotes the slope
of the transmit power dependent power consumption caused by feeder
losses and the power amplifier [21].
3.2.2 Power Consumption Model for 5G Networks
The power consumption model proposed in [6] is adopted in this thesis to evalu-
ate the BS power consumption of 5G networks. The applied model is generated
based on the power models in [31, 32] and used for power consumption evalua-
tion of 5G-NX1 systems considering the effect of large amount of active antenna
elements in massive Beamforming technology and the impact of ultra-lean de-
sign of the system. The expression of the BS power consumption in 5G system
is given as
Ps
ε + N Pc + PB if Ptx > 0
tx
5G
PBS = N s PB if Ptx = 0, without cell DTX (4)
δPB if Ptx = 0, with cell DTX
where Ns and N denotes the number of sectors in each site and number of RF
s
chains respectively. Ptx represents the transmit power per sector and ε stands
for the power amplifier efficiency in 5G systems. To include the impact of
massive Beamforming, additional power due to digital and RF processing Pc is
added to the BS power consumption on per antenna branch basis. The baseline
power consumption per sector is denoted as PB , and δ here represents the cell
DTX capacity of 5G systems, with 0 < δ < 1.
1 5G-NX is defined in Ericsson 5G white paper [7] representing the non-backwards com-
patible air interface in 5G, which targets new spectrum over 6GHZ. However the power con-
sumption model described here is used in this thesis for 5G system both above and below
6GHZ.
133.2.3 Feasible Load Model
It is commonly known that a BS is not always active throughout a day, espe-
cially in low-traffic scenarios such as in the rural areas. Thus, it is necessary to
derive the cell utilization profile of the system, which also represents the prob-
ability of that the BS in each cell is transmitting, to generate a realistic power
consumption report of the system on the long run, as the BS power consumption
varies greatly between in transmitting and idle mode. The feasible load concept,
defined as ’the fraction of time-frequency resources that are scheduled for data
transmission’ in [24], is included in this thesis in the system-level simulation to
stress the impact of activeness of the base stations in the evaluated networks in
the power consumption evaluation.
A simple explanation of feasible load model is as following: Considering an
OFDM network with M number of BSs covering a fixed area of A serving N
users, the number of users connected to BS k is Nk and the traffic demand of
user i is assumed to be Ωi . The feasible load ηk of BS k in the observation time
T can be expressed as a function of data rate ri of user i for Nk users
PNk
Ωi /ri
ηk = i=1 (5)
T
The user data rate can be derived from the average signal to interference plus
noise ratio (SINR) γi of user i for all Nk users
ri (γi ) = WRB min[log2 (1 + γi ), νmax ] (6)
in which WRB denotes the bandwidth of one resource block (RB) and νmax
represents the maximum spectrum efficiency in practice.
In a complex interfering network, the SINR γi of user i in cell k is affected
by the total perceived interference from all other cells, which is related to the
activeness of all other BS. If we define the whole network load as a vector [24]
η = (η1 , η2 , ..., ηM ), where ηi ∈ [0, 1], the SINR γi of user i in cell K can be
expressed as
gM B gik Pk
γi (η) = PM (7)
j6=k ηj gSB gij Pj + N0
where Pk and gik denote the transmit power of BS k and the link gain between
BS k and user i respectively; And N0 reflects the noise power. The beamforming
model is incorporated here in the system model by applying beamforming gain
gM B and antenna gain outside the main lobe gSB in Eq.(7)
As can be noticed by combining (5)(6)(7), there is a coupling relation of network
load η and user perceived SINR γ in the network. Thus the entire network
feasible load η can be derived by solving the fixed-point equation of η
Nk Nk
1X Ωi 1X Ωi
ηk = = gik Pk
(8)
T i=1 ri (γi (η)) T i=1 WRB min[log2 (1 + PM ), νmax ]
j6=k ηj gij Pj +N0
With the entire network load η, we get the cell utilization (BS activeness)
profile of the evaluated networks which can be used to assess daily average
power consumption in the network.
143.2.4 Daily Average Area Power Consumption
It is a common experience in the real life that the traffic condition of the net-
work varies greatly among different periods of a day. As captured in the daily
traffic variation profile [30], which presents a general trend of the traffic demand
fluctuations of a network over a day, the traffic volume of the network during
the peak hour (normally around 9PM - 11PM of a day) could be 6 - 8 times
heavier than during the idle time (normally around 4AM - 8AM of a day). The
fluctuation in traffic volume leads to different network load conditions and re-
sults in variations in network energy consumption during 24 hours of a day.
Thus, daily average area power consumption [6] merit is applied in this thesis
to evaluate the energy performance of designed networks.
Daily average area power consumption describes the total power consumed
throughout a day by the evaluated network to cover a service area Atot and
is defined as
P24 PNBS t t
1 t=1 i=1 Pactive ηi + Psleep (1 − ηi )
Parea = (9)
24 Atot
where NBS denotes the total number of BSs of the network, ηit reflects the
probability of that the BS i is transmitting during the given hour t, which can
be derived as the resource utilization of BS i in hour t from the network load η
in the fore-mentioned system feasible load model.
In Eq.(9) Pactive and Psleep represent the power consumption of a BS in trans-
mission mode and in sleep mode respectively. By combining with the power
consumption model for LTE and 5G networks in Eq.(3) and Eq.(4), the Pactive
and Psleep in Eq.(9) can be substituted by following values for LTE networks
and for 5G networks (with cell DTX capacity ) respectively:
LT E LT E
Pactive = NT RX (∆p Ptx + P0 ) Psleep = NT RX δLT E P0 (10)
s
5G Ptx 5G
Pactive = Ns ( + N Pc + PB ) Psleep = Ns δ5G PB (11)
ε
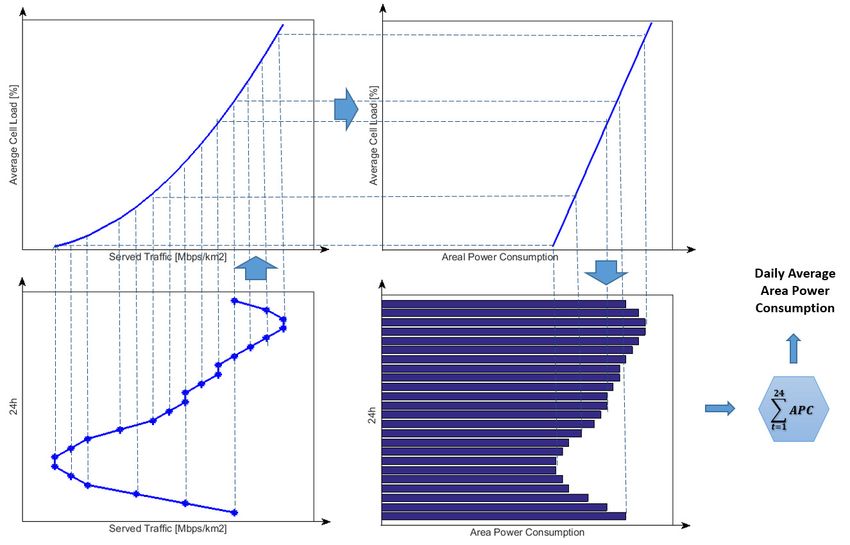
To visualize the process of mapping the daily network served traffic profile to the
daily average area power consumption of the network, the steps are summarized
as following:2
1. A daily traffic profile is generated based on the peak hour traffic demand
in the rural scenario and the daily traffic fluctuation profile.3
2. Based on the result of system-level performance evaluation, the hourly
network served traffic is mapped to the hourly utilization profile of the
network .
3. A function is created based on the power consumption models and the area
power consumption model to calculate hourly area power consumption of
2 This mapping is adopted from the long-term traffic model in [33] and modified based on
the E3 F [21] in this thesis.
3 More detailed explanation of the long-term traffic modeling in rural scenario in ses-
sion 4.1.2
15Figure 3: Process to derive daily average area power consumption
the network based on the hourly utilization profile, as shown in upper-right
figure in Fig.3
4. The daily average area power consumption of the evaluated network is
derived by summing up the hourly area power consumption over a day.
3.3 Cost Performance Analysis Methodology
Due to the fact that the main bottleneck of the wireless access network devel-
opment in rural areas lies in the economic drawback of low ARPU, it becomes
a vital problem to investigate the economic viability of network solutions to
be proposed to the network operators in rural areas. It has been studied and
proofed in many user cases that new technologies of next generation network
would greatly enhance the network capacity and performance and lead to con-
siderable energy saving, however this economic gain, in the form of reduction
in annual electricity bills, inevitably comes with a need for new investment for
more expensive equipment or extra cost in network deployments if there is a
need for network densification. In use cases in rural areas where network op-
erators are highly sensitive to the total expenditures versus potential revenue,
a total cost assessment of all the energy-efficient solutions proposed is highly
expected for economical decision making in rural area network planning.
This sub-session introduces the total cost model used to analyze the total cost
of investment of given network solutions, and the methodology for performing
economic viability assessment in order to aid the operator’s decision to identify
that in what circumstances that the extra expenditures required for the pro-
posed energy-efficient solutions could be compensated by the economic benefit
of energy saving.
163.3.1 Total cost Model
A widely adopted total cost of investment model for wireless networks intro-
duced in [34] is applied in this thesis to identify the total cost of investment of
a given wireless network which considers both capital expenditure (CAPEX),
such as investment in the equipment and installation, and operational expendi-
tures (OPEX), such as the cost in energy, spectrum and regular maintenance,
for the whole network.
The linear expression of the total cost of investment Ctot is
N
copex
X
n
Ctot = NBS ccapex + in [e] (12)
n=1
(1 + d)n−1
in which NBS denotes the number of BS required in the proposed network
solution; The model is based on the assumption that one build-up works for N
years of network lifework and CAPEX is a one-time investment in the first year
(n = 1). Thus ccapex and copexn represent the CAPEX of a BS in year 1 and
OPEX of a BS in each year n (1 ≤ n ≤ N ) respectively. d is a discount rate
which takes into account of the impact of two factors in network investment in
reality: one is the decreasing price for the equipment over the years, and the
other is the potential of additional interest earned by postponing the investment
in wireless network. [35]
For simplicity, the annual OPEX copex
n is divided into two parts: the energy cost
per BS in year n — cenergy
n , and all other OPEX per BS in year n — c0 . c0 is
assumed to be a constant in each year during the network lifework N . Thus a
more detailed expression of ctot is as following
N
(1 + d)N − 1 X cenergy
capex n
Ctot = NBS c + c0 × + in [e] (13)
d(1 + d)N n=1
(1 + d)n−1
To incorporate the fore-mentioned energy performance metric daily average area
power consumption Parea into the cost model, the annual energy consumption
is represented by a merge of daily average energy consumption over 24 hours a
day and 365 days a year for all NBS BSs. Based on the assumption that the
unit energy cost is en in [e/kWh], and the area served by a BS is ABS , in which
ABS = Atot /NBS , the total cost of investment can be approximated as
(1 + d)N − 1
Ctot = NBS ccapex + c0 ×
d(1 + d)N
N (14)
X en Parea ABS × 24 × 365
+ in [e]
n=1
(1 + d)n−1
3.3.2 Methodology for Economic Viability Analysis
To identify applicable condition of that those energy-efficient solutions in 5G
wireless network to be proposed to the operators in rural areas is an economi-
cal choice, the methodology for economic viability analysis proposed in [34] is
17adopted in this thesis. To be more specific, the economic viability of an energy-
efficient solution is defined as “the ability to raise income from the energy saving
to cover the additional investment costs required by the solution and to make a
profit during the network lifetime” [34]. In this thesis, the potential total cost
saving may not only from the energy-saving capacity of energy-efficient solutions
but also from reduced overall CAPEX due to the fact that fewer NBS is needed
to serve the same area as a result of performance boost in 5G solutions.
Assuming a basic reference system with the total cost of investment as cref tot , the
ith energy-efficient solution with a total cost of investment citot is economically
beneficial when
i
Ctot
refBeamforming and more advanced cell DTX technologies, there is expected to
be a noticeable reduction in energy consumption caused by faster transmission
and deeper sleep of BSs. However, this gain comes with an additional CAPEX
for BS upgrade. Thus the question this case study hopes to answer is “Q3:
What is maximum acceptable price for a technical rollover to 5G in existing
LTE networks and it still brings total cost saving during the network lifetime to
deploy upgrade solutions? ”.
If the additional CAPEX for a hardware upgrade is assumed to be ∆cup per BS,
in [e], the total additional investment required for the upgrade is ∆cup NBS , in
which NBS is the number of BSs in existing network grids. The cell DTX factor
of old LTE equipment and new 5G equipment are denoted as δLT E and δ5G
respectively. Based on Eq.(15) and Eq.(13), the economic viability condition
of hardware upgrade solution can be summarized in a comparison of the total
energy saving during network lifetime N years and the total additional CAPEX
required by the upgrade, as following
N
X cenergy
n (LT E) − cenergy
n (5G)
NBS ∆cup ≤ n−1
(16)
n=1
(1 + d)
When combined with Eq.(14), a more specific condition is derived. Thus, the
hardware upgrade solution is economically recommended for network operators
when ∆cup satisfies the condition above
N LT E 5G
X en ABS [Parea (δLT E ) − Parea (δ5G )] × 24 × 365
∆cup < n−1
(17)
n=1
(1 + d)
LT E 5G
in which Parea and Parea denote the daily average area power consumption in
the old LTE network without upgrading and the new 5G network after upgrading
respectively, each evaluated under the assumption that cell DTX factor is δLT E
for old network and δ5G for new network.
As an expected result from Case Study 1, the break-even cost [34] of a hardware
upgrade ∆cbup is derived when the equality holds in Eq.(17), which refers to
the point where the total energy cost saving happens to cover the additional
CAPEX required by the hardware upgrade solution. The solved region of Case
1, answering the question raised at the beginning of this sub-session of “How
costly the network upgrade could be and it still makes profit during the network
lifetime to deploy upgrade solutions” is {∆cup , ∀∆cup < ∆cbup }. As can be
observed in Eq.(17), the conclusion will differ under various assumptions of
different values in electricity prices, achievable technical performance cell DTX
in 5G networks and network lifetime expectation.
Case Study 2: Greenfield deployments
In this case study, we assume that a greenfield network operator is faced with
a choice of “LTE or 5G”: Considering a rural area Atot without any previous
deployed networks, whether a 5G deployment or an LTE deployment is more
economical for futuristic networks? With new technical components, 5G net-
work is foreseen to bring performance and capacity burst as well as significant
19You can also read