TAP Facing the low-cost competition - Miguel Gaspar - Universidade Católica ...
←
→
Page content transcription
If your browser does not render page correctly, please read the page content below
TAP
      Facing the low-cost competition

                                     Miguel Gaspar

Dissertation submitted in partial fulfilment of requirements for the degree of MSc in Business
Administration, at the Universidade Católica Portuguesa, June 2015.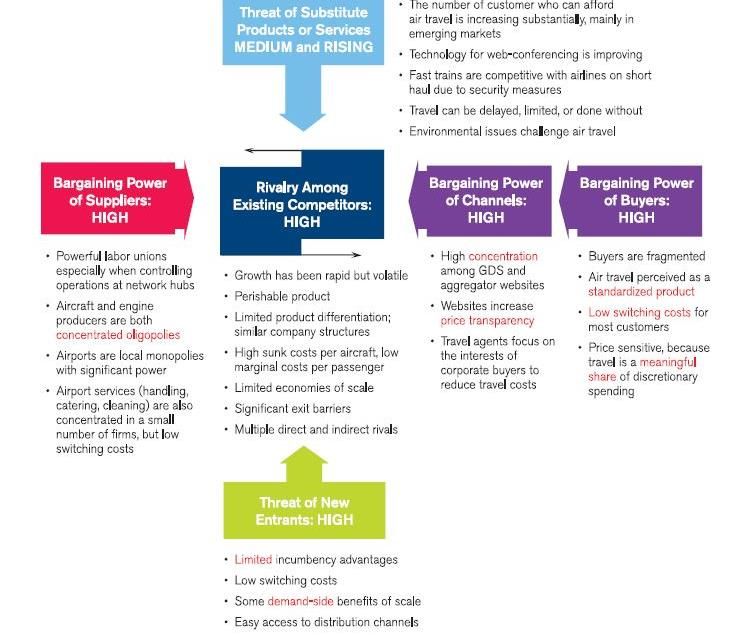
ABSTRACT

Title: TAP – Facing the low-cost competition

Author: Miguel Gaspar

TAP, the Portuguese national airline was founded in 1945, and since then it has been the
predominant airline operating in the Portuguese market. It offers short, medium and long-haul
routes mainly focusing on the European, South American and African territories. However, in
recent years it has been losing market share in the short-haul segment to low-cost carriers, who
continue to penetrate and grow in the Portuguese market.

Due to the liberalization of the European airline market in 1997, TAP, and the other established
airlines at that time, saw major changes in the industry. Within a few years, several low-cost
carriers (LCCs) were able to enter the market and reach leadership positions. Given the current
threat that low-cost carriers pose to TAP, the company has to make a strategic decision on how
to adapt to this kind of competition and how to best react to LCCs. Should it focus its strategy
on differentiating, thus offering a value proposition that is worth paying a premium for? Or
should the company restructure the business and compete with the low-cost airlines on price
terms?

This case study analyses the competition between LCCs and full-service carriers (FSCs) in Europe,
by explaining the differences between the two business models, and the strategies full-service
carriers have followed. The objective of the case is to allow the reader to make an informed
decision regarding the general strategy TAP should choose when competing against LCCs.

Keywords:

Low-cost carrier (LCC), full-service carrier (FSC), airline industry, differentiation, competition,
business model, strategy

                                                                                                 ii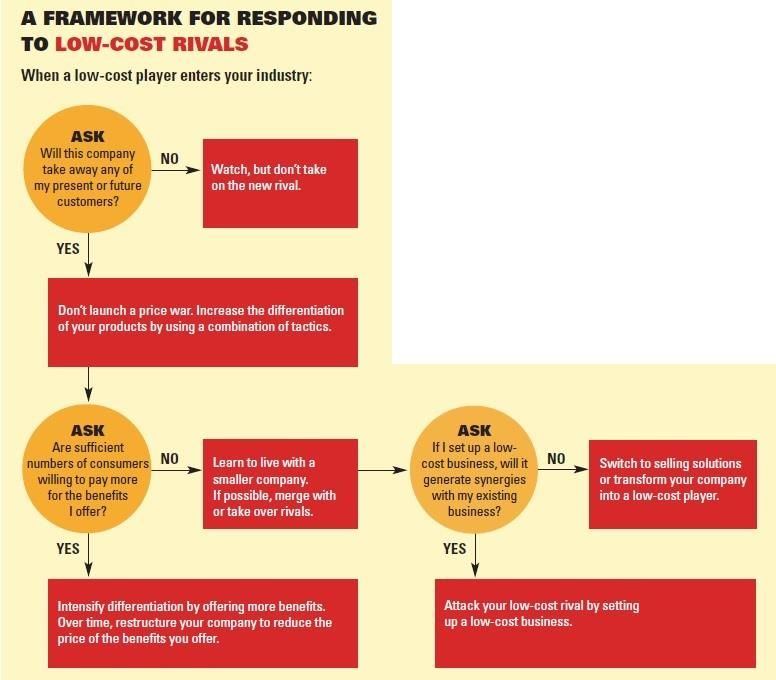
RESUMO

Título: TAP – Competição com companhias aéreas de baixo custo

Autor: Miguel Gaspar

A TAP, companhia aérea nacional Portuguesa, foi fundada em 1945 e, desde então, tem sido a
companhia predominante a operar no mercado Português. Oferece voos de pequeno, médio e
longo-curso, focando-se no mercado Europeu, Sul-Americano e Africano. Contudo, tem vindo a
perder quota de mercado, no segmento de pequeno-curso, para companhias aéreas de baixo
custo.

A TAP, juntamente com todas as outras companhias Europeias existentes na altura,
atravessaram um período de enorme mudança com a liberalização do mercado aeronáutico
Europeu em 1997. Após a liberalização, um elevado número de transportadoras de baixo custo
entrou no mercado e atingiu posições de liderança poucos anos depois. Tendo em conta a
ameaça que as mesmas representam para a TAP, é necessário tomar uma decisão estratégica
relativamente à concorrência com este tipo de transportadoras. Deverá a TAP focar-se numa
estratégia de diferenciação, oferecendo uma proposta de valor elevada? Ou deverá concorrer
com estas companhias em preços?

Este caso analisa a concorrência entre as companhias tradicionais e de baixo custo no mercado
Europeu. Aborda também as diferenças entre os dois modelos de negócio e as estratégias que
as companhias tradicionais têm adotado. O objetivo primordial do caso é permitir ao leitor
efetuar uma decisão informada sobre qual a estratégia que a TAP deverá seguir, para concorrer
com as transportadoras aéreas de baixo custo.

Palavras-chave:

Companhia aérea de baixo custo, companhia aérea tradicional, mercado aeronáutico,
diferenciação, concorrência, modelo de negócio, estratégia

                                                                                           iii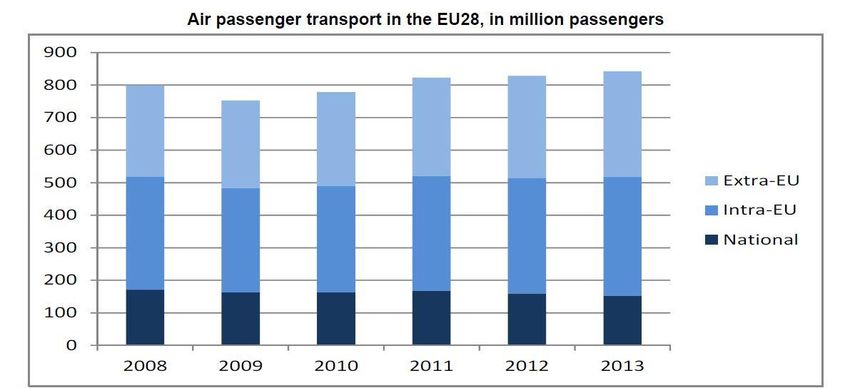
ACKOWLEDGMENTS

The development of my Master’s dissertation would not have been possible without the
contribution of a few people that consistently supported my work.

I would like to start by expressing my gratitude to my parents and brother. Despite their lack of
knowledge on this specific subject they were always present to provide wise words of advice.
Furthermore, their support was vital during my entire life, and without it I would not have
achieved success.

I am also extremely grateful to my dissertation supervisor, João Simão Pires. He always helped
me find a solution and was patient throughout the entire process. His insights provided crucial
guidelines and knowledge that improved the output of my work.

To Católica-Lisbon School of Business and Economics, and all the professors that accompanied
me through my Bachelor’s and Master’s degree. This school received me with open arms,
providing the best means for an exemplary education while opening the necessary doors for my
future career. I could not have asked for a happier and more useful experience.

Finally, I want thank my friends and my girlfriend, with whom I shared my most enthusiastic
moments but also my frustrations. Their support allowed me to keep my motivation high enough
to face the most challenging periods of my academic life.

                                                                                               iv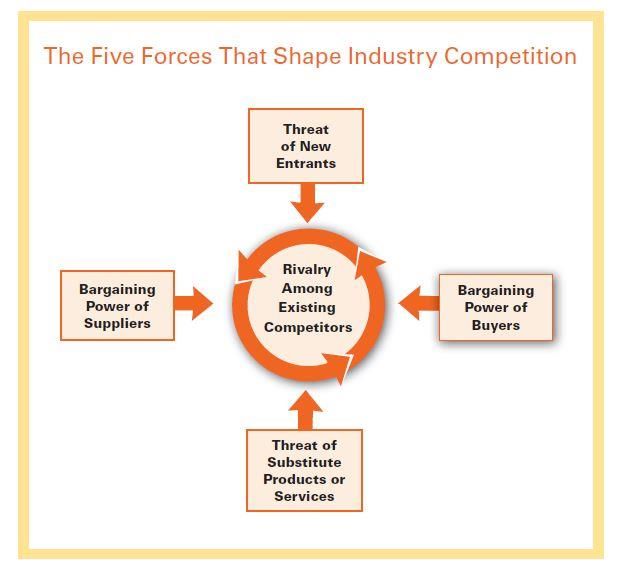
Contents
ABSTRACT ...................................................................................................................................... ii
RESUMO ....................................................................................................................................... iii
ACKOWLEDGMENTS ......................................................................................................................iv
LIST OF EXHIBITS...........................................................................................................................vii
LIST OF FIGURES .......................................................................................................................... viii
LIST OF TABLES ............................................................................................................................ viii
CASE STUDY ................................................................................................................................... 1
   Introduction .............................................................................................................................. 1
   Company overview - TAP .......................................................................................................... 1
       History ................................................................................................................................... 1
   Industry ..................................................................................................................................... 2
       Worldwide ............................................................................................................................. 2
       Europe ................................................................................................................................... 2
   Competitive environment ......................................................................................................... 4
       Ryanair................................................................................................................................... 4
       easyJet ................................................................................................................................... 5
       Vueling and Transavia ........................................................................................................... 5
   Differences between low-cost carriers and full-service carriers .............................................. 6
       Business model...................................................................................................................... 6
       Fleet ....................................................................................................................................... 7
       Routes and bases .................................................................................................................. 7
       Costs ...................................................................................................................................... 9
   Strategies followed by FSCs to fight the low-cost competition .............................................. 11
       Reducing costs ..................................................................................................................... 11
       Mergers and acquisitions .................................................................................................... 12
       Entering the low-cost market.............................................................................................. 13
       Ancillary revenue................................................................................................................. 13
       Differentiation ..................................................................................................................... 14
   TAP .......................................................................................................................................... 15
       What has TAP done so far? ................................................................................................. 15
       TAP’s 2015-2020 strategic plan ........................................................................................... 16
   Conclusion ............................................................................................................................... 17
   Exhibits .................................................................................................................................... 18
TEACHING NOTES ........................................................................................................................ 25
   Introduction ............................................................................................................................ 25

                                                                                                                                                    v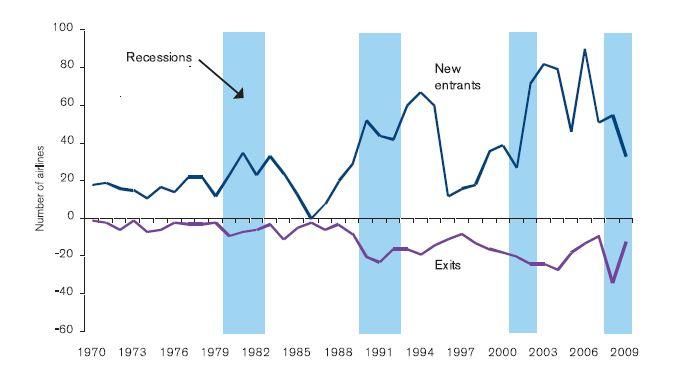
Synopsis ................................................................................................................................... 25
Recommended assignment questions .................................................................................... 25
Teaching objectives ................................................................................................................. 26
Analysis.................................................................................................................................... 26
Core question ...................................................................................................................... 26
Additional questions for discussion .................................................................................... 29
LITERATURE REVIEW ................................................................................................................... 34
Porter’s Five Forces ................................................................................................................. 34
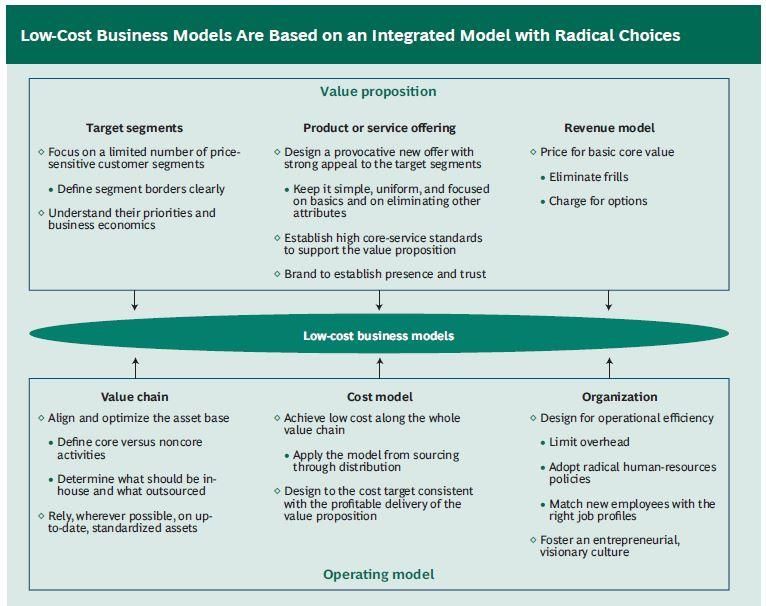
Low-cost Business Model ........................................................................................................ 34
A framework for responding to low-cost rivals....................................................................... 35
Strategies to compete with low-cost rivals ............................................................................. 36
REFERENCES ................................................................................................................................ 39
viLIST OF EXHIBITS
Exhibit 1 – TAP’s income statement
Exhibit 2 – New entrants and exits on the airline market between 1970 and 2009
Exhibit 3 – Comparison between FSCs and LCCs business models
Exhibit 4 – Percentage of “other revenue” in total revenues
Exhibit 5 – Fleet differences
Exhibit 6 – TAP routes and load factor per route
Exhibit 7 – Factors that influence operating margin
Exhibit 8 – Passengers increase, load factor and revenue growth
Exhibit 9 – Percentage of TAP’s sales and passengers per route in 2013
viiLIST OF FIGURES
Figure 1 – Air passenger transport in the EU28
Figure 2 – Comparison of TAP’s and LCCs market share in Lisbon’s and Porto’s airports
Figure 3 – Comparison of bases and routes
Figure 4 – Comparison of the cost per available seat mile and operating margin in 2014
Figure 5 – Comparison of employees per available seat mile
Figure 6 – Comparison of load factors
Figure 7 – TAP’s average revenue per passenger per route in 2013
LIST OF TABLES
Table 1 – Biggest airlines in Europe in 2014
viiiCASE STUDY
Introduction
It was a typical Thursday morning when Fernando Pinto, the Chief Executive Officer of TAP, was
eating breakfast, getting ready to go to work and heard on the news that easyJet after opening
a route to Ponta Delgada, intended to continue the investment in the Portuguese market by
opening a base in Porto[24]. Ryanair has gone even further since its CEO, Michael O’Leary, has
stated “we think we will surpass TAP and be the biggest airline company in Portugal”[31] (the
company recently launched its base in Lisbon). After hearing this he started wondering what the
future of TAP would be with the biggest low-cost carriers (LCCs) betting heavily in the
Portuguese market. Therefore, he asked his advisors to provide an analysis of the competition
between full-service carriers (FSCs) and LCCs in Europe and assess possible strategic solutions
TAP can incorporate.
Company overview - TAP
TAP Portugal is the main Portuguese airline, flying to 87 destinations in 38 countries with a fleet
of 77 airplanes and operating on average 296 flights per day. In 2014 it achieved around 2,7
billion euros (exhibit 1) in revenue and had 13 268 employees[33].
History
Transportes Aéreos Portugueses was founded on the 14th of March 1945, by then director of the
civil aviation secretariat, Humberto Delgado. In that time it acquired the first two DC-3 Dakota
airplanes, with a 21 passenger capacity. The first commercial route, Lisbon – Madrid, was
opened on the 19th of September 1946. Later that year the “imperial route” is created which
connected Lisbon – Luanda - Lourenço Marques (Maputo) and had a duration of 15 days.
The company continued to open new routes and in 1953 changed from a public service company
to a public limited company (plc). However, with the Portuguese revolution in April, 1974 the
company follows the trend of extensive nationalizations and is again transformed into a public
service company in 1975. In 1979 the company changes its name to TAP Air Portugal and in 1980
goes through a rebranding process. It continues to open new routes and has some profitability
problems until the start of the new millennium when for the first time in several years the
company has a profit. It undergoes another rebranding, changing its name to TAP Portugal with
the intent of reflecting modernization and the start of a new era.
1In 2006 TAP assumes the control of Varig Manutenção & Engenharia (VEM), the largest
maintenance center in South America, and in the subsequent years TAP is distinguished with
several awards including, World Travel Awards’ (WTA) Leading Airline to Africa in 2011 and 2012,
Leading Airline to South America in 2009, 2010, 2011 and 2012. It was recognized by Global
Traveler magazine as the best airline in Europe in 2011, 2012 and 2013 and in 2014 it receives,
once again, recognition by the WTA as Europe’s leading airline to Africa and Europe’s leading
airline to South America[34].
Industry
The aviation industry has suffered significant changes in the past years. In the last 40 years over
1300[24] (exhibit 2) airlines were formed and a major cause for this exponential increase was the
liberalization of the markets. Twenty years after the North American deregulation, established
in 1978, Europe followed the same road and in 1997, the market was liberalized allowing any
European airline to provide services inside any EU country[35]. This of course, favoured the
exponential growth of the low-cost carriers in the 1990s and in the beginning of the third
millennium.
For this analysis, it is important to realize the main trends in the global aviation industry,
however, the main focus will be on the European and Portuguese markets since these are the
markets where TAP is threatened the most by the competition of LCCs.
Worldwide
With the increase in efficiency, scale economies and economic development, travelling by plane
is no longer seen as luxurious but as a common transportation method and the most practical
to cover long distances. This is represented by the exponential growth in airline passengers
registered over the years. According to the International Air Transport Association (IATA), the
total number of passengers will continue to increase significantly in the coming years[16].
Europe
Having established that the general market is set for a continued growth it is important to
further analyse the European Market. Despite being the market which will have the smallest
growth rate according to IATA, it is still forecasted to grow by 2,7% per year until 2034[16].
2Another important fact is that most of the flights involving EU28 countries, measured by the
departures or arrivals involving at least one of these countries, are routes within the European
Union. Which means, the highest percentage of flights originate and land in EU28 countries[12].
This fact, helps us realize why Europe is seen as such a valuable market for low-cost carriers.
Typically these airlines operate short and medium-haul flights and Europe is ideal to operate
such a strategy.
Figure 1: Air passenger transport in the EU28
Source: Eurostat news release, December 4th 2014, Air passenger transport in the EU28
This translates into the increasing influence, in the past few years of low-cost carriers in Europe,
which can be verified by the presence of several low-cost companies in the list of the biggest
airlines in Europe measured by the number of passengers carried.
Passengers Carried (in
Type Centre of operations
Millions)
Lufthansa Group 105,9 FSC Frankfurt and Munich
Ryanair 81,7 LCC Dublin and London
Air France - KLM 77,5 FSC Amsterdam and Paris
International Airlines Madrid, Barcelona
77,3 FSC
Group and London
easyJet 64,8 LCC London
Turkish Airlines 54,7 FSC Istanbul
Aeroflot Group 34,7 FSC Moscow
Air Berlin Group 31,7 FSC Berlin and Dusseldorf
Copenhagen,
SAS Group 28,4 FSC
Stockholm and Oslo
Norwegian Air Shuttle 24 LCC Oslo
Alitalia 23,9 FSC Rome
Pegasus Airlines 17,3 LCC Istanbul
Wizz Air 15,8 LCC Budapest
Transaero 13,2 FSC Saint Petersburg
TAP Portugal 11,4 FSC Lisbon
Table 1: Biggest airlines in Europe.
Source: Annual Reports and company websites
3The European market is also being affected by the growth of airlines such as, Emirates, Turkish
Airlines, Etihad and Qatar. Taking advantage of their privileged locations1 these companies are
growing fast and intend to provide a global network, establishing themselves as the main
carriers to connect European passengers to long-haul destinations. This means, in addition to
the competition with LCCs in the short-haul routes, European FSCs will have to face severe
competition in the long-haul segment as well from the emerging airlines that are penetrating
the European market[36].
Competitive environment
As it was stated, in the current environment TAP faces competition not only from low-cost
carriers but also from full-service carriers. However, the analysis will be focused on the LCC
competition.
The main LCC players in the Portuguese market have been gaining market share2 in the two most
important airports in Portugal, Lisbon and Porto. This increase in the number of passengers
carried is negatively correlated with the percentage of passengers carried by TAP[17] which leads
us to assume that TAP is negatively affected from the penetration of LCCs.
Market share- Lisbon airport Market Share - Porto airport
70% 60%
60% 50%
50%
40%
40%
30%
30%
20% 20%
10% 10%
0% 0%
2010 2011 2012 2013 2014 2010 2011 2012 2013 2014
TAP LCCs TAP LCCs
Figure 2: Comparison of TAP’s and LCCs market share in Lisbon’s and Porto’s airports.
Source: INAC’s statistics
Ryanair
Ryanair was created in 1985 by Tony Ryan, Christopher Ryan and Liam Lonergan and began by
operating a small route between Waterford and London. In 1990 the company was having major
losses which led to a restructuring procedure that applied Southwest’s airlines low-fares model
and made Ryanair the first low-cost airline in Europe[29]. Currently, Ryanair is the biggest low-
1
“The Gulf is handily placed between Europe, Asia, Africa and America: all are in range of modern long-
haul jets. Istanbul, on the edge of Europe, is a short-haul flight from 55 capital cities”[36]
2
Measured by the percentage of passengers carried
4cost airline in Europe and second biggest airline in terms of passengers carried, after the
Lufthansa group.
In terms of its competition with TAP, Ryanair is the biggest low-cost competitor. In 2014, it had
three bases in Portugal, Lisbon, Faro and Porto, being the leader in the last two and acquiring
almost a 10% market share in Lisbon, after only 9 months of the base’s launch in 2014. Nowadays
Ryanair offers 17 routes out of the Lisbon airport, 29 routes out of Faro and 42 routes from Porto
airport[29]. Furthermore, Ryanair has stated that it has the intention of keeping the growth in the
Portuguese market[31].
easyJet
EasyJet was founded in 1995 by Sir Stelios Haji-loannou and started by operating two routes
from London to Glasgow and Edinburgh[10]. Currently it is the 5th biggest airline in Europe
according to the number of passengers carried.
In Portugal, EasyJet poses a relevant threat to TAP as the second biggest LCC in the country. It
operates in the five biggest airports and has two bases, Lisbon, since 2012 and Porto, since
March 2015. It currently offer, 16 destinations out of Lisbon, 11 out of Porto and 10 out of
Faro[10] and intends to keep growing in the Portuguese market[24].
Vueling and Transavia
The other LCCs worth mentioning in the Portuguese market are Vueling and Transavia. Both are
subsidiaries of full-service carriers’ conglomerates. Vueling is owned by IAG group while
Transavia is a subsidiary for the Air France – KLM group. These represent a small percentage of
passengers carried however, they still figure among the top 10 airlines flying out of the two
major Portuguese airports[17].
According to the Portuguese Civil Aviation Institute (INAC), Vueling is a constant presence in the
top 10 airlines operating in Lisbon, with a market share in terms of passengers carried of
approximately 2% [17].
Transavia is also a relevant player, being one of the top 10 companies operating in Porto with
approximately 4%[17] of the total number of passengers carried, and currently offers 4 routes out
of Lisbon and 5 routes out of Porto[41]. The Air-France KLM’s subsidiary was also mentioned in
the Portuguese press regarding the possibility of opening two bases in Portugal, Lisbon and
Porto until 2020[40].
5Differences between low-cost carriers and full-service carriers
Business model
Low-cost airlines and full-service carriers display many differences which result in two distinct
business models(exhibit 3).
The LCCs business model achieves results through low fares. They operate point-to-point3 short-
haul flights and have more operational bases spread between several countries. The low-cost
business model is profitable despite the low fares since it also depends on the combination of
many other factors. LCCs are cost efficient, which is derived from many aspects, some of them
are the various economies of scale, the optimal use of staff, using the internet as the exclusive
channel for ticket sales and the regular use of secondary lower cost airports. Another important
aspect of the LCC business model are the ancillary revenues4 (exhibit 4). In LCCs everything
besides the ticket has a cost, which represents a substantial source of revenue for LCCs. Almost
everything one would expect from a FSC, such as, choosing seats, having a meal, or being able
to carry hold luggage5 has a price on most low-cost carriers.
FSCs operate all types of flights, short, medium and long-haul and have much fewer bases,
usually located in important cities of their countries of origin. Typically, they use a hub and spoke
system which means they gather passengers form secondary airports at a major hub and then
transport them to another major hub, thus having connecting flights[14]. FSCs can also be flag
carriers6 (TAP’s case), which means they can have social obligations (and benefits) thus having
restrictions in the destinations they offer[15]. LCCs have no social obligations towards any specific
state. Another important aspect is that after the deregulation, governments lost part of the
political power necessary to provide benefits to their respective flag carriers[15].
Full-service carriers also have more amenities and a more personalized service. The FSC business
model depends largely on the long-haul flights and some of its medium and short-haul routes
are just connections serving the more profitable long-haul segment[2]. In spite of the recent
efforts to increase its cost efficiency, FSCs are still not as efficient as LCC.
3
Point-to-point means passengers are flown directly to their destination without going through any
central hub.
4
Revenues from non-ticket sources, such as the sale of food and beverages, baggage, among others…
5
Luggage placed in the hold of the plane
6
Airlines owned by a government or that are locally registered in a given state and enjoy preferential
rights agreed with the government for international operations.
6Fleet
In aviation, having a fleet that follows a certain pattern, (model, manufacturer, generation,
among others…) is called fleet commonality and while most airline companies do this in some
way, LCCs follow this principle to the extreme by operating a fleet composed by only one or two
models. Consequently, LCCs achieve lower costs in training everybody involved in dealing with
the aircraft (pilots, crew, etc…), and also benefit from scale economies in the maintenance
operations since every plane needs the same components. This not only ensures greater
flexibility in moving parts between aircrafts but it also enables LCCs to possibly achieve better
deals with manufacturers in ordering parts and planes[4].
For instance, Ryanair operates more than 300 airplanes of the same model, Boeing 737-800,
with an average fleet age of 5,5 years[28] meaning that planes are equipped with the latest
technology and the company can benefit from the advantages explained above. EasyJet
operates only two types of planes (Airbus 319 and Airbus 320)[9] while the FSCs counterparts
operate a larger number of models. For instance, TAP’s fleet is composed by 8 types[33] of planes
(including the ones operated by Portugalia Airlines7) which implies higher costs (exhibit 5).
Routes and bases
Passengers often think about why they have to take a bus or train that takes one hour to reach
the city. Wouldn’t it be easier if easyJet, Ryanair and all the other LCCs travelled to the main
airports? It would but this does not happen by chance.
It is a fact that the vast majority of LCCs travel to secondary airports. This happens because in a
large number of secondary airports state aid is given to the low-cost carriers in order to develop
the region. This aid usually comes from the airports (majority of airports are state owned) and
it may come under the form of a fee for every passenger that the LCCs bring, it can be as a
subsidy to start flying to that airport, and in most cases it can be in the form of discounts in
landing and baggage handling charges[38]. This type of aid is regulated by the EU aviation
guidelines and it plays a significant role in the low-cost business model. However, this type of
“revenue” translates into controversy, since it is hard to prove that the subsidies provided to
LCCs are indeed used to develop that region and not to finance its operations elsewhere. Also,
in light of fairer competition, full-service carriers complain about these easier conditions
provided to low-cost carriers and there are cases in which legal action is pursued. Air France, for
7
Portugalia Airlines or PGA is a Portuguese subsidiary of TAP
7example, took matters into their own hands as they sued 20 airports in its home market for
giving these type of subsidies[38].
Nonetheless, the time for special benefits for LCCs in Europe is coming to an end since the EU
heard the concerns of the FSCs and in 2014 adopted new aviation guidelines. This new set of
rules is an update to the last aviation guidelines issued in 2005 and intends to provide better
means for fair competition in the airline industry[11].
Regarding the absolute differences in the number of routes and bases, LCCs have a significantly
higher number of both. Most LCCs are a short-haul point to point airline which means they
operate short-haul flights and perform limited connection flights. Furthermore, LCCs are not
flagship airlines8 (as is the case of many FSCs) which means they can have operational bases in
multiple countries and serve several destinations departing from each of these bases. Figure 3,
shows the differences in bases and routes between TAP’s most direct LCCs competitors and the
top two FSCs in Europe.
Bases Routes
80 1800
69 1600
70 1600
60 1400
1200
50
1000
40 675
800
30 24
600
20 400 316
235
10 2 2 2 200 87
0 0
Ryanair Easyjet TAP Lufthansa Air France Ryanair Easyjet TAP Lufthansa Air France -
Airlines - KLM Airlines KLM
Long-Haul
Medium and Short-Haul
Figure 3: Comparison of bases and routes
Source: Company’s annual reports
In the case of TAP’s most direct low-cost competitors, easyJet and Ryanair, they have much
higher number of bases9 compared with TAP and other European FSCs. As stated before, it is
also observable that LCCs only have short-haul and medium-haul flights while FSCs operate long-
haul as well. Of the 87 destinations TAP currently flies to, 31 are long-haul flights.
Despite the absolute difference in the number of routes offered, FSCs counterbalance this fact
due to the existence of alliances between airlines. These alliances allow codeshare agreements,
8
Flag carriers
9
Airports where the companies have established operations.
8which are contracts between airlines that enable them to share flights. This means, airlines can
sell flights in their own reservation systems operated by other airlines in the alliance[1]. Hence,
airlines have access to the destinations offered by partner companies and can get additional
revenue from routes they do not operate[33]. TAP is part of the Star alliance, which is considered
the biggest airline alliance[32], and this allows TAP to increase the number of destinations it “flies”
to (exhibit 6).
Costs
Regarding costs, it is a well-known fact that LCCs are much more cost efficient than full-service
carriers, being this one of the main competitive advantages, low-cost carriers have. Two of the
major aspects of airlines’ costs are fuel and staff. When we look at the operational expenses of
LCCs we see that fuel has a higher percentage in the total of operating costs. However, this
higher share is deceiving given that the price of fuel is one of the few operational costs airlines
don’t control. Some airlines even exclude fuel from the operational expenses possibly because
the price of fuel is something that can’t be easily influenced.
Before comparing the costs of full-service carriers and low-cost carriers it is important to explain
one of the most relevant measures available to compare airlines costs - The cost per available
seat mile (CASM). The CASM is achieved by calculating the available seat miles (ASM), which is
the total number of miles that the seats available for sale10 flew. After dividing the operating
expenses by the ASM, the CASM is obtained[3]. When comparing the CASM of the two biggest
LCCs in Europe with TAP and the two biggest FSCs11 we can observe that the low-cost companies
have much lower CASM. This, once again is due to a higher cost efficiency. This cost efficiency is
translated into a higher operating margin which also reflects superior performance by the low-
cost companies.
10
The seats for sale, are all the seats in an aircraft with the purpose of carrying passengers, which means
the seats of crew and pilots are excluded. Therefore, ASM are calculated by multiplying the number of
available seats by the number of miles flown.
11
Lufthansa Passenger Airlines includes SWISS and Austrian Airlines
9CASM Operating Margin
0,160 € 25,00%
0,140 €
20,00%
0,120 €
0,100 € 15,00%
0,080 €
0,060 € 10,00%
0,040 €
5,00%
0,020 €
- € 0,00%
Ryanair easyJet TAP Lufthansa Air France Ryanair easyJet TAP Lufthansa Air France
Group - KLM Group - KLM
Fuel Staff Other Costs
Figure 4: Comparison of cost per available seat mile and operating margin in 2014
Source: Company’s annual reports
TAP does not perform badly on the CASM measure since it achieves a cost lower than both of
the other FSCs identified in 2014. Nonetheless, after analysing the operating margin of 2014, it
is clear that TAP still needs to improve its operational efficiency, and this can be done by
changing the factors that influence it (exhibit 7).
Another takeaway from the analysis above is that staff costs represent a much lower share in
LCCs operational expenses than in FSCs. Staff is an aspect directly controlled by the companies,
thus indicating this is a differentiating aspect for low-cost airlines. This is mainly due to the
different company policies. Usually, FSCs have to deal with powerful work unions12 that don’t
allow mass restructuring and salary cuts while LCCs are formed with a cost saving policy which
enables them to be “stricter” with their work force[15] and pay less than typical market values[6].
Also, LCCs ensure their workers know that there is a need for flexibility and to perform different
tasks. This means that pilots, for instance, can also help in cleaning the plane to achieve a quicker
turnaround time13. To better understand these higher staff costs we can look at the number of
employees per available seat mile and the difference between LCCs and FSCs is clear.
12
While this case study was being written, there was a strike called by the pilot’s work union of TAP,
which lasted 10 days and cost the company approximately 35 million Euros[13].
13
The time an airplane needs to be parked at the gate before commencing operations again.
10Employees per ASM
0,7
#Employees/Million ASM
0,6
0,5
0,4
0,3
0,2
0,1
0
Ryanair Easyjet TAP Lufthansa Air France
Group - KLM
Figure 5: Comparison of employees per available seat mile
Source: Company’s annual reports
Strategies followed by FSCs to fight the low-cost competition
Ever since low-cost carriers appeared FSCs have been trying to develop strategies that would
allow them to accommodate this change in the aviation industry and reach profits despite the
higher costs. Several strategic decisions have been made by most of FSCs, however, in Europe,
LCCs are dominating the intra-European market[7], reaching higher profit margins and continuing
to grow. Nonetheless, some strategies are more effective than others, and some are even a
necessity for survival in this fierce competitive market. In the following section some of the more
frequent strategies followed by FSCs will be identified.
Reducing costs
One of these necessities is to reduce costs. This is the most common measure and one that the
vast majority of the full-service carriers followed[2]. To adapt to a competitive environment in
which low-cost carriers are thriving in Europe, FSCs knew that in order to stay competitive they
would also need to become more efficient. Many FSCs have even accommodated practices
developed by LCCs[42]. Improving this aspect can be done in several ways some of which we
already mentioned earlier.
It is possible to cut costs by modernizing and standardizing the fleet. Modernizing can decrease
fuel consumption and a uniform fleet enables economies of scale derived from commonality14.
Another option regarding aircrafts, is to “adapt travel class configurations to specific
markets”[21]. For instance, Lufthansa modified its fleet of Airbus A340 for a two-class
14
In aviation Commonality is the principle called to a fleet that follows a certain pattern (model,
manufacturer, generation, among others…)
11configuration for routes where premium demand is lower, hence lowering unit costs. Air France
is also restructuring its medium and short-haul fleets by decreasing the number of aircrafts
intended for this type of routes[2].
Another way to reducing unit costs is to increase productivity which in turn can be achieved in
many ways. For instance, decreasing the turnaround time. Many FSCs have been trying to
understand how Ryanair is able to disembark all the passengers of an aircraft, clean the
passenger area, refill foods and beverages, fuel and board the new passengers in just 25
minutes[39]. A quicker turnaround would allow an increase in productivity measured in flight
hours per aircraft. Air France, for example, intends to increase its productivity in the medium-
haul flights by 9% until the end of 2015[2].
Some of the full-service carriers had to undergo more drastic measures and needed to go
through restructuring processes in order to lower their costs. International Airlines Group, had
to cut 3000[42] jobs at its Spanish subsidiary, Iberia.
So far, FSCs were able to reduce the cost gap to their low-cost rivals by more than one third. In
2013 a full-service carrier spent, on average, 3,12 cents more than LCCs to move a seat through
the air for one mile. This is a significant improvement compared to the 4,52 cent premium on
2006[19]. There are risks, however, of focusing too much efforts on trimming costs. As FSCs
emulate LCCs they force themselves into competing solely on price and this is done sometimes
by cutting into FSCs already thin margins[37].
Mergers and acquisitions
As airlines cut costs, they were forced to face the LCCs on unfavorable terms, therefore, some
airlines have already failed such as, Alitalia, MALEV, Mexican and Air Jamaica while the
“survivors tend to seek efficiency through consolidation”[37].
The past two decades have seen the creation of massive airline groups such as, International
Airlines Group, with the merger of Iberia and British Airways in 2011, Air France – KLM, which
resulted from the merger of Air France and KLM in 2004, the Lufthansa group, since Lufthansa
acquired both SWISS and Austrian Airlines in 2005 and 2008 (respectively), United Airlines
merged with Continental Airlines in 2012, Northwest Airlines merged in Delta Airlines in 2010,
US Airways merged with American Airlines in 2013, and more examples can be named.
This type of deals has been very common in the past few years in the effort by FSCs to increase
efficiency through mergers and acquisitions.
12TAP itself is currently waiting to be privatized and if everything goes according to plan it will be
acquired. The state will receive the final offers for the company on the 5th of June 2015[23].
Entering the low-cost market
In spite of the consolidation processes some full-service carriers had with other airlines on the
same segment, there is also a clear pattern that has been arising from FSCs - to acquire or create
their own low-cost carrier.
In Europe this was a path followed by the top 3 FSCs airline groups. . The Air France – KLM group
was the first of the major FSCs in Europe to own a low-cost company due to Transavia, which
was already owned by KLM when the companies merged. Lufthansa acquired Germanwings
from its already subsidiary Eurowings in 200815. In 2013, the IAG group also reinforced its
presence on the low-cost market when it took over Vueling Airlines, which was already partly
owned by Iberia.
Strategies designed for these LCCs by the parent company may vary but it makes sense for FSCs
to pass on their less-profitable short-haul segments to their low-cost subsidiaries, allowing these
companies to take over some control of the domestic market and achieve higher margins on the
latter, while focusing themselves on the more profitable long-haul routes. There are, although,
some risks for a FSC to acquire or launch its own LCC mostly due to the possibility of
cannibalization16, therefore such a strategic move needs careful deliberation.
Ancillary revenue
Ancillary revenue, has been part of the LCC business model since the beginning. However, the
trend in the current business environment is for full-service carriers to start charging for
additional services[37].
It is only natural that FSCs try to incorporate some of the LCCs success factors, however in this
case, this measure bears a risk since it makes the difference in value proposition offered by LCCs
and FSCs thinner, while LCCs continue to dominate on tariff prices. An example of this is British
Airways that started charging more for additional checked baggage[37], or Delta Air Lines charging
passengers to see a movie on board, or as many FSCs do by charging passengers for Wi-Fi access.
15
Germanwings operations will be incorporated into the Eurowings brand once again in October 2015,
allowing the Lufthansa group to comply with its objective to unify its low-cost segment and create a
short and long-haul option for customers with the Eurowings brand.
16
The negative impact that a company’s new product has on the sales performance of its already
existing products.
13There is a big set of examples that can be found but this type of revenue is starting to be a
necessity for airlines all around the world. According to CNN Money, in some cases ancillary fees
make up for 20%[25] of the company’s total revenue.
Differentiation
It is also possible to tackle the competition by offering differentiation services and focusing on
a more high-quality service. LCCs are dominating the short-haul market but FSCs still have a
significant share in the business segment and dominate the long-haul routes. However, this may
change in the near future since LCCs, such as easyJet and Ryanair have begun to tackle the
business traveler market[37] and intend to enter the long-haul segment[8]. EasyJet, for instance,
is doing this by shifting its focus to primary airports and by starting to offer additional services
such as complimentary seat reservations and flexible ticketing17[37].
Nevertheless, on the other end of the spectrum, some FSCs started improving even more its
services in order to become high-quality carriers and attract more customers that are less
sensitive to price. Part of the growth in the airline industry comes from business customers at
the lower end of the hierarchy[15], therefore it is possible for FSCs to try to capture this segment
by offering services than create higher switching costs such as loyalty programs. For business
customers, frequency18 is also a main differentiator between similar airlines on a certain
route[15], implying that airlines can also explore this aspect. But even for business customers it is
important to be aware of the competition and have competitive prices. Travel agents are usually
in charge of corporate demand and these agents have to comply with company’s strict travel
policies and budgets[15].
Lufthansa is one of the full-service airlines that wants to excel at offering a high quality service
and aims at achieving quality leadership in all classes. Being an airline in which 42,2%[21] of the
long-haul revenue is already derived from business and first class customers, a strategy focused
on quality where existing services are personalized and additional benefits are established, may
be the right approach to follow.
17
Ticket that allow some date flexibility
18
The number of flights to a destination in a specific time frame. Typically it is measured in weeks.
14TAP
What has TAP done so far?
TAP, as all the other full-service carriers had to adapt to a changing industry and perform some
structural changes. TAP has been trying to decrease unit costs while growing and has done so
by renewing capacity. In 2014 it introduced 11 new routes and 6 new airplanes, 4 of which,
intended for the medium-haul segment. From the 11 routes it introduced, 7 are in Europe, 2 in
Brazil and 2 in Latin America. In spite of the efforts TAP was only able to reduce its CASM by
0,3% in 2014 compared to the previous year[33]. TAP has managed to grow in revenue,
passengers carried and in load factor19, however it is still behind some of its industry
peers(exhibit 8).
Load Factor
90,00%
85,00%
80,00% TAP
75,00% FSC's
LCC's
70,00%
65,00%
2010 2011 2012 2013 2014
Figure 6: Comparison of load factors
Source: Company’s annual reports
It has also been trying to increase the Revenue per unit and has done so by introducing a new
system that optimizes the utilization of the network20 and ensures a real time tuning of demand
and supply, ensuring a better match in prices which will in turn provide a higher revenue per
ASM. Furthermore, it has been expanding its offer of destinations on the most profitable long-
haul segment in markets, such as, South America, Latin America and Africa (exhibit 6). Markets
which compose more than 50% of the company’s total revenue (exhibit 9).
19
Load Factor is the production compared to capacity. It is obtained from dividing Revenue passenger
miles(RPMs) by the ASMs. RPM is the multiplication of the number of passengers flying with the length
of the flight. For instance, 100 passengers flying 500 miles generate 50000 RPMs[3]. In figure 5 FSCs are
composed by Lufthansa, Air France – KLM and IAG, and LCCs by easyJet and Ryanair
20
The total number of destinations offered by an airline
15TAP's average revenue per passenger in
2013
€1 000,00
€900,00
€800,00
€700,00
€600,00 Average
revenue per
€500,00
passenger
€400,00
€300,00
€200,00
€100,00
€-
Portugal Europe North Africa Latin South
America America America
Figure 7: TAP’s average revenue per passenger per route in 2013
Source: Company’s annual reports
TAP’s 2015-2020 strategic plan
In sequence of what is already being done, TAP has a long-term strategic vision it wants to
achieve before the end of 2020. The company has six main long-term goals[33]:
Renewal and expansion of the fleet: TAP intends to have a young fleet in comparison with the industry’s
average, which will hopefully allow TAP to maintain competitive advantage in unit costs.
Evolution of the company’s business model: TAP intends to develop its product in order to compete with
the highest industry standards while providing the greater comfort to passengers. It also has the goal to
increase the weight of ancillary revenues on total revenues.
Empowerment and improvements on the customer experience: The current long-term strategy aims at
further differentiate the services offered by TAP from the LCCs, ensuring the continuous increase in
competitive advantages from the passengers’ point of view.
Growth consolidation and increased focus on the hubs: TAP intends to keep growing its network and
increase focus on the Lisbon base operations allowing its continuous improvement. It is the company’s goal
to reinforce its position in the markets it is currently present in and to grow in markets with high potential
in which the company has a lower presence.
Improve operational efficiency: TAP intends to develop an additional effort in optimizing its cost structure
with the objective of ensuring a base that allows a sustainable growth as efficient as possible.
Reposition the maintenance units in Portugal and Brazil: The Portuguese unit will continue to serve
primarily TAP’s fleet but increase its efforts in capturing an external market. The Brazilian unit will
consolidate the results in its restructuring program.
TAP’s goals approach the main challenges of the company but are still somewhat vague and
don’t cover everything the company will have to do in order to stay competitive. Furthermore,
the company states it wants to increase competitive advantages in the eyes of the customer but
it also says it wants to increase the weight of ancillary revenues, which can in turn decrease the
16value proposition. It also lacks consideration regarding what customer segments to pursue,
which can indicate the company is still not sure about its future strategy.
Conclusion
The gap between the low-cost’s and the full-service’s business model is getting thinner[19]. With
FSCs adopting some features that were for many years characteristic to LCCs, such as the need
for ancillary revenues and cost efficiency, and as LCCs attempt to capture a higher share of the
less price sensitive customers, by offering complementary services and beginning to explore the
long-haul possibility, the aviation industry is yet to see major changes in the years to come.
Given this, FSCs have two major strategic options to follow when choosing how to tackle the
low-cost competition. One path is to differentiate themselves enough so that their value
proposition is significantly higher and worth paying a premium for, or, they can choose to
undergo major restructuring, and transform their business model in a way that enables price
competition with LCCs.
As low-cost carriers are effectively penetrating the Portuguese market and with TAP’s
privatization process to be completed this year, Fernando Pinto, should take the threat of LCCs
seriously and make the necessary changes to the company’s current outlined strategic plan, so
it can endure the competition and the changes in the industry still to come.
17Exhibits
Exhibit 1 – TAP’s income statement
(values in thousands of euros) 2010 2011 2012 2013 2014
Sales and Services 2 315 521 2 438 880 2 618 049 2 669 027 2 698 321
Operating Grants 4 565 3 253 4 312 3 852 1 151
Gains and losses in associates -44 066 -11 124 4 110 706 1 611
Variation in production -838 10 512 -7 887 -5 072 8 894
Own work capitalised 2 406 950 1 144 1 593 791
Cost of goods sold and materials consumed -175 829 -188 272 -205 028 -214 811 -276 583
External supplies and services -1 444 939 -1 647 060 -1 768 063 -1 705 328 -1 816 262
Personnel costs -559 721 -523 970 -506 883 -571 855 -578 880
Inventory adjustments (losses/reversals) 3 966 -2 448 -1 964 -5 908 -105
Impairment of debts receivable (losses/reversals) 4 307 588 3 323 -366 -14 044
Provisions (increases/decreases) 3 701 12 603 3 687 3 623 -5 706
Fair value increase/reductions 0 255 2 210 -410 104
Other income and gains 75 108 47 638 55 972 49 359 103 958
Other costs and losses -45 540 -35 332 -42 443 -64 598 -33 257
Earnings before interest, taxes, depreciation and amortisation 138 641 106 473 160 539 159 812 89 993
Depreciation and amortisation cost/reversals -138 622 -122 190 -119 776 -115 751 -85 437
Impairment of assets subject to depreciation/amortisation -440 -2 350 0 0 -1 984
Net operating Income (earnings before interests and taxes) -421 -18 067 40 763 44 061 2 572
Interest and similar revenue received 6 896 8 596 5 696 6 155 3 091
Interest and similiar costs paid -50 893 -55 032 -57 371 -50 656 -84 509
Pre-tax earnings -44 418 -64 503 -10 912 -440 -78 846
Corporate income tax for the year -8 497 -7 700 -9 196 -475 -2 103
Net Income for the year -52 915 -72 203 -20 108 -915 -80 949
Net Income of shareholders of the parent company -57 103 -76 807 -25 487 -5 868 -85 096
Net income of non-controlling interests 4 188 4 604 5 378 4 953 4 147
Basic and diluted earnings per share (euros) -38 -51 -17 -4 -57
Source: TAP’s annual reports
18Exhibit 2 – New entrants and exits on the airline market between 1970 and 2009
Source: IATA’s Vision 2050 report
19Exhibit 3 – Comparison between FSCs and LCCs business models
Characteristic feature FSC LCC
Generic Strategy Differentiation Cost minimisation/cost leadership,
entrepreneurial in character
Scale Typically large Generally smaller, but some major
players
(e.g. Ryanair, EasyJet)
Operational Model Hub and spoke/Multiple hub and Point to point, no interlining, short-
spoke, linking with feeder routes sector length (400 – 600 nautical
Mix of short/medium/ and long-haul miles)
routes Mainly short haul
Moderate Capacity utilisation Uniform aircraft type
Multiple aircraft models High capacity utilization, rapid
turnaround between sectors
Market In competition with other FSCs and Cheap travel sector of the market,
LCCs, leading to differentiation by segmentation by time of booking and
class (quality) of service, with high choice of flight
service image, including: Quality of service basic, e.g.:
Frequent scheduling & flight flexibility Little flexibility of flight changes (use
Extensive in-flight services or lose!)
Comprehensive ground services No catering (or meals charged for)
Use of main airports Ground services typically outsourced
Moderate focus on ancillary revenues Typically use secondary airports
High focus on ancillary revenues
Inventory management Pre-arranged tickets and seats: Inventory management simplified:
reservation system complex, due to direct or online bookings, ticketless,
feeder routes: use of travel agents no use of travel agents
Labour Specialized workforce Flexible workforce
Higher Wages Lower Wages
Lower Flexibility High Flexibility
Moderate use of outsourcing High use of outsourcing
More Unionized Less Unionized
Table partially drawn from Hunter, L., 2006
20Exhibit 4 – Percentage of “other revenue” in total revenues
% of Other Revenue in Total Revenues
30,00%
25,00%
20,00%
15,00%
10,00%
5,00%
0,00%
2010 2011 2012 2013 2014
TAP 6,35% 6,39% 7,13% 6,68% 7,21%
Lufthansa 9,24% 8,72% 9,01% 8,92% 9,21%
Ryanair 22,21% 22,09% 20,19% 21,79% 24,77%
Source: Company’s Annual Reports
Exhibit 5 – Fleet differences
Fleet 2010 2011 2012 2013 2014 Nº of Aircraft Models in 2014
TAP 71 71 71 71 77 8
Lufthansa Airlines 342 355 360 431 423 10
Air France - KLM Group 625 609 573 611 571 20
IAG - 348 377 431 459 >9
Ryanair 231 272 294 305 297 1
easyJet 196 204 214 217 226 2
Source: Company’s Annual Reports
Exhibit 6 – TAP routes and load factor per route
# of Routes 2010 2011 2012 2013 2014
Portugal 8 7 7 7 7
Europe 35 41 44 42 49
North America 1 2 2 2 2
Africa 11 13 13 15 15
Latin America 1 1 1 1 3
South America 9 9 9 9 11
Total 65 73 76 76 87
Source: TAP’s Annual Reports
21Rest of
Routes operated North Latin South
Portugal Europe Africa the Total
by(2013): America America America
world
TAP 7 42 2 15 1 9 0 76
Partner Companies 1 59 23 6 1 24 8 122
Source: TAP Annual Report 2013
Load factor per route 2010 2011 2012 2013 2014
Portugal* 60,9% 65,7% 65,9% 69,0% -
Europe 68,1% 71,2% 72,7% 75,9% -
North America 80,2% 76,4% 80,1% 82,8% -
Africa 71,9% 72,8% 73,5% 76,6% -
Latin America 68,8% 78,6% 78,0% 85,9% -
South America 83,4% 83,1% 82,5% 84,2% -
Total 74,5% 76,3% 76,8% 79,4% 79,9%
Source: TAP’s Annual Reports
22Exhibit 7 – Factors that influence operating margin
Source: Company’s Annual Reports
Exhibit 8 –Passengers increase, load factor and revenue growth
Passengers (millions) 2010 2011 2012 2013 2014 GAGR21
TAP 9,1 9,7 10,2 10,7 11,4 4,6%
Lufthansa Airlines 58,84 65,42 74,7422 76,26 77,5 5,7%
Air France - KLM 71,39 71,32 77,4 77,3 77,5 1,7%
IAG - 51,7 54,6 6723 77 10,5%
Ryanair 66,5 72,1 75,8 79,3 81,7 4,2%
easyJet 48,8 54,5 58,4 60,8 64,8 5,8%
Source: Company’s Annual Reports
21
Compound Annual Growth Rate
22
Incorporation of Germanwings into Lufthansa Airlines
23
Acquisition of Vuelling
23Load factor 2010 2011 2012 2013 2014 CAGR
TAP 75% 76% 77% 79% 80% 1%
Lufthansa 79% 77% 78% 79% 79% 0%
Air France - KLM 81% 82% 83% 84% 85% 1%
IAG - 79% 80% 81% 80% 0%
Ryanair 82% 83% 82% 82% 83% 0%
easyJet 87% 87% 89% 89% 91% 1%
Source: Company’s Annual Reports
Revenue Growth
35,0%
30,0%
25,0%
20,0%
15,0%
10,0%
5,0%
0,0%
-5,0%
2011 2012 2013 2014
TAP 5,3% 7,3% 1,9% 1,1%
FSC's -1,0% 8,1% -1,0% 2,7%
LCC's 32,8% 15,8% 10,8% 1,5%
Source: Company’s Annual Reports
Exhibit 9 – Percentage of TAP’s sales and passengers per route in 2013
% Sales Passengers
Portugal 5,2% 14,3%
Europe 36,3% 61,2%
North America 4,5% 2,4%
Africa 15,5% 6,8%
Latin America 3,7% 0,9%
South America 34,8% 14,4%
Total 100,0% 100,0%
Source: TAP annual report 2013
24You can also read