The Common Ownership Hypothesis: Theory and Evidence - Brookings Institution
←
→
Page content transcription
If your browser does not render page correctly, please read the page content below
January 2019

The Common Ownership
Hypothesis: Theory and
Evidence
______________________________________________________

Matthew Backus
Columbia University

Christopher Conlon
New York University

Michael Sinkinson
Yale University

                      This report is available online at: https://www.brookings.edu

                                                                    The Brookings Economic Studies program analyzes current
                                                                 and emerging economic issues facing the United States and the
                                                                      world, focusing on ideas to achieve broad-based economic
                                                                  growth, a strong labor market, sound fiscal and monetary pol-
                                                                      icy, and economic opportunity and social mobility. The re-
                                                                     search aims to increase understanding of how the economy
                                                                             works and what can be done to make it work better.
E C O N O M I C S T U D I E S AT B R O O K I N G S STATEMENT OF INDEPEN DENCE The authors did not receive any financial support from any firm or person for this article or from any firm or per- son with a financial or political interest in this article. They are currently not an officer, director, or board member of any organization with an interest in this article. i /// The Common Ownership Hypothesis: Theory and Evidence
The Common Ownership Hypothesis: Theory and Evidence

                         Matthew Backus, Christopher Conlon, Michael Sinkinson

                                                     January 2019

1      Introduction

This paper surveys the recent literature that examines the relationship between ownership of firms in the
financial space, and the strategic decisions made by firms in product markets. Of primary concern is the
common ownership hypothesis, which suggests that when large investors own shares in many firms within
the same industry, those firms have an incentive to soften competition by producing fewer units, raising
prices, reducing investment, innovating less, or limiting entry into new markets. The core of the idea is
quite simple: firms maximize shareholder value, but shareholders hold stakes in competitors; thus, firms
may want to maximize some combination of their own profits and their competitors’ profits to maximize the
value of their investors’ portfolios. The implications of this possibility are enormous: if firms place positive
weight on rivals’ profits when making strategic decisions, the entire economy of publicly-traded firms may
have incentives to soften competition, resulting in significant harm to consumers.

    This hypothesis is an old idea, with a history dating back to the 1980s.1 What has renewed interest
recently is increasing concentration among investment managers and new instruments for investing in diver-
sified portfolios. The introduction of 401(k) defined-contribution retirement plans in 1978 led to a rise in
diversified portfolios and mutual fund managers in the 1980s (such as Fidelity); later index funds (such as
Vanguard) in the 1990s; and finally exchange-traded funds (such as those offered by Blackrock and State
Street), or ETFs, in the 2000s. At the beginning of 2018, the four largest asset managers (Blackrock, Van-
guard, State Street, and Fidelity) managed over $16 trillion in assets, and for 88% of firms on the S&P
500 Index, the largest shareholder was one of those four asset managers. While index fund and ETF man-
agers adopt “passive” investment strategies, evidence suggests that they are actively engaged in corporate
governance (Fink (2018), Brav et al. (2018)).

    This creates a fundamental tension for households that both consume goods and invest in diversified
retirement funds. As consumers, they might be harmed if firms don’t compete as fiercely as possible in
markets for goods and services. As investors, they benefit from low-cost diversified investment products such
as index funds or ETFs. A large number of households don’t hold any investments, and so do not receive the
benefit of the latter, but pay the cost of the former. This has led to an intense debate about whether large
institutional investors have caused indirect harm to consumers, and what, if anything, policymakers should
do about it. This also relates to the larger debate among economists about rising firm markups (De Loecker
    1 See   Rotemberg (1984); Bresnahan and Salop (1986).

                                                            1
and Eeckhout, 2017) and concentration; and declining dynamism, investment (Gutiérrez and Philippon,
2016), and productivity growth. The important, unresolved question is why markups and concentration are
rising while dynamism and productivity growth have been declining, and some researchers have pointed to
common ownership effects as a potential explanation (Shambaugh et al., 2018).2
We formulate the common ownership hypothesis in terms of what we call profit weights. Put simply,
under the conventional model of profit maximization, when making any strategic decision, a firm should
only care about the impact on its own profits, which implies a profit weight of zero on its competitors.
If the common ownership hypothesis is correct, then firms may also take into account the effect of their
choices on their competitors’ profit levels, due to presence of common owners with stakes in each firm. Our
theory section discusses the measures researchers have proposed for these profit weights under the common
ownership hypothesis. In general, these weights tend to depend on two inputs: the shareholdings of each
investor in both firms, and the weight that the firm places on each investor. With some important caveats,
the shareholdings are generally observable from the 13(f) financial filings of large institutional investors that
are required by the Securities and Exchange Commission (SEC). The weight that a firm places on each
investor is not directly observable by the researcher, nor is there a definitive theory of corporate governance
which tells researchers how to choose these weights. The literature often assumes that control weights are
proportional to the cash-flow rights of the investor.3
After describing the available data sources for studying the common ownership hypothesis, we will show
descriptive data that are consistent with a large increase in the holdings of diversified funds over time –
across the economy as a whole but also within some specific industries – as well as substantial concentration
among asset managers. For a sense of scale, under the conventional assumption of profit maximization, firms
would place zero weight on a dollar of another firm’s profits. Alternatively, when we do merger simulations
(or equivalently, in the case of perfect collusion), we posit that a firm values a dollar of profits at another firm
as equal to a dollar of our own. Under the common ownership hypothesis, we show that in 1980 an average
S&P 500 firm would have valued a dollar of profits to another randomly chosen S&P 500 component firm at
20 cents. By the end of 2017, this more than tripled to approximately 70 cents. This staggering rise would,
if common ownership incentives translate to firm behavior, give firms a unilateral incentive to raise prices,
even in the absence of collusion (which would be illegal). However, quantifying such effects would require us
to also know demand and to isolate common ownership incentives among firms within a particular market.
On both points we borrow from Backus et al. (2018b). To the former, we consider a simple calibration of
a Bertrand pricing model with Logit demand, and show that the price effects are not dissimilar in scale to
those found by Eekhout et al. (2018). On the latter point, looking at three specific product markets that
have proven popular among those studying this question – banks, airlines, and ready-to-eat (RTE) cereal –
we see similar or even larger effects for firms within the same industry.
Next we examine the growing empirical literature related to common ownership.4 A series of early em-
pirical papers (Azar et al. (2016), Azar et al. (2018a)) drew much attention but also criticism, and spurred
a large amount of new research into the topic. While the authors of these early papers deserve credit for
2 The relationship between competitiveness and productivity is a robust result in industrial organization (IO), though
interpretation of mechanisms remains controversial; see Syverson (2004), Backus (2014), and Asker et al. (2014) for recent
treatments and discussions of the literature.
3 See Backus et al. (2018b) for an extensive discussion on this point and consideration of alternative specifications. We find
that these alternatives do not qualitatively change our findings concerning the rise and patterns of common ownership.
4 Schmalz (2018) also reviews this growing literature.
2shining a spotlight on this issue, the methods used in the early papers – regressions of prices on opaque
and theoretically problematic measures of ownership concentration – are unreliable in many contexts. In
particular, for differentiated products markets, firms that are pricing competitively could spuriously gener-
ate correlations between prices and measures of ownership concentration. Regressions therefore may simply
be measuring correlations as opposed to true causal effects. This is a familiar concern for the empirical
industrial organization literature, which for decades reported cross-industry regressions with equilibrium
outcomes as dependent variables and measures of concentration, also an equilibrium outcome, as “indepen-
dent” regressors. Criticism of these methods grew in the 1980s as researchers pointed out both theoretical
problems interpreting concentration measures, as well as the difficulty of finding statistically clean variation
(see Schmalensee (1989) for a thorough discussion). Today, such methods are viewed with much skepticism
in the industrial organization literature. So, while we view the initial evidence as provocative and important,
we do not believe that it offers a framework for the growing literature, neither in terms of rigorous testing
of conduct nor policy analysis.
Subsequently, a number of articles have presented empirical results which relate common ownership
incentives to various other market outcomes, such as investment and entry. We briefly discuss these papers
as well.
Beyond basic facts, another question raised by the literature is precisely how increases in common owner-
ship might lead to softer competition in the product market. A number of mechanisms have been proposed,
with much attention being paid to executive compensation (see Antón et al. (2018a)). Here, we might imag-
ine that as an industry has more common ownership, owners want to see weaker managerial incentives; in
industries with less common ownership, owners would favor steeper incentive structures. Other potential
mechanisms involve direct communication between investors and managers on capacity (Aryal et al. (2018))
or investment decisions. Another potential mechanism is through corporate governance actions. Common
owners may be more likely to side with management against activist investors, or to oppose management
strategies which lead to stronger competition within the industry. Large common owners may also seek to
shape the agenda for voting at annual meetings.
To summarize, we find that while the existing correlations explored in this growing literature are provoca-
tive and important, the methods and measures used to date make it difficult to draw clear conclusions. We
believe that these early contributions are the beginning of a literature rather than the end, and that before
policy measures can be debated we need first to test these hypotheses in more settings, using modern meth-
ods; and second, to better understand the mechanisms by which such effects are generated. Our criticisms
of this literature mirror those made by empirical IO economists of the literature on prices and concentration
indices. However, this also guides our thinking for new directions – just as merger analysis moved from
concentration indices to careful modeling of demand and pricing, these same tools can be applied to the
analysis of common ownership. In Backus et al. (2018a) we take a step in this direction and offer new tools
for testing conduct, however we believe that there is room for more work in this area.
The paper is organized as follows: Section 2 discusses the formal theory underlying the common ownership
hypothesis. Section 3 discusses data sources, data challenges, and shows trends in common ownership as
well as implied profit weights. Section 4 discusses the empirical findings in this literature as well as many
responses and criticisms. Section 5 concludes.
32 Theory
The theory of common ownership takes seriously an argument that economists often make informally. Why
do firms maximize profits? Because, it goes, they answer to their investors. Therefore, continues the common
ownership argument, we need a model of investors’ interests. The theory of common ownership posits that
firms seek to maximize the value of investors’ portfolios. This raises two immediate problems. First, investors
may own shares not only in my firm but also in my competitors. Second, each investor’s portfolio may be
vastly different from the next, and investors may disagree about firm objectives. The theoretical literature
on common ownership presents a simple model where firms maximize a weighted average of investor portfolio
profits.5
Suppose there are many investors. We index them by s. Their portfolios consist of shares of many firms,
which we’ll index by f . For notation, let βsf be investor s’s ownership share of firm f . That ownership
share entitles them to a fraction of the profits of firm f , henceforth πf , which means we can write the value
of their portfolio as:
X
βsf πf .
f
In order to resolve disputes when portfolios disagree, we assume that the firm places weight γsf > 0 on the
cash flow received by investor s. We interpret these as Pareto weights in the firm’s choice problem, i.e. the
weight that the firm places on a marginal dollar of each investor. These weights stand in for a model of
corporate governance and control rights, and while it is tempting to interpret them as the outcome of an
explicitly specified voting game, to our knowledge there is no rigorous microfoundation in the literature.6
With all of this in hand, we can now write the objective function of the firm as maximizing:
X X
γsf βsg πg .
s g
After some simple algebra, we can re-arrange things so that the firm maximizes:
P
X γsf βsg
πf + κf g πg with κf g ≡ Ps . (1)
g s sf βsf
γ
This objective function is rather different than the classical model, in which firm f maximizes πf alone. A
useful and intuitive way to think about the difference is in terms of the common ownership profit weights,
denoted by κf g , which represent the value to firm f of a dollar of profit generated for a competing firm g.
These profit weight objects are the channel through which common ownership of stock by large investors
affects firm behavior. To anchor interpretation in familiar terms, if κf g = 0 whenever f 6= g, then we
have standard own-firm profit maximization. If κf g = 1 for all f and g in the market, then the model
is equivalent to market monopoly pricing (or, observationally, perfect collusion). In general, the theory of
common ownership yields intermediate values. However, as we will show in a moment, there is no reason
that these objects need be constrained between zero and one. Let us consider a few examples borrowed from
5 This model of firm behavior traces to Rotemberg (1984), and appears implicitly in the cross-ownership profit weights of
Bresnahan and Salop (1986). In what follows we adopt the (γ, β) notation of O’Brien and Salop (2000), which studied the
implied profit weights in the context of Cournot and Bertrand competition; see their Appendix C.
6 This is perhaps not surprising: in order to model the voting game we would need to know the payoffs to the players in the
downstream product market, a point on which we have been so far agnostic.
4Table 1: Example 1 Ownership Structure
Firm 1 Firm 2 Firm 3
Investor 1 100% - -
Investor 2 - 20% -
Investor 3 - - 20%
Investor 4 - 20% 20%
Retail Share - 60% 60%
Notes: This table presents investor holdings in three firm for Example 1.
Backus et al. (2018b).
Example 1: Suppose there are three firms and four institutional investors. Firm 1 is controlled by an
undiversified owner. Firms 2 and 3 have the following, identical structure: 60% held by a continuum of
retail investors; 20% held by two undiversified institutional investors; and 20% held by a single common,
diversified investor. This ownership structure is depicted in Table 1.
If we assume γsf = βsf , i.e. proportional control, then profit weights can be computed directly from
ownership data. Applying equation (1), we obtain the following profit weights: Firm 1, with independent
ownership, maximizes its own profit alone, with weight κ12 = κ13 = 0. Similarly, firms 2 and 3, sharing no
common owners with firm 1, place zero weight on its profits, so κ21 = κ31 = 0. However, because firms 2
and 3 have a large common owner, they place substantial weight on each other’s profits: κ23 = κ32 = 1/2.
This implies that these two firms value a dollar of profit at the other at 50 cents to a dollar of their own.
It does not imply conspiracy or collusion – but rather, that the firms will naturally internalize the effect of
their decisions on each other, in a way that emulates collusive outcomes. We have not specified the strategic
interactions between the three firms, so there are no welfare implications at this point in the analysis, but
the implications for competition are grim.
A remarkable feature of the example is how large the profit weight on a competitor is given the 20% stake
of the common owner. Part of this is coming from the 60% retail share, which is the portion of shares held
by retail investors. Individual retail investors are assumed to be infinitesimally small in the model, and so
when we multiply γ and β in equation (1), their contribution drops out, effectively magnifying the influence
of the institutional investors.7 This mathematical artifice is perhaps not without intuition, given the low
participation rates of retail investors in corporate governance, but it is essential to the conclusions. Indeed,
it can have strong implications, as we illustrate in the next, more stylized example.
Example 2: Let there be two firms and ten investors. Each of the ten investors holds a 1% stake in firm
1, and so the retail share of firm 1 is 90%. Each of the ten investors also holds a x% stake in firm 2 (so x ≤
10%), and so the retail share of firm 2 is (100 - 10x). This ownership pattern is summarized in Table 2.
7 That retail investors drop out may not be an unrealistic feature of the model. For example, a recent report by ProxyPulse
examined 3,379 proxy meetings in the first half of 2017 and found that while institutional investors own 70% of shares and
vote them 91% of the time, retail investors holding the remaining 30% voted those shares only 29% of the time. ”2017 Proxy
Season Review”, ProxyPulse. However, as we discuss later, it is important to consider large individual investors, e.g. insiders
and founding families, when identifying the retail share, since it would be incorrect to treat them as atomistic.
5Table 2: Example 2 Ownership Structure
Firm 1 Firm 2
Investor 1 1% x%
Investor 2 1% x%
.. .. ..
. . .
Investor 10 1% x%
Retail Share 90% (100-10x)%
Notes: This table presents investor holdings in two firm for Example 2. Note N · x ≤ 100.
In such a world, by applying equation (1), we obtain that firm 1 places a profit weight of x on firm 2,
and firm 2 places a profit weight of 1/x on firm 1. So, if x = 3, where the ten investors also each own
3% of firm 2, then firm 1 prefers firm 2 profits to its own by a factor of three. What would this mean in
practice? It is difficult to fathom the market outcome where one competing firm makes decisions placing a
significantly higher weight on rival profits than on own profits. If a competitor were as efficient as myself,
then in a pricing game I should set my prices so high as to divert almost all sales to that firm whenever our
products are substitutes.
Though the example is designed to be striking, it is not without precedent. The literature on “tunneling”
has shown how the divorce of control rights and cash-flow rights create perverse behavior, in which an owner
will wish to transfer assets and cash flows from one firm (the one in which the owner has low cash-flow
rights) to another (the one in which the owner has high cash-flow rights), defrauding minority investors in
the former firm (Porta et al., 1999; Johnson et al., 2000; Bertrand et al., 2002). However, there are major
differences: first, in the tunneling literature, the divorce of control rights and cash-flow rights comes from
institutional structures (e.g., “golden shares”). Instead, in the theory of common ownership, this divorce is
coming through investor concentration. If control rights (γ) are an increasing function of ownership share
(β) as they are in our specification, which assumes γ = β, then an investor with a 10% ownership share
has more influence than two investors with 5% each. And, if γ → 0 as β → 0, then retail investors have
no influence. This dilution of control rights for small and fragmented owners affords out-sized influence for
the largest investors.8 Second, however, though tunneling is possible for extremal values of κ > 1, under
common ownership it is not generally the case that minority investors are harmed. Indeed, if profit weights
are roughly symmetric and approaching 1, then the theory, as we outline it next, predicts that prices will
approach monopoly levels, in which case minority investors, like common owners, will benefit at the cost of
consumer welfare.
Implications for Pricing: In order to translate the common ownership hypothesis into economic out-
comes, both for understanding its economic significance and for drawing out testable empirical predictions,
we need to be more specific about the strategic interaction of firms. We focus on the canonical case of
differentiated Bertrand price competition with single product firms where firms compete by setting prices,
8 It might be tempting to argue that two investors with symmetric ownership shares ought to have the same influence as
one with their combined ownership. For this to be true everywhere, it would require that γ be invariant to β, e.g. γ = 1.
Such a model has particularly perverse consequences. Revisiting Example 1, suppose that investor 1, who owns firm 1 in its
entirety, bought a single share of firm 2’s stock (an epsilon-small stake). If γ = 1, then this seemingly innocuous purchase would
discontinuously raise κ21 from 0 to 2.5. Even though the purchase is small, γ = 1 implies that the welfare of firm 1 would then
be entirely on firm 2’s books. In order to avoid such discontinuities, we need γ → 0 as β → 0, which γ = β trivially satisfies
(but so, of course, would many other specifications).
6as in O’Brien and Salop (2000). They each set a price pf , and demand for product f is given by a function
Df that maps all prices into quantity sold, i.e. qf = Df (p1 , . . . , pf ). Then writing marginal costs cf , we
have:
πf = (pf − cf )Df (p1 , . . . , pf ). (2)
In a world without common ownership, firms choose pf to maximize πf . In the presence of common owner-
ship, firms solve:
X
Choose pf to max πf + κf g πg .
g
|{z}
own profit | {z }
common ownership concerns
To characterize the prices firm f will set in equilibrium, we use the first order condition of firm f ’s optimiza-
tion problem. Plugging in (2) and taking the derivative with respect to pf yields
∂Df (p1 , . . . , pf ) X ∂Dg (p1 , . . . , pf )
0 = Df (p1 , . . . , pf ) + (pf − cf ) + κf g (pg − cg ) . (3)
∂pf ∂pf
} |g
| {z }
inframarginal | {z {z }
marginal
diverted
The first two terms are the usual countervailing inframarginal and marginal effects of raising prices. Infra-
marginal customers do not switch, and so the price increase raises profits. Marginal customers do, and so
those lost sales diminish profits. The third term, however, is new. It captures the profits generated by sales
that are diverted to firm f ’s competitors when they raise their price. According to the theory of common
ownership, firm f values the profits of competitor g according to weights κf g . If products are net substitutes,
then this third term in the first-order condition is always positive, and therefore it can be shown that prices
will be strictly higher than they would be in a world in which firms maximize only own-firm revenue.9,10
This result summarizes the heart of the controversy over the common ownership hypothesis, as well as its
central testable implication: that consumers face higher prices because of the presence of common owners.
Though their size is an empirical question, there is reason to believe they may be large. For comparison,
consider a scenario we routinely regulate: the merger of two large competitors selling substitute products.
In practice, the computation of the price effects of such mergers is equivalent to setting the profit weights of
these firms on each other to 1, following the work of Nevo (2000). These effects are often large, but can be
dampened by the presence of competitive third parties in a market. In contrast, common ownership affects
all publicly traded firms. In the absence of competitive pressure from privately (or narrowly) held firms,
this can lead to dramatic predictions for pricing and consumer welfare. However, we note several caveats to
this theoretical analysis.
Remark: corporate governance, owners, and managers. The model of common ownership, that
firms maximize a γ-weighted sum of investors portfolios, given by β, is implicitly a model of corporate
governance. Why exactly do firms care more about larger shareholders? If they have more voting power,
how does that translate into effects on firm decision-making?
9 By dividing the last term in (3) by ∂D /∂p we obtain a diversion ratio, which has many applications in antitrust analysis
f f
(Werden, 1996; Farrell and Shapiro, 2010). For a recent treatment the estimation of diversion ratios, see Conlon and Mortimer
(2019).
10 It is also worth noting that if two firms do not compete in a product market, there should be no effect of κ
f g on prices. If
two firms are part of the same vertical supply chain or produce complements, a positive κf g may even result in an increase in
efficiency.
7As we discussed above, the literature has followed Rotemberg (1984) in assuming γsf = βsf , for two rea-
sons: first, for empirical tractability. As we discuss below, data on large institutional investors’ shareholdings
are publicly available. But second, there is little guidance from the corporate governance literature on how
to best model γ. As an alternative, one could use Banzhaf power, a model of voting power borrowed from the
political science literature.11 Alternatively (and in a different context), Crawford et al. (2018) propose that
P
firms with higher f βsf be given less weight γsf . In our own computations we follow Rotemberg (1984)
in setting γf g = βf g . However, this is an area where new research in the corporate finance literature could
yield great progress, and we hope to see more work in this area going forward. Beyond intuitive qualitative
features – e.g., γsf ought to be monotone in βsf – any parametric form seems arbitrary. In the presence of
common ownership effects, though, we note that these forms may be empirically testable.12
Whatever the functional form, an oft-raised objection to the common ownership hypothesis concerns the
conflation of ownership and management of assets. Large asset managers such as Blackrock and Vanguard
work on behalf of their clients, who are the ultimate owners. Do they have a financial incentive to affect the
coordination implied by common ownership? The common ownership profit weights κ assume that they do.
While some work has endeavored to directly quantify their financial incentives to maximize the value of the
assets they manage, a more direct reply is to perhaps take them at their word when they claim to have a
fiduciary duty to their clients. Moreover, there is extensive empirical evidence (see Brav et al. (2018), Gilje
et al. (2018b)) suggesting that they are, in fact, active in corporate governance. Whether their incentives are
strong enough – or whether they take that fiduciary duty seriously enough – to want to soften competition
in product markets is a difficult question with little direct empirical traction. Still less is known about the
feasibility and costs of conveying such intentions to management. For this reason we believe that the debate
ought to focus on the directly testable empirical predictions for economic outcomes – e.g. prices – in specific
markets.
Remark: alternative strategic interactions. The model above is consistent with the most controversial
claims of prior work, that common ownership means that firms set higher prices. However, firms do much
more than price-setting. They make R&D choices, they engage in vertical contracting, and participate in a
plethora of other activities for which it is not obvious that common ownership is a threat. Indeed, it may be
efficiency-enhancing. For example, if common ownership arises between two vertically-oriented firms such as
a retailer and a supplier, then common ownership may help to mitigate double marginalization (although it
is worth noting that if such concerns were large, firms in such situations have better tools to align incentives,
such as contracts). Alternatively, López and Vives (2018) show that the welfare implications of common
ownership are ambiguous in the setting of R&D spillovers. The point being that while the literature has
been focused on price-setting (and perhaps reasonably so, given the potential antitrust implications), there
are other games in which the welfare effects of common ownership are not decisively negative.
This observation raises an important empirical point for future work. It may be that as the literature
11 A voter’s Banzhaf power is proportional to the number of winning coalitions in which they are a swing voter Banzhaf
(1965). It is computed by first determining the set of all winning coalitions of voters. For each winning coalition, pivotal voters
are identified. The Banzhaf power for a voter is the number of cases where that voter is found to be pivotal, divided by the
total number of pivotal votes.
12 For example, the common ownership weights κ
f g described above are very sensitive to increasing concentration among
asset managers and increasing scale. In contrast, the weights proposed by Crawford et al. (2018) normalize out investor scale,
and emphasize portfolio composition.
8unfolds, the clearest evidence on common ownership will come not from pricing games, but from models
of entry, product positioning, R&D, or other strategic interactions. Modeling these other implications will
generate a bevy of additional testable empirical implications for the theory, and is an open area for research.
Remark: indices of common ownership. Finally, we want to address the theoretical foundations (and
limitations) of what are becoming commonly-used indices of market power, adjusted for common ownership.
They go by names such as MHHI, MHHI-D, GHHI, etc. These indices are derived from a theoretical model
of common ownership under symmetric Cournot competition – i.e., quantity-setting competition among a set
of identical firms selling a homogenous output. These measures face the same problems that plague measures
of market concentration such as HHI: They are theoretically uninterpretable as measures of market power
and often misleading in differentiated products markets. Moreover, in contrast with direct measurement of
the common ownership weights κ, concentration indices such as MHHI are extremely sensitive to market
definition, as they are functions of market shares. For an explicit derivation of the MHHI measure from
investor holdings, see Appendix C of O’Brien and Salop (2000). As we will discuss later, the use of these
measures can raise identification problems in empirical applications, and has clouded the debate on the
common ownership hypothesis.
3 Data
This section describes the different data sources available to study the common ownership hypothesis. The
first part would be of use to anyone interested in conducting applied research in this area, but other readers
should consider skipping ahead to the descriptives in Section 3.2.
Data on holdings of large investors come from multiple original sources and are also aggregated and
distributed by third-party data firms. In particular, institutional investment managers that manage over
$100 million in “Section 13(f)” securities, which are defined by the SEC, must file a form 13(f) with the
SEC on a quarterly basis to report their holdings. These reports include the CUSIP (Committee on Uniform
Security Identification Procedures) number for each security held, which can be used to interface these data
with other datasets. This is the primary source of data used in assessing common ownership. In addition,
mutual funds must report their holdings on a semi-annual basis at the individual fund level using form N-30D.
All of these filings are available on the SEC’s EDGAR platform going back to 1999, when electronic filing
became mandatory; Thomson Reuters makes these data available going back to 1980 in different commercial
datasets.
Ancillary datasets are often used in conjunction with the Thomson Reuters dataset. A first is from CRSP,
the Center for Research in Securities Prices, which contains data on share prices as well as the number of
shares outstanding, and is indexed by what is called a PERMNO for each security. CRSP also maintains lists of
stock market index composition for a large set of indices. Wharton Research Data Services (WRDS) created
a crosswalk from CUSIP codes to PERMNO codes. A second dataset often linked to the Thomson Reuters data
is Compustat, which can be searched by CUSIP or their own proprietary GVKEY variable, and contains firm
filings accounting data.
93.1 Data quality concerns
There have been a number of data quality concerns relating to the Thomson Reuters 13(f) dataset (referred to
as the “S34” dataset) dating back to 2010. The dataset is commonly accessed through the WRDS platform,
and WRDS has been active in trying to correct for a number of the data quality issues. Ben-David et al.
(2018) identified a number of additional data quality issues with the Thomson Reuters dataset. As of July
2018, WRDS has addressed a number of the concerns raised and produced an updated version of the S34
dataset.13 However, some issues with the data relate to how they should be interpreted in light of the theory
above, while other issues are strictly errata that must be corrected for. Below, we discuss various data issues
and whether or not they have been addressed in the WRDS July 2018 update.
Short positions One oddity in the data is that on occasion, more than 100% of a firm’s outstanding
shares as reported by CRSP are reported as owned in the 13(f) filings for that quarter. One explanation
is double-counting of shares due to short-selling: if investment firm A lends out shares to investor B, who
then sells those shares to investor C to create a short position, both A and C may report owning the shares.
Data on short positions is available via Computstat. From a theoretical standpoint, only one agent per share
should be able to exercise any control over the target firm at any point in time, and so this potential double-
counting introduces some error into common ownership analyses. Christoffersen et al. (2007) investigate
“vote trading” as an activist investor strategy, where shares are borrowed to exercise control at low cost, and
find that “double voting” of lent shares is a pervasive phenomenon. The WRDS dataset presents holdings as
reported and so makes no correction for possible double-counting. Lewellen (2011) finds that shares reported
exceeding shares outstanding to be a rare occurrence and of a small magnitude. Ben-David et al. (2018)
recommends updating the shares outstanding variable in the S34 dataset to be the values found in CRSP
whenever the two disagree.
Dual-class Shares Many publicly traded firms have multiple classes of shares with different levels of
voting control. From a data reporting standpoint, this is not a concern, as the securities have difference
CUSIP designations. However, the theory models above effectively assume one vote per share. To the
extent that this is not the case, then any implied profit weights are incorrect. In principle, when studying
a particular setting, one could explicitly adjust for dual-class shares using the γ term. In practice, in the
descriptive exercise below, dual-class firms are removed from the sample. It should be noted that as with the
retail investor share discussed below, different approaches to dual-class shares make very different predictions
about profit weights under different models of common ownership.
Thomson Reuters S34 dataset WRDS and Thomson Reuters began to notice data irregularities in the
S34 dataset in 2010. In addition, Ben-David et al. (2018) noted additional data issues, such as Blackrock
disappearing from the dataset in 2014 and re-appearing with far too low a level of assets in 2015. A
collaboration between those authors, WRDS, and Thomson Reuters resulted in an updated dataset as of
July 2018 that is believed to address a large number of the concerns raised. WRDS has released a document
13 In particular, 13(f) filings were mandated to be in an XML format staring in the third quarter of 2013, and WRDS has
parsed these filings to guarantee accuracy of the Thomson Reuters dataset.
10detailing the fixes.14
Retail and other small investors Given the reporting requirements for institutional investors features
a specific cutoff for assets under management, the holdings of firms managing less than $100 million are
not reported. Individual investors need not necessarily report holdings, although in many cases individual
investors employ large investment management firms to manage their portfolio and so those holdings are
reported by those investment managers. To the extent that an individual has large holdings at multiple
investment management firms, the data will not necessarily reflect the “common” element of those holdings.
From a theoretical point of view, this creates an additional problem: suppose we observe the ownership of
60% of a firm’s common shares in the S34 dataset. The remaining 40% is held by diffuse investors about
whom we know nothing. One assumption might be that these shares are held by atomistic investors, and
so would each have βs = 1/N , where N is shares outstanding. Another assumption might be that these
investors are all undiversified and act in lock step, and so should be considered as one representative agent
with βs = 0.4. Both of these approaches could be justified, but would result in very different profit weights.
Insider Holdings The SEC requires “insiders” to make additional disclosures regarding holdings of a firm
(forms 3, 4 and 5). An insider is defined as an officer, a director, or anyone owning 10% or more of a firm’s
shares. Researchers investigating a particular set of firms should investigate any insider holdings information
to see if the holdings are being reported by a larger custodial institution. For example, Backus et al. (2018a)
show that the Kellogg Foundation held a major stake in Kellogg’s, but that the foundation’s shares were
reported in Bank of New York’s 13(f) filings in many quarters. The foundation itself is not diversified and
so this reporting mixed the holdings of an undiversified owner (the Kellogg Foundation) with the holdings
of their diversified bank (Bank of New York).
Aggregation One final point raised by Ben-David et al. (2018) and not yet addressed by WRDS is that
there may be multiple entities reporting in the S34 dataset that are actually subsidiaries of one large entity.
To make a simple example, in the final quarter of 2016, the following entities report holdings separately:
“BLACKROCK INC,” “BLACKROCK ADVISORS, LLC,” “BLACKROCK ASSET MGMT IRELAND,”
“BLACKROCK INVESTMENT MGMT, LLC,” “BLACKROCK JAPAN CO., LTD.,” and “BLACKROCK
INVT MGMT (UK) LTD.” (each under a unique “mgrno” in the S34 dataset). If the control rights of these
entities are coordinated, then one would want to consolidate them into one entity before computing profit
weights. While this has not been addressed by WRDS, it is not difficult for an applied researcher to
consolidate these entities.
Source Documents Finally, some researchers have noted that the source documents themselves – Form
13(f) filings made by institutional investors – contain errors. In particular, Anderson and Brockman (2016)
document irregularities and caution the use of 13(f) filings in research or in investing. The SEC’s Inspector
General in 2010 noted several issues with how 13(f) filings are handled, see Securities and of Inspector General
(2010). The authors of this current paper noticed when examining ownership of airlines that many filings
14 S12/S34 Regenerated Data, accessed at https://wrds-www.wharton.upenn.edu/documents/952/S12_and_S34_
Regenerated_Data_2010-2016.pdf
11contained errors around bankruptcy events. This emphasizes the importance of manual data-cleaning when
studying common ownership in particular industries.
Alternative Data Sources Due to the irregularities in the Thomson Reuters dataset, particularly around
2011-2013, the authors in (Backus et al., 2018b) gather all original 13(f) filings from the SEC starting in 1999
(the era of mandatory electronic filing) and parse them to obtain holdings for S&P 500 firms.15 The authors
show examples where major firms are only reported to have a few institutional holders in the Thomson
Reuters dataset in some quarters but in fact have many holders in the raw 13(f) filings.
3.2 Descriptive data on common ownership
While there have been a number of analyses and rebuttals regarding the common ownership hypothesis, it
is undeniable that a few large investment management firms have amassed large, diversified portfolios of
all major publicly-traded firms over the past few decades through their mutual funds or exchange-traded
funds. Below, we document some basic facts contained in the S34 dataset and our own novel dataset of 13(f)
holdings about ownership of firms listed in the S&P 500 Index. It should be noted that descriptives based
on 13(f) data require no market definition. While one firm may have an implied profit weight for another, if
the two firms do not compete in a product market, it is unlikely that there would be any effect from common
ownership. After examining the economy as a whole, we will pick some specific product markets to examine.
We have made some data corrections to the dataset to, for example, consolidate all “BLACKROCK” entities,
as well as consolidate all “STATE STR” entities.
As a starting point, Figure 1 shows the number of 13(f) managers reporting over time.16 The number
of such managers has greatly increased, and at least part of the increase is due to the nominal reporting
barrier. One dollar in 1980 is worth approximately $3.24 in 2018, and yet the number of 13(f) investment
managers has more than quintupled in that time. This suggests both substantial entry into the investment
management space, and more diffuse management of investments over time.
The red line in Figure 1 indicates that most of the new managers are classified as undiversified managers,
which we define as having holdings in fewer than 50 of the S&P 500 firms. However, Figure 3 shows that
the share of the average S&P 500 firm owned by all 13(f) managers has greatly increase over time, from
under 40% in 1980, to approximately 80% in 2017. While it is true that publicly traded firms represent a
decreasing share of the economy over time, the S&P 500 is specifically chosen to reflect the overall United
States economy, and so this change is reflective of a change in investment concentration.
In contrast, Figure 3 specifically plots, over time, the average percent of S&P 500 firms held by Blackrock,
Vanguard, and State Street over time. Blackrock here includes holdings by Barclays, whose iShares product
was acquired in 2009. These three major firms went from each holding under 1% of a typical S&P 500 firm
to holding roughly 5% (State Street) to over 7% (Vanguard). These three investment managers were chosen
given their emphasis in the literature and large holdings at the end of the sample, but we cannot rule out
15 The authors make the profit weights available for the firms they study and are happy to provide code to researchers
interested in studying different firms.
16 As a reminder, a 13(f) manager is a legal definition by the SEC. The relevant part of the definition is that the firm manages
over $100M of securities.
12Figure 1: Number of 13(f) Managers
Notes: This figure depicts the number of 13(f) managers in our dataset. The red line depicts those that are “undiversified,” i.e. have
holdings in fewer than 50 S&P 500 firms, whereas the blue line includes all investors.
Figure 2: Share of S&P 500 Ownership Over Time
Notes: This figure depicts the sum of the holdings of invesotors in our dataset in a representative firm or, equivalently, what we are
calling the institutional share of ownership.
that other investment managers could also be plotted here and would show qualitatively similar patterns.
The implication of these two figures is that there has been a massive increase in assets under management
at investment firms over time; this increase has coincided with the entry of many new, large investment
managers; but there has also been a large amount of consolidation in the “diversified” investment manager
13Figure 3: Ownership of S&P 500 Firms
Notes: This figure depicts the assets under management (AUM) over time of Blackrock/Barclays, Vanguard, and State Street. Data
are from our scraped and parsed dataset of raw 13(f) filings.
space, particularly with firms like Blackrock, Vanguard, State Street, and others.
One concern about looking at the S&P 500 as a whole is that many of the firms are operating in
separate markets, and so common ownership is unlikely to affect strategic decisions. For example, even if
a pharmaceutical company and an airline share a large investor, since their decisions are unlikely to affect
each other’s profit, there is no change in incentives from common ownership. To address this, Figure 4 shows
institutional ownership in three specific sectors: ready-to-eat cereal, airlines, and commercial banks. We
hand-collect data on firms for the first two product markets and use the Compustat SIC code to classify
commercial banks in the S&P 500 by their SIC code of 6021.17 As can be seen, the overall trends in
these specific product markets are similar, with large shares being accumulated by investment management
firms over time. When looking at specific industries, larger swings in holdings are visible due to mergers,
bankruptcies, entry, etc.
3.3 Implied profit weights
Given this data, we can also compute implied profit weights that firms in the S&P 500 Index have for
other firms in the index over time. The figures below are from Backus et al. (2018b) and highlight the
long-term trends in implied profit weights. The trend is steadily increasing over time. This reflects the
ownership patterns described in 3.2 – both increasing diversification of investor portfolios, as well as increasing
concentration in the market for asset managers. Figure 5 shows that for a typical firm in the S&P 500, the
profit weight for any other firm in the S&P 500 implied by the common ownership hypothesis has increased
17 This calculation therefore excludes privately held banks and credit unions that are likely to be narrowly held and thus
overstate the overall common ownership effect for the banking sector.
14Figure 4: Institutional Ownership of Firms Within Product Markets
Notes: This figure depicts the sum of the holdings of investors in our dataset in a representative firm or, equivalently, what we are
calling the institutional share of ownership for airlines (left), and banks (right).
from approximately 0.2 in the 1980s to approximately 0.7 in the late 2010s.
In terms of heterogeneity, one would expect profit weights to differ across firms in terms of the retail
share of their ownership. As discussed in Section 2, if small investors effectively have no control, then firms
with large retail shares of investors see any common ownership effect magnified. Figure 6 shows that after
controlling for year fixed effects, there is clearly a relationship between profit weights and the retail share of
a firm. The more of a firm held by retail investors, the more magnified is the implied common ownership
effect of investment managers.
Finally, we will examine three specific product markets that have received attention in the empirical
literature on the common ownership hypothesis: airlines, banks, and ready-to-eat cereal. For the first two,
shown in Figure 7, we compute pairwise profit weights for 1980-2017. For banks, we use SIC code 6020
to select firms from the S&P 500 sample. For airlines, as many airlines are not S&P 500 constituents, we
manually created a set of 23 securities associated with nationwide airlines over the relevant time period.
Given the number of mergers and bankruptcies, the time-series unfortunately reflects a large amount of
entry and exit and significant cleaning of the data was required (many institutional investors continued
reporting holdings of non-existent securities long after bankruptcies). We compute the average profit weight
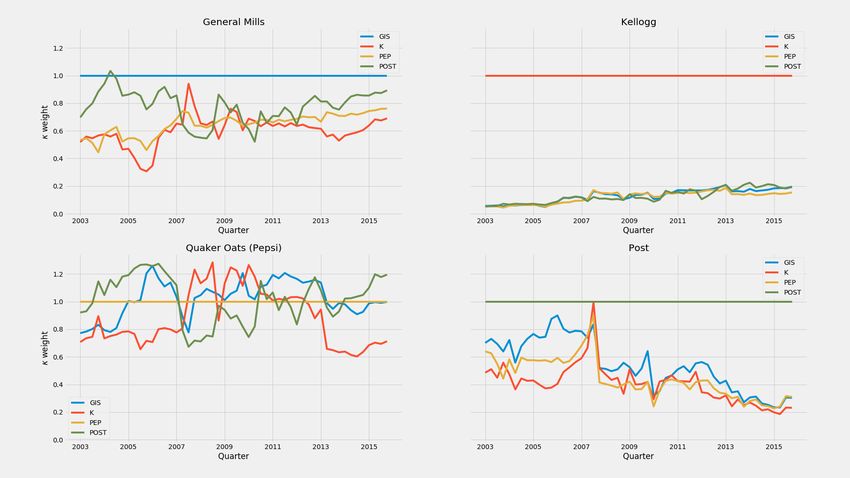
on rivals and average within quarter. For the third product market, presented in Figure 8, we borrow from
Backus et al. (2018a) and show all pairwise profit weights for 2003-2017. The fact that Kellogg’s has large,
undiversified owners is immediately apparent.
15Figure 5: Average Profit Weights for S&P 500 Firms, 1980-2017
Notes: This figure depicts the average common ownership profit weight for pairs of S&P 500 firms by quarter from 1980 through 2017.
Figure 6: Average Profit Weights on Other Firms by Retail Share
S&P 500 Firms, 1980-2017, Year FEs
Notes: This figure reports the mean common ownership profit weight for twenty equally sized groups of firms ranked by retail share,
which is given by 1 minus the sum of the institutional holdings observed in our dataset. We have residualized on year fixed effects in
order to remove any mechanical relationship introduced by the downward trend in retail share.
16Figure 7: Average Profit Weights on Other Firms For Banks and Airlines
Notes: This figure depicts the average common ownership profit weight for pairs of airlines (left) and banks (right) by quarter from
1980 through 2017.
Figure 8: Average Profit Weights on Other Firms For RTE Cereal
Notes: This figure depicts the common ownership profit weight for each major ready-to-eat cereal manufacturer on each other manu-
facturer from 2003 to 2017. Note that the own-profit weight is normalized to 1.
3.4 Calibrating Price Effects
As we discussed above, the manifestations of common ownership profit weights are myriad. However, a
first-order question one might ask is whether the scale of the increase in profit weights depicted in Figure 5
17could generate large increases in markups. In order to answer this question, we calibrate a simple model of
Bertrand competition in Backus et al. (2018b).
Consider a market with eight symmetric firms, which would imply an HHI of 1250. We assume that these
firms sell a single product each, that products are substitutes, and that consumers choose the product which
gives them the most utility uij = α − βpj + εij , where εij is an i.i.d. logit preference shock. We calibrate
α and β so that the outside good share is approximately zero, and we match the markups of Eekhout et al.
(2018) of 1.21 in 1980. This yields a price elasticity of −7.
Figure 9: Simulated Markups: 1980–2017
Notes: This figure presents predicted markups for the calibration exercise. See the text for exact specification.
With this calibration in hand, we then simulate prices forward to 2017 in Figure 9. We stress that this is
a back-of-the envelope calculation. We find that while we are able to explain approximately 90% of the rise
in markups found in Eekhout et al. (2018), the timing is off – that the rise of common ownership incentives
seems to substantially lag the rise of markups depicted in Eekhout et al. (2018). It is difficult to conclude
that common ownership is driving markups; however, we do find that if we take the theory seriously, and it
remains to be shown that we should, the effects would be economically large.
4 Empirical Results in the Literature
The preceding sections have documented how the true primitive of common ownership —the profit weights
κf g —have increased over time. We now turn to empirical evidence on the competitive effects of common
ownership. Much of the initial empirical literature that addresses the common ownership hypothesis has
its roots in the so-called Structure-Conduct-Performance (SCP) paradigm in Industrial Organization which
dates back to Bain (1951). The central conceit of the SCP literature was to regress measures of firm
performance (profits, prices, and investment) on measures of market concentration (market shares, Herfindahl
18Indices (HHI),18 etc.), often using data across industries. Much of the recent literature measuring the impact
of common ownership on prices (such as Azar et al. (2018b), Azar et al. (2016), Antón et al. (2018b), Kwon
(2016)) can be viewed as an extension of the SCP approach.
Indeed, the regressor of interest in a number of these papers is what is known as the Modified HHI
Delta (MHHID). It amounts to the product of the two market shares of (sf , sg ) in market m and period t,
interacted with the κf g profit weight.19 The motivation is to extend the typical notion of concentration to
include common ownership and to run SCP-style regressions of the form:
log pf mt = β0 + β1 HHImt +β2 M HHIDmt +β3 log sf mt + εf mt .
| {z } |
P P
{z }
2
P
f sf mt f g6=f κf gt sf mt sgmt
These recent papers tend to find both that concentration is associated with higher prices (β1 > 0), and also
that higher effective concentration from common ownership is associated with higher prices (β2 > 0).
As early as the 1970’s, there were a number of theoretical criticisms of the SCP approach. The rela-
tionship between prices and measures of market concentration (including HHI) is predicated on very strong
assumptions about market structure, the cost structure of the industry, and conduct (such as Cournot com-
petition with homogeneous products and symmetric marginal costs). Demsetz (1973), a seminal paper that
anticipated the direction of modern IO, suggests the following example to highlight the problem: suppose we
reallocate market share from a smaller, high-cost firm to a larger, low-cost firm. While this would increase
most measures of market concentration (such as HHI) and market power (price cost margins), this might
also lead to lower prices and higher surplus for both consumers and producers.20
A second critique, often associated with Bresnahan (1989), is that the relationship between prices and
concentration (market shares) is an equilibrium relation that may represent either a supply curve or a
demand curve (or more likely, neither). Put simply: Which “causal relationship” between price and quantity
are we trying to identify? Absent specific exclusion restrictions, regression analysis might not identify any
meaningful economic relationship. This problem is further exacerbated by the fact that exclusion restrictions
required by instrumental variable (IV) approaches are hard to come by. The classic argument for exclusion
of an instrumental variable is “something that appears in another equation.” The challenge arises because
both prices and market shares are equilibrium outcomes (linked by first-order conditions), and most relevant
variables would affect both supply and demand; thus, almost nothing can be excluded.21
The demise of the original SCP literature is summarized in Schmalensee (1989), which concludes by
noting that this line of research...
“... has taught us much about how markets look, especially within the manufacturing sector in
18 The HHI is computed as the sum of squares of market shares, or HHI = f s2f .
P
19 The MHHI was originally conceived of in the context of homogeneous good Cournot competition. It is computed as
P P P P
M HHI = f g κf g sf sg , which can be rewritten as M HHI = HHI + f g6=f κf g sf sg . The latter term is referred to as
the MHHI-Delta, or the difference between HHI and MHHI.
20 Another famous (and simple example): in the perfectly competitive model with upward sloping supply there exists a
mechanical relationship between HHI and price even though all firms are price takers, and so HHI cannot have a causal effect
on prices charged by firms. That is, industry concentration would have no causal effect on prices even though a regression
would show a statistically significant relationship.
21 Fixed costs have been proposed as a potential instrument for concentration or the number of firms, but are notoriously
difficult to measure. Other proposed instruments for concentration include mergers undertaken for unrelated reasons.
19You can also read