An Experimental Study of Cryptocurrency Market Dynamics - arXiv
←
→
Page content transcription
If your browser does not render page correctly, please read the page content below
An Experimental Study of Cryptocurrency Market Dynamics
Peter M. Krafft∗ Nicolás Della Penna∗ Alex “Sandy” Pentland
MIT CSAIL Australian National University MIT Media Lab
Cambridge, MA, USA Canberra, Australia Cambridge, MA, USA
pkrafft@csail.mit.edu me@nikete.com pentland@mit.edu
ABSTRACT time as cryptocurrencies have gained popularity, their rise has
As cryptocurrencies gain popularity and credibility, market- been punctuated by crises. From the collapse of Mt. Gox
places for cryptocurrencies are growing in importance. Un- in 2014 to the 2016 hack of Etherium, market crashes have
arXiv:1801.05831v2 [cs.CY] 24 Apr 2018
derstanding the dynamics of these markets can help to assess been a regular occurrence. Understanding the dynamics of
how viable the cryptocurrnency ecosystem is and how design cryptocurrency markets may allow us to anticipate and avoid
choices affect market behavior. One existential threat to cryp- future disruptive events.
tocurrencies is dramatic fluctuations in traders’ willingness to
One potential threat to cryptocurrencies derives from the spec-
buy or sell. Using a novel experimental methodology, we con-
ulative nature of these assets. Many participants in these mar-
ducted an online experiment to study how susceptible traders
kets trade because they expect one or another cryptocurrency
in these markets are to peer influence from trading behav-
to increase in value. Such collective excitement can lead to
ior. We created bots that executed over one hundred thousand
bubbles and subsequent market crashes. The design choices of
trades costing less than a penny each in 217 cryptocurrencies
the online exchanges where cryptocurrencies are traded may
over the course of six months. We find that individual “buy”
also contribute to these effects if aspects of available function-
actions led to short-term increases in subsequent buy-side ac-
ality, graphical user interfaces (GUI), or application program-
tivity hundreds of times the size of our interventions. From
ming interfaces (API) promote collective excitement. Markets
a design perspective, we note that the design choices of the
are human artifacts, not natural phenomena, and therefore a
exchange we study may have promoted this and other peer
target of design [53]. In the present study we strive to better
influence effects, which highlights the potential social and
understand the factors that contribute to collective excitement
economic impact of HCI in the design of digital institutions.
in cryptocurrencies, and how the design of cryptocurrency
market mechanisms and interfaces may affect these processes.
ACM Classification Keywords
J.4 Social and Behavioral Sciences: Economics; K.4.2 Social Central to these goals is understanding why people at a partic-
Issues; H.5.m. Information Interfaces and Presentation (e.g. ular time decide to invest in a particular technology, product,
HCI): Miscellaneous or idea. If the asset is new, or information about it has just
been released, investment might be a rational response to the
Author Keywords present state of information [9]. Other factors could include
Cryptocurrencies; online markets; peer influence; authorities endorsing the investment, or big players making
computational social science; online field experiments; digital noticeably large bets on it [8]. Another hypothesized source of
institutions; design; market design collective optimism is peer influence among small individual
traders [12, 78, 41]. Understanding these endogenous peer
INTRODUCTION influence effects is especially important. If the dynamics of
Cryptocurrencies, a.k.a. “cryptocoins”, are rapidly gaining financial markets are heavily affected by small trades, different
popularity. The price and market cap of these assets are touch- solutions may be needed in order to stabilize the markets.
ing all-time highs, with billions of U.S. dollars of value per
day currently being traded in cryptocoins. Financial institu- Peer influence may play a particularly large role in the cryp-
tions are investing in building digital currency technologies. tocurrency ecosystem due to the highly speculative nature of
Blockchain-based tech startups are thriving. As these changes these assets. While in general the intrinsic value of curren-
in the cryptocurrency ecosystem occur, the need to understand cies increases with greater levels of adoption, here we expect
the market dynamics of cryptocoins increases. At the same that much of the trading is speculative. As is characteristic
of many new technologies, there is a great deal of uncertainty
* Authors contributed equally. Corresponding author: NDP. around which cryptocurrencies will eventually be successful,
Permission to make digital or hard copies of all or part of this work for personal or and there has been a general feeling that some altcoin will be-
classroom use is granted without fee provided that copies are not made or distributed come a transformative financial technology. Many participants
for profit or commercial advantage and that copies bear this notice and the full citation in these marketplaces therefore are likely hoping to be early
on the first page. Copyrights for components of this work owned by others than the
author(s) must be honored. Abstracting with credit is permitted. To copy otherwise, or investors in “the next Bitcoin”, and we can attempt to observe
republish, to post on servers or to redistribute to lists, requires prior specific permission the extent to which the bets of these traders may be affected
and/or a fee. Request permissions from permissions@acm.org.
by the bets of their peers.
CHI 2018, April 21–26, 2018, Montreal, QC, Canada
© 2018 Copyright held by the owner/author(s). Publication rights licensed to ACM.
ISBN 978-1-4503-5620-6/18/04. . . $15.00
DOI: https://doi.org/10.1145/3173574.3174179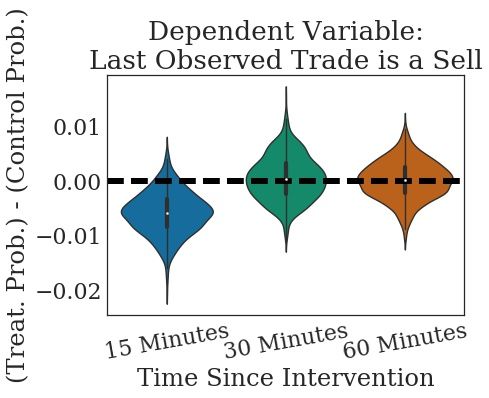
There are several challenges to identifying the effects of small
individual trades in financial markets. Much of our present
knowledge about financial markets is derived from analysis
of observational data, but observational analyses are subject
to confounding interpretations. For example, excess correla-
tion in market prices is often cited as evidence against traders
engaging in the purely rational behavior predicted by the effi-
cient market hypothesis [57, 59], but these correlations could
be due to delayed reaction or overreaction to news events, as
well as perhaps due to peer influence. Experimental evidence
is desirable because of these difficulties with observational
data. Laboratory studies have been conducted in which causal
inferences can be made (e.g., [77, 2, 22, 64]), but these studies
are limited in their capacity for generalization to real financial
markets. Since markets are noisy, and the effect of individual
trades is likely to be small, a field experiment in this area
requires a large sample size, which would be expensive to
collect for scientific purposes in traditional financial markets.
We overcome these challenges using a field experiment in
an online marketplace for cryptocurrencies. Cryptocurrency
markets provide a unique opportunity for field experimentation
due to their low transaction fees; low minimum orders; and
free, readily accessible public APIs. We created bots to trade
in 217 distinct altcoin markets in an online exchange called
Cryptsy. Each bot monitored a market and randomly bought
or sold the market’s associated altcoin at randomly spaced
intervals. By comparing our buy and sell interventions to
control trials we can estimate the effects that our trades had on
the dynamics of these markets. In total we conducted hundreds
of thousands tiny trades in these markets over the course of six
months, and this large sample size allows us to test the effects
that our small individual trades have in these live markets.
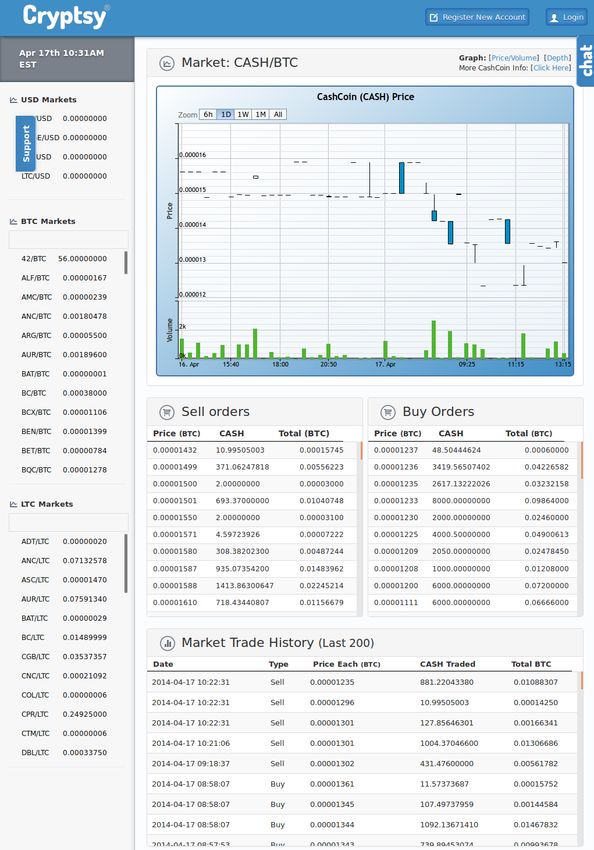
With an eye towards design implications, we also conduct Figure 1: A screenshot of the Cryptsy trading platform inter-
an enumerative analysis of the importance in this context of face. Source: http://archive.is/tDFIw.
Cryptsy’s design choices. We identify the position of Cryptsy
in a space of existing and potential exchange designs, and
discuss the possible effects of the dimensions of its position. to Litecoin but was branded as the official cryptocurrency of
Our analysis reveals that the traders we study are susceptible Iceland. Auroracoin at one point had a market cap of 500
to peer influence and highlights how Cryptsy’s design choices million USD. Other coins are associated with real technical
might have exacerbated this effect. innovations. For example, Ether is used by the Ethereum proto-
col in order to implement a fully functional distributed global
CRYPTOCURRENCY MARKETS computer. Evaluating the prospective returns from investing in
Cryptocurrencies any of these coins is difficult and time-consuming, requiring
Cryptocurrencies are a new type of digital asset that rely on expertise in both cryptography and economics.
distributed cryptographic protocols, rather than physical mate-
rial and a centralized authority, to operate as currency. Bitcoin Cryptsy
(BTC) was the first cryptocurrency to gain popularity, but hun- The platform we use for our experiments, Cryptsy, was a large
dreds of alternative cryptocoins (called “altcoins”) have since cryptocurrency exchange that opened on May 20, 2013 and
been introduced. The current crop of altcoins has been directly closed in early January 2016. At the outset of our experiment,
inspired by Bitcoin, and the excitement about Bitcoin frames Cryptsy claimed over 230,000 registered users. On the last
the hopes and desires of participants in the marketplace for recorded day of Cryptsy’s trading, its daily trading volume
altcoins. In discussions by those who create, promote, and was 106,950 USD (248 BTC), which placed it as the tenth
scour such coins, a desire to not miss out again on being an largest cryptocurrency exchanges by trading volume (of 675
early investor in the “next Bitcoin” is commonplace. However, listed) at the time. By this time Cryptsy had 541 trading pairs
many altcoins represent nothing more than minor changes to (including Bitcoin, Litecoin, and fiat markets), which placed
the source code of Bitcoin. While it might be tempting to it as the third largest exchange in terms of the total size of its
dismiss all such coins as having essentially zero probability of marketplace. Cryptsy was a popular exchange because of the
success, some of them do innovate in non-technical ways. One large number of altcoins it made available for trade, which is
case is Auroracoin, which was a trivial technical modification also the reason it is uniquely appropriate for our experiment.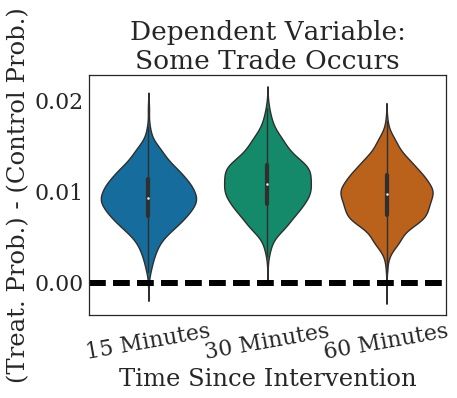
screen in alphabetical order by the coin name. For the BTC
                                                                      and LTC markets, these panels also displayed green or red
                                                                      marks when the prices of each coin had recently moved up or
                                                                      down. These marks accumulated during an idle web session.
                                                                      The single most recent BTC and LTC market price changes
                                                                      were displayed at the tops of these panels.
                                                                      In addition to showing all of the open buy and sell orders,
                                                                      Cryptsy also made prior transactions visible to users. Prior
                                                                      transactions were shown both in a list and as a chart. The list in-
                                                                      cluded the sizes, prices, and times of the last 200 transactions,
                                                                      reverse ordered by time. The chart displayed an interactive
                                                                      summary of prior transactions. Each “tick” on the chart vi-
                                                                      sualized the highest transacted price, the lowest transacted
                                                                      price, the open price, and the close price over the duration of
                                                                      a certain time interval. The total traded volume over the time
 Figure 2: Descriptive statistics of the Cryptsy marketplace.         duration of each tick was also shown. The time interval used
                                                                      for display depended on the time granularity at which the chart
                                                                      was being viewed. The chart could display the price trends
We require a popular exchange with many coins available. By           over the last 6 hours, day, week, or month, or over all time.
the end of 2015, Cryptsy had begun having well-publicized             Descriptive Statistics
issues involving users not being able to withdraw money they          Figure 2 summarizes various descriptive statistics of the
had deposited on the site. On January 14, 2016 Cryptsy halted         Cryptsy marketplace. We observe a mean daily trading volume
all trading. Our experiment—spanning April 12, 2015 until             of approximately 400 BTC per day on Cryptsy. This quantity
October 19, 2015—preceded the beginning of the final decline          places the mean daily trading volume on Cryptsy to be at least
of Cryptsy.                                                           in the tens of thousands of USD per day during our experiment.
                                                                      The mean daily trading volume remained relatively constant
Market Mechanism
                                                                      over the course of our experiment, with some periods of higher
Cryptsy implemented a continuous double auction with an
                                                                      volume. There was substantial heterogeneity in the volume
open order book as its trading mechanism. In a continuous
                                                                      of each coin. Most coins have only on the order of 10 or 100
double auction there is no centralized market maker. Current
                                                                      USD being traded in their markets per day, while a few have
asset prices are determined by the best available prices being
                                                                      tens of thousands. The average size of observed trades also
offered by any of the traders on the platform. A market for a
                                                                      varies widely across coins. Across all coins, average trade
particular cryptocurrency consists of a set of open “buy orders”
                                                                      sizes tend to be in the range of tens of cents to a few dollars.
and a set of open “sell orders”, all placed by peers on the site.
                                                                      The maximum trade size we use in our experiments of 5e-6
A buy order is a request to buy a quantity of a coin at a price
                                                                      BTC is in the bottom 8% of the distribution of observed trade
specified in the order. A sell order is a request to sell. The
                                                                      sizes, while our minimum trade size of 5e-7 is in the bottom
current price to buy, i.e., the “buy price”, is given by the lowest
                                                                      1%. Using the average BTC size of trades and the average
priced open sell order. The current “sell price” is given by the
                                                                      hourly BTC volume per coin, we can also estimate the average
highest priced open buy order. A transaction occurs when a
                                                                      number of trades per hour per coin. These estimates indicate
new buy order is placed with a price at or above the lowest
                                                                      that most coins tend have a handful of trades per hour at the
sell price, or when a new sell order is placed with a price at or
                                                                      times we execute our interventions.
below the highest buy price. The minimum denomination on
Cryptsy was 1e-8. At a typical exchange rate of approximately         EXPERIMENT
200 USD to 1 BTC during the time of our experiment, 1e-8
BTC corresponded to roughly 0.000002 USD. The minimum                 Procedure
total order size for a single trade varied across coins and over      We conducted 310,222 randomly spaced trials in the Cryptsy
time, but was typically 1e-7 BTC, and the transaction fees            exchange over the course of six months. Before our experi-
were negligible.                                                      ment, we purchased 0.002 BTC worth each of 217 different
                                                                      altcoins available on Cryptsy. We then created bots that moni-
Interfaces                                                            tored and periodically traded in each of these altcoins’ markets
Cryptsy had both a graphical user interface (GUI) and an              in parallel. Each bot waited a random amount of time, between
application programming interface (API). The GUI, pictured            one and two hours, at the beginning of the experiment before
in Figure 1, allowed users to browse through USD, BTC, and            conducting a first trade. Then, assuming there had been at
Litecoin (LTC) markets. The site allowed users to view a              least one trade in the last hour on a coin, the bot for that coin
standalone list of all the markets, which could be sorted by          recorded the current market state and randomly chose to either
volume or price (recent price, 24-hour high price, or 24-hour         buy a random small amount of the coin, sell the coin, or do
low price), and the site allowed users to view details of the         nothing (as a control condition). The trade sizes were chosen
specific coin markets. All current coin prices for each of those      uniformly at random between 5e-7 and 5e-6 BTC. Each bot
markets were displayed in panels on the left-hand side of the         then observed its coin’s market state at 15 minutes, 30 minutes,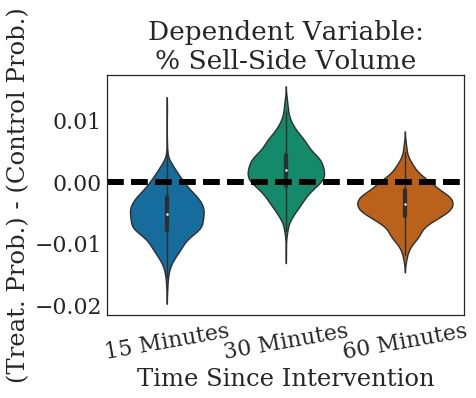
Time    Condition        Dependent Var.      n Control    n Treat   Control Mean      Mean Effect    t-stat     p-value
          15 Min.        Buy              Buy Prob.         25483      25602            0.279           0.019     4.79    2.96e-05
          15 Min.        Buy             % Buy Vol.         24321      24313            0.290           0.017     4.40    1.97e-04
          15 Min.        Buy            Trade Prob.         52050      51314            0.490           0.009     3.00    4.81e-02
          15 Min.        Sell             Sell Prob.        25483      25987            0.721          -0.006    -1.44    1.00e+00
          15 Min.        Sell            % Sell Vol.        24321      24660            0.710          -0.005    -1.31    1.00e+00
          15 Min.        Sell           Trade Prob.         52050      51727            0.490           0.013     4.12    6.71e-04
          30 Min.        Buy              Buy Prob.         23647      23871            0.278           0.003     0.83    1.00e+00
          30 Min.        Buy             % Buy Vol.         23583      23802            0.291           0.005     1.33    1.00e+00
          30 Min.        Buy            Trade Prob.         52049      51312            0.454           0.011     3.51    7.98e-03
          30 Min.        Sell             Sell Prob.        23647      23809            0.722           0.001     0.15    1.00e+00
          30 Min.        Sell            % Sell Vol.        23583      23735            0.709           0.002     0.58    1.00e+00
          30 Min.        Sell           Trade Prob.         52049      51724            0.454           0.006     1.94    9.53e-01
          60 Min.        Buy              Buy Prob.         31065      31118            0.274           0.003     0.76    1.00e+00
          60 Min.        Buy             % Buy Vol.         30984      31044            0.289           0.001     0.33    1.00e+00
          60 Min.        Buy            Trade Prob.         52030      51288            0.597           0.010     3.18    2.70e-02
          60 Min.        Sell             Sell Prob.        31065      31351            0.726           0.000     0.14    1.00e+00
          60 Min.        Sell            % Sell Vol.        30984      31275            0.711          -0.003    -1.00    1.00e+00
          60 Min.        Sell           Trade Prob.         52030      51713            0.597           0.009     3.02    4.50e-02

Table 1: t-tests for our three main dependent variables at each monitor time associated with our interventions. All statistics were
computed on our confirmatory dataset. p-values are two-sided and Bonferroni corrected for 18 tests. We have differing numbers
of observations between our probability and percentage statistics for like conditions at identical monitor events due to differences
in sensitivity to trade execution latency in how we implemented these statistics.

  Dep. Var.    Independent Var.         Coef.   t-stat      p-value        Dependent Variables
  Buy Prob.            Buy Treat.       0.016    4.47       1.4e-04
  Buy Prob.    Buy Treat.*Time 2       -0.016   -3.02     4.48e-02         We examine three dependent variables in our main analyses.
  Buy Prob.    Buy Treat.*Time 3       -0.015   -3.15     2.92e-02         In order to measure peer influence on trade direction, we use
  Buy Prob.            Sell Treat.      0.004    1.01     1.00e+00         two statistics. The first statistic is the probability that the
  Buy Prob.    Sell Treat.*Time 2      -0.004   -0.72     1.00e+00         last trade observed on a coin is a buy as opposed to a sell,
  Buy Prob.    Sell Treat.*Time 3      -0.003   -0.61     1.00e+00         conditional on there being a trade in the observation period of
 % Buy Vol.            Buy Treat.       0.014    4.14     6.39e-04         the statistic. This statistic uses the transaction type of the last
 % Buy Vol.    Buy Treat.*Time 2       -0.012   -2.46     2.53e-01
 % Buy Vol.    Buy Treat.*Time 3       -0.015   -3.30     1.75e-02         transaction that occurred in the time period associated with a
 % Buy Vol.            Sell Treat.      0.003    0.98     1.00e+00         given monitor event. The statistic aggregates binary indicator
 % Buy Vol.    Sell Treat.*Time 2      -0.005   -1.03     1.00e+00         variables that check whether the last observed transaction
 % Buy Vol.    Sell Treat.*Time 3       0.001    0.21     1.00e+00         types were buys or sells. For this statistic, we omit monitor
 Trade Prob.           Buy Treat.       0.006    2.28     4.05e-01         events where we have not observed a trade after our own initial
 Trade Prob.   Buy Treat.*Time 2        0.002    0.41     1.00e+00         trade or after the last monitor event. The second statistic is the
 Trade Prob.   Buy Treat.*Time 3        0.000    0.08     1.00e+00
 Trade Prob.           Sell Treat.      0.011    4.11       7.1e-04        proportion of trading volume on the buy-side or sell-side after
 Trade Prob.   Sell Treat.*Time 2      -0.007   -1.79     1.00e+00         our interventions. To compute this statistic, we calculate the
 Trade Prob.   Sell Treat.*Time 3      -0.004   -0.98     1.00e+00         total volume of trades of a given coin that occurred in the time
                                                                           period associated with a given monitor event, and we calculate
Table 2: Linear regressions for our three main dependent vari-             the fraction of that volume associated with buy or sell trades.
ables, including fixed effects for each coin, control variables            Once again, this statistic is undefined when there has been no
for market state, and cluster-robust standard errors. All statis-          new trading activity at a given monitor event. Our statistical
tics were computed on our confirmatory set. p-values are two-              tests compare the values of these statistics across the treatment
sided and Bonferroni corrected for 18 tests. The significant               and control trials in each monitor period. Peer influence in
negative effects at Time 2 and Time 3 indicate that the positive           buying or selling would be indicated by buy treatments leading
peer influence effect of our buy interventions diminishes over             to higher buy-side activity as measured by these statistics, or
time.                                                                      by sell treatments leading to higher sell-side activity. A third
                                                                           statistic, the probability of observing any trade at all in each
                                                                           monitor period, allows us to test for peer influence in overall
                                                                           trading activity in addition to trade direction. We compute
                                                                           each of these statistics in three mutually exclusive periods:
and 60 minutes following the trial, after which the bot waited             in the 15 minutes after our interventions, the following 15
a random amount of time between 0 and 60 minutes before                    minutes, and the following 30 minutes.
engaging in another trial and repeating. As a part of monitor-
ing the market state, each bot recorded the details of the most            RESULTS
recent trade in the market, as well as the total buy-side and
sell-side volume since the bot’s intervention. We conducted a              Statistical Analysis
power analysis based on a pilot study to determine the length              For a basic analysis, we use t-tests to compare the average
of time to run our experiment.                                             values of our dependent variables in our buy and sell trials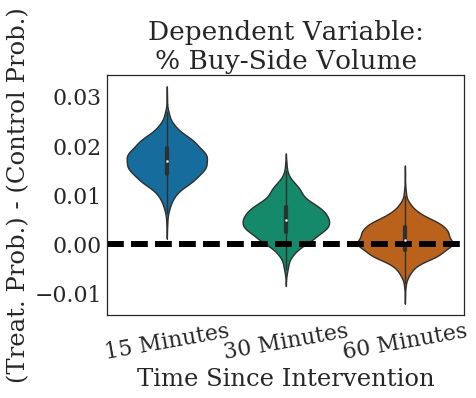
(a) Buy-side Interventions    (b) Sell-side Interventions
                     (a) Buy-side Interventions
                                                                     Figure 4: Bootstrap test statistic distributions for our final
                                                                     dependent variable as a function of time after our interventions.

                                                                     errors [84], which adjust the model standard errors to account
                                                                     for heteroskedasticity and correlation in error terms within
                                                                     each altcoin’s observations. The results of these regression
                                                                     are given in Table 2. These results confirm the results of our
                                                                     t-tests. The effect of our buy treatments on buy trade proba-
                     (b) Sell-side Interventions                     bility and buy-side volume percentage remain significant at
                                                                     the 15-minute monitor event (p < 0.001). The effect of our
Figure 3: Bootstrap test statistic distributions for two depen-      buy interventions on the probability of observing a trade at
dent variables as a function of time after our interventions.        all is marginally significant, being significant at the 0.05 level
                                                                     before we correct for multiple comparison but not afterwards.
                                                                     The effect of our sell interventions on the probability of ob-
to the average values in our control trials. The results of          serving a trade at all remains significant (p < 0.001). In the
these tests are given in Table 1 and visualized in Figures 3         appendix we examine the randomization validity of our exper-
and 4. We find significant effects of our buy interventions          iment, the extent of selection bias we might have suffered, and
on buy probability and percent buy-side volume at the 15-            heterogeneity in the effects of our interventions across coins.
minute monitor event (p < 0.001), and significant effects of
buy and sell interventions on overall trading activity at all
monitor events (p < 0.05) except the 30-minute monitor for           Peer Influence
sell interventions.                                                  Our results indicate strong evidence for peer influence on our
                                                                     buy interventions in these markets. The probability the last
In addition to these t-tests, we perform a more robust analy-        observed trade is a buy 15 minutes after a buy intervention
sis that combines the analysis of our buy and sell treatments        is 30%—an increase of 2% above the control probability of
across monitor times, while also controlling for potential de-       28%. The average percentage buy-side BTC volume is 2%
pendence between observations on identical coins and poten-          higher than the 29% we observe in control trials during these
tial dependence due to correlations in time. We perform linear       15 minute windows. Our interventions also led to overall in-
fixed-effects regressions that include intercepts for each coin,
                                                                     creases in trading activity. The probability of observing a trade
and include regressor variables summarizing the market state
                                                                     at all within 15 minutes after our interventions increased from
to control for temporal dependence in the form of spillover
                                                                     49% to approximately 50% after buy or sell interventions.
effects. The variables we use to control for a coin’s market
state are: six indicator variables for whether the best buy or       The aggregate effects of slightly higher percentages of buy-
sell order in the coin’s order book are above, below, or at the      side activity and slightly higher overall levels of trading, in
coin’s last transaction price—these variables indicate how a         combination with a fat-tailed distribution of trading volume,
new trade would affect the price trend of that coin; an indicator    accumulate into a large 7% average increase in total buy-side
variable for whether the last trade before our intervention was      BTC volume after our buy interventions as compared to con-
a buy or a sell; a continuous variable giving the percentage         trol trials (MWU-test p = 0.0011; we use an MWU-test since
of buy-side versus sell-side volume in the hour before the           the distributions are fat-tailed, MAE/MSE = 0.273 as com-
intervention; and a continuous variable giving the logarithm         pared to 0.799 of the normal distribution). In total, we observe
of the coin market volume in the hour before our intervention        approximately 16,000 USD additional buy-side trading in our
divided by the average hourly volume on that coin. These             buy intervention trials as compared to the control trials. Even
regressions also include two indicator variables for whether an      though we conducted slightly fewer buy interventions than
observation is associated with a buy trial or a sell trial (versus   there were control trials, the sum of all buy-side volume im-
a control trial, which is absorbed into the intercept terms), and    mediately following our buy interventions was 1513 BTC, as
the regressions include interaction terms between these trial        compared to 1430 BTC after the control trials (and 1399 after
indicators and indicator variables for each observation’s asso-      sell trials). This difference of 83 BTC is large compared to
ciated monitor number. We use cluster-robust White standard          the total size of all of our interventions, which was approxi-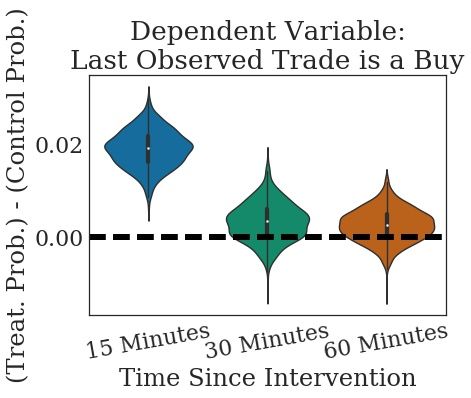
potential effects of exchange design choices would differ. In
                                                                   order to check if our results are due mainly to human activity,
                                                                   we conduct a regression analysis including an independent
                                                                   variable that indicates whether each intervention was executed
                                                                   during the hours of the NY Stock Exchange (9am to 4pm
                                                                   Eastern, Monday-Friday) and an interaction term between this
                                                                   variable and the experimental condition. Here we compare
                                                                   buy versus sell interventions directly, rather than each to the
     Figure 5: Plots of average hourly and daily volume.           control condition, to maximize our statistical power. We do
                                                                   observe cyclical trends overall in average volume during U.S.
                                                                   work hours, as shown in Figure 5, which indicates that the
mately 0.14 BTC. The total effects of our buy interventions        markets likely have substantial human trading. However, our
were approximately 500 times larger than their cost.               analysis is inconclusive since we detect no significant interac-
                                                                   tion in our regression. In exploratory analysis, we obtained
Asymmetric Null Effect                                             similarly inconclusive results using a variety of independent
We do not observe a symmetric peer influence effect from           variables, including holidays, weekdays, and hour of the day.
sell interventions. Sell interventions had no detectable effect    We therefore take our null result in this analysis to be weak
on the proportion of future sell-side trading. There are mul-      evidence that bots are contributing meaningfully to our results.
tiple potential causes of this asymmetry. Since we executed
roughly the same number of buy and sell interventions, and         DISCUSSION
since the dependent variables in each case have the same vari-     Mechanisms
ance, the asymmetry cannot be due to a difference in statistical   We now discuss potential mechanisms underlying the results of
power. Therefore the difference must be due to differences         our experiment. We have limited ability to distinguish between
in how the market behaves following buy versus sell events.        potential causes due to the scope our data and experiment. In
Notably, asymmetric peer influence effects of this sort have       lieu of being able to provide evidence to favor one hypothesis
been observed in online social recommendation systems in           over another, we attempt to enumerate possible explanations.
which upvotes lead to peer influence but not downvotes [62].
However, other contextual factors could be causing the differ-     Potential Ultimate Causes
ence in our case. One possibility could be the fact that sell      In the analysis of our experiment we attempted to identify to
actions do not decrease prices in these markets as frequently      what extent our results might have been attributable to bot
as buy actions raise prices (sell actions only decrease prices     trading. We have a limited ability to do so since we cannot
38% of the time, compared to the 78% of buy actions), and          observe the identities of traders or which trades are executed
hence sell treatments may not lead to the same momentum            via the GUI versus via the API, and we know of no major
effects. Another potential factor is that conducting a sell-side   changes to the trading page interface during our experiment
trade requires having holdings in the asset since short-selling    that could afford quasi-experimental analysis. In any case, our
was not implemented on Cryptsy. Therefore the sell effects         results are ultimately due to human behavior, whether:
could be weaker due to a smaller population of peers with the
capability to sell.                                                • Direct human decision-making in GUI trading.
                                                                   • Human planning, as manifest in what bots are programmed.
Temporal Trends
The peer influence effects we observe after buy interventions      These two possibilities each implicate different mediating
do not lead to detectable permanent shifts in market dynam-        mechanisms and moderating contextual factors.
ics. By 30 minutes after our interventions there is no longer
                                                                   Potential Behavioral Mechanisms
a detectable peer influence effect on trade direction. This di-
                                                                   There are a few plausible simple behavioral mechanisms that
minishing effect over time could be due to the fact that natural
                                                                   could underlie our results:
variation in subsequent trading after our interventions consists
of a mix of buying and selling, which is variance that could       • Explicitly copying buy trades.
dampen the effects of our buy trades. The overall excitation
effects we observe are persistent over time. The probability       • Buying on an increasing price trend, i.e. momentum.
of observing a trade between a half hour and an hour after
either a buy or a sell intervention remains over 1% higher than    • Buying salient coins, such as coins with recent activity.
the baseline probability in the control condition, which in this   Since trade history is openly available on Cryptsy, a simple
time period is 60%.                                                explanation is that some fraction of traders decide to buy if
                                                                   there has recently been a buy from another trader. Another pos-
Market Composition                                                 sibility is that traders are paying attention to price increases,
The interpretation of our results depends strongly on what sorts   rather than explicitly copying buy actions. Buy actions raised
of participants compose the Cryptsy marketplace. If there are      the last transacted price 78% of the time during our exper-
many active bots, or if our interventions disproportionately       iment. Another possibility is that people buy salient coins.
affect bots, then the implications of our experiment for the       The frequent price increases from buy actions were reflected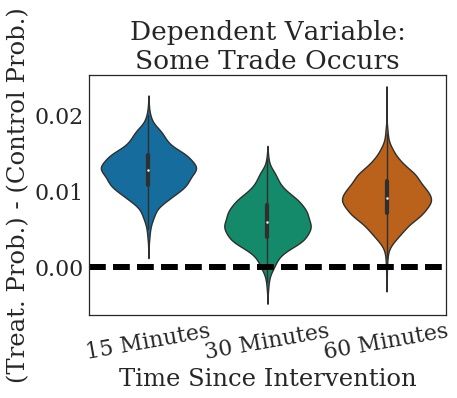
GUI                              API
                                                           Bitfinex   Bitstamp   Cryptsy    Bitfinex   Bitstamp   Cryptsy
              Ticker chart
              Prominent ticker chart
              Interactive ticker chart
              Order book visualization
              Customizable chart colors
              Audio representations of activity
              Quick buy/sell buttons
              Page with coin statistics compared
              Active markets/price changes highlighted
              Moderated forums
              Coin information pages
              Your trades and orders
              Recent trades displayed
              Live updating
              Basic market summary statistics displayed
              Summaries of all markets displayed on page
              Market indicators available
              Communication channel
              Trader identities available
              “Recommended coins”
              Published rate limits

Table 3: Comparison of the graphical user interfaces (GUIs) and application programming interfaces (APIs) of three cryptocurrency
exchanges. Blue indicates the feature is present. Orange indicates the feature is absent. White indicates the feature is not applicable.

                               Bitfinex   Bitstamp    Cryptsy          of our results are the highly speculative nature of cryptocur-
   Coins                          25          5        217
   Continuous double auction                                           rencies, peculiarities of the composition of traders on Cryptsy,
   Open order book                                                     or the size of the Cryptsy marketplace. We expect that specu-
   Open trade history                                                  lation, amateur trading, and a relatively small marketplace in
   Spot trading                                                        which our interventions are more visible might have promoted
   Margin trading                                                      peer influence in our study.
   Short-selling
   Market-making
                                                                       Cryptocurrency Exchange Comparison
Table 4: Comparison of cryptocurrency exchange market                  The website CryptoCoinCharts currently lists 125 online ex-
mechanisms. The color code is the same as in Table 3.                  changes where bitcoins and various altcoins can be traded. In
                                                                       this section we discuss common features of these exchanges as
                                                                       well as other features that could plausibly be implemented in
in the charts that display summaries of the prices of each
                                                                       order to explore a design space of cryptocurrency exchanges
coin. Peer influence from buy actions may therefore be due
                                                                       and to provide context for our experiment. This analysis illus-
to buying these salient coins. The first two mechanisms could
                                                                       trates that the structure of Cryptsy is relatively representative
easily be implemented either by people directly or through
                                                                       of the structure of currently popular cryptocurrency exchanges,
bots. The last could be implemented by bots, but would more
                                                                       and provides a point of reference for a discussion of plausible
plausibly be implemented by people since the API does not
                                                                       interface effects in our experiment.
highlight price changes. More sophisticated mechanisms are
also a possibility if traders conduct more complex calculations        We compare Cryptsy to the two highest-volume cryptocurrecy
that result in individual buy trades having an overall marginal        exchanges at the time of writing: Bitfinex and Bitstamp. Ta-
positive peer influence effect.                                        bles 3 and 4 summarize key features of these exchanges. The
                                                                       three exchanges are similar in many ways, but also have some
Potential Moderating Contextual Factors                                important differences. Common to all the exchanges is the
There are also several plausible contextual factors that might         use of a continuous double auction market mechanism, open
moderate the effects we observe:                                       order books and trading history, spot trading functionality,
• Interface and market features                                        and a prominent ticker chart visualizing recent price changes.
                                                                       One notable difference in market mechanisms is that Bitfinex
• Uncertainty of cryptocurrencies                                      implements margin trading, which allows for leveraged trades
                                                                       and short-selling. Notable differences in the interfaces are that
• Aspects of the community disposition                                 Cryptsy did not include charts for market indicators; Bitfinex
• Size of Cryptsy                                                      and Bitstamp do not highlight outside market activity on an
                                                                       individual coin’s trading page; and Bitstamp does not have
We discuss interface and market features in more detail below.         a communication channel for traders—Cryptsy had its own
Other contextual factors that might affect the generalizability        chat room, while Bitfinex links directly to a separate site,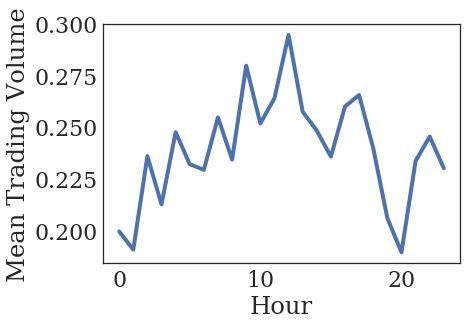
TradingView, from its platform. None of the exchanges im-         sites to stimulate trading, including via peer influence. At the
plemented market makers, and none of the exchanges imple-         same time, there are multiple factors that go into creating a sta-
mented common features of other types of online platforms,        ble marketplace [53]. Maintaining an awareness of incentives
such as moderated forums, information pages, deanonyimized        and a focus on design goals could help to balance the positive
user activity, or recommendations.                                and negative systemic effects of design choices.

Interface Effects                                                 RELATED WORK
Given the design space we outlined in our comparison of           There are several bodies of work within computational social
cryptocurrency exchanges, we can hypothesize about which          science, economics and finance, and human-computer interac-
interface and market features might enable or promote peer        tion related to the present study. We briefly review work on
influence. The design choices of the GUI clearly could impact     online field experiments in peer influence, peer influence in
human trading, and the affordances of the API clearly impact      financial markets, online collective behavior, and the design
what bots can do. GUI design choices also could influence         of digital institutions.
what types of bots people decide to implement. Every feature
we observe in the Cryptsy interfaces plausibly has either a       Online Field Experiments in Peer Influence
neutral or positive effect on peer influence, and many of these   A growing area across communities studying computational
features are shared by other exchanges. For both human and        social science is digital and online experimentation [5, 69].
bot traders, the features of the market mechanism and the         Our work was directly inspired by earlier online experiments
ready availability of recent trading activity, common to all      studying peer influence in a variety of different types of on-
the exchanges we compared, is what enables peer influence         line social systems [37, 70, 13, 62, 80]. These experiments
in the first place. For human traders, the prominent display      have provided compelling evidence for the ubiquity of peer
of trends in price history in the ticker chart, again a feature   influence across an array of domains, and in some cases the
common to all exchanges we compare, plausibly encourages          importance of these effects on collective outcomes. Ours is the
peer influence. More uniquely, Cryptsy’s side-panel display       first study to apply the large-scale online field experimentation
of upward and downward price movements could have led to          techniques innovated in these early works to online financial
a saliency bias [42]. The chat functionality on Cryptsy also      markets.
likely promotes peer influence, although of a different sort
than the type we studied. An important area of future work is     Peer Influence in Financial Markets
to more rigorously explore the causal impact of these design      There have been a number of observational studies, laboratory
features through laboratory experiments, field experiments, or    experiments, and small-scale field experiments in finance and
quasi-experimental observational analysis.                        economics studying peer influence in financial markets. For
                                                                  instance, the widely recognized empirical phenomenon of mo-
Generalizability                                                  mentum in price dynamics is related to our work. A number of
With the considerations of potential causes in mind, we ex-       researchers have identified evidence for momentum through
pect our results to likely generalize at a minimum to other       observational analysis of real financial markets [75, 57, 59]
cryptocurrency exchanges, and possibly also at least to other     and through the implementation of momentum-based trading
online trading platforms (ZuluTrade, eToro, etc.) and other       strategies [46, 68, 47]. In another line of work, models of
small markets (e.g., penny stocks or pink sheets stocks). The     “herding” formalize the behavior of traders copying decisions
fact that Cryptsy highlighted price change direction in the       to invest [7, 11, 4, 19]. These models have been tested directly
side-panel of its GUI is relatively unique, but other exchanges   in stylized laboratory experiments [2, 22, 21, 25]. Herding has
have their own unique features that could also promote peer       been argued to occur in real markets through observational
influence, such as the audible beeps that occur with all trades   analyses of coarse-grained market data and individual institu-
on Bitstamp. Generalization to larger and more professional       tional investor data [12, 78], but some analyses with market
financial markets is an important topic. Similar effects may be   data have yielded negative results [78]. The empirical work
observable in higher-volume markets, but perhaps may require      in finance and economics most relevant to our own comes
larger or more sustained interventions to be detectable. Ob-      from the literature on attempting to manipulate asset prices
taining a more rigorous understanding of the interface effects    in laboratory asset markets [36, 81, 82, 16] and certain types
in these larger markets would be especially interesting.          of real markets [17, 67]. The general form of these existing
                                                                  studies has been to execute large trades in the markets be-
Design Implications                                               ing studied and observe the effects on market prices over a
In our discussion we have directed attention towards interface    short time period. We focus on the effects of small individual
features in particular as potential moderating contextual fac-    trades rather than attempts at market manipulation through
tors. We highlight the point that many of Cryptsy’s design        abnormally large actions.
choices could have plausibly promoted peer influence, and
that Cryptsy could have potentially made alternative choices      Cryptocurrency Market Dynamics
that might inhibit it. There is an interesting moral hazard       A growing body of work studies the dynamics of cryptocur-
implicated in these considerations. Cryptsy and other cryp-       rency markets specifically. Observational data analyses, with
tocurrency exchanges make more money when more people             sometimes conflicting results, have been used to examine com-
use the platform, so they are incentivized to optimize their      petition between cryptocurrencies for market volume [28]; to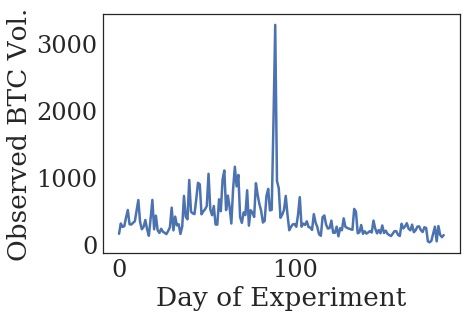
compute the fundamental value of cryptocurrencies [40]; to in-        the design of digital institutions. Markets are an example of
vestigate the efficiency of bitcoin markets [79, 63]; to confirm      an enormously important institution that is becoming increas-
the presence of speculative behavior in bitcoin markets [58,          ingly digitized, and market irrationality may be a problem in
20]; to provide evidence for non-fundamentals-driven trading          markets that design-thinking could help address. Our specific
behavior in altcoin markets [26]; and to document how factors         application to cryptocurrencies is timely and urgent as new
such as fundamental value [52, 14] or online search and dis-          platforms are growing and potentially encouraging users to
cussion activity [51, 30] are related to cryptocurrency prices.       adopt risky trading strategies.
A recent study closely related in spirit to our own provided
observational evidence of market manipulation in USD-BTC              Our work provides an example of how peers in an online sys-
markets [29].                                                         tem can audit the system dynamics through experimentation
                                                                      with typical behavior. Bots that randomly execute actions of
Studying Online Collective Behavior                                   normal users could provide a way to understand peer influence
Our work also builds on a growing area within the human-              and other phenomena in a variety of online systems. These
computer interaction (HCI) and computer-supported coopera-            bots allow us to understand the causal impact of individual
tive work (CSCW) communities involving the study of human             actions that can be taken by users in these systems. In studying
collective behavior in online platforms. Some of this work has        the dynamics of cryptocurrency markets with this technique,
focused on financial markets [31, 85]. Peer influence is related      we show that even trades worth just fractions of a penny can
to the study of popularity dynamics in follower behavior (e.g.,       influence the nature of other much larger trades in the cryp-
[43]) and online voting behavior (e.g., [56, 76, 55]). Others         tocurrency markets we study. We observe an approximately
have studied how design can help ameliorate the effects of            two percentage point increase in buying activity after our buy
peer influence in online social recommendation systems (e.g.,         interventions, and a cumulative monetary effect of 500 times
[50, 1]). Our work also employs the experimental technique            the size of our interventions. While an increase of two per-
of using bots in online field experiments that has recently been      centage points might seem small for an individual action, in
developed in these communities [72, 49].                              a large marketplace this amount is non-trivial. For example,
                                                                      at the time of writing Apple stock on the NASDAQ exchange
Design of Digital Institutions                                        had an average daily trading volume of 30 million USD, 2%
A final related area of work is the design of digital institutions.   of which would amount to hundreds of thousands of dollars
Many traditional institutions are shifting to having digital          over the course of a day on that stock alone. Designers of
components, and as this shift occurs, the study of institutions       online markets should be aware of how minor changes in their
becomes more relevant to researchers in human-computer                systems that affect individual and collective behavior could
interaction and computer-supported cooperative work. Re-              have major social and economic impact.
searchers have studied a variety of different types of institu-
tions, for example: payment systems [86]; economics [6] and           APPENDIX
marriage [27] in online worlds; organizational behavior [33];         Supplementary Analysis
activism [72]; knowledge markets [74]; labor markets [73, 3,          Randomization Validity
48, 32], large-scale collaboration [10, 61]; money (including         We assess the validity of our randomization procedure to check
cryptocurrencies) [18, 71]; personal finance [35, 34]; supply         that our treatment groups and control groups are not system-
chains [66]; entrepreneurship [45]; hospitality [54]; and envi-       atically different. We observe no detectable systematic differ-
ronmental sustainability [24]. Broadly, these works bring a           ences between treatment and control groups on the dependent
design lens to bear on patterns of repeated digitally mediated        variables we measure before our interventions, but we do see
large-scale social interaction, and particularly a lens for how       significantly fewer treatment observations than expected by
the structure of technological artifacts affects our interaction      chance (binomial test, n = 2 · (52056), p < 1e − 5). We at-
patterns. Others in the community have considered ethical [44,        tribute this difference to a failure to treat, likely caused by a
83, 15, 23, 38] and conceptual [60, 39] frameworks applicable         bug in Cryptsy that occasionally prevented us from executing
to this type of design. Specific interest in HCI-oriented finan-      trades. However, we find that our results are robust to simulat-
cial market design has existed since the early days of online         ing these failures to treat in the control condition. Plots of the
markets. An early study investigated how market interfaces            numbers of control and treatment observations reveal that no
can impact market liquidity compared to physical “trading             single coin is much more unbalanced than others in terms of
pits” [65]. Recent work has emphasized a view of markets              the number of control versus treatment observations on that
as technologically-mediated human systems, and therefore a            coin.
potentially fruitful target of HCI design and critique [53].
                                                                      Selection Bias
CONCLUSION                                                            There are several potential sources of bias in our experimental
Institutional design is a major area of study in the social sci-      design that could have influenced our estimated effect sizes.
ences. The HCI community has an opportunity to contribute             We only conducted interventions when the trade history and
to this conversation as many farflung institutions—from banks         order book were accessible via the Cryptsy API, when we had
to marriage in Second Life—migrate to digital spaces. The             sufficient funds to buy and sell at least 5e-6 of the coins they
methodologies for studying digital systems; the awareness of          were monitoring, and when at least one trade on the coin had
interface effects; and the keen eyes for bias, ethics, and inclu-     occurred in the last hour. The fact that we condition on having
sion in the HCI community could add unique perspectives to            access to the Cryptsy API, having enough coins to trade, and
having observed a trade at least an hour before our interven- possible. Our experiment was approved by the human subjects
tions means that we are always conditioning on a particular, review boards of MIT and ANU (MIT Protocol #1409006623,
albeit likely fairly common, market context in our experiments. ANU Protocol: 2015/652). Because our experiments were
Another source of bias in two of our dependent variables is conducted in the field and consisted of no more than regular
missing trials due to having no trades observed in our monitor trading activity in the markets we used, our study posed
windows. Both the probability that the last observed trade is minimal risk to our participants and therefore was granted a
a buy and the percentage of buy-side volume are undefined waiver of informed consent.
when no trades are observed. We achieved only approximately
50% overall probability of observing any trades within 15 min- ACKNOWLEDGMENTS
utes after our interventions, and this probability varies widely This material is based upon work supported by the NSF Grad-
across coins. The combined effects of these two sources of uate Research Fellowship under Grant No. 1122374, the MIT
selection bias can be observed by looking at the number of Media Lab Members Consortium, the Australian National
observations we have per coin. Since higher volume coins University, Harper Reed, and Erik Garrison. Any opinion,
are likely to meet both our condition for intervention and our findings, and conclusions or recommendations expressed in
condition for measurement, any bias on the marginal effects this material are those of the authors(s) and do not neces-
we examine will be towards the effect on higher volume coins, sarily reflect the views of our sponsors. Statistical support
which are of more general interest anyway. Regardless, the was provided by data science specialists Simo Goshev and
fixed effects regressions we performed helps to control for the Steven Worthington at the Institute for Quantitative Social
selection bias due to coin-level effects. Since our treatments af- Science, Harvard University. Special thanks to Iyad Rahwan
fect the observability of our outcome variables, we might also for suggesting the moral implications of our results, and to the
be concerned that observability alone is driving our effects. participants of the Second EC Workshop on Crowdsourcing
However, we see that there is a significant difference in effect and Behavioral Experiments for their feedback on an early
between buy and sell treatments, which do not differ strongly version of this work.
in terms of observability. In this analysis, the treatment type
does not significantly interact with pre-treatment market state REFERENCES
variables when predicting observability and controlling for 1. Andrés Abeliuk, Gerardo Berbeglia, Pascal
multiple comparison in a linear regression. Van Hentenryck, Tad Hogg, and Kristina Lerman. 2017.
Taming the Unpredictability of Cultural Markets with
Heterogeneous Effects
Social Influence. In Proceedings of the 26th International
We observe substantial variation across coins in our dependent Conference on World Wide Web (WWW). International
variables and in the effect sizes of our interventions. However, World Wide Web Conferences Steering Committee,
we did not identify any descriptive statistics of the coins that 745–754.
were reliably predictive of effect size (with effect size mea-
sured by the difference between the treatment mean and the 2. Lisa R Anderson and Charles A Holt. 1997. Information
control mean). A multivariate linear regression including me- Cascades in the Laboratory. The American Economic
dian values of coin attributes (price, volume, spread, and best Review (1997), 847–862.
open sell/buy order size) yielded no significant relationships
3. Judd Antin and Aaron D. Shaw. 2012. Social Desirability
with effect size and low R-squared values of approximately
Bias and Self-reports of Motivation: A Study of Amazon
0.01. Since much of the variability occurs on coins with fewer
Mechanical Turk in the US and India. In Proceedings of
observations, the major variations across coins are therefore
the ACM Conference on Human Factors in Computing
likely largely due to noise. We needed a large sample size in
Systems (CHI).
order to be able to detect aggregate peer influence effects in
these markets at all. We appear to have too small of a sam- 4. Christopher Avery and Peter Zemsky. 1998.
ple size per individual altcoin, and too few coins, to examine Multidimensional Uncertainty and Herd Behavior in
heterogeneous treatment effects. Financial Markets. American Economic Review (1998),
724–748.
Code, Data, Preregistration, and Institutional Review
5. Eytan Bakshy, Dean Eckles, and Michael S Bernstein.
Our code and data, including a list of cryptocurrencies
2014. Designing and Deploying Online Field
we traded, is available online: https://github.com/pkrafft/
Experiments. In Proceedings of the 23rd International
An-Experimental-Study-of-Cryptocurrency-Market-Dynamics.
Conference on World Wide Web (WWW). ACM, 283–292.
Code for our experiment specifying the details of our experi-
mental design was preregistered.1 Our final statistical analysis 6. Eytan Bakshy, Matthew P. Simmons, David A. Huffaker,
differed from our preregistered one. Before conducting Chun-Yuen Cheng, and Lada A. Adamic. 2010. The
non-preregistered data analysis, we split our entire dataset of Social Dynamics of Economic Activity in a Virtual
trials uniformly at random into two halves, one for exploratory World. In International Conference on Weblogs and
statistical analysis and one for confirmatory statistical analysis. Social Media (ICWSM).
The results we show are from our confirmatory validation set.
This confirmatory set was held-out from analysis as much 7. Abhijit V Banerjee. 1992. A Simple Model of Herd
Behavior. The Quarterly Journal of Economics (1992),
1 https://osf.io/djezp/ 797–817.8. Brad M Barber and Terrance Odean. 2008. All that 22. Marco Cipriani and Antonio Guarino. 2009. Herd
Glitters: The Effect of Attention and News on the Buying Behavior in Financial Markets: An Experiment with
Behavior of Individual and Institutional Investors. Review Financial Market Professionals. Journal of the European
of Financial Studies 21, 2 (2008), 785–818. Economic Association 7, 1 (2009), 206–233.
9. Nicholas Barberis and Richard Thaler. 2003. A Survey of 23. Nicola Dell and Neha Kumar. 2016. The Ins and Outs of
Behavioral Finance. Handbook of the Economics of HCI for Development. In Proceedings of the ACM
Finance 1 (2003), 1053–1128. Conference on Human Factors in Computing Systems
(CHI).
10. Yochai Benkler. 2012. The Penguin and the Leviathan:
Towards Cooperative Human Systems Design. In The 24. Paul Dourish. 2010. HCI and Environmental
ACM Conference on Computer-Supported Cooperative Sustainability: The Politics of Design and the Design of
Work and Social Computing (CSCW). Politics. In Proceedings of the 8th ACM Conference on
Designing Interactive Systems.
11. Sushil Bikhchandani, David Hirshleifer, and Ivo Welch.
1992. A Theory of Fads, Fashion, Custom, and Cultural 25. Mathias Drehmann, Jorg Oechssler, and Andreas Roider.
Change as Informational Cascades. Journal of Political 2005. Herding and Contrarian Behavior in Financial
Economy 100, 5 (1992), 992–1026. Markets: An Internet Experiment. American Economic
Review (2005).
12. Sushil Bikhchandani and Sunil Sharma. 2000. Herd
Behavior in Financial Markets. IMF Staff Papers (2000), 26. Abeer ElBahrawy, Laura Alessandretti, Anne Kandler,
279–310. Romualdo Pastor-Satorras, and Andrea Baronchelli. 2017.
Evolutionary dynamics of the cryptocurrency market.
13. Robert M Bond, Christopher J Fariss, Jason J Jones,
Royal Society Open Science 4, 11 (2017), 170623.
Adam DI Kramer, Cameron Marlow, Jaime E Settle, and
James H Fowler. 2012. A 61-Million-person Experiment 27. Guo Freeman, Jeffrey Bardzell, Shaowen Bardzell, and
in Social Influence and Political Mobilization. Nature Susan C. Herring. 2015. Simulating Marriage: Gender
489, 7415 (2012), 295–298. Roles and Emerging Intimacy in an Online Game. In The
ACM Conference on Computer-Supported Cooperative
14. Jamal Bouoiyour, Refk Selmi, Aviral Kumar Tiwari,
Work and Social Computing (CSCW).
Olaolu Richard Olayeni, and others. 2016. What Drives
Bitcoin Price? Economics Bulletin 36, 2 (2016), 843–850. 28. Neil Gandal and Hanna Halaburda. 2014. Competition in
the Cryptocurrency Market. Bank of Canada Working
15. Barry A. T. Brown, Alexandra Weilenmann, Donald
Paper 2014-33 (2014).
McMillan, and Airi Lampinen. 2016. Five Provocations
for Ethical HCI Research. In Proceedings of the ACM 29. Neil Gandal, JT Hamrick, Tyler Moore, and Tali
Conference on Human Factors in Computing Systems Oberman. 2017. Price Manipulation in the Bitcoin
(CHI). Ecosystem. Journal of Monetary Economics (2017).
16. Patrick Buckley and Fergal O’Brien. 2015. The Effect of 30. David Garcia and Frank Schweitzer. 2015. Social Signals
Malicious Manipulations on Prediction Market Accuracy. and Algorithmic Trading of Bitcoin. Royal Society Open
Information Systems Frontiers (2015), 1–13. Science 2, 9 (2015), 150288.
17. Colin F Camerer. 1998. Can Asset Markets be 31. Eric Gilbert and Karrie Karahalios. 2010. Widespread
Manipulated? A Field Experiment with Racetrack Worry and the Stock Market. In International Conference
Betting. Journal of Political Economy 106, 3 (1998), on Weblogs and Social Media (ICWSM). 59–65.
457–482.
32. Mareike Glöss, Moira McGregor, and Barry A. T. Brown.
18. John M. Carroll and Victoria Bellotti. 2015. Creating 2016. Designing for Labour: Uber and the On-Demand
Value Together: The Emerging Design Space of Mobile Workforce. In Proceedings of the ACM
Peer-to-Peer Currency and Exchange. In The ACM Conference on Human Factors in Computing Systems
Conference on Computer-Supported Cooperative Work (CHI).
and Social Computing (CSCW).
33. Jonathan Grudin. 1988. Why CSCW Applications Fail:
19. Christophe Chamley. 2004. Rational Herds: Economic Problems in the Design and Evaluation of Organization
Models of Social Learning. Cambridge University Press. of Organizational Interfaces. In The ACM Conference on
20. Eng-Tuck Cheah and John Fry. 2015. Speculative Computer-Supported Cooperative Work and Social
Bubbles in Bitcoin Markets? An Empirical Investigation Computing (CSCW).
into the Fundamental Value of Bitcoin. Economics 34. Junius Gunaratne, Jeremy Burke, and Oded Nov. 2017.
Letters 130 (2015), 32–36. Empowering Investors with Social Annotation When
21. Marco Cipriani and Antonio Guarino. 2005. Herd Saving for Retirement.. In Proceedings of the ACM
Behavior in a Laboratory Financial Market. American Conference on Computer-Supported Cooperative Work
Economic Review (2005), 1427–1443. (CSCW).You can also read