The European wood pellet markets: current status and prospects for 2020 - Lippel
←
→
Page content transcription
If your browser does not render page correctly, please read the page content below
Modeling and Analysis

  The European wood pellet
  markets: current status
  and prospects for 2020
  Richard Sikkema, Utrecht University, Science, Technology and Society, the Netherlands
  Monika Steiner, Holzforschung, Pellet Standardization, Austria
  Martin Junginger, Utrecht University, Science, Technology and Society, the Netherlands
  Wolfgang Hiegl, WIP Renewables Energies, Munich, Germany
  Morten Tony Hansen, FORCE Technology, Biomass and Waste, Denmark
  Andre Faaij, Utrecht University, Science, Technology and Society, the Netherlands

  Received November 2, 2010; revised December 6, 2010; accepted December 9, 2010
  View online at Wiley Online Library (wileyonlinelibrary.com); DOI: 10.1002/bbb.277;
  Biofuels, Bioprod. Bioref. (2011)

  Abstract: The wood pellet market is booming in Europe. The EU 2020 policy targets for renewable energy sources
  and greenhouse gas (GHG) emissions reduction are among the main drivers. The aim of this analysis is to map cur-
  rent European national wood pellet demand and supplies, to provide a comprehensive overview of major market
  types and prices, and to discuss the future outlook in light of raw material supply. Approximately 650 pellet plants
  produced more than 10 million tonnes of pellets in 2009 in Europe. Total European consumption was about 9.8 mil-
  lion tonnes, of which some 9.2 million tonnes is within the EU-27, representing a modest 0.2% of Gross Energy
  Consumption (75 EJ level in 2008). The prices of most pellet types are increasing. While most markets of non-indus-
  trial pellets are largely self-sufficient, industrial pellet markets depend on the import of wood pellets from outside the
  EU-27. Industrial pellet markets are relatively mature, compared to non-industrial ones, because of their advanced
  storage facilities and long-term price-setting. However, industrial pellet markets are unstable, depending mainly on
  the establishment or the abolishment of public support schemes.
    Following our scenarios, additional 2020 demand for woody biomass varies from 105 million tonnes, based on mar-
  ket forecasts for pellets in the energy sector and a reference growth of the forest sector, to 305 million tonnes, based
  on maximum demand in energy and transport sectors and a rapid growth of the forest sector. Additional supply of
  woody biomass may vary from 45 million tonnes from increased harvest levels to 400 million tonnes after the recovery
  of slash via altered forest management, the recovery of waste wood via recycling, and the establishment of woody
  energy plantations in the future. Any short-term shortages within the EU-27 may be bridged via imports from nearby
  regions such as north west Russia or overseas. © 2011 Society of Chemical Industry and John Wiley & Sons, Ltd

  Supporting information may be found in the online version of this article.
  Keywords: EU-27; Renewable Energy Directive; wood pellet; international trade; NREAP 2020; forest sector

Correspondence to: Richard Sikkema, Utrecht University, Science, Technology and Society, Budapestlaan 6; NL-3584 CD Utrecht, the Netherlands.

E-mail: r.sikkema@uu.nl

© 2011 Society of Chemical Industry and John Wiley & Sons, Ltd
R Sikkema et al.                                                                                                     Modeling and Analysis: Wood pellet markets

   Introduction                                                                        pellets (replacing fossil fuels) also leads to the reduction of
                                                                                       greenhouse gas (GHG) emissions and therefore contributes
          oday, wood pellets are one of the largest internation-

   T      ally traded solid biomass commodities used specifi-
          cally for energy purposes. In terms of traded volume –
   about 4 million tonnes – they can be compared to biodiesel
                                                                                       to another objective of the EU Directive: 20% of reduction
                                                                                       in GHG emissions. Sikkema et al.7 showed that the use of
                                                                                       pellets in the Netherlands, Sweden, and Italy, respectively
                                                                                       can result in significant avoided GHG emissions. An esti-
   or bioethanol.1 While the handling of wood pellets requires
                                                                                       mated 12.6 million tonnes of CO2 eq emissions were avoided
   care, the advantages over other types of solid biomass such
                                                                                       in 2008 in EU-27 countries plus Norway and Switzerland,
   as wood chips or agricultural residues are their storability
                                                                                       based on a consumption of 8.2 million tonnes of wood pel-
   and relative easy handling. Wood pellets also have a low
                                                                                       lets and the substitution of coal and heating oil.
   moisture content and relatively high energy density (about
                                                                                         Despite the rapid growth of wood pellets production
   17.5 GJLHV/tonne), interesting properties for long-distance
                                                                                       and consumption, and the high GHG emission reduction
   transport. It is economically more feasible to transport wood
                                                                                       potential, a comprehensive market analysis has so far been
   pellets instead of wood chips above 5000 nautic miles2
                                                                                       lacking. The aim of this analysis is to map major European
   (9300 km). The first truly long-distance transport of wood
                                                                                       wood pellet flows (production, trade, and consumption), to
   pellets was in 1998 from Canada to Sweden.3 Ever since, the
                                                                                       provide the main drivers for dedicated pellet markets for
   international trade in wood pellets by truck and boat and,
                                                                                       heating and power production (trading prices, national pol-
   to a lesser extent, by train, has been growing rapidly. The
                                                                                       icy support), and to discuss future projections. The focus of
   overall rationale behind long-distance trade is an abundant
                                                                                       this analysis is on EU-27 markets for pellet production and
   availability of cheap feedstock in some world regions, high
                                                                                       use in 2009, but the analysis also includes trade flows from
   demand in other, resource-scarce regions, and the presence
                                                                                       non-EU-27 countries, a major source of supply for the EU-27.
   of cost- and energy-efficient logistics.
                                                                                       Main questions for our future projections are: how much
     In January 2007, the European Commission launched
                                                                                       can wood pellets contribute to the EU’s 20% RES policy in
   a plan for a more ambitious and integrated policy for
                                                                                       2020 and what is the self supply of raw material needed for
   Europe in order to tackle the issues of climate change and
                                                                                       the expected 2020 consumption levels of pellets and other
   energy supply. New objectives were embedded in a legisla-
                                                                                       woody biomass?
   tive Directive for Renewable Energy Sources (RES),4 which
                                                                                         Following this introduction, we briefly present the meth-
   would ensure the equitable participation of all EU member
                                                                                       odology used for data collection, followed by a description of
   states.5 A first objective concerns the share of energy from
                                                                                       the input of country data and volumes. We continue with a
   renewable sources in gross final consumption of energy in
                                                                                       discussion of wood pellet price developments and an outlook
   2020, set at 20%. For comparison: the 2008 share of renewa-
                                                                                       of future consumption of pellets and raw material availabil-
   bles sources is 8.4%, of which 3.9% is from wood and wood
                                                                                       ity. Methodological constraints and actual market develop-
   waste materials,6 including wood pellets (0.2%).
                                                                                       ments are reviewed in the Discussion section. We end with
     The EU Directive defines three options to reach the ‘20%
                                                                                       conclusions and recommendations.
   renewable goal’ in 2020:

   1. The use of renewable electricity.                                                Methodology
   2. The use of renewable energy for heating and cooling.
                                                                                       Three main sources are used to map the European pel-
   3. The use of renewable transportation fuels (e.g. liquid bio-
                                                                                       let flows. First of all, figures for the 27 EU countries, plus
      fuels).
                                                                                       Norway and Switzerland are extracted from the European
     Wood pellets can contribute to the first two goals (electric-                     Pellets@las-project.8 These Pelletsatlas data are used as a
   ity and heating). In the (near) future wood pellets could, in                       main source for tables and graphs. Second, Rakitova and
   principle, also be used as a lignocellulose feedstock for the                       Ovsyanko9 inventoried pellet markets in Russia, Belarus,
   production of second-generation biofuels. The use of wood                           and Ukraine. Third, data lacking from the Balkan countries

          © 2011 Society of Chemical Industry and John Wiley & Sons, Ltd | Biofuels, Bioprod. Bioref. (2011); DOI: 10.1002/bbb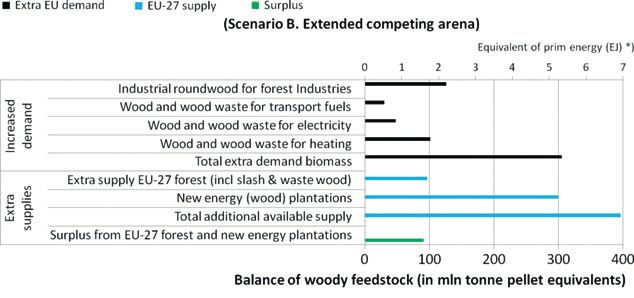
Modeling and Analysis: Wood pellet markets                                                                                                  R Sikkema et al.

  have been derived from a workshop, organized by the United                          3. Consumption: Before doing an inventory of pellet con-
  Nations Economic Commission for Europe (UNECE)                                         sumption by all types of final consumers, the ‘apparent
  Timber Section.10 The pellet markets in Europe for produc-                             consumption’ was determined per country, using for-
  tion, international trade, and consumption flows are evalu-                            mula A. Note that minor amounts of wood pellets may
  ated as follows:                                                                       also be used as stable bedding for horses, cattle, etc. We
                                                                                         assumed that those volumes were negligible and thus
  1. Production: Volume data was collected once a year for
                                                                                         100% of wood pellet production and trade was used for
     the previous year via national pellets associations, the
                                                                                         energy purposes.
     Internet or direct contact with pellet manufacturing
                                                                                                                (formula A)
     companies. In the exceptional case of incomplete country
                                                                                        Apparent consumption = Production + import +/– stock
     figures, alternative data were derived from a survey by
                                                                                      changes – export
     Bioenergy International (BI)11, 12 on individual produc-
                                                                                        For a detailed analysis of trade flows, both domestic des-
     tion plant capacities and realized production for pellet-
                                                                                      tinations and export are investigated. The breakdown of
     producing countries in 2008 and 2009. Unlike our own
                                                                                      data for apparent national pellet consumption for separate
     inventory, the BI survey did not include all small pellet
                                                                                      markets was collected via national pellet associations, the
     plants (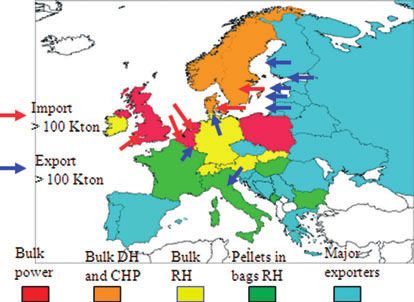
R Sikkema et al.                                                                                                      Modeling and Analysis: Wood pellet markets

   •    Bulk pellets and bagged pellets for small-scale users. As
                                                                                             once delivered on board the ship by the seller. Used
        quantitative data for this market segment are not avail-
                                                                                             for sea or inland waterway transportation35 and focus-
        able, the consumption was estimated via general trend
                                                                                             ing on export harbors. The FOB price plus costs for
        analyses, such as the amount of heating appliances, aver-
                                                                                             insurance freight results into CIF prices. Freight costs
        age temperature, amount of winter days, etc. In Austria,
                                                                                             are are calculated by means of charter rates, bunker
        for example, the previous year’s sales of pellet boilers
                                                                                             fuel prices and unloading costs.112 VAT is not applica-
        and stoves, including heating capacities, are surveyed
                                                                                             ble at this stage.
        each year by a representative farmers’ organization.19
                                                                                          GEC. Gross Energy Consumption. In 2008, the GEC in
        The number of boilers (bulk pellets) have been surveyed
                                                                                             the EU-27 was about 75 EJ or 1800 million tonne of oil
        in Austria since 1996, and the number of pellets stoves
                                                                                             equivalents (MTOE). 1 MTOE = 2.38 million tonnes
        (bagged pellets) since 2006.
                                                                                             of pellets.
   •    In addition to the national market types, there are also a
                                                                                          GJth: Gigajoules. 1 GJth = 0,067 tonne of bagged pellets
        number of countries that display a relatively low domestic
                                                                                             (efficiency η = 0.85) for residential heating or 0,062
        demand for wood pellets in the period 2007–2009, and
                                                                                             tonne of bulk pellets (ή = 0.92) for district heating.
        mainly produced wood pellets for export. Corresponding
                                                                                             GJ(p): Primary GJ. 1 primary GJ = 278 kWh(p).
        export volumes for 2009 have been extracted from Eurostat.13
                                                                                          Retailers. A retail merchant or retailer sells pellets to end-
     As a second part of the market analysis, an overview was                                consumers (including businesses). A shop owner is a
   compiled of price developments in recent years, based on the                              retail merchant. If a producer sells to end consumers,
   major market types per country. Price developments were                                   he is also a retailer.
   collected from producers, traders, retailers, and large-scale                          Tonne pellet equivalent (TPE). One TPE has a solid vol-
   consumers (see Box 1 for definitions). Since wholesale prices                             ume113 of 2 m3, a moisture content of about 10 to 20%
   of pellets depend largely on individual agreements between                                and a primary energy content of 17.6 GJ per tonne.
   two companies, the focus of the price data inventory was on                               Solid m3 industrial roundwood is excluding bark
   end-consumer prices. Three different categories exist:                                    (underbark). One m3 sawdust = 0.35 TPE. One metric
                                                                                             tonne is 1.10 short dry ton (US unit).
                                                                                          Traders. A wholesale merchant or trader operates in the
       Box 1: List of acronyms and main                                                      chain between producer and retail merchant. Some
       conversation factors.                                                                 wholesale merchants only organize the movement
                                                                                             of goods rather than move the goods themselves. If
       ARA. Amsterdam, Rotterdam, and Antwerp, the                                           a producer is selling to traders or retailers, he is also
          major harbors in Europe for international pellet                                   considered to be a trader.
          transhipments.                                                                  Transportation fuel. Average conversion efficiency of
       CIF. Cost, insurance, and freight. Title and risk pass to                             woody biomass into liquid biofuels is about 50%.
          the buyer when delivered on board the ship by the                               TWh(p). Terra Watt hours primary. 1 TWh(p) = 0.205
          seller who pays transportation and insurance cost                                  million tonnes of pellets (moisture content 10%),
          to destination port. Used for sea or inland waterway                               based on a primary energy content of 17.6 GJ per
          transportation35 and focusing on import harbors.                                   tonne pellet. 1 MWh(p) = 0.205 tonne of pellet.
          VAT is not applicable at this stage.                                            TWh(e). Terra Watt hours electric. 1 TWh(e) = 0.51 mil-
       Exchange rates. The amount of foreign currency in €                                   lion tonnes of pellets (moisture content 10%), based on
          (euro). Currency rates are derived both from www.                                  a primary energy content of 17.6 GJ per tonne pellet
          oanda.com56 and from www.ecb.int.111                                               and an efficiency rate (η) of 40.1% for Dutch electricity
       FOB. Free on board. Title and risk pass to buyer includ-                              production based on 10% wood pellet cofiring
          ing payment of all transportation and insurance cost                               (η = 41% for 100% coal).7

           © 2011 Society of Chemical Industry and John Wiley & Sons, Ltd | Biofuels, Bioprod. Bioref. (2011); DOI: 10.1002/bbb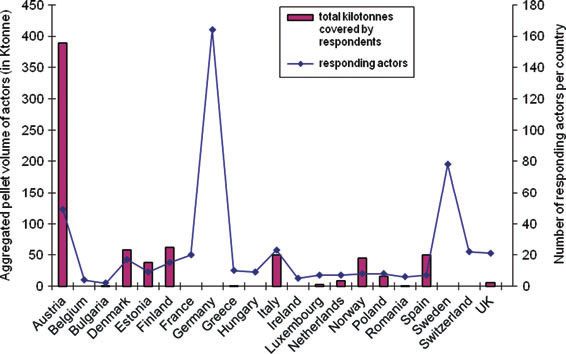
Modeling and Analysis: Wood pellet markets                                                                                                R Sikkema et al.

  1. A purchase of a maximum of 1 tonne of non-industrial,                            prices exists since 2006, with all indexes related to pellet
     bagged pellets (15 to 25 kg bags) at retailer shops by resi-                     price in first quarter of 2008.28 Consequently, the continuity
     dential users (in € per tonne, including VAT). Transport                         of prices may vary because the response rate in most coun-
     costs between retailer and households are therefore not                          tries was quite low in the beginning. For some countries
     included.                                                                        (Czech Republic, Latvia, Lithuania, Slovakia, Slovenia, and
  2. A delivery of about 5 tonnes of non-industrial bulk pel-                         Portugal) it was more or less impossible to collect price data,
     lets for residential markets (in € per tonne, including                          due to the limited number of actors or the lack of coopera-
     VAT) and a single maximum transport distance of 50 km                            tion. Figure 1 shows the responses of actors involved in non-
     to households.                                                                   industrial pellets for heating. The external surveyed coun-
  3. Sales of industrial bulk pellets to large-scale consumers (in                    tries are generally based on non-weighted average prices
     € per tonne), when delivered and unloaded at the harbor of                       (arithmetic mean), i.e. dividing the sum of all prices by the
     destination (CIF ARA, excluding VAT). Delivered volumes                          total number of respondents. In that case, only respondents
     had to be at least 5000 tonnes. CIF ARA means wood pel-                          are shown.
     lets delivered to the Rotterdam, Amsterdam, or Antwerp                             The survey of industrial consumers started in the
     area, and costs, insurance and (sea) freight are paid by the                     Amsterdam, Rotterdam and Antwerp (ARA) area, com-
     (overseas) seller of wood pellets. Inland transport by road                      monly used for coal transportation. Pellets are mostly traded
     or river ways and power plant handling are excluded.                             via the main hub of Rotterdam harbor, after which pellets
                                                                                      are transhipped (redistributed to smaller vessels) to other
   Four times a year, we collected either quarterly or monthly
                                                                                      destinations, such as the United Kingdom. Between 2007
  pellet prices, depending on responses and data availability.
                                                                                      and 2009, only one large trader and two to three small trad-
  From the first quarter of 2007 to the third quarter of 2009,
                                                                                      ers participated in the Dutch price surveys. Their aggregated
  we collected pellet prices for 25 European countries plus
                                                                                      trading volume was between 350 and 400 Ktonne. From
  Norway and Switzerland either on a monthly or quarterly
                                                                                      November 2008 onwards, the average weighted prices for
  basis, depending on responses and data availability.20 For
                                                                                      these bulk pellets (CIF ARA) were replaced by index prices
  each of the three price categories outlined, the preferred
                                                                                      published by APXEndex.29 The Endex pellet prices are com-
  method was to calculate a weighted average price, based
                                                                                      piled by an expert panel of about 10 pellet actors (producers,
  on the individual respondent’s volumes, according to
                                                                                      traders, and consumers) and are calculated by the sum of
  formula B. However, respondents and volumes could be
                                                                                      all prices divided by the number of experts. Two prices (the
  double-counted, when more than one actor is involved in
                                                                                      maximum and minimum price submitted) are left out of the
  a tonne of pellets. For example, a producer sells to a trader,
                                                                                      Endex price settlements. By the end of each month (since
  who then re-sells to another buyer.
                                                                                      November 2008), we extracted Endex’s short-term prices,
                             (formula B)
                                                                                      one month ahead of delivery. These prices came closest to
                  Price_actor1*Volume1 + Price_actor2*                                the collected prices in Pelletsatlas. However, daily prices
                  Volume2+ … +price_Actori* Volumei                                   from the real spot markets (in time delivery) do not realy
  Average price =
                              ∑ Volume                                                reflect purchases by large-scale power plants, because the
    The introduction of non-industrial pellet enquiries differed                      spot market cannot immediately deliver the large volumes
  from country to country. Whereas some countries already                             needed (see Discussion). During our surveys in Sweden and
  had existing price statistics, like Austria, 21 Germany,22                          Denmark, the share of bulk pellets for medium-scale users
  and Ireland,23 other countries had to start from scratch. In                        got larger than those for residential heating. Therefore, we
  that case, we started to collect prices ourselves, or waited                        incorporated new price statistics for industrial bulk pellets
  for external price surveys to be developed. For example,                            for medium-scale district heating and for (larger) combined
  Sweden24 and Switzerland 25 started in July 2007, Belgium26                         heat power (CHP) plants. Based on real invoiced pellet deliv-
  and Finland 27 started in 2008. In France, an index of pellet                       eries, FOEX 30 publishes monthly average weighted pellet

© 2011 Society of Chemical Industry and John Wiley & Sons, Ltd | Biofuels, Bioprod. Bioref. (2011); DOI: 10.1002/bbb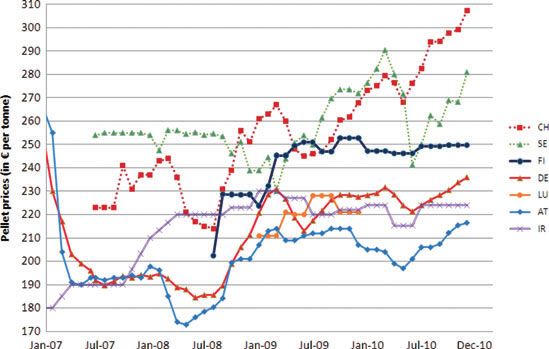
R Sikkema et al.                                                                                                     Modeling and Analysis: Wood pellet markets

                               Figure 1. Responding actors (non industrial pellets) by the 3rd Quarter of 2009.

   prices for the Nordic market, derived from about 10 to 20                           Aggregated European production
   Scandinavian pellet actors (with an aggregated volume of                            Approximately 670 pellet plants in Europe produced about
   about 600 Ktonne of pellets). The lowest and highest prices                         10.1 million tonnes of pellets (Appendix A), an increase of
   (20% of submitted data) are omitted from their average                              about 1.8 million tonnes compared to an earlier study of
   weighted price overview.                                                            production in 2008.20 A large number of these plants, 28%,
     The price section is completed with data for major pel-                           are small production plants with capacity of less than 10
   let export harbors in Latvia, Russia, the USA, and Canada,                          000 tonnes per annum. Bioenergy International11,12 listed
   derived from expert resources and commercial bulletins.31–34                        about 480 large pellet plants in Europe. The EU-27 produced
   These prices are generally registered free alongside ship                           about 8.75 million tonnes. The largest ones are Sweden and
   (FAS) without the costs of loading or free on board (FOB)                           Germany, both producing about 1.6 million tonnes. Most
   with loading costs. In our analysis, we used FOB prices for                         of the feedstock needed is purchased from external saw-
   dry bulk ships in export harbors, connected either by sea or                        mills. Italy on the other hand, Europe’s third largest pellet
   inland rivers. Under FOB conditions, title and risk passes to                       producer (0.77 million tonnes), has a lot of integrated pellet
   the buyer once the freight is loaded on board the seller’s or                       plants. Integrated pellet plants are built within or nearby
   international trader’s ship35 (Box 1).                                              sawmills. This way the feedstock is fully sourced within a
                                                                                       short distance.
                                                                                         After Europe, North America has the largest pellet pro-
   Major pellet markets and characteristics                                            duction facilities.11 North American production capacity
   Based on formula A, this section is divided into production,                        has grown from 1.1 million tonnes in 2003 to 4.2 million
   trade, and apparent consumption. Possible effects of stock                          tonnes in 200836 and 6.2 million tonnes in 2009.37 In 2009,
   changes are incorporated in the consumption section. Figure 2                       a number of new plants were built in the United States to
   shows the demand (below the x-axis) and supply (above the                           process chipped roundwood for bulk pellets designated for
   x-axis) situation in the major European pellet markets in 2009.                     export. Those plants have 3 to 4 times the production capac-
   Only markets larger than 500 000 tonnes are illustrated. In                         ity of the older plants, which are limited to 100 000 tonnes
   the case of Russia,*) the export is limited to the total recorded                   or less.36 As of June 2009, about 110 US and Canadian wood
   imports from Russia by all EU-27 member states.                                     pellet plants were in operation or were about to become

          © 2011 Society of Chemical Industry and John Wiley & Sons, Ltd | Biofuels, Bioprod. Bioref. (2011); DOI: 10.1002/bbb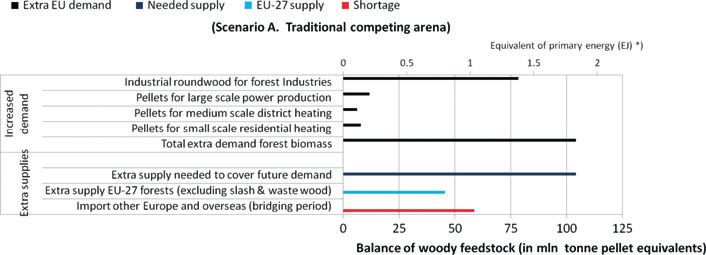
Modeling and Analysis: Wood pellet markets                                                                                                R Sikkema et al.

              Figure 2. Balance of pellet volumes for the major European country markets in 2009.

  operational. Wood pellet production in the United States                            These pellets originate from pellet producers using sawmill
  in 2008 amounted to 1.8 million tonnes, which was 66%                               residues and chipped trees from soft wood plantations.38
  of capacity. In Canada, the estimated production was 1.4                            Hintz37 estimated about 500 000 tonnes of pellet export
  million tonnes, about 81% of capacity. The lower capacity                           from the USA to Europe in 2009, which is twice the 2008
  utilization in the United States is a result of the more recent                     exports.39
  start-up of the plants. In both countries limitations on                              For 2009, about 3.3 million tonnes of pellet export was
  feedstock availability occurred because the economic crisis                         registered,13 of which 98% was traded within the EU. The
  constrained sawmill operations and reduced the output of                            EU import was about 3.8 million tonnes, of which about
  sawdust and shavings in 2008.36                                                     53% was covered by intra-trade. The biggest trade volumes
    The utilization rates of pellet plants of Europe’s largest                        are recorded by the Netherlands, Belgium, and Sweden; see
  producers Sweden, Germany, and Italy in 2008 were 64%,                              Table 1 for export or import volumes about or above 100 000
  56%, and 87%, respectively. In other words, if the capacity                         tonnes per annum. The main trade routes are from North
  in these three countries was fully utilized, production could                       America to the Netherlands and Belgium with average over-
  hypothetically rise by almost 2 million tonnes. Also, other                         seas (Panamax) shipments of 20 000 to 30 000 tonnes per
  European countries have not fully utilized their production                         freight, and from the Baltic States and Russia to Scandinavia
  capacities: the average Europe utilization rate of pellet pro-                      by coast liners with average loads from 4000 to 6000
  duction capacity in 2008 was about 54%.20                                           tonnes.40 Another important route is by truck from Austria
                                                                                      to Italy, with average loads of 24 tonnes.7
  European trade volumes                                                                According to Eurostat statistics,13 total EU intra-export
  While some markets such as Germany or Austria are largely                           is not equal to total EU intra-import volumes – the export
  self-sufficient, other markets, such as the Netherlands,                            of pellets is about 1.2 million tonnes more than import.
  Belgium, Denmark and Italy, depend to a very large extent                           Bilateral comparisons have revealed persistent discrepan-
  on the import of wood pellets. On the other hand, in many                           cies15 in various member states on intra trade statistics,
  producing countries (Canada being the prime example,                                called asymmetries. Main deficiencies occur:
  but also other areas such as the Baltic countries and north
  west Russia), the pellet production sector largely depends                          •    Within the new pellet code (44.01.3020). Most com-
  on export opportunities. A rather new actor in the market                                monly, the export is registered fi rst, followed by a reg-
  is the USA, which has started in 2008/2009 to export wood                                istration of the import. Countries are obliged to report
  pellets by train to and by ship from south-east US harbors.                              their intra-EU export and import flows within 10 weeks.

© 2011 Society of Chemical Industry and John Wiley & Sons, Ltd | Biofuels, Bioprod. Bioref. (2011); DOI: 10.1002/bbb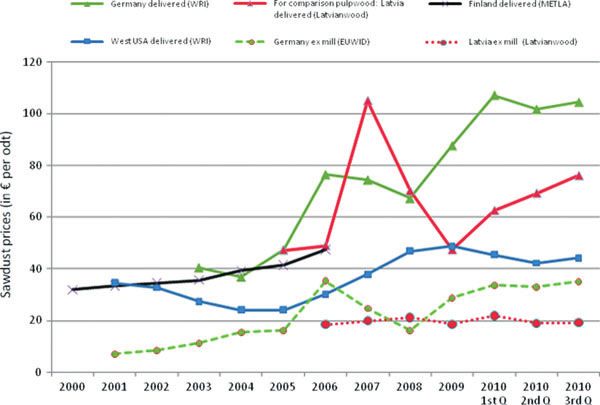
R Sikkema et al.                                                                                                      Modeling and Analysis: Wood pellet markets

    Table 1. Overview of major pellet trade flows in 2009, about or above 100 Ktonnes.13
                                                                                                                Trade volumes (Ktonne)
                     Country of origin                     Destination of export               Volumes recorded by                Volumes recorded by
                     (extra-EU trade) or                   (both intra- and extra-              exporting country                  importing country
                     country of consign-                   EU trade)
                     ment (intra-EU trade)
       Extra EU                                            Total volumes                                       64                           1769
                     Canada                                Netherlands                         No official custom records                    413
                                                                                                        available
                     USA                                   Netherlands                                                                       313
                     USA                                   Belgium                                                                           185
                     Russia                                Sweden                                                                            163
                     Canada                                Belgium                                                                            87
                     Russia                                Denmark                                                                            87
                     EU-27                                 Switzerland                                         46                    No records available
       Intra EU                                            Total volumes                                    3313                            2135
                     Austria                               Italy                                              292                            142
                     Estonia                               Denmark                                            256                            215
                     Lithuania                             Denmark                                            167                             36
                     Germany                               Spain                                              167                               1
                     Latvia                                Denmark                                            152                             71
                     Latvia                                Sweden                                             137                             74
                     Germany                               Denmark                                             98                             30
                     Latvia                                Estonia                                             95                             40
                     Portugal                              Netherlands                                         86                             70

         For trade with non-EU countries, the administration                                the implementation of the new pellet code by Eurostat.
         must happen within 6 weeks. According to Eurostat,14                               Discrepancies may occur by registering the exports as
         there should be no time lag between the date or registra-                          pellets, but the import either like sawdust (new code
         tion of a transaction in one member state and the date                             44.01.3040) or like ‘wood waste and scrap’ (new code
         on which the same transaction is recorded as an arrival                            44.01.3080).
         in another. In practice, the administration occurs in the                      •   Within the total wood products trade section
         reference month, in which the goods are exchanged or                               (Chapter 44). The system of thresholds for small actors
         otherwise the following month. Delays in data process-                             makes it possible to exempt a number of pellet actors
         ing can have a non-negligible impact on monthly sta-                               from statistical formalities. For a given transaction,
         tistics but are more or less negligible for the annual                             a large trader company may be required to provide
         statistics. In case of non-response, the pellet trade is not                       statistical information about export in one member
         registered, but the National Offices will make adjust-                             state, whereas the receiving smaller customers in
         ments on a Chapter level, in our case Chapter 44 Wood                              another member state may be exempted. According
         Products.                                                                          to Eurostat,14 the principle of full coverage has been
   •     Within the total category of ‘pellet, sawdust and other                            in force since January 2005. The principle implies
         residues’. As shown in Table 1, recorded exports (on                               that member states should estimate undeclared trade,
         a country level) are usually larger than recorded                                  including trade below threshold at least at Chapter level
         imports. Misapplication of the rules may occur due to                              and by partner country.

           © 2011 Society of Chemical Industry and John Wiley & Sons, Ltd | Biofuels, Bioprod. Bioref. (2011); DOI: 10.1002/bbb
Modeling and Analysis: Wood pellet markets                                                                                               R Sikkema et al.

   In the Discussion section, we take more discrepancies                              UK43 and Poland8 are also classified as large-scale industrial
  on a country level into consideration, like Lithuania and                           pellets markets, based on their 2009 consumption and plans
  Luxembourg with a negative apparent consumption.                                    for further wood pellet replacement at coal-fired plants.
                                                                                      According to BAPE,8 Poland promotes the use of agricul-
  Apparent consumption, storage facilities, and other                                 tural biomass, including pellets made from agro residues
  market characteristics.                                                             (mixed biomass pellets). Medium-scale consumers using
  The apparent consumption in Europe is estimated at about                            bulk wood pellets for district heating and also for (larger)
  9.8 million tonnes in 2009, of which 9.2 million tonnes is                          CHP plants are found in Sweden, Denmark, and Norway.
  within EU-27 member states. Sweden is by far the largest                            Alongside the industrial pellets users, the Scandinavian
  user of pellets (2.0 million tonnes), followed by Italy (1.1                        countries make considerable use of bulk pellets for house-
  million tonnes), the Netherlands (0.95 million tonnes),                             holds. Whereas the first (industrial) pellet market partly
  Germany (0.94 million tonnes), and Denmark (0.89 million                            relies on imported pellets, the second (non-industrial)
  tonnes). For comparison, about 80% of US-produced pel-                              market gets its supplies solely from domestic resources. In
  lets (1.5 million tonne) are put in small bags and consumed                         Austria and Germany, pellets are predominantly delivered in
  domestically for residential heating.41 By contrast, most                           bulk and used in small-scale private residential and indus-
  Canadian pellets (90%) are transported as bulk and shipped                          trial boilers for heating. Another group of countries exists
  overseas for power production in Europe.36 Asia could                               of small-scale consumers that use bagged wood pellets in
  also become an important consumer as the first large-scale                          stoves. Such residential markets are found in Italy, France,
  industrial project to cofire coal with (Canadian) wood pel-                         Bulgaria, and Hungary. Finally, major export markets are
  lets took place in Japan by the end 2008.39 The wood pel-                           found in Finland, Portugal, Spain, Russia, the Baltic States,
  let association of Canada42 estimated that Japan imported                           and most other East European countries.
  around 110 000 tonnes of wood pellets in 2009.                                        From available data in Austria, Germany, and Italy
    On the basis of fi nal pellet consumption, the European                           (Table 2) we learn that the average storage capacity at pel-
  countries are further classified by their major markets                             let production plants varies from 2300 to 3700 tonnes. For
  (Fig. 3), as defi ned in the section on Methodology.                                comparison, Hoglund44 indicated average stored volumes in
    Markets in Belgium and the Netherlands are dominated                              2007 of between 3100 and 4300 for Swedish pellet plants, and
  by the utilization of pellets in large-scale power plants. The                      an average storage capacity of 14 000 tonnes per plant. By
                                                                                      multiplying the storage capacity per plant and the number
                                                                                      of pellet plants, the total storage capacity on a country level
                                                                                      is estimated. In Austria, even an official strategic stock on a
                                                                                      country level was proposed but not introduced.45 Large pel-
                                                                                      let producers have more storage facilities compared to small
                                                                                      ones, due to a higher fluctuation in their real production
                                                                                      volumes. The average storage time is probably no more than
                                                                                      one week’s production for large pellet plants. Storage times
                                                                                      at harbors could be even higher. The storage of pellets is
                                                                                      not without risk, due to the moulding of pellets. Damp pel-
                                                                                      lets can swell up and are no longer usable. Even worse, dust
                                                                                      explosion may occur during storage. Consequently, inter-
                                                                                      mediate harbor companies (stevedores) have restrictions
                                                                                      when storing industrial pellets. In Canadian harbor silos,
  Figure 3. Overview of European pellet market and main market types                  the moisture content is limited to 8% and the weight fraction
  per country in 2009.                                                                of fines to 5% (Verkerk B, 2010, pers. comm.), whereas in

© 2011 Society of Chemical Industry and John Wiley & Sons, Ltd | Biofuels, Bioprod. Bioref. (2011); DOI: 10.1002/bbb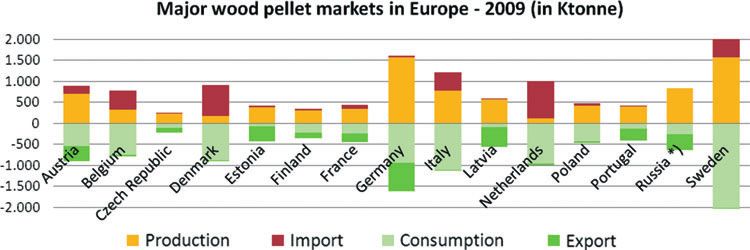
R Sikkema et al.                                                                                                        Modeling and Analysis: Wood pellet markets

    Table 2. Stored volumes of pellets in Austria, Germany, and Italy in 2008 (in tonnes).
                        Total capacity            Real production             Number of pellet               Average storage            Corresponding
                       on country level           on country level            plants responding                capacity per            storage capacity
                                                   (Appendix A)              to storage facilities                plant                on country level
     Austria                1 006 000                     626 000                        25                          2600                     65 000
     Germany                2 400 000                   1 460 000                        46                          3700                    168 000
     Italy                    750 000                     650 000                        75                          2270                    170 000

   Dutch silos, the moisture content is limited to 5% for white                           few responses from large-scale consumers, it is known that
   pellets or 9% for bark pellets, and 2% for fines. The tempera-                         their storage volumes may be quite large. The intermediate
   ture is also limited to a range between 40oC and 50oC.46                               storage in Rotterdam harbor reached about 200 000 tonnes
   Pellet actors may also incorporate the new European stand-                             in 2007, whereas the storage at the individual power utili-
   ards: EN 14961-1 for industrial (a framework with flexible                             ties could reach about 20 000 tonnes. Bulk pellets used for
   requirements) and EN 14961-2 for non industrial pellets47                              district heating also rely on intermediate storage facilities.
   (more or less replacing country-specific standards). One of                            For example, Pelletsindustrins Riksförbund (PiR) coordi-
   the differences between both EN-categories is related to the                           nates about 80% of Swedish pellet purchases toward district
   kind of feedstock (Table 3). Whereas the feedstock of non-                             heating and therefore has accumulated storage facilities in
   industrial pellets is limited to woody biomass (from forests,                          Swedish harbors up to 10 000 tonnes.33 Non-industrial pel-
   plantations, industrial residues, or waste wood), feedstock of                         lets have almost no intermediate storage facilities in the sup-
   industrial pellets may also be sourced from herbaceous and                             ply chain, but boilers are relative large and have extra space
   fruit biomass or from blends and mixtures. Non-industrial                              for pellet feed-in.48
   pellets are further split into subcategories: A1, A2, and B,
   each having detailed specifications for feedstock but also for                         Price developments
   others. One distinctive element is the allowed ash content:
   0.7%, 1.5%, and 3.0% (weight fraction) for respectively A1,                            Industrial pellet prices (CIF)
   A2, and B.                                                                             The pellet prices for Dutch power plants are volatile, 52,53
     Since 2008, power companies in the Netherlands no longer                             because the ARA market has a limited amount of actors,
   purchase their pellets on a single-utility basis. Instead they                         up to five large power companies and three international
   have moved their trading activities to dedicated European                              traders. The pellet prices have increased from around €115
   head trading offices for strategic reasons and they have cre-                          per tonne in July 2007 to €140 per tonne at the beginning of
   ated a well-developed market. Most large-scale consumers                               2009. Since then, prices have steadily been declining towards
   have long-term contracts with their suppliers, but in case of                          €125 per tonne at the end of 2010 (Fig. 4). Between 2003 and
   low prices, they are eager to buy from short-term delivery                             2006, the Dutch government granted long-term subsidies
   markets. For that reason they have created strategic stor-                             for cofiring biomass of up to €0.06 and €0.07 per kWhe, a
   age facilities at the harbors. The individual power units use                          scheme ending between 2012 and 2015. This is equal to about
   these stored pellets for cofiring or the central trade office                          €120–135 per tonne of pellets and has given an enormous
   will re-trade them to other users within or outside the                                boost to the cofiring of pellets in coal power plants. This
   country. Whereas the storage facilities at production and                              feed-in tariff is meant for bridging the gap between total
   at conversion sites (power plants) are mostly dependent on                             production costs (fuel, operation and maintenance, capital)
   the season (high in summer at production; high in winter at                            of pellets and coal.7 Another pellet price index for north-
   conversion), the storage at intermediate distribution stages                           west Europe was created in May 2009, 31,32 based on submis-
   (harbors) shows market dependent fluctuations (low storage                             sions from about 15 pellet actors in UK harbors as well as in
   at high price level; high storage at low price level). From the                        Dutch and Belgium harbors for deliveries within 90 days.

             © 2011 Society of Chemical Industry and John Wiley & Sons, Ltd | Biofuels, Bioprod. Bioref. (2011); DOI: 10.1002/bbb
Modeling and Analysis: Wood pellet markets R Sikkema et al.
Table 3. Characteristics of Europe’s major pellet market types.
Large-scale users Medium-scale users Small-scale users Small-scale users
(bulk) (bulk) (bulk) (small bags)
Suppliers International pellet European pellet production Domestic production Domestic production
production plants. plants. plants. plants.
Storage at pellet Average 2500 to 5000 tonnes of actual storage per pellet production plant.
plants
Intermediate International operating Predominantly domestic Domestic traders Retailers
companies traders (with one main traders
European office)
Typical way of (Inter-) continental shipping European short sea ship- Lorry transport (delivery of Both lorry transport to
transport (in Panamax or Handymax ping (average 5000 tonne) 1 to 6 tonnes per house- retailers and private cars
vessels, freights: 10 000 or lorry transport (max hold per year). to households.
to 100 000 tonnes). volumes 40 tonnes).
Contracts Both long-term contracts Predominantly long-term Annual deliveries upon Infrequent purchase at
(up to 3 years) and pur- contracts (up to 3 years), request. retailers (15 to 25 kg
chase from short-term plus short-term delivery bags).
markets, e.g. within one from daily spot markets.
month deliveries.
Number of Few, internationally operat- For example, Sweden has Used in pellet boilers, both Dedicated stoves, mainly
demand players ing utilities. For example, about 100 district heat- in households and in in households. A range
per country in 2009, the Netherlands ing plants, using pellet small industry. For exam- of pellet stoves is cited.
had four power compa- boilers. In Denmark larger ple, between 1997 and In Italy the range is
nies that cofired wood CHP plants use pellets, 2009, about 71 000 boil- estimated between
pellets in six existing too. ers were sold in Austria.19 525 00049 and
units. 801 000.50
Actual storage at Both at harbor (up to Storage in harbors could Average use for boilers in Low, due to the small size
end users 200 000 tonnes) and be large, up to 10 000 Austria & Germany about of the bags (15 to 25 kg)
on-site (up to 10 000 tonnes (like in Sweden). 6.5 tonnes per year; stor- and ad hoc purchase of
tonnes per plant). On site less stock vol- age capacity from 1.5 to these bags.
Annual stock changes at umes needed: up to 500 15 tonnes.51 Proposed
a country level may be tonnes. national strategic Austrian
considerable. pellet stock is not
honoured.45
Quality Company-specific criteria, like in harbors.46 Predominantly country specific standards. Implementation
requirements Implementation of a flexible, pan European EN 14961-1 of pan European standard EN 14961-2 for non industrial
standard for industrial pellets47 since April 2010. pellets47 from 2011. Three subcategories A1, A2, and B,
Feedstock may exist of woody biomass, herbaceous each consisting of detailed specifications for woody bio-
biomass, fruit biomass or blends and mixtures. mass feedstock, ash content and others.
Sweden has a major market for bulk pellets for medium- compared to power utilities in the Netherlands. Next to
scale consumers and (larger) CHP plants. The price of feed-in tariffs and taxation measures, an extra incentive is
industrial pellets in Scandinavia increased since January applicable for all industrial pellet markets via revenues from
2007 to about €138 per tonne in October 2010. Remarkably, CO2 emission rights. The price of CO2 rights were between
pellet prices in Scandinavia are moving in the opposite €10 and €20 in the period 2007 to 2009, 54 or on average
direction, compared to those in the Netherlands, prob- €0.012 per kWhe.7 Th is is equal to about €24 per tonne of
ably due to a different methodology of price setting (see pellets (Box 1).
Discussion). Also, in the current Swedish tax system, heat
generation and power production from fossil fuels is taxed Residential pellet prices
(about €10 per GJth) for CO2 and sulfur emissions.7 The According to another European study,49 a surge in sales of
Swedish tax is equal to about €160 per tonne of pellets. solid fuel appliances (boilers for bulk and stoves for bagged
Obviously, the Swedish subsidy for pellet use allows dis- pellets) in Europe has occurred since the mid- 2000s after
trict heating plants to pay higher prices for wood pellets, a long period of declining solid fuel appliance sales during
© 2011 Society of Chemical Industry and John Wiley & Sons, Ltd | Biofuels, Bioprod. Bioref. (2011); DOI: 10.1002/bbbR Sikkema et al. Modeling and Analysis: Wood pellet markets
Figure 4. CIF prices of bulk pellets for large scale power production in the Netherlands, United
Kingdom and for medium scale district heating & CHP in Scandinavia.8,31–34
the 1990s. The increase accelerated in 2005, notably in inventories had a low response rate and are therefore not
Austria, the Czech Republic, France, Germany, Poland, incorporated. Like the Swedish krona, the Swiss franc has
and Scandinavia. The growth can be explained by three key gone up in value against the euro, resulting in higher pel-
elements: the image of high-performing, environmentally let prices in euro. Obviously, Switzerland started to import
friendly heating appliances; increasing prices of natural gas relatively cheap pellets from its ‘euro neighbors’. Switzerland
and heating oil; and government subsidies for pellet boiler imported one-third of its apparent consumption from
investments. France, Germany, and Austria.13
Non-industrial pellets for households are generally more The market price for pellet in bags (at retailer’s shops)
expensive than their industrial counterparts. The former were quite varied during 2007 and 2008, but they tended to
include VAT both for bulk and bagged pellets. They also stabilize between €200 and €220 per tonne in 2009 (Fig. 6).
have higher quality standards (ash content, dust, etc). The Neighboring countries Italy and France show a similar price
extremely high pellet prices in Austria and Germany, early development. Bulgaria and Hungary have only recently
in 2007, were exceptional and were mainly caused by a fast started pellet production and are largely exporting, due to
increase in Italian pellet demand and a cold winter the year a lack of domestic demand. Pellets for the marginal domes-
before. German and Austrian seasonal developments are tic demand are usually sold ‘explant’, due to a missing
very similar. They have both their market structures in raw pellets distribution system, and are thus relatively cheap.
material supply, and pellet distribution in common. Until Whereas Bulgaria has a fi xed exchange rate against the uuro,
now, they have been more or less self-sufficient. The non- Hungarian changing rate led to increasing pellet prices in
industrial pellets price in Northern Europe does not seem to euro.
follow any seasonal pattern. Rising prices in Finland are due
to the rising price of the raw material. Swedish prices used to Transport costs
be quite stable. Due to a changing rate of the Swedish krona Distribution costs are a key factor in total costs.7 The main
against the euro, market prices in euro went up on average means of transport within Europe is road transport. The
after October 2008 (Fig. 5). Note that Danish and Norwegian global road transport prices for wood pellets varied between
© 2011 Society of Chemical Industry and John Wiley & Sons, Ltd | Biofuels, Bioprod. Bioref. (2011); DOI: 10.1002/bbbModeling and Analysis: Wood pellet markets R Sikkema et al.
Figure 5. Prices of bulk pellets for residential heating in Europe (including delivery and VAT).
Figure 6. Prices of pellets in small bags (R Sikkema et al. Modeling and Analysis: Wood pellet markets
Figure 7. US Dollar exchange rate versus CIF ARA pellet prices.8,29,56
The industrial bulk pellet price is closely linked to the size Sweden is on average US$7 per tonne more than shipping to
and the length of a contract. Next to short-term contracts, the Netherlands.
both APX Endex 29 and Argus Biomass31 started to publish
longer-term contracts (for deliveries up to three years ahead) Pellet export prices (FOB)
in the fourth quarter of 2010. The latter could be more than The USA and Canada are the largest exporters of wood pel-
€10 per tonne pellet more expensive, because buyers pay a lets to Europe.13 The major export harbors in North America
premium to secure their feedstock supplies. According to the are located in the south-east USA (Mobile in Alabama;
Forest Energy Monitor,52,53 most wood pellets are shipped Panama City in Florida) and Vancouver in west Canada
under long-term contracts, made in dollars. The exchange (Verkerk B, 2010, pers. comm.).38 The wood pellet prices
rate of the dollar against the euro is thus a key factor for for export (FOB)31,32 rose from €85 in July 2009 to €112 per
European customers. Figure 7 shows the possible correla- tonne of pellets by November 2010 in south-east USA and in
tion of the dollar exchange rate with CIF ARA prices for the same period from €78 to €112 per tonne in west Canada
wood pellets from one month to three years ahead ahead of (Figure 9). The tightness of feedstock supplies pushed up pel-
delivery. let production costs in North America and Europe in 2009.52
Another relevant factor is the cost for freight. Figure 8 The major export flows from Eastern Europe originate
shows the ocean freight costs since 2002 between North from Russia and the Baltic States. Most pellets are delivered
America and Europe ranging from €27 to €69 per tonne of to Europe through St Petersburg harbor in north-west Russia
pellets.57–59 The dry bulk market, which was high since 2003, and via Riga harbor in Latvia. The remainder are transported
collapsed in 2008 as a result of decreased trading activity by truck. The prices of pellets exported from St Petersburg
and overcapacity of dry bulk ships in this sector60 and costs to Scandinavia and Western European countries were early
went back to the level they were before the price peak. Price 2010 at a level between €105 and €115 per tonne FOB.9,34
differences also occur between European destinations.52 Average export prices in Riga have gone up on an annual
Long-term contracts for shipping, signed early 2009, settled basis to about €119 per tonne by the end of 2009. Continuous
at below US$25 per tonne for Rotterdam, and were US$28 to supply has been difficult in both Riga and St Petersburg har-
US$29 for the UK and US$42 for Scandinavia. For compari- bors. Most of the suppliers are relatively small – in terms of
son, a Canadian pellet study61 assumed that sea transport to production less than 25 000 tonnes per annum – so it takes
© 2011 Society of Chemical Industry and John Wiley & Sons, Ltd | Biofuels, Bioprod. Bioref. (2011); DOI: 10.1002/bbbModeling and Analysis: Wood pellet markets R Sikkema et al.
Figure 8. Historic ocean freight costs between North America and Europe.57–59
Figure 9. FOB pellet prices in North American harbors.31,32
time for them to supply a full vessel. To have reliable delivery Main pellet market trends
and uniform quality, Scandinavian customers are willing to Table 4 summarizes the price developments for the major
pay a premium on top of daily pellet spot prices.33 By the end pellet market types as described in the previous sections.
of 2009, the average shipping costs from Riga to Denmark, The pellet market is quite dynamic due to economic develop-
as estimated by involved pellet actors, 33,59 were about €20 ments and recently released government biomass support
per tonne and about €25 per tonne for loads from both St plans. Public support is needed to cover the additional costs
Petersburg harbors. The latter have higher costs due to a of capital investment, operation and maintenance of renew-
longer period of ice coverage around the harbors and water- able energy equipment, and pellet fuel feedstock, in com-
ways, which leads to additional costs for icebreakers. parison with their fossil fuel alternatives.7 From the market
© 2011 Society of Chemical Industry and John Wiley & Sons, Ltd | Biofuels, Bioprod. Bioref. (2011); DOI: 10.1002/bbbR Sikkema et al. Modeling and Analysis: Wood pellet markets
Table 4. Major trends & proposals in Europe’s major pellet markets. Possible effects on pellet prices are
converted to € per tonne pellet (Box 1).
All impacts in € Large-scale users Medium-scale users Small-scale users Small-scale users
per tonne pellet (bulk) (bulk) (bulk) (small bags)
Feedstock costs Topic W. USA: upward Topic Latvia: Since 2008: Topic Germany: upward prices Topic Italy: relatively
price in 2010 for delivered low quality logs (and for sawdust: price 2009: high share of integrated
sawdust: €45/tonne pel- chips) are also used.33 €85 per tonne delivered.72 sawmills and small
let. Proposal USA: BCAP Higher feedstock costs Remarkably: next to a basic pellet plants. External
programme subsidy for and primary energy increase of ex mill prices, share of feedstocks
feedstock (equal to €13 per input.7 sawdust transport is increas- low, thus limited trans-
tonne62). ing (fuel costs; distance). port of sawdust, etc.
Pelletization costs Topic Canada: larger-scale Topic Sweden: higher Topic Austria: Higher pel- Topic Hungary and
plants are constructed for costs for power con- let drying costs.71 Topic Bulgarian: bagged pel-
lower costs per tonne of sumption per tonne of Switzerland: extra import lets have lower prices,
pellets.61 pellet produced7 from €-countries, due to with sales at the pellet
relatively low price. plant (rather than from
the retailer) due to a
lacking distribution
system.8
FOB prices Topic USA & Canada: Topic Russia & Latvia: Not applicable Not applicable
upward prices in 2010: level upward prices 2009
€110-115 per tonne.31 between €105–115
tonne.34
Ocean shipping prices Short sea shipping: in Truck transport between €16 and €18 per tonne in
International pellet are fluctuating: between 2009 about €20 per 2008-2010 for pellet transport.7,55
transport €30 and €70 per tonne in tonne from Riga and €25
2007–2010.57–59 from St Petersburg.33,59
Some future options. First a CO2 levy on international ship-
ping fuels:65 a levy of €15 per tonne CO2 results in €4 per
tonne pellet extra costs, based on 16 500 km distance and
15.9 g CO2 emissions per tonnekm.66 Second, torrefied
wood pellets (TWP) are developed for long distance ship-
ping. TWP are assumed to have 40% lower transportation
costs per unit.61
CIF prices Topic Netherlands: Fluctuating Topic Sweden: upward Not applicable Not applicable
APX-Endex prices, currently 2010 Foex price level of
above €130 per tonne.29 about €135 per tonne
pellet.30
Note: Long-term (instead of Note: reported FOB
short-term) contracts are most prices Russia,9,34
common, with purchases up plus sea freight and
to 3 years ahead of delivery. handling33,59 are just
below CIF prices.30
Final use (energy Topic Netherlands: Public sup- Topic Sweden: €10 Topic EU-27: new certification standards (EN 14.961-2)
conversion) of ported feed-in tariffs, €0.05 to per GJth tax on CO2 for non industrial use. Possible certificates are DIN+,
wood pellets €0.07 per kWhe (€120 to135), and sulphur emissions, EN+, etc. Example: basic certification costs for EN+
will gradually disappear after equal to about €160 per (excl. surveillance visits) are €0.06 to 0.13 per tonne pel-
2012. tonne.7 let. EN+ partly relies on existing certificates for sustain-
able forest resources.70
Government Topic Netherlands: new Topic Poland: share of Topic Germany: MAP Topic France: incen-
subsidies options proposed (e.g. min. agro residues of 100% subsidies (€36 per kW) tives for pellet stoves
biomass share cofiring).67 in 2015 for >5 MW for purchase of boilers for and boilers leads to
plants.8 households are continued replacement of old log
again, after a temporary boilers.74
stop.73
Topic UK: reduced ROC sub- Topic UK: RHI for dedi- Topic Italy: support
sidies for cofiring, down to cated biomass use in of local biomass for
£45 per MWhe,31,68 equal to heating plants. Tariff for energy plants is
€100 per tonne pellet. large plants (>0.5 MW) delayed by administra-
are £16 to £25 per MWth, tive procedures.32,75
equal to €85-€135 per
tonne pellet.69
© 2011 Society of Chemical Industry and John Wiley & Sons, Ltd | Biofuels, Bioprod. Bioref. (2011); DOI: 10.1002/bbbModeling and Analysis: Wood pellet markets R Sikkema et al.
types incorporated in the summary, we have seen the follow- • Medium-scale bulk for district heating and CHP. Pellets
ing trends occurring in recent years: for medium-scale heating in Scandinavia show an
increased price trend, through the increased cost of
• Large-scale bulk for power production. One topic from the
domestic pellet production. The number of pellet plants
start of the pellet supply chain is the BCAP programme
is increasing: traditional forest industries are investing
in the USA. The US government announced financial
in pellet plants resulting in extra feedstock competi-
support for all kinds feedstock for bioenergy:62 US$17.5
tion.53 On the other hand, the prices of imported pellets
per tonne, possibly lowering pellet production costs by
also went up. Latvian pellets, for example, increased
about €13 per tonne. In order to prevent unwanted shifts
from €95 to almost €120 per tonne FOB Riga. Amongst
from the forest industry to the energy sector, the BCAP
others, Latvian prices have increased by introducing
focuses on forest residues (low-quality logs) rather than
new feedstocks such as low quality pulpwood, which is
sawmill residues (chips, sawdust). In Canada, as another
more expensive than traditional sawdust (Fig. 10). The
example, newly constructed pellet plants are larger61 to
distribution of pellets, by means of short sea shipping
comply with the growing needs of the European power
remains quite stable: between €20 and €25 per tonne.
plants. CIF market prices for pellets are increasing; the
At the end of the supply chain, Swedish consumers of
dollar rate has a major stake in this trend. Remarkably
industrial pellets generally pay higher pellet prices, due
FOB prices in North America31 plus the reported
to a high tax system for CO2 and sulfur emissions of
freight57–59 seems to overtake the CIF prices (in case of
competing fossil fuels: €10 per GJth. Th is tax, equal to
short-term delivery time) by 2010. Concluding, published
€160 per tonne of pellets has the largest impact of all
short-term CIF prices29,31 do not reflect the real market,
trends. A minimum obligation is already in place in
because pellets are more and more frequently purchased
Poland, where for larger (>5 MW) energy plants a share
on longer-term contracts up to three years.63,64 A near
of 100% is valid for biomass from agricultural resources
future impact for sea transport is a possible implementa-
(like mixed biomass pellets) in 2015.8 The UK focuses
tion of a carbon levy on shipping fuels after 2012.65 To
on the heating market in its renewable action plan. The
illustrate the relatively low impact: a tax of €15 per tonne
UK public subsidies are designed for the use of all kinds
CO2 is equal to €4 per tonne of pellets.* A larger effect
of biomass, including pellets. The proposed subsidies
may be expected from a future introduction of torrified
(Renewable Heat Incentive) range between €85 and €135
wood pellets. Transport costs are expected61 to decrease
per tonne pellet, converted from a tariff of £16–25 per
by 40% due to a higher energy density per m3. At the
MWhth for (district heating) plants larger than
other end of the pellet supply chain, public support is
0.5 MW.53,69
much stronger on the European continent; public sup-
• Small-scale bulk and bagged pellets for residential
port by Dutch feed-in tariffs (€120 to €135 per tonne) will
heating. Where bulk pellets for residential heating are
be gradually phased out after 2012 and maybe replaced
delivered at home, bagged pellets have to be purchased
by another regulation, like for example an obligatory
from retail shops, or in case a distribution network
proportion of biomass cofiring.67 For comparison, the
is lacking (as in Hungary and Bulgaria), from pellet
Renewable Obligation Certificates system68 in United
production plants. Italy has the largest bagged-pellet
Kingdom supports the use of biomass with about €100
market and most of its production integrated in small
per tonne of pellets (derived from £45 per MWhe for
sawmills. In France, the support for pellet stoves has
large-scale power production).
led to the replacement of older log boilers and fire
places.74 A particular trend break for pellets occurred
*Average CO2 emissions of international shipping are about 15.9 g CO2 per in Germany: public subsidies on the purchase of resi-
tonne km66 and the shipping distance between Vancouver, Canada and dential boilers were set on hold and later decreased to
Rotterdam, the Netherlands is 16 500 km7. €36 per kW installed kW.73 Bagged pellets and bulk
© 2011 Society of Chemical Industry and John Wiley & Sons, Ltd | Biofuels, Bioprod. Bioref. (2011); DOI: 10.1002/bbbYou can also read