The oilsands in a carbon-constrained Canada - The collision course between overall emissions and national climate commitments
←
→
Page content transcription
If your browser does not render page correctly, please read the page content below
The oilsands in a carbon-
                                    constrained Canada
                                    The collision course between overall emissions
                                    and national climate commitments

                                    Benjamin Israel
                                    Jan Gorski, Nina Lothian, Chris Severson-Baker, Nikki Way

                                    February 2020

                                    updated March 2020
Photo: Kris Krüg, CC BY-NC-ND 2.0
The oilsands in a carbon-
constrained Canada
The collision course between overall emissions
and national climate commitments
Benjamin Israel
Jan Gorski, Nina Lothian, Chris Severson-Baker and Nikki Way

February 2020

updated March 2020

Production management: Michelle Bartleman
Editors: Michelle Bartleman, Roberta Franchuk,       ISBN 1-897390-44-0
 Sarah MacWhirter
Contributors: Nichole Dusyk, Simon Dyer,             The Pembina Institute
 Duncan Kenyon, Morrigan Simpson-Marran              219 19 Street NW
                                                     Calgary, AB
©2020 The Pembina Institute                          Canada T2N 2H9
All rights reserved. Permission is granted to        Phone: 403-269-3344
reproduce all or part of this publication for non-
commercial purposes, as long as you cite the         Additional copies of this publication may be
source.                                              downloaded from the Pembina Institute website,
                                                     www.pembina.org.
Recommended citation: Israel, Benjamin. The
oilsands in a carbon-constrained Canada. The
Pembina Institute, 2020.

Pembina Institute                                       The oilsands in a carbon-constrained Canada | ii
About the Pembina Institute
The Pembina Institute is a national non-partisan think tank that advocates for strong,
effective policies to support Canada’s clean energy transition. We employ multi-faceted
and highly collaborative approaches to change. Producing credible, evidence-based
research and analysis, we consult directly with organizations to design and implement
clean energy solutions, and convene diverse sets of stakeholders to identify and move
toward common solutions.
————————————————— pembina.org —————————————————
twitter.com/pembina facebook.com/pembina.institute
Donate to the Pembina Institute
Together, we can lead Canada's transition to clean energy. Your gift to the Pembina
Institute directly supports environmental education and innovative research that
advances understanding and action on critical energy and environmental issues.
pembina.org/donate
Acknowledgements
The Pembina Institute would like to sincerely thank those who provided us feedback
and expert advice during the development of this report. We appreciate the generosity
of their time and effort, their thoughtful comments and critiques, and their willingness
to engage in this challenging but important discussion.
We would also like to dedicate this report to the memory of our former colleague and
friend Jodi McNeill — a passionate advocate of the environment, a bright and
independent spirit, a bridge-builder in an increasingly polarized environment — whom
we deeply miss.
Pembina Institute The oilsands in a carbon-constrained Canada | iiiContents
Foreword .............................................................................................................................................. 2
Executive summary ............................................................................................................................. 4
1. Introduction .............................................................................................................................. 8
2. The oilsands in context .......................................................................................................... 12
2.1. Canada’s annual emissions by sector ........................................................................... 12
2.2. Canada’s annual emissions by province ...................................................................... 14
2.3. Our international commitments ................................................................................... 15
2.4. Projecting oilsands emissions ....................................................................................... 16
2.5. Projecting global oil demand ......................................................................................... 19
3. Emissions intensity of oilsands ............................................................................................. 21
3.1. Measuring emissions intensity ...................................................................................... 21
3.2. Oilsands emissions intensity ......................................................................................... 22
3.3. How do the oilsands compare? ..................................................................................... 26
3.4. Emissions intensity summary ........................................................................................ 34
4. Looking forward: Is the power of technology enough? ..................................................... 35
5. Recommendations to improve oilsands climate performance ........................................ 39
6. Conclusion ............................................................................................................................... 45
Appendix A. Glossary ................................................................................................................... 46
Appendix B. Estimate of future Alberta oilsands’ GHG emissions ......................................... 50
Appendix C. Approved Alberta oilsands projects or expansions ........................................... 53
Appendix D. Past studies on oilsands life cycle GHG emissions ............................................ 55
Pembina Institute The oilsands in a carbon-constrained Canada | ivList of figures
Figure 1. Share of the oilsands emissions in national carbon budget to meet
Canada’s 2030 target ................................................................................................................. 5
Figure 2. Capacity of existing oilsands pathways (thousand barrels per day)........................... 10
Figure 3. Breakdown of emissions associated with oil and gas extraction and
processing in Canada in 2017 ................................................................................................. 12
Figure 4. Provincial GHG emissions by sector in 2017 ................................................................. 14
Figure 5. Historic and projected emissions growth by Canadian economic sectors ................ 16
Figure 6. Share of the oilsands emissions in national carbon budget to meet
Canada’s 2030 target ............................................................................................................... 17
Figure 7. Comparison of oil demand scenarios from the IEA, BP and McKinsey ...................... 19
Figure 8. Scopes of life cycle GHG emissions from transportation fuels ................................... 21
Figure 9. Range of upstream GHG intensity of oilsands marketed product .............................. 23
Figure 10. Historical and forecast upstream GHG intensity of oilsands marketed products .. 25
Figure 11. Well-to-refinery carbon intensity of oil production by country ................................. 28
Figure 12. Life cycle GHG emissions of various crude oils included in the OCI (oilsands crudes
as indicated) .............................................................................................................................. 30
Figure 13. Well-to-wheels life cycle GHG emissions of selected oilsands crudes and a few
representative North American crudes included in the OCI............................................... 31
Figure 14. Carbon intensity of crudes refined in California in 2018 ........................................... 33
Figure 15. Share of the oilsands emissions in Canada’s carbon commitments under a range
of improvement scenarios ...................................................................................................... 37
List of tables
Table 1. Global and Canadian oil production in 2018................................................................... 11
Table 2. Projected oilsands emissions in 2020 .............................................................................. 18
Table 3. Emissions intensity of oilsands technologies in 2017 .................................................... 51
Table 4. Projected cumulative emissions from oilsands sector per status as of Dec. 2019 .... 51
Table 5. Oilsands projects approved by the Alberta Energy Regulator as of Dec. 2019 .......... 53
Pembina Institute The oilsands in a carbon-constrained Canada | vForeword
Foreword
The Pembina Institute is a non-partisan, evidence-based,
national research organization, founded in central Alberta as
a response to the Lodgepole sour gas blowout in 1982. For
more than 30 years, we have collaborated with oil and gas
companies, communities, stakeholders, and all levels of
government from across the political spectrum to find
practical solutions for shared energy issues.
Our long record of working with the oilsands industry,
assessing its impacts on Alberta’s environment and
communities, as well as on Canada's greenhouse gas
emissions overall, have helped form policies that have led to Simon Dyer
significant environmental improvements. Executive Director
In 2006, the Pembina Institute identified the need for and
mapped out a pathway to carbon-neutral oilsands — a goal which many years later is
now being embraced by oilsands companies.
For more than 30 years, we have collaborated … to find
practical solutions for shared energy issues.
We helped develop the regulatory framework for carbon capture and storage project
development in Alberta, and helped to pioneer environmental, social and governance
performance indicators for oilsands operators through company-specific environmental
performance report cards. In 2015, we worked with leading oilsands companies and
other environmental organizations to make recommendations for Alberta’s Climate
Leadership Plan, which included an industry-wide benchmark on carbon intensity, a
100-megatonne annual limit on oilsands emissions, and ambitious methane reduction
targets.
Our record and expertise on oilsands issues is strong. We have worked tirelessly to
ensure fossil fuel development is in the public interest, to protect people, conserve
ecosystems, and tackle the global problem of climate change that is already exacting
punishing costs on Canadians. The need to carefully map out a sustainable economic
Pembina Institute The oilsands in a carbon-constrained Canada | 2Foreword
future in a decarbonized world is too urgent and the global problem of climate change is
too complex for any of us to solve alone.
The need to carefully map out a sustainable economic
future in a decarbonized world is too urgent
and the global problem of climate change is too complex
for any of us to solve alone.
We urgently need to work together to prepare Canada for the 21st-century,
decarbonized economy and have a fact-based discussion about the role of the oilsands.
This is a hard conversation that we as Canadians need to have in a constructive and
thoughtful way — let’s not shy away from it.
Simon Dyer, Executive Director
Pembina Institute The oilsands in a carbon-constrained Canada | 3Executive summary
Executive summary
Alberta’s oilsands are at a crossroads.
The oil and gas industry has made big contributions to Canadian society: providing jobs,
technology and research excellence, while warming homes, fuelling cars and powering
our electricity grids. Today, the oil and gas sector is facing unprecedented pressures.
While dramatic fluctuations in the price of energy commodities are not new, increasing
automation, adoption of new disruptive technologies, shifting market demands, and
climate commitments are reshaping the future of this sector. Business-as-usual no
longer applies — significant changes are necessary.
In a continuing effort to depolarize the conversation, this report seeks to help establish
a basic, commonly agreed-upon set of facts about Alberta’s oilsands, their emissions
performance and trajectories, and what Canada’s commitment to achieve deep
decarbonization will mean for the sector. Key points:
• Carbon emissions from the oilsands sector are the fastest-growing source
of emissions in Canada. This continuing upward trajectory not only reduces
the country’s ability to meet its 2030 reduction commitments, but is on a clear
collision course with Canada’s plan to become carbon-neutral by 2050. (Figure 1)
• Oilsands products are not homogeneous and there is a wide range in
performance when it comes to carbon emissions intensity. As a result of
variations in bitumen quality and extraction technologies, the range between
the highest and lowest upstream emissions intensity per barrel is nearly
threefold.
• The oilsands industry has worked toward decreasing the emissions
intensity of its products in the past decades. Continuous improvements have
reduced the carbon intensity of specific oilsands products, ranging from a 4% to
21% reduction since 2009.
• Despite these improvements in carbon intensity, absolute carbon emissions
from the oilsands continue to increase overall, as growth in production
outpaces gains from reductions in per-barrel intensity.
Pembina Institute The oilsands in a carbon-constrained Canada | 4Executive summary
• Studies reviewed for this report consistently find oilsands products to be
more carbon intensive than lighter, conventional oil sources. Recognizing
limitations of emissions intensity research and the challenge of comparing
studies, the best estimate currently available suggests a barrel of oil produced in
Canada is associated on average with 70% more GHG emissions than the average
crude produced globally.
• Acknowledging oil demand will not disappear overnight, most outlooks predict
demand will plateau or decline within the next decade. Subsequent global shifts
toward lower-intensity energy options are likely to put more carbon-
intense crudes — such as the bulk of oilsands products — at risk over the next
decade.
• The rapid development and deployment of breakthrough technologies — as
opposed to incremental improvements — is needed for the sector to decrease its
absolute carbon emissions in line with our climate commitments, and to remain
competitive as global energy systems change.
800
Projected emissions
716 Mt to targets
600 2030
target
GHG emissions (Mt CO2e)
511 Mt
Current
400 total emissions
200
Oilsands
emissions 81 Mt
110 Mt
?
11% of total
emissions 22% 2050
0 target
2017 2030 2050
Figure 1. Share of the oilsands emissions in national carbon budget to meet
Canada’s 2030 target
Data source: ECCC
Note: See Figure 6 for additional details.
Pembina Institute The oilsands in a carbon-constrained Canada | 5Executive summary Recognizing the improvements that the oilsands industry has made to date and the commitments leading companies have announced to achieve ambitious targets in the future, there is still a need for the sector to embrace its responsibility to reduce overall carbon emissions in accordance with Canada’s 2030 and 2050 targets. The Pembina Institute calls for both the Alberta and federal government to recognize the willingness of leading companies to adopt aggressive decarbonization targets, as well as mounting investor pressure to decarbonize the sector, and implement policies that will drive toward carbon-neutral — or even carbon-negative — oilsands production. It’s time to have a national conversation about how to reconcile oilsands emissions with Canada’s goal to decarbonize its economy by 2050. The intention of this report, carefully and explicitly supported by available evidence and research, is to further fact- based dialogue, as we all embark on this tough, but necessary Canadian conversation. Recommendations to improve oilsands climate performance 1. Establish strong regulations to decarbonize the industry Intentional effort is required to encourage a shift toward low- and zero-carbon production, by creating strong incentives for the development and deployment of breakthrough innovation. Recognizing the willingness of leading companies to adopt aggressive decarbonization targets, as well as mounting investor pressure to decarbonize the sector, governments need to implement policies that will drive carbon-neutral — or even carbon-negative — oilsands production. 2. Define and enforce sector emissions targets for 2030 and 2050, with five-year increments Meeting our 2030 and 2050 climate targets will require all sectors of our economy — and all Canadians — to do their fair share to contribute to the global effort of limiting the average temperature increase to 1.5°C. Decreasing GHG emissions reduction targets need to be set for the oil and gas sector, in five-year increments that would allow Canada to meet its 2030 national objective and its pledge to become a net-zero carbon emitter by 2050. 3. Support an innovation ecosystem to deliver breakthrough technologies A robust ecosystem to support innovation, research and development, needs to be funded and fostered so it can deploy solutions aimed at delivering breakthrough reductions — beyond incremental improvements — in emissions of current oilsands projects, as well as non-combustion uses of Alberta’s oil and gas resources. Pembina Institute The oilsands in a carbon-constrained Canada | 6
Executive summary

 4. Improve emissions monitoring and reporting

 Existing measurement, monitoring and reporting processes for oilsands emissions must
 be reviewed, strengthened and standardized in order to produce coherent data and
 enhance the transparency of the sector. As well, further analysis looking at existing and
 upcoming technology pathways is required to better situate oilsands products’ carbon
 intensity on the global supply curve.

 5. Appoint credible and effective energy regulators

 Effective energy regulators are needed both provincially and federally. They must be
 transparent and independent, with the ability to incorporate robust environmental and
 climate considerations into their decision-making, while having both the mandate to
 enforce regulations and the capacity to follow through on that enforcement.

Pembina Institute                                    The oilsands in a carbon-constrained Canada | 7
1.                Introduction
The oil and gas industry has made a big contribution to Canadian society. It has
provided jobs, technology and research excellence, while warming our homes, fuelling
our cars and powering our electricity grids. However, things are changing. Climate
change, while costing Canadians billions annually,1 is also leading toward planetary
tipping points.2 The oil and gas sector is already being impacted by increasing
automation, adoption of new disruptive technologies, shifting market demands —
including for increasingly decarbonized energy sources — and dramatic fluctuations in
the price of energy commodities.

Beyond a national commitment to cut emission by 30% by 2030, the current federal
government has promised to take Canada to net-zero carbon emissions by 2050.3 That
means considerable changes for Canada’s oil and gas industry — and Alberta’s oilsands
in particular.

As Albertans face the challenge of finding their place in this emerging new economy,
statements about the province’s energy resources — often conflicting ones — are
splashed across news sites, opinion pages, press releases, social media and even T-
shirts. In a politically fractured country and an increasingly decarbonizing global
economy, making heads or tails of specific statements in the deluge of information has
become more important than ever, not just for energy analysts or policy wonks, but for
those whose jobs and livelihoods depend on it, and for all of us concerned about the
catastrophic impacts of climate change here in Canada and around the world.

It has become increasingly common to hear Canada’s oil described by supporters as “the
cleanest, most ethical, environmentally-friendly energy in the world.”4 There are many
ways to assess the performance of Alberta’s oilsands, and it is true that many oil-

1
 While no official data is currently available, the liabilities of the Disaster Financial Assistance Arrangements (DFAA),
gives an indication of the financial impacts of climate change, increasing from around $100 million per year in the 1990s
to $500 million in 2009-10, and reaching $2 billion in 2013-14 and $1.6 billion in 2014-15. This metric is likely
conservative as it focuses on only one of the ways climate change impacts our society (i.e. extreme weather events).
Office of the Parliamentary Budget Officer, Estimate of the Average Annual Cost for Disaster Financial Assistance
Arrangements due to Weather Events, February 2016. https://www.pbo-
dpb.gc.ca/web/default/files/Documents/Reports/2016/DFAA/DFAA_EN.pdf
2
    Intergovernmental Panel on Climate Change, “Global Warming of 1.5 ºC.” https://www.ipcc.ch/sr15/
3
 Although it is Canada’s new climate target for 2050, as of February 2020, there is no official definition for what “net-
zero” carbon emissions mean. In this report “net-zero” and “carbon-neutral” are used interchangeably.
4
    Andrew Scheer, Twitter post, August 30, 2018, 9:02 a.m. https://twitter.com/AndrewScheer/status/1035196080361811968

Pembina Institute                                                       The oilsands in a carbon-constrained Canada | 8
Introduction
producing nations don’t measure up to Canada’s democratic and regulatory models, as
well as its environmental, social and governance (ESG) standards. However, to ignore or
misrepresent legitimate challenges facing the climate performance of the oilsands
industry is not a strategy that will help the industry succeed.
As a clean energy think tank with specific expertise in responsible fossil fuel
development, the Pembina Institute has historically focused on a wide range
environmental impacts of the oilsands: the adverse effects on surface and underground
water, air quality, wildlife and surrounding ecosystems, and the challenges of tailings
ponds and greenhouse gas emissions. 5 Increasingly our work encompasses the
economic risk and financial liabilities related to oilsands activities.
This report, however, is focused specifically on the question of oilsands’ carbon
performance, its impacts on national climate change commitments, and what Canada’s
deep decarbonization means for the industry. Given that absolute carbon emissions in
Canada and elsewhere have to decrease at an accelerating pace, Alberta’s increasing
oilsands emissions are accounting for a growing share of the pie.
Canada’s oilsands: a primer
Canada has the third-largest oil reserves in the world with 167 billion barrels of crude oil;
96% of these reserves are found in the oilsands of northern Alberta.6 The oilsands are the
fastest-growing source of Canadian oil, producing about 2.9 million barrels per day
(MMb/d) in 2018 (Table 1). By 2040, the federal government expects oilsands production
is to reach just under 4.5 MMb/d — a 55% increase.7
The bitumen extracted from the oilsands, whether through open pit mining or in situ recovery,
is a thick, sticky and viscous form of crude oil, characterized by the industry as extra-heavy oil.8
Unlike light crude oil, bitumen needs to be treated in order to flow on its own.
Bitumen accessible by mining comprises about 19% of oilsands reserves; however, in
2018 it accounted for almost half of oilsands extraction. The other 81% of Alberta’s
5
Pembina Institute, Solving the Puzzle: Environmental responsibility in oilsands development (2011).
https://www.pembina.org/pub/2210. Beneath the Surface: A review of key facts in the oilsands debate (2013).
https://www.pembina.org/pub/2404
6
Natural Resources Canada, “Crude oil facts: Canadian resources.” https://www.nrcan.gc.ca/crude-oil-facts/20064
7
Canada Energy Regulator, Canada’s Energy Futures 2018 Supplement: Oil Sands Production (2018). https://www.cer-
rec.gc.ca/nrg/ntgrtd/ftr/2018lsnds/index-eng.html
8
Raw bitumen generally has an API gravity below 10°, which makes it an extra-heavy crude oil. When this bitumen is
diluted to meet pipeline specifications, it becomes dilbit, with an API gravity corresponding to that of heavy oil. In other
words, oilsands bitumen is extra-heavy oil, but its marketable products are either heavy oil (e.g. dilbit) or light oil (e.g.
synthetic crude oil).
Pembina Institute The oilsands in a carbon-constrained Canada | 9Introduction
oilsands are too deep to be accessed from an open pit mine and can only be extracted
through in situ — or “in place” — methods.9
Because bitumen can’t naturally flow through a pipeline, it is converted into marketable
products either by diluting or upgrading before being sent for refining. Diluted bitumen,
or dilbit, can only be processed in high conversion refineries, specifically equipped to
work with heavy crude oils, while bitumen upgraded into a synthetic crude oil (SCO),
which has characteristics similar to lighter sweet crude oils, can theoretically be
processed by most refineries.
Mined bitumen has historically been upgraded because high levels of impurities (e.g.
asphaltenes) prevent it from meeting pipeline specifications even when diluted.
Meanwhile bitumen extracted in situ, which contains fewer impurities, has traditionally
been diluted.
Upgrading Refining
Synthetic (light)
Mining (1,362) (simple refinery)
crude oil
(1,668) Refined
(1,362)
petroleum products
PFT
(414)
Refining
Diluted bitumen (high conversion
In situ (heavy crude oil) refinery)
(1,910) (2,216)
Figure 2. Capacity of existing oilsands pathways (thousand barrels per day)
Data source: Oil Sands Magazine10
The two main pathways used to convert oilsands bitumen into refined petroleum
products (Figure 2) require more energy-intensive processing than most conventional
oils, which translates into additional carbon emissions at one stage or another. Diluted
bitumen is a heavy crude oil with a high sulphur content, and thus requires more
processing than lighter crudes to be transformed into transportation fuels. Meanwhile,
upgrading involves energy-intensive processes, and is generally associated with more
carbon pollution on a per-barrel basis than refining straight bitumen. Paraffinic froth
treatment (PFT), however, is a relatively new technology that has opened a new
9
“Crude oil facts.”
10
Oil Sands Magazine, “Mining Operations”; “Thermal In-Situ Facilities”; “Bitumen and Heavy Oil Upgraders.”
Consulted on November 15, 2020. https://www.oilsandsmagazine.com/projects
Pembina Institute The oilsands in a carbon-constrained Canada | 10Introduction
“technology pathway” whereby mined bitumen can be diluted to meet pipeline
standards.11 In 2018, 43% of raw bitumen from the province’s oilsands was sent for
upgrading in Alberta,12 but this proportion is expected to decrease in coming years due to
fixed upgrading capacity combined with growth of in situ production.
Table 1. Global and Canadian oil production in 2018
Metric Amount
Canada’s total crude oil reserves12 167 billion barrels
Canada’s total oilsands reserves12 161 billion barrels
Oil produced globally13 101 MMb/d
Oil produced in Canada12 4.6 MMb/d
Canadian oil exported — total12 3.7 MMb/d
To the United States 3.5 MMb/d
Oil imported — total14 0.6 MMb/d
From the United States 0.4 MMb/d
From Saudi Arabia 0.1 MMb/d
From other countries15 0.1 MMb/d
Oil produced by Canadian oilsands (64% of national production)12 2.9 MMb/d
Canadian refining capacity (at 16 refineries)16 1.9 MMb/d
Canadian upgrading capacity12 1.3 MMb/d
11
The PFT technology drastically reduces impurities, such as asphaltenes, contained in mined bitumen, allowing it to be
diluted to meet pipeline specifications — therefore removing the requirement of upgrading.
12
“Crude oil facts.”
13
U.S. Energy Information Administration, Short-Term Energy Outlook, “Forecasts: Global liquid fuels.”.
https://www.eia.gov/outlooks/steo/report/global_oil.php. This production includes condensates (also referred to as
natural gas liquids) which can be processed in a refinery.
14
Statistics Canada, Canadian International Merchandise Trade Database, Table 990-0027 27. Imports; Trade commodity:
270900 Petroleum oils and oils, obtained from bituminous minerals, crude. https://www5.statcan.gc.ca/cimt-
cicm/topNCountries pays?lang=eng&refYr=2018&refMonth=1&freq=12&provId=1&retrieve=Retrieve&tradeType=
3&topNDefault=250&chapterId=27&arrayId=0§ionLabel=V%20%20Produits%20min%20raux&commodityId=270900
15
Other import sources in 2018 included Azerbaijan, Norway, Nigeria, United Kingdom, Algeria, Colombia, Ivory Coast,
Russian Federation and Libya.
16
National Energy Board, Canadian Refinery Overview: Energy Market Assessment (2018). https://www.cer-
rec.gc.ca/nrg/sttstc/crdlndptrlmprdct/rprt/2018rfnryrprt/2018cndnrfnrvrvw-eng.pdf
Pembina Institute The oilsands in a carbon-constrained Canada | 112. The oilsands in context
2.1. Canada’s annual emissions by sector
Canada’s greenhouse gas (GHG) emissions17 — a total of 716 Mt CO2e in 2017 according
to the latest available data18 — are generated by several main economic sectors: oil and
gas, transportation, heavy industry and manufacturing, buildings, electricity,
agriculture and waste.
The oil and gas sector is responsible for more than a quarter of Canada’s total emissions
(195 Mt CO2e in 2017), primarily from burning natural gas to create heat for extracting
and processing oil, but also from producing on-site electricity to power operations; from
venting, flaring and fugitive emissions; and from fuels to run vehicles (Figure 3).
Waste &
Others Oilsands in situ
6% (22%)
Agriculture Oilsands
10% Oil and Gas Oilsands upgrading
mining (8%) (11%)
195 Mt
27%
Buildings
12% Other oil and gas activities*
Heavy Industry Electricity
10% 10% *includes:
Natural gas production and processing
Petroleum refining
Conventional light oil production
Transportation Conventional heavy oil production
24% Frontier oil production
Oil and gas transmission
Natural gas distribution
Figure 3. Breakdown of emissions associated with oil and gas extraction and
processing in Canada in 2017
Data source: Environment and Climate Change Canada (ECCC)19
Note: Other industries grouped with waste include coal production as well as light manufacturing, construction and
forest resources.
17
Greenhouse gas (GHG) emissions are usually measured in megatonnes (Mt) of carbon dioxide (CO ) equivalent (CO e).
2 2
One metric tonne is 1,000 kg; one megatonne (a million tonnes) is one billion kilograms of CO . Unless otherwise
2
specified in this report, GHG emissions, carbon emissions, carbon pollution and emissions are used interchangeably.
18
Environment and Climate Change Canada, 2019 National Inventory Report 1990–2017: Greenhouse Gas Sources and Sinks
in Canada, Part 3, Table A10-2. https://unfccc.int/documents/194925
19
Ibid.
Pembina Institute The oilsands in a carbon-constrained Canada | 12The oilsands in context
Within the oil and gas sector, the largest share of GHG emissions comes from the
extraction and processing of bitumen from the oilsands — a total of 81 Mt CO2e for
mining, in situ and upgrading.20 The oilsands, therefore, accounted for 11% of Canada’s
total emissions in 2017.
Accounting for electricity emissions
There are different ways to look at the oilsands’ GHG emissions. The approach used by
Environment and Climate Change Canada (ECCC), which are consistent with reporting
methods established by the United Nations Framework Convention on Climate Change,
accounts for direct emissions from the sector. These include emissions from electricity
generated at oilsands facilities (through a process called cogeneration) and exported to
the provincial grid.
Sometimes, however, cogenerated electricity is not included when calculating emissions.
In this case, overall oilsands production emissions will be slightly lower than those
reported by ECCC.
An alternate approach is to exclude emissions from electricity exported to the grid, while
including those emissions from electricity purchased to run the plant. This approach allows
for an even more precise assessment of emissions from actual oilsands operations.
Finally, certain analyses expand the scope and account for emissions associated with all
energy types (e.g. steam, hydrogen) entering or leaving the plant, or other indirect
emissions (e.g. production of natural gas and diluent used at the plant, emissions from land
use changes).
Studies using these various approaches are discussed further in Section 3.
20
Of those 81 Mt, approximately 78 Mt are associated with oilsands production occurring in Alberta, and approximately 3
Mt in Saskatchewan.
Pembina Institute The oilsands in a carbon-constrained Canada | 13The oilsands in context
2.2. Canada’s annual emissions by province
Emissions from Alberta alone account for more than a third (273 Mt CO2e) of Canada’s
total GHGs21 and those from Alberta’s oil and gas sector (19% of Canada’s overall
emissions) are the largest single source of emissions across Canada (Figure 4).
140
Oil and Gas
120 Electricity
Transportation
2017 Annual GHG emissions (Mt CO2e)
Heavy Industry
100
Buildings
Agriculture
80 Waste
60
40
20
0
NL PEI NS NB QC ON MB SK AB BC
Figure 4. Provincial GHG emissions by sector in 2017
Data source: ECCC22
21
2019 National Inventory Report, Part 3, Table A11–19.
22
Ibid., Tables 11–2 to 11–21.
Pembina Institute The oilsands in a carbon-constrained Canada | 14The oilsands in context
2.3. Our international commitments
In the last decade, Canada has signalled its intention to drastically reduce its carbon
pollution through a number of pledges and international commitments:
• Copenhagen Agreement (2009) — set a target of reducing GHGs by 17% by
2020 (to 606 Mt CO2e), from 2005 levels.
• Paris Agreement (2015) — committed to reducing emissions by 30% by 2030
from 2005 levels (to 511 Mt CO2e).
• Canada’s mid-century goals (2016) — a national strategy (Canada’s Mid-
Century Long-Term Low-Greenhouse Gas Development Strategy) to achieve an
80% emissions reduction (to 146 Mt CO2e) by 2050 from 2005 levels.23
• Carbon Neutrality Coalition (2018) — Canada joined this international group
of nations with intentions to become carbon-neutral.24 In Fall 2019, the current
federal government promised to meet this objective by 2050.
Historically, Canada has struggled to deliver on its reduction commitments. The 2020
Copenhagen emissions target is out of reach, and a recent report from Environment and
Climate Change Canada (ECCC) shows the country is not on track to achieve the 2030
emissions reduction target as per the Paris Agreement.25
Regardless, Canada continues to work toward further and further decarbonization, and
as it does, the Alberta oilsands’ increasing share of emissions becomes more prominent.
23
Government of Canada, Canada’s Mid-Century Long-Term Low-Greenhouse Gas Development Strategy (2016).
https://unfccc.int/files/focus/long-term_strategies/application/pdf/canadas_mid-century_long-term_strategy.pdf
24
“Carbon Neutrality Coalition.” https://www.carbon-neutrality.global
25
Environment and Climate Change Canada, Canada's fourth biennal report on climate change, 28.
https://unfccc.int/sites/default/files/resource/Canada%E2%80%99s%20Fourth%20Biennial%20Report%20on%20Climate
%20Change%202019.pdf
Pembina Institute The oilsands in a carbon-constrained Canada | 15The oilsands in context
2.4. Projecting oilsands emissions
The oilsands have historically been the fastest growing source of carbon emissions in
Canada — and are expected to remain so in the near future.
While emissions from the entire oil and gas sector — including oilsands — increased by
23% between 2005 and 2017, those from the oilsands alone have more than doubled and
are projected to keep growing at a similar pace through to 2030 (Figure 5).26
250%
200% Oilsands
150%
Growth in emissions
100%
50%
Other industry
0% Transport
Buildings
Oil and gas
-50%
Electricity
2005 2010 2015 2020 2025 2030
Figure 5. Historic and projected emissions growth by Canadian economic sectors
Data source: ECCC27
Note: "Oil and gas" represents the emissions of the sector excluding that of the oilsands, which are represented
separately, while "Other industry" includes heavy industry, agriculture, waste and others. This chart represents the
annual growth rate in emissions of Canada’s economic sectors relative to the year 2005, the reference year for Canada’s
climate commitments. Annual growth rate should not be confused with absolute emissions.
Based on the federal government’s projections,28 as of 2030, absolute emissions from
the oilsands would account for 110 Mt CO2e, or 22% of Canada’s total climate target
(511 Mt CO2e) (Figure 6).
26
Environment and Climate Change Canada, Canada's GHG and Air Pollutant Emissions Projections 2018, 18.
https://www.canada.ca/en/environment-climate-change/services/climate-change/greenhouse-gas-
emissions/projections-2018.html
27
Canada's GHG and Air Pollutant Emissions Projections 2018.
28
Canada's fourth biennal report on climate change, 118.
Pembina Institute The oilsands in a carbon-constrained Canada | 16The oilsands in context
800
Projected emissions
716 Mt to targets
600 2030
target
GHG emissions (Mt CO2e)
511 Mt
Current
400 total emissions
200
Oilsands
emissions 81 Mt
110 Mt
?
11% of total
emissions 22% 2050
0 target
2017 2030 2050
Figure 6. Share of the oilsands emissions in national carbon budget to meet
Canada’s 2030 target
Data source: ECCC29
Note: Canada’s overall emissions between 2017 and 2030 are estimated based on the annual emissions reductions
required to meet the 2030 emissions target. ECCC indicates that oilsands will emit 110 Mt in 2030, which includes
approximately 100 Mt of emissions under Alberta’s oilsands emissions limit, plus emissions exempt from the limit as
discussed in the following section (Oilsands emissions limit).
While there are no governmental projections for Canada’s emissions past 2030,
delivering our 2050 commitment requires the absolute emissions of Alberta’s oilsands
to peak and begin to decline on a pathway toward becoming carbon-neutral — if not
carbon-negative — well before 2050.
Oilsands emissions limit
In 2016, the Government of Alberta passed the Oil Sands Emissions Limit Act, which
establishes a firm limit for oilsands emissions.30 It caps emissions associated with
oilsands extraction and upgrading at 100 Mt CO2e per year, with an additional 10 Mt
CO2e provision for newly built upgraders.
29
Canada's fourth biennal report on climate change.
30
Government of Alberta, Oil Sands Emissions Limit Act, R.S. 2016, c. O-7.5.
http://www.qp.alberta.ca/documents/Acts/O07p5.pdf
Pembina Institute The oilsands in a carbon-constrained Canada | 17The oilsands in context
By putting a hard limit on the carbon emissions — rather than production — of the
oilsands, the act aims to encourage innovation in technologies that can drastically cut
the oilsands’ emissions intensity, allowing the sector to increase production if
emissions stay under the limit. Relevant regulations, as prescribed by the act, had not
been created as of February 2020, meaning the limit could not yet be enforced were the
industry to approach or surpass the 100 Mt limit.31
The act specifically exempts certain types of oil production and activities from the
oilsands emissions limit. Such exemptions include emissions from cogeneration, from
primary oil production, and from oil produced through enhanced recovery techniques
and experimental schemes. In addition, because the act is a provincial regulation of
Alberta, it does not apply to oilsands activities occurring in Saskatchewan. For those
reasons, of the 94 Mt oilsands emissions estimated by the federal government in 2020,
approximately 82 Mt would be subject to the 100 Mt limit (Table 2).
Table 2. Projected oilsands emissions in 202032
Metric 2020
Total oilsands emissions (Mt) 94.5
Emissions included in the oilsands limit (Mt) 84.2
Total emissions exempt from the oilsands limit (Mt) 10.3
Cogeneration
4.4
Primary production
2.3
Saskatchewan’s production
2.6
New upgrading capacity (up to 10 Mt)
1.0
Source: ECCC 33, 34, 35
Note: Emissions from Saskatchewan’s oilsands production are estimates using 2017 data.
As of December 2019, the Alberta Energy Regulator (AER) has approved projects with
cumulative emissions totalling 147 Mt CO2e, presuming all projects proceed using
existing production techniques. This figure rises to 173 Mt CO2e when including
projects currently seeking approval by the Alberta Energy Regulator.36
31
As of February 2020, relevant regulations as per Section 3 of the act have not yet been defined.
32
This table was updated with new data obtained from ECCC in the March 2020 version of this report.
33
Canada's fourth biennal report on climate change, 118.
34
2019 National Inventory Report.
35
A detailed breakdown of projected oilsands emissions in 2020 was obtained from ECCC.
36
Methodology notes for this analysis are available in Appendix B.
Pembina Institute The oilsands in a carbon-constrained Canada | 18The oilsands in context
Given that the legislation was never implemented through regulation, and Canada's
climate targets call for decarbonization of the oilsands industry, the conversation needs
to move beyond a ceiling for emissions of 100 Mt.
2.5. Projecting global oil demand
While demand for oil has increased at a fast pace over the past decades, this trend is
likely to change in the next decade. A number of projections developed over the past
couple of years anticipate that demand for oil will plateau or start declining in the next
five to 15 years (Figure 7).37
120 IEA 2019,
IEA 2019,
current policies stated policies McKinsey 2018,
reference
100 BP 2019,
reference
IEA 2019, BP 2019,
Global oil demand (MMbbl/d)
80 sustainable rapid transition
60
BP, Statistical Review McKinsey 2018,
of World Energy accelerated transition
40
20
0
1970 1980 1990 2000 2010 2020 2030 2040 2050
Figure 7. Comparison of oil demand scenarios from the IEA, BP and McKinsey
Data sources: IEA,38 BP,39,40 McKinsey41
37
Such projections should not be considered as forecasts. Rather, as noted in the 2019 IEA Energy Outlook, they are
scenarios aimed at "exploring various possible futures, the ways that they come about, the consequences of different
choices and some of the key uncertainties."
38
International Energy Agency, “World Energy Outlook 2019.” https://www.iea.org/weo2019/
39
BP, “Statistical Review of World Energy.” https://www.bp.com/en/global/corporate/energy-economics/statistical-
review-of-world-energy.html
40
BP, “BP Energy Outlook.” https://www.bp.com/en/global/corporate/energy-economics/energy-outlook.html
41
McKinsey & Company, “Global Energy Perspective: Accelerated Transition,” Energy Insights.
https://www.mckinsey.com/industries/oil-and-gas/how-we-help-clients/energy-insights/global-energy-perspective-
accelerated-transition
Pembina Institute The oilsands in a carbon-constrained Canada | 19The oilsands in context
One notable exception is the 2019 outlook of the International Energy Agency (IEA),
whose “Current Policy Scenario” predicts oil demand will keep increasing at the same
pace as over the last decade. However, not only is this scenario not the central scenario
in the IEA outlook, it would result in 4.1–4.8°C of global warming by the end of the
century,42 more than double the global warming limits explored in a 2019 report by the
Intergovernmental Panel on Climate Change (IPCC).43
When accounting for forces that are contributing to reduced oil demand — for example,
electrification of transport (e.g. electric vehicles), reduced plastics demand (e.g. ban on
single-use plastics), efficiency gains and low-carbon fuels for aviation and marine
sectors — the same sources predict oil demand growth will slow down and nearly
plateau within five years.
This trend is further exacerbated when intentional action to protect the climate and
environment is factored in. Of those scenarios, the “Stated Policies Scenario” — the
IEA’s new reference scenario reflecting the impact of existing and announced policies —
represents the current trajectory and shows oil demand nearly plateauing in the 2030s,
while limiting global warming to 2.7–3.2°C. In contrast, BP, McKinsey and IEA’s
transition scenarios project a rapid decline in oil demand starting in the early 2020s.
IEA’s “Sustainable Development Scenario” — the most ambitious of those scenarios —
would allow for keeping global warming below 1.65°C.
Regardless of when the curve starts to bend, as demand for oil changes, factors like
emissions intensity, driven by both investors and climate realities, will play an
increasingly important role.
42
Climate Action Tracker, “Temperatures.” https://climateactiontracker.org/global/temperatures/
43
Intergovernmental Panel on Climate Change, “Global Warming of 1.5 ºC.”
Pembina Institute The oilsands in a carbon-constrained Canada | 203. Emissions intensity of oilsands
Emissions intensity is a metric being used widely to demonstrate the recent climate
improvements of oilsands production. Carbon intensity measures the amount of GHGs
emitted throughout a portion or all of the oil supply chain to produce either a given
volume of crude oil or a given amount of energy from the oil product.44 The emissions
intensity is a useful metric for establishing and comparing the climate impacts of various
crude oils. It should, however, not be confused with absolute emissions, which refers to
the overall quantity of carbon actually emitted in the atmosphere.
3.1. Measuring emissions intensity
The carbon intensity of crude oils can be analyzed across different portions of the oil
production process (Figure 8). While life cycle assessments (LCA) technically include the
full process from land use through to combustion, analyses are often done for only
portions of the chain.
LAND USE CHANGES CONSTRUCTION EXTRACTION UPGRADING CRUDE TRANSPORTATION REFINING FUEL TRANSPORTATION DISTRIBUTION COMBUSTION
WELL-TO-REFINERY ENTRANCE GATE
WELL-TO-TANK 20-30% OF 70-80% OF
GHG EMISSIONS GHG EMISSIONS
WELL-TO-WHEEL
Figure 8. Scopes of life cycle GHG emissions from transportation fuels
Note: Some life cycle assessments do not include emissions associated with land use changes and construction,
although its inclusion is deemed best practice. Also, as noted earlier in this report, not all bitumen is upgraded.
Well-to-refinery-gate (or upstream) life cycle analysis estimates emissions from
extraction and processing only — including diluting and/or upgrading as well as
transportation to the refinery — but doesn’t include refining. The well-to-tank analysis
assesses emissions from extraction through to the delivery of a transportation fuel to the
tank of a vehicle, but doesn’t include the emissions associated with burning that fuel.
Finally, a well-to-wheel life cycle analysis accounts for all associated emissions, including
44
Carbon intensity can be measured in kilograms of carbon dioxide equivalent per barrel of crude oil (kg CO2e /barrel), or
in grams of CO2e per megajoule (g/MJ). One barrel of oil has, on average, the energy equivalent of 6,193 megajoules. The
carbon intensity includes non-CO2 greenhouse gas emissions, like methane, which are converted into CO2 equivalent
using a global warming potential established by the International Panel on Climate Change.
Pembina Institute The oilsands in a carbon-constrained Canada | 21Emissions intensity of oilsands fuel combustion in a vehicle’s engine, and represents the most common and the best way to compare the emissions intensity of various crudes on an apple-to-apple basis. As a rule of thumb, about 20–30% of emissions occur during the well-to-tank portion, with the remaining 70–80% of GHGs emitted from the combustion of fuels in vehicle engines. 3.2. Oilsands emissions intensity Oilsands products are more carbon-intensive than most other sources of oil, because of the greater energy requirements to extract and process bitumen. From powering heavy equipment for open-pit mining to generating huge amounts of steam for in situ operations to additional processing at the upgrading or refinery stage, the general result is more GHGs emitted than for most conventional crudes. Note that while other unconventional crudes (e.g. tight oil) are often associated with significant levels of methane emissions (e.g. vented, fugitives), that is not the case with the oilsands, whose emissions primarily come from fuel combustion. Emissions intensity ranges Variations in techniques employed to extract and process bitumen, combined with differing resource quality and characteristics, lead to a wide range of emissions intensities that are specific to each situation. There is a threefold range between the best and the worst performer, which is crucial context that is often missed when looking at the oilsands sector’s average emissions intensity (Figure 9). Historical trend A 2018 study conducted by IHS Markit shows emissions intensity of the average barrel of oilsands has dropped by 21% between 2009 and 2017.45 A caveat, which is indeed the starting point of the IHS Markit study,46 is that this “average barrel” comprises products with significantly different qualities — that is, a theoretical blend of diluted bitumen and synthetic crude oil — whose proportions vary over time. As a result, this decreasing average reflects both actual improvements in emissions intensity and the ramp-up of less carbon-intensive operations into the mix. 45 IHS Markit, Greenhouse gas intensity of oil sands production (2018), 4. Available at https://ihsmarkit.com/forms/contactinformation.html 46 The variability in emissions intensity and how unrepresentative the average can be is a central finding of this IHS Markit report, which investigates the past and upcoming emissions intensities of various oilsands technologies. Pembina Institute The oilsands in a carbon-constrained Canada | 22
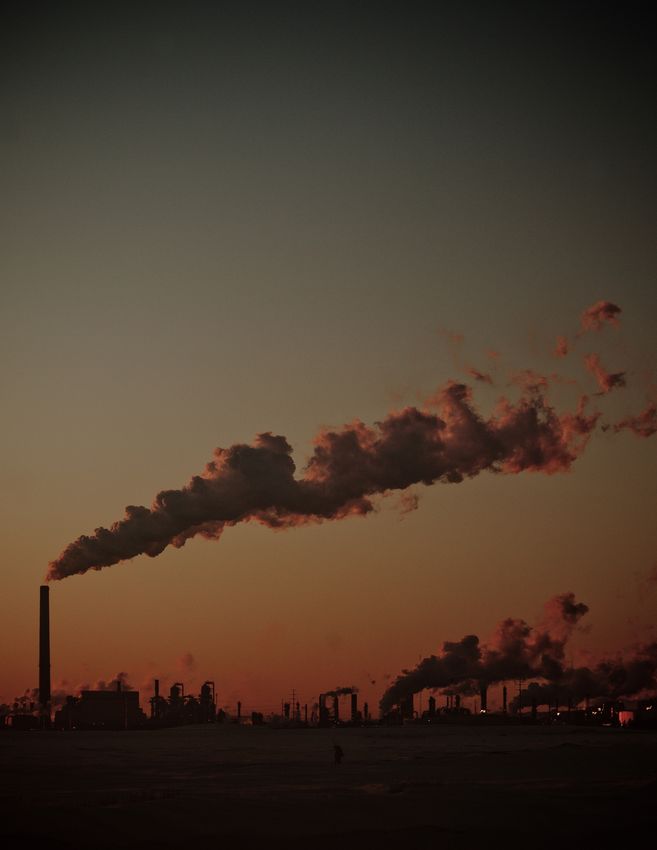
Emissions intensity of oilsands

     Average and full range of oil sands GHG emission intensity by year, 2010–30 (kgCO2e/bbl of marketed
     product)
                                      140
                                                                                 Outlook

                                      120
     kgCO2e/bbl of marketed product

                                                                                                                                                                             Mined SCO
                                                                                                                                                                               range
                                      100

                                      80
                                                                                                 Weighted average*

                                      60       21% reduction, 2009–17**

                                                                                                                                                                                   SAGD dilbit
                                                                                           16–23% reduction, 2017–30

                                                                                                                                                                                     range
                                      40

                                                                                                           Mined PFT (dilbit) range
                                      20
                                        2010 2011 2012 2013 2014 2015 2016 2017 2018 2019 2020 2021 2022 2023 2024 2025 2026 2027 2028 2029 2030

                                        Range of SAGD dilbit                                                 Range of mined dilbit (PFT) and SAGD dilbit (overlap)
                                        Range of mined SCO and SAGD dilbit (overlap)                         Range of mined SCO
     *Estimate of total oil sands average includes oil sands CSS dilbit, SAGD dilbit, mined SCO, mined dilbit, primary, experimental, and EOR. Historical estimates for CSS were included
     with no intensity improvement after 2017. Estimates for primary were taken from a prior IHS Markit report (cited at the end of this note) with the same values being applied to
     experimental and EOR. Primary, experimental, and EOR accounted for about 7% of oil sands production in 2017 (18% including CSS), declining to 5% by 2030 (11% including CSS).
     Ranges shown for mined dilbit (PFT), SAGD dilbit, and mined SCO range from lower-bound minimum to upper-bound maximum. Note that prior to 2018, there was only one operating
     mined dilbit (PFT) facility and thus no range. Source of prior estimates IHS Markit Strategic Report IHS Oil Sands Dialogue: Comparing GHG Intensity of the Oil Sands and the Average
     US Crude Oil, www.ihsmarkit.com/oilsandsdialogue.
     **Note that 2009 is not shown in this figure but is in Appendix A.
     Source: IHS Markit                                                                                                                                                     © 2018 IHS Markit

Figure 9. Range of upstream GHG intensity of oilsands marketed product
Source: Replicated with permission from IHS Markit47
Note: Oilsands products from mining and in situ operations have upstream carbon intensities that respectively varied by
a factor of 1.5 to 2 in 2017 — a threefold range when considering the sector as a whole. This wide range is mainly due to
the technologies employed, resource quality and operational details. Mined dilbit, produced through paraffinic froth
treatment technology, has a significantly lower emissions intensity than SCO, although the difference in quality should
also be noted as mined dilbit generates more emissions at the refining stage.

The oilsands industry did make some significant improvements in emissions intensity
between 1990 and the early 2000s, by moving to cogeneration, less carbon-intensive
fuels, and generally improving and refining the new steam-assisted gravity drainage
(SAGD) production technique.

Improvements in carbon intensity have also continued over the past decade. When
looking at the upstream emissions intensity, that of diluted bitumen produced through
SAGD has decreased by 4% between 2009 and 2017.48 Larger gains were made in

47
      Greenhouse gas intensity of oil sands production, page 32.
48
  The systems boundaries used by the IHS Markit study only include emissions associated with oilsands production, and
exclude those from transporting oilsands products to the refinery. Also, those findings are greatly influenced by the
boundary conditions, that is, the emissions included in the analysis. In addition to direct emissions, the IHS Markit study
includes those from upstream production of fuel (e.g. natural gas, diluent) as well as the import and export of electricity
that can be associated with cogeneration. Using different boundary conditions (for example only looking at direct
emissions) can lead to differing results.

Pembina Institute                                                                                        The oilsands in a carbon-constrained Canada | 23
Emissions intensity of oilsands
upgrading and mining, through better integration and increased waste heat recovery,
allowing for a 21% decrease in per-barrel emissions for SCO over the same period. In
mining, the introduction of a new processing technology — paraffinic froth treatment
(PFT) — has paved the way for shipping diluted mined bitumen without the need for
emissions intensive upgrading.49 Today, diluted bitumen produced at the best-in-class
oilsands facilities — in particular the Suncor Fort Hills mine using PFT and Cenovus
Christina Lake using SAGD — has emissions intensities on par with that of the average
barrel of crude oil refined in North America in 2012.50,51,52
Looking forward
In 2018, an IHS Markit report projected the upstream emissions intensity trends
through 2030 for a variety of marketable oilsands products. The outlook does not claim
to model any policy pathway, but rather uses a bottom-up approach “to capture the
impact of a reasonable pace of deployment of commercial and near-commercial
technologies and potential efficiency improvements on the GHG intensity of
production.”53 This technology deployment happens in response to increasingly
stronger investor pressure, as well as climate policies such as those that were in place at
the time of that report’s release — including an intensity-based carbon pricing system
that created a level playing field for industrial emitters, a 100 Mt cap on oilsands
emissions, and a national carbon tax. Under those conditions, the IHS Markit outlook
predicts the average emissions intensity of the sector would drop by 16 to 23% range by
2030 below 2017 levels (Figure 9).
Within the mining industry, the report notes that fuel switching, cogeneration
expansion and changes in fleet operations should allow for a reduction in emissions
intensity of 6–10% for synthetic crude oil by 2030, with a 15–24% decrease for mined
dilbit over the same period. When factoring in the ramp-up of mined dilbit, the
weighted average emissions intensity of mining could decrease by 15–20% between
2017 and 2030 (Figure 10).
49
Greenhouse gas intensity of oil sands production.
50
Suncor, Climate risk and resilience report, 2019, 10. https://sustainability-prd-cdn.suncor.com/-
/media/project/ros/shared/documents/climate-reports/2019-climate-risk-and-resilience-report-en.pdf
51
Cenovus, 2019 Investor Day, 2019, 44.
https://www.cenovus.com/invest/docs/2019/2019%20Investor%20Day%20Presentation.pdf
52
This is true for Cenovus on a well-to-refinery-gate basis, and for Suncor on a well-to-wheel basis. Section 4.3
elaborates the Pembina Institute’s view regarding the 2012 baseline.
53
Greenhouse gas intensity of oil sands production, page 19.
Pembina Institute The oilsands in a carbon-constrained Canada | 24You can also read