Carbon Consumption Patterns of Emerging Middle Classes - Babette Never Jose Ramon Albert Hanna Fuhrmann Sebastian Gsell Miguel Jaramillo Sascha ...
←
→
Page content transcription
If your browser does not render page correctly, please read the page content below

Discussion Paper    13/2020

Carbon Consumption Patterns
of Emerging Middle Classes

Babette Never
Jose Ramon Albert
Hanna Fuhrmann
Sebastian Gsell
Miguel Jaramillo
Sascha Kuhn
Bernardin Senadza
Carbon consumption patterns of emerging middle
classes

Babette Never
Jose Ramon Albert
Hanna Fuhrmann
Sebastian Gsell
Miguel Jaramillo
Sascha Kuhn
Bernardin Senadza

                  Bonn 2020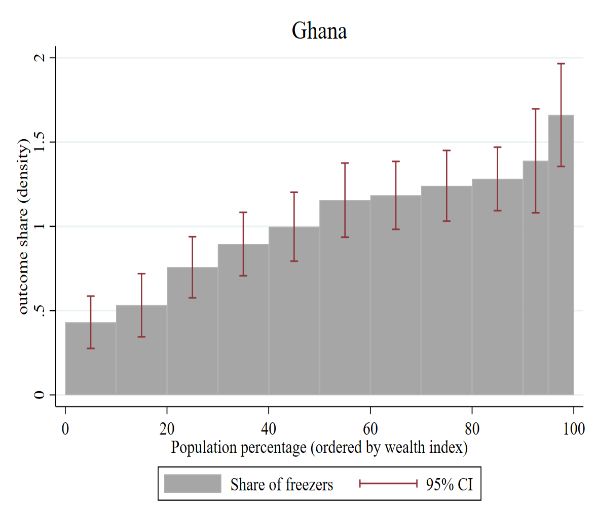
Discussion Paper / Deutsches Institut für Entwicklungspolitik ISSN (Print) 1860-0441 ISSN (Online) 2512-8698 Except as otherwise noted this publication is licensed under Creative Commons Attribution (CC BY 4.0). You are free to copy, communicate and adapt this work, as long as you attribute the German Development Institute / Deutsches Institut für Entwicklungspolitik (DIE) and the authors. Die Deutsche Nationalbibliothek verzeichnet diese Publikation in der Deutschen Nationalbibliografie; detaillierte bibliografische Daten sind im Internet über http://dnb.d-nb.de abrufbar. The Deutsche Nationalbibliothek lists this publication in the Deutsche Nationalbibliografie; detailed bibliographic data is available in the Internet at http://dnb.d-nb.de. ISBN 978-3-96021-124-2 (printed edition) DOI:10.23661/dp13.2020 Printed on eco-friendly, certified paper Dr Babette Never is a senior researcher with the research programme “Transformation of Economic and Social Systems” at the German Development Institute / Deutsches Institut für Entwicklungspolitik (DIE). Email: babette.never@die-gdi.de Published with financial support from the Federal Ministry of Education and Research (BMBF) © Deutsches Institut für Entwicklungspolitik gGmbH Tulpenfeld 6, 53113 Bonn +49 (0)228 94927-0 +49 (0)228 94927-130 Email: die@die-gdi.de http://www.die-gdi.de
Abstract

As households move out of poverty, spending patterns change. This is good news from a
development perspective, but changing consumer behaviour may imply substantially more
carbon emissions. The lifestyle choices of the emerging middle classes are key, now and in the
future. This paper explores the consumption patterns of the emerging middle classes and their
carbon intensity, using unique micro data from household surveys conducted in Ghana, Peru
and the Philippines. We find that carbon-intensive consumption increases with wealth in all
three countries, and most sharply from the fourth to the fifth middle-class quintile due to
changes in travel behaviour, asset ownership and use. In Peru, this shift in the upper-middle-
class quintiles translates to annual incomes of roughly USD 11,000-17,000 purchasing power
parity. Environmental knowledge and concern are fairly evenly spread at mid- to high levels
and do lead to more easy-entry sustainable behaviours, but they do not decrease the level of
carbon emissions. To some extent, a knowledge/concern–action gap exists. In our study, social
status matters less than the literature claims. Our results have two implications. First, the
differentiations between developing/developed countries in the global climate debate may be
outdated: It is about being part of the global middle classes or not. Second, a positive spillover
from existing easy-entry sustainable behaviours to a change in carbon-intensive consumption
patterns needs policy support.
Acknowledgements

We are grateful for the support of our colleagues and research assistants during the collection,
preparation and analysis of our data. In Ghana, the support and advice of Prof. Felix Asante,
former director of the Institute of Statistical, Social and Economic Research, has been
invaluable. We would like to especially thank Daniele Malerba for his help with the Peru survey
and for sharing his carbon footprint calculations. Finally, we would like to express our gratitude
to the German Federal Ministry of Education and Research (BMBF) for providing the financial
resources for our work.

Bonn, March 2020                                                                 Babette Never
Contents

Abstract
Acknowledgements
Abbreviations
1           Introduction                                                                         1
2           Carbon emissions and consumption trends                                              2
3           Drivers of consumer behaviour: Literature review and hypotheses                      6
4           Methods                                                                              8
4.1         Definition of middle class and sampling                                              8
4.2         Measurement of independent variables                                                 9
4.3         Measurement of dependent variables                                                  10
5           Results: How carbon-intensive are middle-class consumption patterns?                12
5.1         Ghana                                                                               12
5.2         Peru                                                                                16
5.3         Philippines                                                                         22
6           Comparative discussion                                                              26
7           Conclusion and policy implications                                                  33
References                                                                                      35
Appendices                                                                                      39
Appendix A. Middle-class screening questions (example Philippines)                              39
Appendix B. Measurement scales for the independent variables                                    41

Figures
Figure 1:       CO 2 per capita and household consumption per capita in Ghana,
                Peru and the Philippines (1990-2014)                                             3
Figure 2:       Total CO 2 emissions in Ghana, Peru and the Philippines (1990-2014),
                metric kilotons of CO 2                                                          4
Figure 3:          CO 2 footprint of Peru by sector, metric tons of CO 2 per capita, Peruvian
                   emissions (2015)                                                              4
Figure 4:       Mean per capita CO 2 emissions of expenditure groups in the Philippines
                (2006), in metric tons                                                           5
Figure 5:       Distribution of middle-class sample in Accra based on wealth index              13
Figure 6:       Distribution of middle-class sample in Lima based on wealth index               17
Figure 7:       Middle-class wealth and energy spending in Lima                                 19
Figure 8: Distribution of wealth across middle-class sample in Manila 22
Figure 9: Energy spending and wealth in Manila 24
Figure 10: Appliance ownership in Ghana, Peru and the Philippines in comparison 27
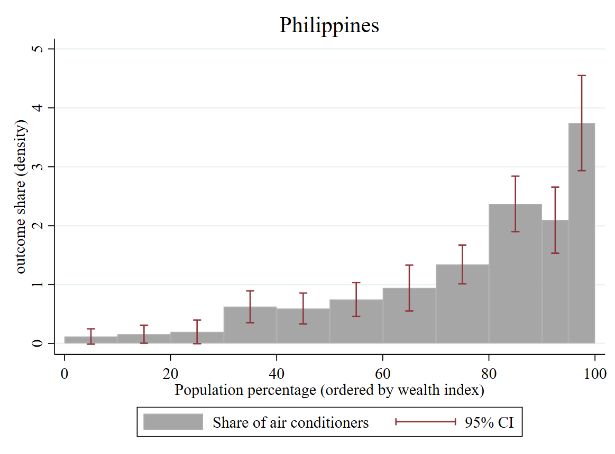
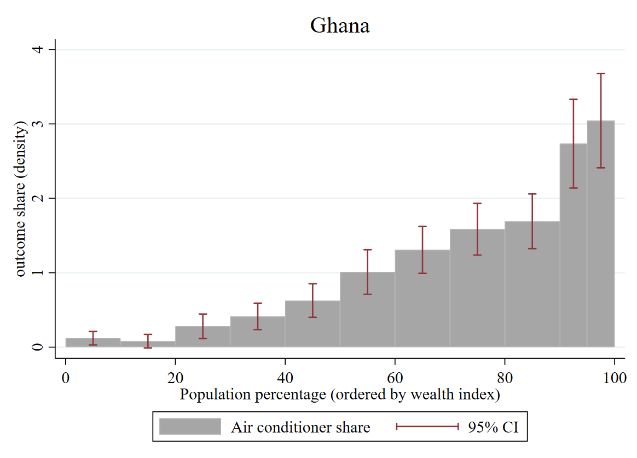
Figure 11: Share of air conditioners owned in the sampled households, ordered by
wealth 29
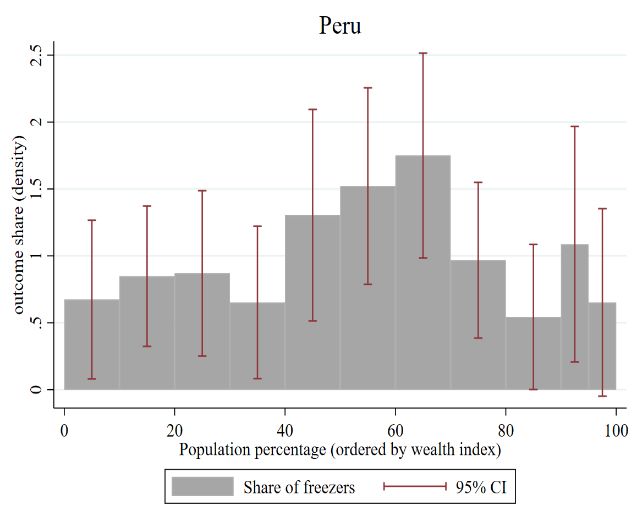
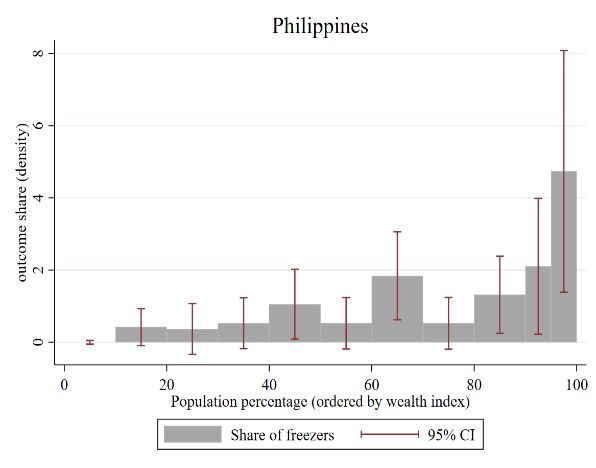
Figure 12: Share of freezers owned in the sampled households, ordered by wealth 29
Figure 13: Share of cars owned by sampled households, ordered by wealth 30
Figure 14: Share of air travel in the past 12 months by wealth quintile 31
Tables
Table 1: Summary statistics middle-class sample in Accra 13
Table 2: Regression results (log of) energy spending and wealth in Accra 14
Table 3: Regression results sustainable behaviour index in Accra 16
Table 4: Summary statistics middle-class households, Lima 18
Table 5: Regression results drivers of (the log of) energy spending, Lima 18
Table 6: Regression results transport CO 2 score, Lima 20
Table 7: Wealth and status orientation among Lima’s middle classes 21
Table 8: Regression results for sustainable behaviour, Lima 21
Table 9: Summary statistics middle-class sample, Manila 23
Table 10: Regression results, drivers of the (log of) energy spending in Manila 23
Table 11: Transport score regressions, Manila 25
Table 12: Regression results, sustainable behaviour 26
Figures Appendix
Figure A1: Cross-check of our data with ENAHO data: Distribution of predicted
welfare (consumption) and predicted income 42
Tables Appendix
Table A1: Philippines’ emission factors for the calculation of the transport score 42
Table A2: Peru – cross-check of our data validity with ENAHO 2017 data 42Abbreviations BIC Bayesian information criterion CO 2 carbon dioxide Dfres residual degrees of freedom ENAHO Encuesta Nacional de Hogares g grams HH household km kilometres kwh kilowatt hours Obs. observations OLS ordinary least squares PCA principal component analysis PPP purchasing power parity R-sqr R-squared Std. dev. standard deviation USD US dollar
Carbon consumption patterns of emerging middle classes

1       Introduction

As households move out of poverty, spending patterns change. This is good news from a
development perspective, as more purchasing power implies diversified investments and
improved livelihood conditions. But it can be bad news from an environmental perspective,
as more consumption and changing consumer behaviour may imply more carbon emissions.

The emerging middle classes have choices about what and how they consume. Their
lifestyle preferences will determine whether developing countries mirror the unsustainable
development paths of industrialised nations. Being part of the global middle classes or not
may be more important from a global perspective than being from a developing or
industrialised country. In September 2018, the number of global middle-class and rich
individuals equalled the number of poor and vulnerable people for the first time in history:
3.8 billion 1 each, according to Kharas and Hamel (2018). Prospectively, the emerging
middle classes will add at least another billion consumers by 2030 (Kharas & Hamel, 2018).
It is empirically not sufficiently clear what carbon-related consumption patterns and
lifestyles of these middle classes look like and which factors drive them.

This discussion paper aims to help close this research gap by shedding light on the lifestyle
choices of the emerging middle classes in three middle-income countries. We establish and
explain carbon consumption patterns 2 with micro data from middle-class household surveys
in Ghana, Peru and the Philippines. First, we identify the consumption segments and
consumer behaviours that have the most impact on carbon emissions. Our household
surveys include questions on both final consumption expenditures and user behaviours, such
as switching off appliances, as we understand consumption patterns to include both
dimensions. Second, we explore what drives these carbon consumption patterns, focussing
on wealth, status, environmental concern and environmental knowledge. Third, we zoom
into the broad wealth brackets that capture the heterogeneous middle classes to identify
potential turning points in consumption and emission trends.

Exploring the acquisitive and the behavioural dimensions of carbon consumption patterns
has advantages compared to existing research. Previous studies on household carbon
emissions in developing countries have primarily used macro data with input–output tables
(Irfany & Klasen, 2017; Renner, 2016; Sanches-Pereira, Tudeschini, & Coelho, 2016;
Serino & Klasen, 2015; Wiedenhofer, Guan, Liu, Meng, Zhang, & Wei, 2016; Zhang, Yu,
Cai, & Wie, 2017). Empirical analyses have hardly differentiated between specific
behaviours (e.g. switching off appliances when not in use) and overall carbon consumption.

Yet, psychological research has shown that this distinction is crucial in order to change
carbon consumption patterns (Kollmuss & Agyeman, 2002). Incrementally introducing
easy-entry, low-cost behaviours, such as switching off the lights, can be a gateway for long-
term behavioural change and for more difficult, costlier behaviours, such as abstaining from
driving a private car (Freedman & Fraser, 1966; Lanzini & Thøgersen, 2014; Souchet &

1   Kharas and Hamel define middle classes as having income of USD 11-110 purchasing power parity (PPP)
    per capita per day.
2   By carbon consumption, we mean the emissions embodied in the consumption of goods and services.
    “Carbon consumption” has become an accepted abbreviated term in the literature. We use both “carbon-
    intensity of consumption” and “carbon consumption” throughout the paper, depending on the ease of
    reading of the respective sentence.

German Development Institute / Deutsches Institut für Entwicklungspolitik (DIE)                       1
Babette Never et al. Girandola, 2013). Empirical analyses on the existence of such differences between minor and major low-carbon consumption patterns are lacking. We explore whether these differences exist in Ghana, Peru and the Philippines by measuring our dependent variable carbon consumption patterns via acquisitions and expenditures as well as easy-entry, low- cost behaviours. Ghana, Peru and the Philippines are interesting to analyse and compare precisely because they are not the largest carbon-emitting countries in their respective world regions, but they are catching up quickly. They have experienced steady economic growth, a decline in poverty and rapid urban development (Burchi, Malerba, Rippin, & Montenegro, 2019; Datt, 2017). Furthermore, the urban centres in all three countries currently face similar challenges: increasing traffic and air pollution, a high and rising demand for electricity and ubiquitous plastic waste. The growing middle classes in these cities affect these dynamics through their consumption patterns and lifestyles, which we expect to differ to some extent between the three countries. We use an empirical definition of middle classes that combines an asset-based approach with information on household expenditures. The extensive debate in economics (e.g. Birdsall, Lustig, & Meyer, 2014; Kharas, 2017; Lopez-Calva & Ortiz-Juarez, 2014; Ravallion, 2009; Schotte, Zizzamia, & Leibbrandt, 2018; Shimeles & Ncube, 2015), sociology (Neubert & Stoll, 2015; Southall, 2016) and other social sciences (Spronk, 2012) on what it means to be middle class has not led to a clear gold standard definition yet. Our definition has the advantage of being multi-dimensional, pragmatic and based on previous consumer segmentation surveys from marketing research agencies in Ghana, Peru and the Philippines. The remainder of this discussion paper is structured as follows. Section 2 presents an overview of carbon consumption trends in Ghana, Peru and the Philippines, setting the stage. Section 3 summarises theoretical explanations for household carbon consumption and derives hypotheses for the empirical exploration of our data. Section 4 presents the methods employed in this paper, including a description of household sampling and variables construction. In the following sections, we present and discuss regression results for Ghana (Section 5.1), Peru (5.2) and the Philippines (5.3), completed by a comparison of key results across the three countries (Section 6). In the concluding section, we put our results into perspective with existing research and derive implications for policy. 2 Carbon emissions and consumption trends Direct and indirect household carbon emissions together account for 72 per cent of global greenhouse gas emissions (Edgar, Hertwich, & Peters, 2009). The relation between household consumption and carbon emissions tends to be similar to the relation between gross domestic product and country-wide carbon emissions (Jakob et al., 2014). Although overall per capita carbon emissions in developing countries are usually significantly lower than in industrialised countries, they may still vary substantially within developing countries. An analysis of different wealth groups within these countries can therefore provide illuminating insights. In China, for example, the consumption of urban middle-class and rich households was responsible for 75 per cent of the rise in total household carbon emissions (19 per cent) in the period 2007 to 2012 (Wiedenhofer et al., 2016). An Indonesian household with a similar living standard to a European household also has the 2 German Development Institute / Deutsches Institut für Entwicklungspolitik (DIE)
Carbon consumption patterns of emerging middle classes

same carbon footprint (Jakob et al., 2014). It is possible that the global middle classes now
affect climate change, challenging the developed/developing country distinction usually
made in climate change debates. In our paper, an overview of overall carbon consumption
trends, the identification of the most carbon-intensive consumption segments and current
expenditures in these segments present first steps for the analysis of middle-class carbon
consumption patterns in Ghana, Peru and the Philippines.

In all three countries, both carbon emissions (total and per capita) and household
consumption have been increasing, especially since around 2005 (Figures 1 and 2). Carbon
dioxide (CO 2 ) emission levels are still low compared to industrialised countries, but an
upward trend is particularly visible for Peru and the Philippines. The differences between
the countries most likely come about due to different economic development pathways
(growth of gross domestic product) and different population sizes. The Philippines have a
population of ca. 105 million people, Peru has 32 million inhabitants and Ghana has 29
million inhabitants.

 Figure 1:      CO 2 per capita and household consumption per capita in Ghana, Peru and the
                Philippines (1990-2014)

 Note: X-axis log of final household consumption including expenditures of non-profit organisations on households;
 y-axis CO 2 per capita in metric tons. Ghana: 2006-2014 only, no data for 1990 to 2006.
 Source: World Bank and CDIAC (2014); all rights reserved, used with permission

German Development Institute / Deutsches Institut für Entwicklungspolitik (DIE)                                  3
Babette Never et al.
Figure 2: Total CO 2 emissions in Ghana, Peru and the Philippines (1990-2014), metric kilotons
of CO 2
120,000,000
100,000,000
80,000,000
60,000,000
40,000,000
20,000,000
0,000
1990
1991
1992
1993
1994
1995
1996
1997
1998
1999
2000
2001
2002
2003
2004
2005
2006
2007
2008
2009
2010
2011
2012
2013
2014
Ghana Peru Philippines
Source: World Bank and CDIAC (2014); all rights reserved, used with permission
We now turn to the most carbon-intensive consumption segments and carbon footprint data,
where available. Unfortunately, no household carbon footprint exists for either of the three
countries. Electricity, fuel/gas and transport present the most carbon-intensive consumption
segments in Peru and the Philippines (Figures 3 and 4). The data for Peru here is based on
production, not household consumption, but the pattern is very likely to be similar. For
Ghana, no carbon footprint data exists. The subsequent question then is how much
households currently spend on these main carbon-intensive segments.
Figure 3: CO 2 footprint of Peru by sector, metric tons of CO 2 per capita, Peruvian
emissions (2015)
Source: Calculations by Daniele Malerba, based on GTAP data base (Global Trade Analysis Project, s.a.);
all rights reserved, used with permission
4 German Development Institute / Deutsches Institut für Entwicklungspolitik (DIE)Carbon consumption patterns of emerging middle classes
Figure 4: Mean per capita CO 2 emissions of expenditure groups in the Philippines (2006), in
metric tons
Source: Serino and Klasen (2015, p. 53); all rights reserved, used with permission
For the year 2010, the World Bank Global Consumption Database (World Bank, s.a.)
estimates that households in the middle consumption segments have spent the following
shares of their total consumption on transport: 19 per cent (Ghana), 12 per cent (Peru) and
12 per cent (Philippines). Middle consumption segment here means households that have
an income of USD 8.44 and USD 23.03 per capita a day. The share of energy in total
consumption of the middle consumption segment is lower, but it is relevant due to its carbon
intensity: 4 per cent (Ghana), 3 per cent (Peru) and 7 per cent (Philippines). A review of the
most recent household surveys available (Encuesta Nacional de Hogares (ENAHO) 2017;
Ghana Living Standards Survey 7; Family Income and Expenditure Survey 2015) across all
income groups confirms these general patterns. As households become richer, they
proportionally spend less on food and more on recreational activities, transport, and
information and communications technology (in line with Engel’s law). Drawing together
the information on sectors’ carbon intensities and household expenditures, it is useful to
focus our analysis on middle-class carbon consumption of energy and transport.
Future consumption patterns are likely to be shaped by demand for more and more
diversified products in the markets that support lifestyles beyond the bare necessities. A
continuous increase in demand for private cars and other motorised vehicles is expected in
all three countries. For the Philippines, for example, the Asian Development Bank projects
an increase in road vehicles from 6.6 million in 2010 to 24.8 million in 2030, primarily due
to rising incomes (Asian Development Bank, 2017). In the Peruvian capital region Lima-
Callao, total energy use will increase by 78 per cent, emissions from transport by 64 per
cent and total city carbon emissions by 84 per cent, when calculating a business-as-usual
scenario from 2014 to 2030 levels (Gouldson et al., 2014). In Ghana and the Philippines,
demand for air conditioners is expected to soar as rising incomes make them affordable and
a warmer climate will make them indispensable, as the International Energy Agency (IEA,
2018) projects for many tropical countries. The consumption behaviour of the middle
classes will be key here, as cooling and mobility present important parts of more
comfortable lifestyles.
German Development Institute / Deutsches Institut für Entwicklungspolitik (DIE) 5Babette Never et al.
3 Drivers of consumer behaviour: Literature review and hypotheses
The drivers of household carbon consumption and the relation to the lifestyle choices of
consumers have been studied extensively in developed countries, and recently in large
middle-income countries, particularly China. Wealth, social status, environmental concern
and environmental knowledge have been identified as the most important explanatory
factors (e.g. Mi, Yu, Yang, & Lu, 2018; Steg & Vlek, 2009; Wiedenhofer et al., 2016).
Whereas the former two factors increase carbon emissions, the latter two may motivate and
moderate pro-environmental consumer behaviour. Pro-environmental behaviour often, but
not automatically, correlates with lower carbon emissions. Regarding the growing middle
classes in middle-income countries, empirical research that investigates to what extent these
drivers matter is still lacking.
Wealth levels or income strongly predict household carbon footprints. 3 The carbon footprint
literature has found a consistent effect of income in many developed countries (e.g. Buechs
& Schnepf, 2013), but also in some developing countries. The relationship, however, is not
always linear, which leads to the question of turning points, acceleration rates and potential
ceiling effects. The Environmental Kuznets curve hypothesis postulates an inverted U-
shaped relationship between pollutants and per capita income (Grossman & Krueger, 1995).
Ceiling effects could theoretically occur once all major appliances and a private vehicle
have been purchased, for example.
In India, for instance, the relationship between household income and carbon consumption
is almost linear (Renner, 2016). In contrast, income elasticities of the Chinese middle classes
and rich are slightly less than one, indicating a potential ceiling or even decrease, albeit on
a very high level of carbon consumption (Wiedenhofer et al., 2016). Country-specific
pathways remain when calculating Environmental Engel curves as well. Environmental
Engel curves describe how changes in household income affect environmental pollution
over time. In the United States, they increase, look concave and then decrease over time for
both air pollution (Levinson & O’Brien, 2019) and carbon consumption (Sager, 2019). In
Mexico, overall Environmental Engel curves on energy consumption take the form of an
elongated S-shape; rural households only show a steady upward slope (Rodriguez-Oreggia
& Yepez-Garcia, 2014). Again, these results underline that the general relationship between
wealth and household carbon consumption holds, but that it takes different shapes and
slopes. We will explore the shape of the relationship in Ghana, Peru and the Philippines in
detail, assuming that urban middle-class households follow the Indian example without
statistically discernible ceiling effects, that is, no Environmental Kuznets curves. Thus, we
predict a linear relationship.
H1 (wealth): The wealthier a middle-class household, the more carbon consumption.
Status consumption is one of the most well-known concepts in marketing research.
Individuals tend to define themselves and others by way of their possessions (O’Cass &
McEwen, 2014). For the growing middle classes, social status consumption is about
generally displaying their new wealth to others (Mi et al., 2018; Nabi, O’Cass, & Siahtiri,
2017) and about owning specific brands or status goods, such as an air conditioner in the
3 If no reliable income data is available, development economists usually construct wealth scores based on
assets, house materials and maintenance.
6 German Development Institute / Deutsches Institut für Entwicklungspolitik (DIE)Carbon consumption patterns of emerging middle classes Philippines (Sahakian, 2014). Additionally, status consumption serves individual identity goals such as belonging to or differentiating oneself from a group, as has been shown for the Bangladeshi middle classes (Nabi et al., 2017). Status consumption – especially conspicuous luxury consumption – may increase household carbon consumption, as Mi and co-authors show in China (Mi et al., 2018). Particularly lower-income groups and less- educated female Chinese are more driven by status than by material hedonism (Mi et al., 2018). Less wealthy or not established South African middle-class households also signal status more strongly via visible consumption than other social groups (Burger, Low, de Oliveira Pegado, & van den Berg, 2014). In background interviews and focus group discussions that we conducted in 2018 before running our household study, middle classes were characterised by their drive to climb up the social ladder, distance themselves from the poor and attempt to keep up with presumably richer friends. Consumer researchers often summarise these behaviours as the “Keeping up with the Joneses” effect (Ordabayeva & Chandon, 2011). Drawing on these various insights, we hypothesise: H2 (status): Social status considerations impact household carbon consumption. A lot of social psychology research focusses on the environmental behaviour of affluent consumers in industrialised countries and how to overcome the gap between environmental concern and actions (value–action gap; Blake, 1999) or environmental knowledge and actions (knowledge–action gap; Kollmuss & Agyeman, 2002). Environmental values capture whether a person cares about the environment at all, whereas knowledge means having factual information about what causes greenhouse gas emissions or how to save energy in the household, for example. Implementation intentions and commitment (Aijzen, 1991; Steg & Vlek, 2009), attitudes, habits and personal norms also impact environmental behaviour (Aarts & Dijksterhuis, 2000; Schwartz, 1977; Verplanken & Faess, 1999), painting a complex picture. According to the theory of reasoned action, environmental knowledge influences attitudes, which in turn leads to pro-environmental behaviour. Empirical evidence is mixed (Frederiks, Stenner, & Hobman, 2015; Geng, Liu, & Zhu, 2017), especially regarding energy consumption (Paco & Lavrador, 2017). The role of environmental beliefs and concern has been studied from various theoretical and empirical angles, often focussing only on hypothetical behavioural intentions rather than actual behaviour. Higher levels of environmental concern are generally associated with pro-environmental action, even though the relationship is not always strong (Steg & Vlek, 2009). In the United States, a clear link between environmental concern and lower energy consumption exists (Sapci & Considine, 2014). Young consumers in Vietnam are motivated by a mix of psychological factors, including concern, knowledge, attitudes and personal norms, which influence energy- efficient appliance purchases (Nguyen, Lobo, & Nguyen, 2018). It is likely that there is a difference between easy-entry sustainable behaviours and hard-to- change behaviours or total consumption (including rebound effects). On the one hand, it appears that positive values, beliefs and concern induce actual sustainable behaviours such as energy saving and the adoption of energy efficiency, but they do not lead to an actual reduction in energy use per se as rebound effects occur (Frederiks et al., 2015). On the other hand, several psychological studies have shown that easy-entry behavioural changes can German Development Institute / Deutsches Institut für Entwicklungspolitik (DIE) 7
Babette Never et al.

open the door to more substantial behavioural changes at a later stage (Freedman & Fraser,
1966; Lanzini & Thøgersen, 2014; Souchet & Girandola, 2013). This is known as the “foot
in the door effect” (Freedman & Fraser, 1966).

With the value–action gap and knowledge–action gap in mind, we focus on potential
positive relations between knowledge, concern and consumption. Furthermore, we
differentiate between easy-entry environmental behaviours, which are often low-cost and
daily routines, and overall carbon consumption, which includes high-cost, carbon-intensive
energy and transport behaviours.

H3 (knowledge):

a. More environmental knowledge leads to easy-entry environmental behaviour.

b. More environmental knowledge leads to less carbon consumption.

H4 (concern):

a. Higher levels of environmental concern lead to easy-entry environmental behaviour.

b. Higher levels of environmental concern lead to less carbon consumption.

These hypotheses can be summarised in the following analytical equation:

                      γ i = ß 0 + ß 1 x 1 + ß 2 x 2 + ß 2 x 2 + ß 3 x 3 + ß 4 x 4 + ß 5 x 5,

where γ i is either carbon consumption or easy-entry environmental behaviour of household
i, x1 is wealth, x2 is status, x3 is knowledge and x4 is concern. The term x 5 represents the
control variables (age, gender, education of the respondent, number of household members)
and ß 0 is the intercept.

4      Methods

4.1    Definition of middle class and sampling

All types of middle-class definitions in the literature are to some extent arbitrary; no
consensus exists. We have opted for a new combination of criteria that allows for a non-
income-based cross-country comparison, in line with our interdisciplinary approach to the
topic. Since income data is hardly reliable in developing countries, we developed seven
screening questions and a point system on assets, expenditures and education level of the
household head. The aim was to cover a broad range of potential middle-class households
(oversampling), which could be further defined ex post by excluding outliers. We primarily
excluded some outliers in the Philippines (final N = 802) and Ghana (final N = 837) from the
analysis. We assume that different groups of middle classes exist within the bracket chosen,
so there is no “one” middle class.

The eight screening questions included: house size, house materials, house quality, house
ownership or rent, type of water connection in the dwelling, annual expenditures on

8                      German Development Institute / Deutsches Institut für Entwicklungspolitik (DIE)
Carbon consumption patterns of emerging middle classes education, expenditure on eating out in a proper restaurant (e.g. with air conditioning), level of education of the household head. Three answer categories with 0-2 points were given for each question; a range of 0-14 points was possible (see Appendix A). We purposively set a broad threshold for being middle class at 4-12 point. Initial questions on health expenditures and savings were discarded due to the sensitivity of the information, and thus a danger of losing respondents. Previous research has shown that the new middle classes live largely in urban centres (Albert, Santos, & Vizmanos, 2018). The surveys were therefore conducted in the capital cities only, as these attract a larger share of the middle classes. We prioritised approximating a representative sample size of middle classes in these cities over capturing more variation within countries by adding more cities. The sampling of households followed two steps: one geographical and one household-based step. In the first step, slum areas and very rich districts were excluded. In the second step, a probability sampling proportional to the estimated population size for neighbourhoods was applied. Then, every fifth house from a random starting point was approached. In Accra, Ghana, the procedure was slightly adapted to purposively access middle-class gated communities in 26 different neighbourhoods, which required pre-registration of interviews. At least one neighbourhood in the same district of each of the gated communities was randomly selected to account for the variation within the district. The resulting samples approximate a representation of the middle classes in each city; they are not meant to be representative of the national population. 4.2 Measurement of independent variables This discussion paper focusses on four independent variables to explain carbon consumption patterns: wealth, status, environmental concern and environmental knowledge. The household survey also included questions on socio-demographic background as control variables. The wealth index has been constructed by way of a principal component analysis (PCA) for each of the three countries separately, in line with standard procedures in development economics (Filmer & Pritchett, 2001; Filmer & Scott, 2008; Kolenikov & Angeles, 2009). We base our wealth index on assets and house characteristics, drawing on previous studies on Peru (Jaramillo & Parodi, 2004) and Ghana (Mahama, Anaman, & Osei-Akoto, 2014). To construct the wealth indices, we include information on 15 assets owned by the household (as dichotomous variables). We exclude energy-intensive assets that almost every household owns (fridge, freezer, air conditioner) to avoid tautological conclusions regarding energy spending. As categorical variables that differentiate into three categories each, we added the house size (number of rooms), house material, quality of the house (maintenance), type of water connection to the dwelling and the education level of the household head to the index. Finally, we also included the number of household members per room. This combination of data allows for the least clumping and truncation when running a PCA. The PCA explains acceptable levels of variation in the data in all three countries (>20 per cent). German Development Institute / Deutsches Institut für Entwicklungspolitik (DIE) 9
Babette Never et al.

Social status orientation in consumer behaviour is a complex phenomenon and may vary a
lot depending on the type of product or service, or even the lifestyle component. We
therefore modified a status consumption scale (Eastman, Goldsmith, & Flynn, 1999) and a
status orientation scale (Pantinga, Breugelmans & Zeelenberg, 2020) from marketing
research to our purposes (see Appendix B).

Scale reliability was excellent for Peru (Cronbach’s alpha 0.80), but rather poor for Ghana
(Cronbach’s alpha 0.46) and the Philippines (Cronbach’s alpha 0.48). This indicates a
potential problem with our measurement of status. Even if we omit the 4th item on transport
(see Appendix B), scale reliability does not increase (0.48 in Ghana; 0.48 Philippines). We
will run two tests for our hypothesis on the influence of social status: a first one to find out
whether a strong status orientation exists at all among the middle classes, especially among
the less wealthy households, as the literature suggests; a second test will then more directly
test the relation between status and carbon consumption.

Environmental concern was measured with six items from Thøgersen, Pedersen and
Aschemann-Witzel (2019; we slightly modified item six), using a 7-point Likert scale (see
Appendix B). The items form a construct with excellent reliability in all countries
(Cronbach’s alpha > .70).

For environmental knowledge, we draw on Thøgersen, Haugaard and Olesen (2010), but
adapt their items to more closely capture knowledge about energy and transport. Items were
constructed as dichotomous questions with yes and no responses; the knowledge variable is
the sum of yes responses. Scale reliability was satisfactory in all three countries (Cronbach’s
alpha between 0.50 and 0.70).

4.3     Measurement of dependent variables

Consumption patterns incorporate the acquisition as well as the use of products. To analyse
household carbon consumption patterns, we use electricity expenditure of the household and
our own transport CO 2 score as proxies. Additionally, we construct a sustainable behaviour
index to capture potential differences between minor actions that may be motivated by
environmental considerations and major actions that lead to households’ final carbon
consumption total.

In all three of our countries of interest, electricity is generated with a considerable share of
fossil fuels, making electricity an appropriate proxy for carbon consumption. In Ghana, 60
per cent of electricity in 2017 was generated with oil and gas; 40 per cent from renewable
energy sources. In Peru, hydropower is still the main source of electricity generated (ca. 60
per cent), but the current 40 per cent of fossil fuel-based electricity generation is likely to
increase, as more thermal power plants are being planned to meet increasing demand.
Furthermore, the majority of electricity consumers in Lima are customers of the company
Enel, which generates the electricity for Lima from two fossil fuel thermal power plants. In
the Philippines, almost two-thirds of all electricity generated is derived from coal, oil and
natural gas (IEA, 2019). Access of households to the electricity grid in Accra, Lima and
Manila is almost universal; all households in our sample were connected to it. In this paper,
electricity expenditures are used as dependent variables instead of kilowatt hours (kwh)
because not all households were able to share their last electricity bill, which shows the kwh

10                      German Development Institute / Deutsches Institut für Entwicklungspolitik (DIE)
Carbon consumption patterns of emerging middle classes

used. We think that respondents’ guesses about their latest electricity bills provide a more
accurate estimate of actual energy consumption than respondents’ guesses about the amount
of kwh they consumed. We ran a robustness check with kwh for the sub-sample of
households that provided that data, which confirmed our findings.

The construction of a CO 2 score for transport was only possible for Peru and the Philippines
due to a lack of data on the carbon intensity of local transport modes in Ghana. The score is
a proxy, not an accurate measurement of the carbon intensity of all travel trajectories by
actual kilometres (km) and time travelled. The space in the household survey was too limited
to ask for all this data in detail. As a starting point, we instead used our survey question “On
a normal day, how often do you…use your own car”. We asked this question for 12 available
transport modes in Metro Manila and for 11 available transport modes in Lima, using a 5-
point Likert scale. Answers for a normal day were extrapolated to annual frequencies in
order to match them with annual average CO 2 emissions by vehicle types.

For Lima, detailed data on average CO 2 emissions per capita per person travelled for each
type of local vehicle was available (TRANSperú, 2015). For Metro Manila, we replicated
the method of the Peru study. We multiplied average vehicle emissions factors per km
travelled in Metro Manila for each of the 12 transport modes (Fabian & Gota, 2009; National
Economic Development Authority & Japan International Cooperation Agency, 2014) by the
inverse average occupancy rates for each vehicle type, using the most recent data available
(Japan International Cooperation Agency, 2012). The average occupancy rate captures the
vehicle km per person km travelled; the inverse (person km per vehicle km) is necessary to
arrive at per capita CO 2 emissions.

CO 2 emissions estimate per capita = daily frequency of travel mode 4 * inverse occupancy
rate * emission factor (g of CO 2 /km travelled) * 365

Walking, biking and transport via pedicab are human-powered and therefore have no
emissions. Data on the occupancy rate and the emission factors of the Manila light rail systems
(mass rapid transit, light rail transit) is missing. Yet, light rail systems such as metro lines
typically have very high occupancy rates in Manila, and therefore low per capita emissions.
Thus, the travel mode “metro (mass rapid transit, light rail transit)” is assigned the value “0”
as well (see Table A1 in Appendix B). Annual flight emissions are computed as follows: (i)
we utilise information on individuals’ flight destinations and approximate the average
distance (in km) travelled per air journey; (ii) we multiply the average travel distance by a
proxy for average CO 2 per air km and the number of times the person travelled by plane last
year. 5

For each land travel mode, we multiply the daily travel mode frequencies by CO 2 emissions
per transport mode times 365 to arrive at a proxy for individuals’ annual transport CO 2 score
(see equation/calculation above). Given the limited data availability, this approximation is
the most accurate measure we could calculate.

4   Weights: Nearly never = 0 km; A few times = 5 km; Sometimes = 10 km; Often = 20 km; Very often = 25 km.
5   Our proxy is 115 grams of CO2 per air km travelled (Carbon Independent, s.a.). We acknowledge the fact
    that a typical air journey involves a round trip and, thus, is considered the average distance covered per
    journey twice.

German Development Institute / Deutsches Institut für Entwicklungspolitik (DIE)                           11
Babette Never et al. Finally, the sustainable behaviour index is based on mean scores of easy-entry pro- environmental behaviours from three different domains: electricity use in the household, recycling behaviour and political consumption. For each domain, we asked two questions, using a 5-point Likert frequency scale: • Do you usually switch off the lights when you leave the room? • Do you actively try to save energy in your household? • Do you usually reuse materials such as plastic bags? • Do you usually avoid taking plastic bags in shops (e.g. supermarkets)? • In the past 12 months, how often, if ever, have you deliberately bought a product or brand because it is environmentally friendly? • In the past 12 months, how often, if ever, have you decided not to buy a product or brand because it harms the environment? Since the three domains measure different behaviours, it is not surprising that the overall scale reliability is rather low but acceptable (Cronbach’s alpha 0.4-0.5). 5 Results: How carbon-intensive are middle-class consumption patterns? 5.1 Ghana Consumption patterns of the Ghanaian middle classes and their carbon emissions become manifest via households’ general living conditions, the type of appliances and other durables they own and how they travel. In Accra, the middle classes live in both gated communities and mixed neighbourhoods. In our sample, two-thirds of households own their dwellings (74 per cent) and almost all households (>95 per cent) own basic assets such as a fan, a TV, a fridge and a smartphone. Ownership levels of other assets vary (see Section 6). Wealth is almost normally distributed in our sample according to the PCA results (Figure 5). On average, middle-class households in Accra have a fairly high level of environmental concern and environmental knowledge and do not overtly care for status (see mean scores in Table 1). 12 German Development Institute / Deutsches Institut für Entwicklungspolitik (DIE)
Carbon consumption patterns of emerging middle classes

 Figure 5:      Distribution of middle-class sample in Accra based on wealth index

 Source: Authors’ calculations

Table 1:        Summary statistics middle-class sample in Accra
Variable                  Obs.        Mean               Std. dev.        Min.       Max.
Energy spending           813         1.654.171          1.200.051        1          920
Log of energy             813         4.880.965          .6926562         0          6.824.374
spending
Sustainable behaviour     813         3.275.933          .6320975         1.667      5
Wealth index              813         -.015054           1.773.804        -4.049     3.835.643
Log of wealth             813         1.531.237          .4100545         -.050253   2.178.794
Concern                   813         404.797            .5714737         1          5
Knowledge                 813         5.638.376          1.549.544        0          8
Status                    813         2.516.298          .6948939         1          5
Education                 813         1.881.919          .8672079         0          4
Age                       834         4.539.089          1.452.714        18         87
Gender                    834         .4088729           .4919207         0          1
HH members                834         4.410.072          2.089.175        1          16
Source: Authors’ calculations

Wealth levels clearly drive energy spending among Ghanaian middle-class households,
whereas environmental concern, environmental knowledge and status do not make a
difference (Table 2). In the ordinary least squares regressions, we add the highest completed
education level of the respondent, his/her age and gender as control variables. Furthermore,
we control for the number of household members. It is not possible to reliably control for
the electricity price, as we only have reliable data on actual kwh and other charges (photo
of last electricity bill) for 23 per cent of the households in our sample.

As wealthier households spend more on energy, and thus also emit more carbon derived
from energy than less wealthy households, we can confirm Hypothesis 1 (wealth). This

German Development Institute / Deutsches Institut für Entwicklungspolitik (DIE)                  13
Babette Never et al.

result is not surprising in itself, but the effect is big: A 1 per cent increase in wealth correlates
with a 0.57 per cent increase in energy spending. Furthermore, the confirmation of a linear
slope 6 indicates the trend in consumption dynamics in the Ghanaian middle classes. Patterns
rather mirror those of India – and many industrialised countries – than those of Mexico.

Table 2:        Regression results (log of) energy spending and wealth in Accra
Log of energy spending                  Model 1      Model 2    Model 3       Model 4       Model 5
Log of wealth                           0.633***     0.631***   0.609***      0.610***      0.578***
                                        (0.05)       (0.06)     (0.06)        (0.06)        (0.06)
Status                                               0.021      0.024         0.024         0.049
                                                     (0.03)     (0.03)        (0.03)        (0.03)
Knowledge                                                       0.021         0.021         0.022
                                                                (0.02)        (0.02)        (0.02)
Concern                                                                       -0.008        -0.004
                                                                              (0.04)        (0.04)
Education                                                                                   0.028
                                                                                            (0.03)
Age                                                                                         0.001
                                                                                            (0.00)
Gender                                                                                      0.103*
                                                                                            (0.05)
HH members                                                                                  0.076***
                                                                                            (0.01)
Constant                                3.912***     3.861***   3.772***      3.798***      3.303***
                                        (0.09)       (0.12)     (0.13)        (0.19)        (0.21)
R-sqr                                   0.140        0.141      0.143         0.143         0.200
Dfres                                   811          810        809           808           804
BIC                                     1599.4       1605.7     1610.5        1617.2        1588.0
* p
Carbon consumption patterns of emerging middle classes communities in our sample, which implies that status goods such as air conditioners cannot be seen easily by neighbours (as in the Philippines, for example). Finally, it is possible that status products in the home such as fancy kitchen appliances may actually not be in use much. Overall, the explanatory power of these results is not high, implying that status does play a general role in middle-class Ghanaians’ lives, but it is difficult to capture and does not impact energy consumption. While knowledge (Hypothesis 3) and concern (Hypothesis 4) do not have an impact on total carbon consumption of the household, as discussed above, the regressions on sustainable behaviours tell a different story. The analysis of these easy-entry behaviours gives more insights on whether households try to save energy, behave in an environmentally friendly manner and reduce their carbon footprint at all. Table 3 shows the regression results for sustainable behaviour. Clearly, more environmentally concerned, more-educated households show more easy-entry, low-cost sustainable behaviours. Interestingly, environmental knowledge has a slightly negative, albeit negligible effect. In Accra, the absence of proper recycling systems and accompanying regulation turns easy- entry sustainable behaviours into more of a challenge than in contexts in which choices are made easier by supporting infrastructure or policy. The same applies to consumers who wish to avoid or buy specific products for environmental reasons, as reliable consumer information on products and testing results from independent agencies on hazardous substances contained in products are hardly available. On the one hand, the exercising of easy-entry sustainable behaviours by the middle classes should be seen in a more positive way. On the other hand, our survey relies on reported, not revealed, behaviours, meaning that the problem concerning the social desirability of answers may arise. For our hypotheses on knowledge (H3) and concern (H4), these results imply that easy- entry environmental behaviours may decrease levels of overall household carbon consumption to a small extent, but they are possibly overridden by other carbon-intensive behaviours or rebound effects. However, we do not have data with broad-based evidence for all types of consumer behaviours or the actual carbon footprints of households to follow up on this. It appears that existing average levels of environmental concern and environmental knowledge do not systematically alter hard-to-change, carbon-intensive behaviours. In terms of a knowledge/value–action gap, our results are inconclusive. High education levels coincide with easy-entry sustainable behaviours but not with less energy consumption, which would point towards a knowledge–action gap, but reported environmental knowledge does not fit this argument. German Development Institute / Deutsches Institut für Entwicklungspolitik (DIE) 15
Babette Never et al.

Table 3:        Regression results sustainable behaviour index in Accra
Sustainable behaviour          Model 1        Model 2        Model 3          Model 4         Model 5
Knowledge                    0.018          -0.014         -0.019          -0.019           -0.030*
                             (0.01)         (0.01)         (0.01)          (0.01)           (0.01)
Concern                                     0.332***       0.327***        0.327***         0.310***
                                            (0.04)         (0.04)          (0.04)           (0.04)
Wealth                                                     0.018           0.016            -0.011
                                                           (0.01)          (0.01)           (0.01)
Status                                                                     0.036            0.036
                                                                           (0.03)           (0.03)
Education                                                                                   0.121***
                                                                                            (0.03)
Age                                                                                         0.001
                                                                                            (0.00)
Gender                                                                                      0.006
                                                                                            (0.04)
HH members                                                                                  -0.025*
                                                                                            (0.01)
Constant                     3.176***       2.014***       2.062***        1.968***         1.953***
                             (0.08)         (0.16)         (0.16)          (0.18)           (0.21)
R-sqr                        0.002          0.086          0.088           0.089            0.116
dfres                        811            810            809             808              804
BIC                          1572.2         1507.6         1512.3          1517.6           1520.2
* p
Carbon consumption patterns of emerging middle classes households usually own their house (74 per cent in our sample) and at least some basic amenities, such as a fridge, a stove, and a TV (>95 per cent). The vast majority also have at least one smartphone (92 per cent) in their home. In our sample, a lot fewer households than we expected own a car (12.5 per cent) or motorbike (2 per cent). The ownership levels of other energy-intensive and non-energy-intensive assets vary (see Section 6). The wealth distribution in our sample is almost normal, with a slight overrepresentation of households in the middle of the distribution (Figure 6). On average, middle-class households in Lima are rather concerned about the environment and also have a good amount of environmental knowledge (see Table 4). Status orientation is in the middle ranges. To cross-check the validity of our wealth index, we compared our dataset with the ENAHO 2017 data for Lima. Results of a proxy means regression show that predicted consumption in our sample has a higher mean than in ENAHO data, which is to be expected, given that we captured only the middle classes (see Table A2 in Appendix B). The correlation between predicted consumption and our wealth index is good (0.60). Predicted income of our dataset and in ENAHO data for Lima is higher than consumption-based welfare, but it has a similar distribution. Thus, the external reliability of our data is satisfactory. Figure 6: Distribution of middle-class sample in Lima based on wealth index Source: Authors’ calculations German Development Institute / Deutsches Institut für Entwicklungspolitik (DIE) 17
Babette Never et al.

Table 4:        Summary statistics middle-class households, Lima
Variable            Obs.                Mean            Std. dev.        Min.              Max.
Energy              832                 1.277.623       807.418          12                556
spending
Log of energy       832                 4.685.841       .5741446         2.484.907         6.320.768
spending
Transport score     832                 -7.04e-09       1                -.4226277         1.456.426
Sustainable         832                 3.126.002       .5272197         1.166.667         4.833.333
behaviour
Wealth              832                 6.72e-11        1.680.781        -462.118          343.986
Log of wealth       832                 1.745.692       .3197212         .321228           2.244.941
Status              832                 2.609.075       .9607452         1                 5
Knowledge           832                 531.851         1.847.558        0                 8
Concern             832                 3.764.022       .5720022         1                 5
Education           832                 1.176.683       .4769382         0                 4
Age                 832                 4.754.207       1.494.895        18                75
Gender              832                 5528846         .4974944         0                 1
HH members          832                 3.927.885       1.561.292        1                 12
Source: Authors’ calculations

Table 5:        Regression results drivers of (the log of) energy spending, Lima
Log of energy spending       Model 1         Model 2        Model 3          Model 4      Model 5
Log of wealth                0.711***        0.713***       0.708***         0.715***     0.629***
                             (0.06)          (0.06)         (0.06)           (0.06)       (0.06)
Status                                       0.007          0.008            0.001        0.023
                                             (0.02)         (0.02)           (0.02)       (0.02)
Knowledge                                                   0.003            0.001        0.005
                                                            (0.01)           (0.01)       (0.01)
Concern                                                                      0.052        0.068*
                                                                             (0.03)       (0.03)
Education                                                                                 0.057
                                                                                          (0.04)
Age                                                                                       0.006***
                                                                                          (0.00)
Gender                                                                                    -0.007
                                                                                          (0.04)
HH members                                                                                0.063***
                                                                                          (0.01)
Constant                     3.444***        3.424***       3.413***         3.237***     2.638***
                             (0.10)          (0.12)         (0.12)           (0.17)       (0.20)
R-sqr                        0.157           0.157          0.157            0.160        0.206
Dfres                        830             829            828              827          823
BIC                          1308.2          1314.8         1321.5           1325.7       1305.9
* p
Carbon consumption patterns of emerging middle classes Figure 7: Middle-class wealth and energy spending in Lima Source: Authors’ calculations Wealthier middle-class households in our sample spend more on energy, that is, consume more carbon: A 1 per cent increase in wealth correlates with a 0.62 per cent increase in energy spending. Age also matters, albeit much less than wealth (Table 5). The relation between wealth and energy spending looks linear, also after having cross-checked for an inverted U-shape by way of a quadratic regression term (Figure 7). The result that households with more members spend more on energy is intuitive, as demand increases per capita, for instance because more appliances are in use simultaneously. Carbon consumption from transport increases with rising wealth levels as well, implying that a general shift in carbon consumption patterns happens as households move from the lower to the upper-middle classes. Wealthier middle-class members with higher education contribute more to transport CO 2 emissions by way of their travel mode choices (Table 6). Since car ownership levels are surprisingly low in our sample, a larger sample with more car owners may well show a larger effect of wealth’s impact on transport emissions. Drawing the results on energy and transport together, the hypothesis that wealthier households consume more carbon (H1 wealth) can be confirmed for Peru. Regarding the impact of status (H2), the results for Peru are similar to Ghana. Less wealthy, younger and male-headed middle-class households in Lima are generally more status- oriented (see Table 7). The explanatory power of the model, however, is rather low (R2 = 0.065). Furthermore, status does not impact energy- or transport-related carbon consumption (Tables 5 and 6). Hence, we cannot confirm our hypothesis H2 on the relation between status and carbon consumption. As for Ghana, the discrepancy between the two results suggests that status orientation exists and that it matters for the emerging middle classes – but it is not related to energy and transport. German Development Institute / Deutsches Institut für Entwicklungspolitik (DIE) 19
Babette Never et al.

Knowledge (Hypothesis 3) and concern (Hypothesis 4) have mixed impacts on carbon
consumption and consumer behaviour. Knowledge does not influence energy spending or
our transport score in any direction, whereas slightly higher levels of concern lead to more
energy spending. Given the fairly high mean scores, especially for environmental concern,
it is possible that a value–action gap 7 exists here. In contrast, higher levels of environmental
concern, more environmental knowledge and being female lead to more easy-entry
sustainable behaviours (Table 8). Interestingly, status also has a small impact. A possible
explanation is that signalling easy-entry sustainable behaviours may have actually become
a way to show belonging in a certain group. Given the rather small coefficient (0.06),
another possibility is that this is a rather random effect that can be neglected. Here, some
follow-up qualitative work would be necessary to find out more.

In sum, our results for Peru make it clear that carbon consumption from energy and transport
increases as middle-class households move up the wealth ladder. Existing high levels of concern
for the environment and fairly good environmental knowledge do not matter for carbon-
intensive, hard-to-change behaviours, but they drive easy-entry sustainable behaviours.

Table 6:        Regression results transport CO 2 score, Lima
Transport score            Model 1        Model 2         Model 3          Model 4          Model 5
Wealth                     0.164***       0.163***        0.157***         0.153***         0.147***
                           (0.02)         (0.02)          (0.02)           (0.02)           (0.02)
Status                                    -0.027          -0.017           -0.001           -0.010
                                          (0.03)          (0.04)           (0.04)           (0.04)
Knowledge                                                 0.018            0.023            0.008
                                                          (0.02)           (0.02)           (0.02)
Concern                                                                    -0.123*          -0.108
                                                                           (0.06)           (0.06)
Education                                                                                   0.200**
                                                                                            (0.07)
Age                                                                                         0.003
                                                                                            (0.00)
Gender                                                                                      -0.089
                                                                                            (0.07)
HH members                                                                                  -0.040
                                                                                            (0.02)
Constant                   -0.000         0.070           -0.050           0.342            0.236
                           (0.03)         (0.10)          (0.17)           (0.25)           (0.35)
R-sqr                      0.076          0.077           0.078            0.082            0.100
dfres                      830            829             828              827              823
BIC                        2307.6         2313.8          2319.7           2322.2           2333.2
* p
You can also read