Canada - REAL ESTATE CBRE RESEARCH
←
→
Page content transcription
If your browser does not render page correctly, please read the page content below
CB RE RESEARCH

      2018
R E A L E S TAT E
   MARKET
  OUTLOOK

   Canada
C A N A D I A N REAL ESTATE OUTLOOK 2018

                                    CONTENTS

        NATIONAL                                               REGIONAL
        OUTLOOK                                                OUTLOOK
        3      Executive Summary                               20 Vancouver
        5      Confidence Over                                 23 Calgary
               Question Marks
                                                               26 Edmonton
        6      Canada in the Spotlight
                                                               29 Winnipeg
        8      The Rising Cost of the
               Canadian Dream                                  32 London

        10 New Rules of the Game                               35 Waterloo Region

        13 Rising Interest in                                  38 Toronto
           Interest Rates
                                                               42 Ottawa
        14 Technology: Wake Up
           Call or Alarm Bells?                                45 Montreal

        17 2018: Runway for                                    48 Halifax
           Opportunity

© 2018 CBRE Limited                CANADA REAL ESTATE MARKET OUTLOOK 2018           CBRE RESEARCH

                                                     2
EXECUTIVE SUMMARY
                      These are remarkable times. Canadian commercial
                      real estate continues to set records, assert itself on the
                      world stage and build momentum despite an extended,
                      nine-year bull run and technological innovations that
                      are shaping our physical and digital existence. This is
                      the backdrop for CBRE’s 2018 Market Outlook; a year
                      in which context might be as important as the facts and
                      figures upon which forecasts are built.

                      The 2018 outlook for Canadian commercial property
                      suggests that the market has the potential to defy
                      traditional market cycles. The institutionalization of real
                      estate, the diversification of the economy and changing
                      technology have altered the rules of the game. Traditional
                      market analysis would generally cast doubt on the chances
                      of consecutive, all-time record investment volumes.
                      However, in this new paradigm, Canada has the potential
                      to achieve this feat for a remarkable third consecutive year.

© 2018 CBRE Limited                   CANADA REAL ESTATE MARKET OUTLOOK 2018          CBRE RESEARCH

                                                        3
C A N A D I A N REAL ESTATE OUTLOOK 2018

                                   EXECUTIVE SUMMARY
Expect a number of notable trends and unparalleled statistics in 2018, including:

                      Office Sale Price and                                                 Record Investment Volume
                      Rental Rate Records                                                   Canada is likely to contend for a third
                      The desire to buy core office buildings will                          consecutive year of record investment
                      likely produce new record prices per sq. ft. in                       volumes. Commercial real estate will
                      Canadian cities, with Toronto and Vancouver                           maintain its appeal as a stable, high-
                      leading the way. Strong leasing demand and                            yielding investment vehicle despite rising
                      decreasing vacancy will likely produce record                         interest rates and stricter underwriting.
                      high rental rates.
                                                                                            Urban Industrial Renaissance
                      Tenants Forced to Get Creative                                        The next evolution of logistics and
                      As available office and industrial space                              distribution activity will involve a push to
                      become increasingly scarce, tenants will                              revitalize old, light manufacturing
                      need to shift their real estate expectations                          buildings to support same-day delivery.
                      to reflect new market realities. To meet                              Expect inner suburbs and fringe core areas
                      business goals, tenants will have to be                               of major Canadian markets to see
                      flexible and consider non-contiguous                                  increased leasing demand in 2018.
                      units, expansion into separate offices and
                      the possibility of leasing second-tier,
                                                                                            New Metrics and Perspectives
                      Class B and C space.
                                                                                            on the Market
                                                                                            In line with changing rules of the game,
                      Land in Demand                                                        increased focus on distribution means
                      As the market gears up for a new                                      solely valuing industrial buildings by sq. ft.
                      construction cycle and investors plan for                             may not account for total potential value.
                      the future, land sales will likely continue to                        As the focus on space utilization increases,
                      set pricing records in a variety of markets                           valuations on a ft.3 basis may become more
                      across Canada.                                                        commonplace. The push for autonomous
                                                                                            vehicles will also result in a re-evaluation of
                                                                                            parking needs which could shift
                      Speculative Construction to Surge
                                                                                            underwriting on a variety of properties.
                      The combination of record low office
                      vacancy and industrial availability along
                      with rising rental rates will spur new                                Landlords to Embrace Big Data
                      construction. Developers will likely be so                            Expect to see increased data collection
                      confident in their ability to lease space that                        around business operations and individual
                      they will start construction with minimal,                            preferences in order to develop new real
                      or no, preleasing.                                                    estate strategies. The institutionalization
                                                                                            of commercial real estate should facilitate
                                                                                            the adoption of new technologies.

© 2018 CBRE Limited                                CANADA REAL ESTATE MARKET OUTLOOK 2018                                    CBRE RESEARCH

                                                                        4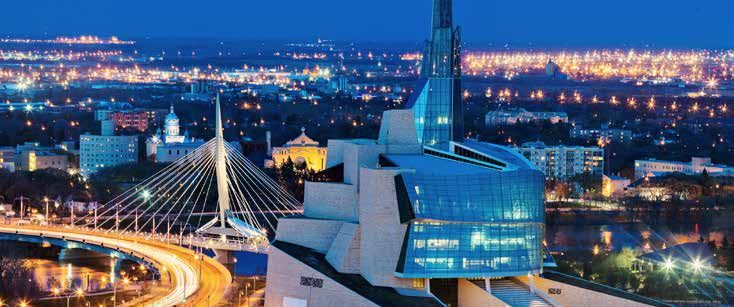
CONFIDENCE
OVER
QUESTION
MARKS
Since the global financial crisis roiled
confidences in 2008, forecasting efforts have                         FIGURE 1:
had to confront the possibility of one                                Household debt to disposable income at record levels

destabilizing event or another. In 2018,                                                                                 180%

                                                                          Household credit market to disposable income
market watchers are suddenly inclined to                                                                                 150%
choose confidence over question marks and                                                                                120%
seem emboldened following a decade of                                                                                    90%
distressing events.
                                                                                                                         60%
This newfound confidence might be unfamiliar and                                                                         30%
somewhat disconcerting because many of the unvanquished
                                                                                                                          0%
boogeymen from the past decade are materializing in new                                                                          1990       1993   1996         1999   2002    2005      2008       2011       2014      2017
ways. Central banks have fortified the financial system, but it                                                                                                                                    Source: OECD, February 2018.
is unclear how fiscal stimulus will be unwound in a smooth            FIGURE 2:
and painless fashion. Inflation is rising faster than expected,       Canadian Consumer Confidence Index
stoking worries that central banks will accelerate rate hike
                                                                                                                          130
schedules causing volatility in the stock markets. In Canada,
                                                                                                                          120
household debt levels are at record highs and increased
                                                                       Canada: 2014 = 100

                                                                                                                          110
mortgage carrying costs could have significant implications
                                                                                                                          100
for consumption and overall economic performance.
                                                                                                                           90
Globally, the end of quantitative easing could bring Europe
                                                                                                                           80
back into the spotlight as Italy becomes the focus of renewed
                                                                                                                           70
sovereign debt issues.
                                                                                                                           60
In addition to economic uncertainty, the potential for                                                                          Dec 2 015          Ju n 20 16          Dec 2 016           Ju n 20 17             Dec 2 017
exogenous shocks makes this 2018 outlook similar to others                                                                                                                Source: The Conference Board of Canada, February 2018.
from the past decade. Brexit, China and Russia’s growing              FIGURE 3:
influence, the resurgence of populism and U.S. political              Business Survey Outlook Indicator
instability are risks to just about any forecast at the moment.                                                             4
What is different about 2018 is the level of optimism from so                                                               3
many quarters in the face of so much uncertainty. And while                                                                 2
                                                                      Standardized Units

one can argue whether this enthusiasm might be misplaced,                                                                   1
Canadian commercial real estate remains one asset class                                                                     0
with real reason for optimism.                                                                                             -1
                                                                                                                           -2
                                                                                                                           -3
                                                                                                                           -4
                                                                                                                                  Dec 2 015          Ju n 20 16         Dec 2 016            Ju n 20 17            Dec 2 017
                                                                                                                                                                                        Source: Bank of Canada, February 2018.

© 2018 CBRE Limited                             CANADA REAL ESTATE MARKET OUTLOOK 2018                                                                                                                     CBRE RESEARCH

                                                                  5
CANADA
IN THE
SPOTLIGHT
At a time when selecting facts to fit a preferred world view is the norm, there are
relatively few ways to discredit the strength of Canadian commercial real estate
fundamentals. Canada has led G7 nations in GDP growth over the last decade Strong may not be a bold
and diverse job growth has driven unemployment below 6.0%. With solid enough term in this era of
employment prospects, wage growth and robust business spending, it should inflated rhetoric, especially
come as no surprise that commercial real estate fundamentals are strong. when one considers the
Canadian commercial real
estate records that were
set in 2017:
FIGURE 4:
Canada leads G7 nations in GDP growth over last decade
• Toronto and Vancouver recorded
the lowest downtown office
2007 - 2016 Cumulative GDP Growth 2017 Growth Forecast vacancy rates and industrial
20% 4%
3.0%
availability rates in North
15% 2.5% 3% America
2.2%
Cumulative 10Yr GDP Growth
2017 GDP Growth Forecast
1.8%
10% 1.5% 1.5% 1.6% 2% • Montreal posted over 1.9
million sq. ft. of positive net
5% 1%
absorption in 2017, a record
15.5% 13.7% 12.9% 11.6% 7.5% 5.2% amount of tenant demand
0% 0%
-5.4%
-5% -1% • National industrial average net
asking rents reached an all-time
-10% -2% high of $6.97 per sq. ft.
Canada United States Germany United France Japan Italy
Kingdom
• Canada recorded the highest
Source: OECD, February 2018. commercial real estate
FIGURE 5: investment volume in the
North American downtown office vacancy rates nation’s history at $43.1 billion,
12.9%
setting back-to-back annual
12.3% 12.5% records
11.7% 12.0%
9.9%
9.5% 9.7% • Canada was one of four nations
8.1% 8.1% 8.2% in the world to log back-to-back
all-time high investment
WASHINGTON, D.C.
5.8%
5.0% volumes, along with China,
PHILADELPHIA
SAN FRANCISCO
Spain and Netherlands
PITTSBURGH
MANHATTAN
3.7%
VANCOUVER
CHARLOTTE
MONTREAL
PORTLAND
TORONTO
DETROIT
OTTAWA
BOSTON
SEATTLE
• The national average cap rate
fell to a record low of 5.69%
Source: CBRE Research, Q4 2017.
© 2018 CBRE Limited CANADA REAL ESTATE MARKET OUTLOOK 2018 CBRE RESEARCH
6
CANADA IN THE SPOTLIGHT
Canada has had a prolonged moment in the spotlight since avoiding the worst of the global financial crisis. Historically seen as a
safe, diverse and welcoming nation for businesses and immigrants, that momentum has only intensified. Canada was recently
ranked second-best country in the world to live in by the U.S. News Report. The Economist Intelligence Unit listed Vancouver, Calgary
and Toronto amongst the five most liveable cities in the world, and Toronto is a short-list candidate for a global tech giant’s second
headquarters. A record number of tourists visited the country last year, including a remarkable 43.0 million visits to Toronto alone.
Canada’s international appeal and competitive dollar are expected to support record tourism in 2018.

      Overall best                                                                   World’s most
      countries ranking                                                              livable cities
      RANK            COUNTRY                                                        RANK        CITY              COUNTRY

      1               Switzerland                                                    1           Melbourne         Australia
      2               Canada                                                         2           Vienna            Austria
      3               Germany                                                        3           Vancouver         Canada
      4               United Kingdom                                                 4           Toronto           Canada
      5               Japan                                                          5           Calgary           Canada
      6               Sweden                                                         5           Adelaide          Australia
      7               Australia                                                      7           Perth             Australia
      8               United States                                                  8           Auckland          New Zealand
      9               France                                                         9           Helsinki          Finland
      10              Netherlands                                                    10          Hamburg           Germany

                                       Source: U.S. News & World Report, 2018.                               Source: Economist Intelligence Unit, 2017.

© 2018 CBRE
       CBRE Limited
            Limited                                     CANADA REAL ESTATE MARKET OUTLOOK 2018                                        CBRE
                                                                                                                                      CBRE RESEARCH
                                                                                                                                           RESEARCH

                                                                                 7
THE RISING
COST OF THE
CANADIAN
DREAM
Canada is in demand. From those pursuing education to

                                                                                      310,000
employment, investment and travel, the flow of capital and
people bodes well for Canadian commercial real estate in
2018 and beyond.
Foreign students continue to enroll in    time when other nations are intensely       New permanent residents
Canadian universities in record           divided over immigration, Canada            in Canada in 2018
numbers as they pursue quality            appears to have found the right
education, high standards of living and   balance. This is crucial to Canada’s
employment opportunities once their       future economic growth. The country         FIGURE 6:
studies are complete. More broadly,       now has more seniors than children          Canadian Immigration Levels
increased immigration targets will        under the age of 14 so immigration will
produce 310,000 new permanent             be essential if the economy is to grow       2020 340,000
Canadian residents in 2018 as part of     and to allow businesses to access a
an overall plan to accept over 1.0        diverse and highly-skilled workforce.        2019 330,000
million new immigrants by 2020. At a                                                   2018 310,000

                                                                                       2017 300,000

                                                                                                          Source: CBC News, February 2018.

© 2018 CBRE Limited                          CANADA REAL ESTATE MARKET OUTLOOK 2018                                  CBRE RESEARCH

                                                               8
THE RISING COST OF THE CANADIAN DREAM

                                                                  Commercial
Both people and capital are flowing towards urban areas,
especially Toronto, Vancouver and Montreal, and with
increasing demand comes increasing costs. The result is

                                                                  property
the Canadian dream is getting more expensive. This is less
intimidating as business real estate costs will remain a
fraction of total business costs. Any increase in rental rates,

                                                                  costs will
especially for office and industrial space, are likely to be
outweighed by the benefits of operating in a growing
economy with access to a talented workforce.
For individuals, rising costs related to real estate could be
more difficult to bear, despite low unemployment and solid
wage growth. Supply issues are exacerbating challenges on
                                                                  remain a
the housing front and low vacancy rates for apartments in
major cities will continue to drive up rents. Renters will
likely have to shoulder these costs, or take on roommates,
                                                                  fraction of
                                                                  total business
as purchasing a condo or home will continue to be out of
reach for many in Canada’s largest cities. Domestic
travelers will also experience rising costs. Increased

                                                                  costs.
business travel along with strong growth in both domestic
and international tourism is forecast to produce the fourth
consecutive year of record hotel occupancy rates, which
will push room rates and profits higher.

   VANCOUVER                                                                              TORONTO
   +2%                                                                                    +1%

       Multifamily rents forecast to rise in 2018 according to CMHC

                                                                                              Source: CMHC, February 2018.

© 2018 CBRE Limited                              CANADA REAL ESTATE MARKET OUTLOOK 2018            CBRE RESEARCH

                                                                   9
NEW RULES
OF THE
GAME

The nine-year bull run for Canadian commercial real estate has been defined by declining vacancy
rates, accelerating rental rate growth, rising property values and increasing capital allocations for
real estate. There have been more winners than losers in this extended cycle and some are now
asking the question: how much longer can this last? Rather than attempting to time the market or
choosing which inning of the cycle we are in, our forecast suggests considering the possibility that
the very rules of the game have changed.
Institutional capital, backed by incisive         volumes grew again in 2017 and the push     Some are also of the opinion that the
analysts, big data and ample capital, is          to reinvent malls and intensify transit     global economy is overdue for a recession.
traditionally viewed as the ‘smart money’         oriented retail properties is expected to   Canada is in the midst of the third longest
in the market. Pension funds are not              ramp up in 2018. These are encouraging      period of economic expansion in history.
shying away from commercial real estate           trends for those hoping for a few more      However, when measured by cumulative
late in the cycle. In fact, allocations to real   innings in the cycle.                       GDP growth per capita over the same
estate are expected to climb to 14.0-16.0%                                                    period, this cycle sits in the middle of the

                                                  14-16%
in the next five years. Retail, which is                                                      pack. The economy is more diverse than
viewed as the commercial property type                                                        at any other point since the recession in
most at risk from technological                                                               2008. Technology, natural resources and
innovation, is a sought-after property                                                        professional services are all driving
type by investors. Retail investment               Real estate allocations by 2023            growth, which leaves room for expansion
                                                                                              and mitigates risk in the event of a
                                                                                              downturn.
                                                                                              But what about the dark clouds on the
                                                                                              horizon? With an ongoing softwood
                                                                                              lumber trade dispute, NAFTA
                                                                                              negotiations, the failure of Sears Canada
                                                                                              and discounted Canadian oil prices, there
                                                                                              are risks to commercial real estate
                                                                                              fundamentals. That said, these risks, and
                                                                                              the fears that they produce, may not
    Which inning of the cycle are we in?                                                      account for the new realities of the
                                                                                              Canadian economy.
    Our forecast suggests considering the possibility that
    the very rules of the game have changed.

© 2018 CBRE Limited                                CANADA REAL ESTATE MARKET OUTLOOK 2018                                  CBRE RESEARCH

                                                                     10
NEW RULES OF THE GAME
FIGURE 7: Duration (Months) – U.S. 120 Cumulative GDP per Capita 63.4%
Third longest 103 106 Growth - CANADA
period of 92
73 37.9%
economic 58 31.1%
expansions 21.6% 22.6%
16.9%
1975 Q1- 2001 Q4- 1982 Q4- Current 1961 Q1- 1991 Q1- 2001 Q4- Current 1975 Q1- 1982 Q4- 1991 Q1- 1961 Q1-
1980 Q1 2007 Q4 1990 Q3 1969 Q4 2001 Q1 2007 Q4 1980 Q1 1990 Q3 2001 Q1 1969 Q4
Source: BEA, NBER, CIBC, Statistics Canada, February 2018.
LET’S PUT THE RISKS IN PERSPECTIVE:
• New tariffs on Canadian old, light manufacturing
softwood lumber are having a buildings to support same-day
sq. ft.
ft3
marginal impact on an delivery. This type of delivery
increasingly diversified B.C. service will be needed regardless
economy. This would not have of the outcome of NAFTA
been the case in the 1980s and negotiations. In 2018, the
90s. In general, the Canadian increased focus on distribution Prime locations in major markets
economy is more diverse than in could result in a shift towards have been repurposed for better
previous decades, which provides industrial assets being valued on uses and have been leased out at
a buffer to economic shocks. a ft.3 basis rather than sq. ft., higher rates. Tertiary malls, like
22.1%
reflecting the growing importance all non-core real estate, face
of overall space utilization that challenges from a tenant and
stacking technology brings. investment perspective, which
exists despite technological
Approx. amount of national GDP FIGURE 8: disruption.
is Canadian exports to the U.S. Industrial new supply
• While oil and gas extraction
2017 10 MSF
• The possibility of the U.S. exiting accounted for the majority of
NAFTA has raised concerns about 2016 13 MSF Canadian GDP growth during
various sectors of the economy, the global recession, this sector
2015 23 MSF
especially the industrial market. has had to retool in the face of
Canadian exports to the U.S. 2014 15 MSF lower oil prices. New efficiencies
account for approximately 22.1% have been found and production
2013 17 MSF
of national GDP and industrial costs are decreasing. Oil prices
space is the staging ground for 2012 15 MSF are not expected to return to
much of this cross-border trade. pre-recession levels and even if
Source: CBRE Research, Q4 2017.
However, over the past decade, prices were to increase
Canada’s manufacturing sector • For some, the failure of Target marginally, the GDP gains would
has been on the decline. The followed by Sears Canada’s exit not likely reflect a significant
majority of the industrial universe was a tangible example of the uptick in Alberta employment.
is now geared towards logistics ongoing churn in the retail These are the new realities for
and distribution activity for market. Questions are now being Canada’s energy markets, which
domestic consumption and raised about the viability of other already have a few years of
annual new supply is at a six-year department stores in the face of innovating and retooling under
low which adds further stability to growing online sales; however, their belts.
the market. Furthermore, there is retail landlords have largely
a significant push to revitalize shrugged off the demise of Sears.
© 2018 CBRE Limited CANADA REAL ESTATE MARKET OUTLOOK 2018 CBRE RESEARCH
11NEW RULES OF THE GAME
VS
It is possible to identify risks to the economy and
commercial real estate fundamentals, but these risks may
have a muted impact as a result of a diversifying economy.
The rules of the game have changed. There is the potential
for the cycle to continue and it may take an unlikely
combination of risks or another black swan event to
produce a knockout punch for this bull run.
© 2018 CBRE Limited CANADA REAL ESTATE MARKET OUTLOOK 2018 CBRE RESEARCH
12RISING
INTEREST
IN INTEREST
RATES
There has never been a period of rising interest rates that has not FIGURE 9:
Increased key
resulted in a recession and the unwinding of quantitative easing
makes the prospect of higher rates all the more important. The
overnight rate 1.25%
three times JAN 17, 2018
one factor that remains a determining factor for the commercial since July 2017
real estate market and economy writ large is interest rates.
1.00%
The Bank of Canada has increased the key Despite rising rates and narrowing SEP 6, 2017
overnight rate three times since July 2017 spreads, it is reassuring that Blackstone,
and this is a significant shift for the world’s leading private equity firm,
commercial real estate investors and
user-owners. The spread between 10-Year
started 2018 by purchasing one of
Canada’s largest industrial REITs. This is
0.75%
JUL 12, 2017
Canada Bonds and the overall cap rate for especially notable given that cap rates for
Canadian commercial properties has industrial properties are amongst the
shrunk; however, the remaining spread lowest of any asset class. Blackstone’s Source: Bank of Canada, February 2018.
and historic track record for reliable focus on industrial properties might not
returns will continue to entice investors represent belief in all commercial FIGURE 10:
to commercial real estate in 2018. property types and all Canadian markets, Number of 35+
deals over 28
but it does show that sophisticated $100 million
It would be a mistake to conflate “higher”
interest rates with “high” interest rates,
players will still be able to identify 18
opportunities in 2018 and that Foreign
but stricter underwriting is likely in 2018.
commercial valuations have runway Investment
Landlords need to focus on operations to 2015 2016 2017
for growth.
drive value. Rising interest rates will Source: CBRE Research, 2017.
increase carrying costs, but this will be
partially offset by the upward trajectory of
rental rates for multiple asset classes. FIGURE 11:
Spread between bonds and cap rates have shrunk
Increased scrutiny will also spread to
12%
foreign purchases, which have driven the
investment market in recent years. The 10%
211 bps
number of >$1.0 billion mega purchases
8%
by foreign entities is expected to decrease 426 bps
Cap Rate
in 2018, but the total number of deals that 6% 5.69%
231 bps
they execute is expected to climb. The 465 bps
4% 365 bps
Chinese capital that was looking to enter
Canada in years past is now being much 2% 2.04%
10-yr GoC Bond Yield National Average Cap Rate
more selective, but will remain active.
0%
1990
1991
1992
1993
1994
1995
1996
1997
1998
1999
2000
2001
2002
2003
2004
2005
2006
2007
2008
2009
2010
2011
2012
2013
2014
2015
2016
2017
Source: Bank of Canada, CBRE Research, Q4 2017.
© 2018 CBRE Limited CANADA REAL ESTATE MARKET OUTLOOK 2018 CBRE RESEARCH
13TECHNOLOGY:
WAKE UP
CALL OR
ALARM BELLS?
Real estate has been slow to adopt technological solutions due in part to a lack of data and a perceived
disconnect between landlords and their tenants’ day-to-day activities. While this has been the case up
until now, the proliferation of big data is encouraging owners, building managers and brokerage firms
to better leverage tenant information. In 2018, expect to see increased collection of data around
business practices and individual preferences in order to develop new real estate strategies.
The institutionalization of real estate, entire neighbourhood. This type of
which has provided stability to the project, while groundbreaking now, will
industry, should facilitate the adoption of act as a blueprint for other municipalities
new technologies. Sophisticated, well- moving forward.
DIGITAL
resourced landlords will be able to CATALOGUE
Blockchain looks poised to disrupt
leverage tenant data to optimize
established practices and, while still in
operations and design investment
the early stages for real estate, this
strategies. WeWork, a trailblazer in many VALUATIONS
technology will move from theoretical to
respects, has shown that tenants are
practicable in the year ahead. Blockchain
increasingly comfortable with landlords
will create efficiencies and provide rich,
becoming more integrated into their daily
real-time, open-sourced data to a variety
routines. From backend support,
of users and stakeholders involved in real
including HR and finance, to providing
estate and city building projects. A digital
onsite services and amenities, landlords
catalogue containing, amongst other
have a huge opportunity to obtain even
things, lease documents, sale transaction
more detailed information on their
details and building inspection reports,
tenants’ needs. LEASE
could dramatically speed up decision DOCUMENTS
The increased availability of data will making and transform some segments of
begin to have tangible impacts on the market. BUILDING
everything from built form to business INSPECTIONS
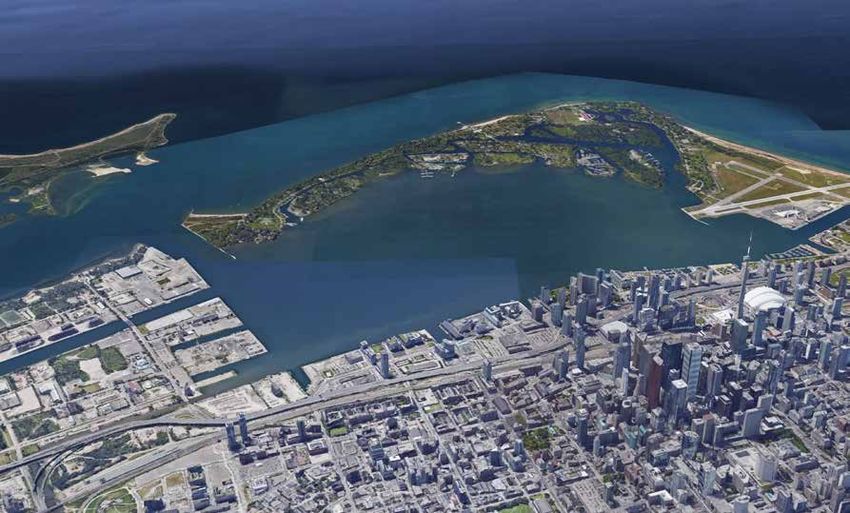
processes. The Internet-of-Things is
taking on a physical presence as designs
for Toronto’s Eastern Waterfront take
shape. Sensors in this district will
monitor the flow of people and goods and
could enhance the performance of the
SALE
TRANSACTIONS
© 2018 CBRE Limited CANADA REAL ESTATE MARKET OUTLOOK 2018 CBRE
CBRE RESEARCH
RESEARCH
14TECHNOLOGY: WAKE UP CALL OR ALARM BELLS?
Autonomous vehicles will prove to be one of the largest changes The most tangible impact of technology in the year ahead will be
to human transportation in history. With mass production of a its impact on leasing and new demand for space. In Vancouver,
Level Four autonomous vehicle scheduled for 2019, the change tech firms accounted for over 50.0% of office space requirements
will arrive in North America quicker than most realize. Driverless in 2017. This number was equally impressive in Toronto where,
vehicles will quickly eradicate the need for the personal regardless of a more diverse regional economy, tech firms
ownership and storage of cars as subscription services will accounted for 20.0% of office space requirements. Given that
provide access to cars on-demand. Although not an immediate tech firms only currently occupy 4% of all office space in
issue for 2018, some landlords are already looking at the Downtown Toronto, it is evident that this sector is having an
implications for their portfolios including how much space they outsized effect on demand. Tech will continue to drive demand
dedicate to parking in new developments, how to repurpose and for office space in 2018, including the possibility of a tech firm
revalue parking in existing developments and how they can anchoring one of the new developments to be built over the
facilitate passenger drop-offs from driverless vehicles. course of the next construction cycle.
Landlords are re-examining
parking requirements and
planning for autonomous
vehicle drop-offs.
© 2018 CBRE Limited CANADA REAL ESTATE MARKET OUTLOOK 2018 CBRE RESEARCH
15TECHNOLOGY: WAKE UP CALL OR ALARM BELLS?
FIGURE 12:
Tech users in the market
20% The real estate
50% industry needs
to embrace
VANCOUVER TORONTO
Source: CBRE Research, 2017.
technology
Tech will also be the largest agent of
change in the industrial and retail
The current and potential impacts
of technology are difficult to
and set the
markets in 2018, regardless of the
ongoing NAFTA negotiations. Look
encapsulate, especially as one looks
beyond 2018. Technology is
terms of the
for Canada to continue to close the
online retail sales gap with the U.S.,
ubiquitous and is raising the stakes
for so many components of the forthcoming
where 9.0% of retail sales are made commercial real estate market.
online compared to 7.5% of sales in
Canada. Retailers and landlords will
Landlords, tenants and investors all
need to stay engaged and forward
transformation.
increasingly focus on omnichannel thinking. The industry that
solutions as shopping habits are eschewed technology for so long
fundamentally changing. The now needs to champion it and state
difference between winning and some of the terms of the
losing in the retail market moving forthcoming transformation.
forward will be the ability to adjust Otherwise, new entrants, with
to these changes. Expect 2018 to be different objectives to the
the year in which urban distribution established players, will set the pace
centres and pick-up points shape of change and determine who are
industrial leasing demand and winners.
construction activity. While logistics
are driving the industrial market FIGURE 13:
from coast to coast, it is no longer as 2017 online sales
simple as building massive
suburban facilities with impressive
sorting technologies. The
distribution network across urban
areas will begin to take shape in the
year ahead and previously obsolete 7.5% 9.0%
CANADA U.S.
urban industrial locations may see TOTAL
new life. TOTAL
SALES SALES
Source: eMarketer, 2018.
© 2018 CBRE Limited CANADA REAL ESTATE MARKET OUTLOOK 2018 CBRE RESEARCH
162018:
RUNWAY FOR
OPPORTUNITY
Canadian commercial real estate is poised to
maintain its prolonged moment in the spotlight “Everyone has
through 2018. Canada is a leading destination for
capital, businesses and immigrants, which is their day and
diversifying the economy, bolstering property
fundamentals and providing a buffer to the spate some days
of economic and geopolitical risks that exist. The
rules of the game are changing and so too must
last longer
our expectations for market cycles, technological
implementation, built form and business
than others.”
processes. While the bull market may still have ~ WINSTON CHURCHILL
legs, it is imperative that landlords, tenants and
investors all stay vigilant and forward looking in
these dynamic times.
© 2018 CBRE Limited CANADA REAL ESTATE MARKET OUTLOOK 2018 CBRE RESEARCH
17N AT IONAL STATISTICS
CANADA
Office Investment
Vacancy Rate 11.2% 11.1% 11.0% Office $7,752 $10,195 $9,871
Class A Net Asking Rent (per sq. ft.) $22.64 $21.91 $21.13 Industrial $5,794 $7,406 $9,267
Net Absorption (million sq. ft.) 0.49 3.18 2.43 Retail $6,780 $9,217 $8,216
New Supply (million sq. ft.) 4.70 3.61 2.68 Multifamily $5,682 $6,284 $6,643
Under Construction (million sq. ft.) 6.65 6.67 6.94 ICI Land $5,150 $6,997 $7,168
Hotel* $3,548 $2,961 $1,904
Total $34,706 $43,060 $43,069
Vacancy Rate 15.7% 15.3% 14.8%
Class A Net Asking Rent (per sq. ft.) $18.50 $17.63 $17.33
Net Absorption (million sq. ft.) 1.17 3.11 3.42 Office - Downtown Class A (%) 5.94 5.90 5.90
New Supply (million sq. ft.) 4.37 2.38 2.88 Office - Suburban Class A & B (%) 6.91 6.84 6.83
Under Construction (million sq. ft.) 3.12 4.27 3.96 Industrial - Class A & B (%) 6.41 6.13 6.07
Retail - Neighbourhood (%) 6.30 6.25 6.20
Multifamily - High Rise Class B (%) 4.94 4.66 4.66
Vacancy Rate 13.2% 13.0% 12.7%
Hotel - Downtown Full Service (%) 7.90 7.51 7.51
Class A Net Asking Rent (per sq. ft.) $20.15 $19.38 $19.33
*Market and surrounding region
Net Absorption (million sq. ft.) 1.66 6.29 5.85 Source: CBRE Research, 2018.
New Supply (million sq. ft.) 9.07 5.99 5.56
Under Construction (million sq. ft.) 9.76 10.94 10.90
Multifamily
Source: CBRE Research, 2018.
Vacancy Rate 3.3% 2.9% 3.3%
Industrial 2-Bedroom Average Rent $1,144 $1,172 $1,198
New Rental Supply (units) 23,565 22,872 24,210
Availability Rate 5.1% 4.1% 3.8%
Source: CMHC, CBRE Research, 2018.
Net Asking Rent (per sq. ft.) $6.61 $6.97 $7.13
Sale Price (per sq. ft.) $115 $123 $133
Net Absorption (million sq. ft.) 20.34 23.67 19.10
Hotel
New Supply (million sq. ft.) 13.26 9.62 14.25
Under Construction (million sq. ft.) 11.19 13.75 15.04 Inventory (Rooms) 388,759 392,883 399,436
Source: CBRE Research, 2018.
Occupancy 64.0% 66.0% 66.0%
Average Daily Rate $148.00 $155.00 $161.00
Retail Source: CBRE Research, 2018.
Total Retail Sales per Capita $15,203 $16,039 $16,269
Total Retail Sales Growth 5.1% 6.7% 2.4%
Mall Sales Productivity (per sq. ft.) $761 $770 $771
New Supply (million sq. ft.) 6.88 4.59 4.96
Source: CBoC, ICSC, CBRE Research, 2018.
© 2018 CBRE Limited CANADA REAL ESTATE MARKET OUTLOOK 2018 CBRE RESEARCH
18R E G IONAL O U T LOOK
RE GIONAL OUTLOOK

                      VANCOUVER

                                                  KEY TRENDS
•    Commercial real estate investment volumes in Vancouver               •   Record low vacancies and a 13.7% year-over-year increase
     climbed to a record $11.7 billion in 2017, an increase of                in net asking rents dominated the industrial headlines in
     44.9% from 2016. The increased investment activity was                   2017. Availability rates are expected to continue trending
     driven by unprecedented demand from well-capitalized                     downwards over the next year and current projections show
     private and institutional investors. The market looks poised             them reaching 2.0%. Under these conditions net rental
     to continue on this path into early 2018, although changes               rates could increase as much as 10.0% in 2018. Elevated
     to Bank of Canada monetary policy could have effects on                  consumer confidence and a strong economic outlook may
     cap rates going forward.                                                 translate to higher costs for the consumer, as companies
                                                                              look for ways to recoup their increased fixed costs.
•    Real estate fundamentals in the downtown office market
     continue to tighten. Absorption of space from the previous           •   Luxury retailers are performing well in Vancouver due to
     construction cycle has driven the vacancy rate in downtown               the continued influx of international tourism and a robust
     Vancouver to 5.0% and, with no meaningful new supply                     and diversified regional economy. New retail entrants like
     coming on stream until 2022, landlords are pricing                       Officine Panerai, Van Cleef & Arpels and IWC Schaffhausen
     competitively. Net asking rents in the central business                  continue to target Vancouver and have raised the profile of
     district continue to climb and can at times exceed $50 per               the 1000 block of Alberni which, with limited vacancy, has
     sq. ft. for top end Class AA space.                                      driven up rents. Such pressures may encourage the
                                                                              development of another luxury enclave outside of Alberni
•    Vancouver has reached critical mass where tech tenants
                                                                              over the next few years.
     now constitute a significant portion of the overall office
     landscape. The growth of both the Mount Pleasant and                 •   After years of rising home ownership costs, the provincial
     Broadway corridors as hotbeds for technology clustering                  government implemented several new housing policies in
     has attracted new international firms, as well as talent from            2017. While the new regulations have cooled the market in
     across Canada and abroad.                                                some regards, bifurcation remains across residential
                                                                              property types. New mortgage qualification rules adopted
•    Industrial developers are future-proofing their new
                                                                              nationally and the City of Vancouver’s plans to tax vacant
     speculative projects, keeping technological advancements
                                                                              properties locally, should temper home ownership demand
     and the rising importance of ecommerce in mind. Greater
                                                                              in 2018, although to what degree remains to be seen.
     use of automation and machine robotics will force
     developers to place a greater emphasis on clear height,
     shifting the industry standard towards 36’. Lack of available
     land will continue to push land values up together with
     spurring more entrepreneurial industrial developments
     within Vancouver moving forward.

© 2018 CBRE Limited                             CANADA REAL ESTATE MARKET OUTLOOK 2018                                      CBRE RESEARCH

                                                                     20
P ROJECTS TO WATCH
VANCOUVER
Delta iPort
Delta iPort’s buildings 2 and 3 are the newest large bay spaces for build-to-suit
tenants over 200,000 sq. ft. They will have significantly lower drayage costs in
comparison to all other options because of its proximity to the Deltaport. This
project is the largest new spec delivery to the market underway at this time and
will effectively create a new submarket due to its unique location. It is also the first
industrial project by an institutional developer on First Nation Lands in history.
Vancouver Centre II
Vancouver Centre II is a traditional style, 33-storey, Class AAA, 371,000 sq. ft. office
building being constructed by Great West Life Realty Advisors on behalf of the
Healthcare of Ontario Pension Plan. It is the first downtown building being built
on spec in this wave of construction, ending a three year hiatus and signifying the
start of the next office construction cycle in Vancouver. Expect further
construction in the subsequent years as 400, 401 and 349 West Georgia Street and
the central distribution branch of the Vancouver public library construction
projects bring further vibrancy to the area.
565 Great Northern Way
PCI is laying the groundwork for the transformation of the False Creek Flats
neighbourhood with the construction of their new 160,000 sq. ft. office building at
565 Great Northern Way. The neighbourhood comprises over 450 acres of land
located less than four kilometers to both downtown and the port of Metro
Vancouver. Over the last year, the city has made significant plans to develop this
empty space with more linkages, public spaces, public transit and commerce. The
neighbourhood has the potential to become a thriving community due to talent
emanating from the new Emily Carr University campus, the centre for Digital
Media, St Paul’s hospital, neighbouring technology and creative companies such
as Mountain Equipment Co-op and its proximity to downtown. This building will
also set the foundation for several additional successive developments by the same
company at 887 and 901 Great Northern Way.
© 2018 CBRE Limited CANADA REAL ESTATE MARKET OUTLOOK 2018 CBRE RESEARCH
21RE GIONAL STATISTICS
VANCOUVER
Office Investment
Vacancy Rate 7.7% 5.0% 4.9% Office $2,220 $2,388 $2,400
Class A Net Asking Rent (per sq. ft.) $30.25 $31.77 $32.73 Industrial $1,185 $1,394 $1,400
Net Absorption (million sq. ft.) 0.47 0.70 0.38 Retail $1,608 $3,599 $1,850
New Supply (million sq. ft.) 0.00 0.09 0.37 Multifamily $1,100 $1,259 $1,350
Under Construction (million sq. ft.) 0.76 0.82 0.73 ICI Land $1,567 $2,693 $2,750
Hotel* $393 $362 $325
Total $8,073 $11,695 $10,075
Vacancy Rate 13.8% 9.6% 8.0%
Class A Net Asking Rent (per sq. ft.) $23.57 $22.62 $23.30
Net Absorption (million sq. ft.) 0.13 1.11 1.32 Office - Downtown Class A (%) 3.75 - 4.25 3.75 - 4.25 3.75 - 4.25
New Supply (million sq. ft.) 0.68 0.13 1.04 Office - Suburban Class A & B (%) 4.75 - 5.50 4.50 - 5.75 4.50 - 5.75
Under Construction (million sq. ft.) 0.85 0.96 1.63 Industrial - Class A & B (%) 4.50 - 5.50 4.00 - 5.25 4.00 - 5.25
Retail - Neighbourhood (%) 5.00 - 5.50 5.00 - 5.50 5.00 - 5.50
Multifamily - High Rise Class B (%) 3.00 - 3.50 3.00 - 3.50 3.00 - 3.50
Vacancy Rate 10.8% 7.3% 6.5%
Hotel - Downtown Full Service (%) 5.50 - 6.50 4.50 - 6.00 4.50 - 6.00
Class A Net Asking Rent (per sq. ft.) $25.48 $25.05 $26.83
*Market and surrounding region
Net Absorption (million sq. ft.) 0.60 1.81 1.70 Source: CBRE Research, 2018.
New Supply (million sq. ft.) 0.68 0.22 1.40
Under Construction (million sq. ft.) 1.60 1.78 2.36
Multifamily
Source: CBRE Research, 2018.
Vacancy Rate 0.7% 0.9% 1.0%
Industrial 2-Bedroom Average Rent $1,450 $1,552 $1,610
New Rental Supply (units) 3,032 4,245 4,384
Availability Rate 3.9% 2.3% 2.0%
Source: CMHC, CBRE Research, 2018.
Net Asking Rent (per sq. ft.) $9.00 $10.23 $10.59
Sale Price (per sq. ft.) $204 $280 $307
Net Absorption (million sq. ft.) 4.01 4.79 4.32
Hotel
New Supply (million sq. ft.) 3.63 3.14 3.85
Under Construction (million sq. ft.) 4.24 4.17 3.09 Inventory (Rooms) 23,929 24,066 24,159
Source: CBRE Research, 2018.
Occupancy 79.0% 79.0% 80.0%
Average Daily Rate $174.00 $190.00 $202.00
Retail Source: CBRE Research, 2018.
Total Retail Sales per Capita $14,146 $15,277 $15,559
Total Retail Sales Growth 6.6% 10.0% 3.4%
Mall Sales Productivity (per sq. ft.) $1,053 $1,059 $1,070
New Supply (million sq. ft.) 2.20 0.89 0.52
Source: CBoC, ICSC, CBRE Research, 2018.
© 2018 CBRE Limited CANADA REAL ESTATE MARKET OUTLOOK 2018 CBRE RESEARCH
22RE GIONAL OUTLOOK
CALGARY
KEY TRENDS
• After two years of recession, Calgary’s economy seems to be • There was a marked shift in Calgary’s retail vacancy rate
on the rebound as GDP grew by 6.9% in 2017 and is when Sears Canada closed its doors and gave back 650,000
expected to grow again in 2018. The unemployment rate sq. ft. of space to the market in 2017. The vacancy rate
has decreased from 9.4% to 8.7% since 2016 and job increased from 3.5% to 6.5% since mid-year 2017, with
growth is expected to expand by 2.0% in 2018. However, Sears alone accounting for 61% of the upswing. Active
Calgary’s unemployment rate is forecast to remain above categories in the market continue to be fitness, food and
the national average until 2021. medical/wellness tenancies. On the other hand, high-end
restaurants and mid-tier clothiers continue to suffer. The
• Following a relatively flat year in the Calgary office market,
increase of the minimum wage to $13.60 per hour and
characterized by small deal sizes and M & A activity, we can
mandatory vacation pay are adding additional pressure on
expect another flat year in 2018. Despite improvements to
businesses, and the upward trend in additional rent costs
the overall Calgary economy, downtown energy companies
continue to cause consternation among tenants.
have, and will continue to, decrease the size of their
footprints due to consolidation and asset rationalization. • The strong investment activity in 2017, particularly in the
With some green shoots popping up, smaller deal sizes office asset class, is expected to continue into 2018. The
under 15,000 sq. ft. will continue to make up the majority prevalent gap between vendor and buyer expectations in
of the market activity. the previous recession years has narrowed to a healthy level
where favourable deal terms are met by both parties
• The Calgary industrial market will continue to be the
involved. We expect robust demand for all asset classes with
strongest asset class in 2018. Four consecutive quarters of
an emphasis on strong tenant industrial, grocery-anchored
positive net absorption totaling nearly 2.5 million sq. ft.,
retail and multi-family product.
have generated optimism and confidence in the future of
the industrial market. After a period of minimal new supply
following Calgary’s “super cycle”, construction activity has
begun once again. There is nearly 2.3 million sq. ft. of new
product slated for completion by Q4 2018, leaving a few
quarters to absorb some of the existing inventory.
© 2018 CBRE Limited CANADA REAL ESTATE MARKET OUTLOOK 2018 CBRE RESEARCH
23P ROJECTS TO WATCH
CALGARY
Calgary Southwest Ring Road
The Southwest Calgary Ring Road will be built between Highway 8 and Macleod
Trail SE and includes the reconstruction of Glenmore Trail from Sarcee Trail to
east of 37 Street SW. This extensive infrastructure project is estimated to cost $1.4
billion and will benefit local businesses which rely on ground transportation for
their operations via improved traffic and less congestion. Preliminary construction
began in the summer of 2016 with major construction following in the spring of
2017; completion is expected in late 2021.
Speculative BMO Convention
Centre Expansion
BMO Centre, the largest convention centre in Alberta measuring the 500,000 sq.
ft., is set to double in size in a proposed $500 million expansion plan pending
government approvals. Once completed, BMO Centre will total approximately one
million sq. ft. and be upgraded to a Tier 1 facility that can compete with
Vancouver, Toronto and Montreal for larger international events. The project is
estimated to create 1,800 construction jobs, 500 tourism related positions and
contribute $73 million per year to the Albertan economy.
Potential New Arena
Proposed construction of a new arena to replace the 35-year-old Scotiabank
Saddledome in Victoria Park, the second oldest in the NHL, has led to heated
discussions between the Calgary Mayor, Naheed Nenshi, and the Calgary Sports
and Entertainment Corporation (CSEC). Currently at a stalemate, the estimated
$500 million project would result in a new 19,000 seat event centre and a
neighbouring 5,000 seat practice facility. A modern arena would translate to
improved tourism revenues and the ability to host larger national and
international sporting events.
© 2018 CBRE Limited CANADA REAL ESTATE MARKET OUTLOOK 2018 CBRE RESEARCH
24RE GIONAL STATISTICS
CALGARY
Office Investment
Vacancy Rate 25.0% 27.7% 27.9% Office $655 $843 $885
Class A Net Asking Rent (per sq. ft.) $19.19 $17.89 $17.50 Industrial $623 $717 $751
Net Absorption (million sq. ft.) (2.08) (0.11) (0.10) Retail $513 $425 $445
New Supply (million sq. ft.) 1.15 1.40 0.00 Multifamily $248 $346 $345
Under Construction (million sq. ft.) 1.83 0.43 0.43 ICI Land $522 $519 $519
Hotel* $3 $42 $44
Total $2,563 $2,892 $2,989
Vacancy Rate 21.4% 22.3% 22.6%
Class A Net Asking Rent (per sq. ft.) $20.75 $20.11 $19.11
Net Absorption (million sq. ft.) 0.03 0.03 0.10 Office - Downtown Class A (%) 6.25 - 7.00 6.25 - 7.00 6.25 - 7.00
New Supply (million sq. ft.) 0.82 0.48 0.22 Office - Suburban Class A & B (%) 6.25 - 8.00 6.25 - 8.25 6.25 - 8.25
Under Construction (million sq. ft.) 0.56 0.22 0.07 Industrial - Class A & B (%) 5.00 - 6.75 5.00 - 6.50 5.00 - 6.50
Retail - Neighbourhood (%) 5.25 - 5.75 5.25 - 5.75 5.25 - 5.75
Multifamily - High Rise Class B (%) 4.25 - 5.00 4.50 - 5.00 4.50 - 5.00
Vacancy Rate 23.7% 25.7% 25.9%
Hotel - Downtown Full Service (%) 7.75 - 8.75 7.00 - 8.75 7.00 - 8.75
Class A Net Asking Rent (per sq. ft.) $19.90 $18.72 $18.02
*Market and surrounding region
Net Absorption (million sq. ft.) (2.06) (0.07) 0.00 Source: CBRE Research, 2018.
New Supply (million sq. ft.) 1.97 1.88 0.22
Under Construction (million sq. ft.) 2.39 0.65 0.50
Multifamily
Source: CBRE Research, 2018.
Vacancy Rate 7.0% 6.3% 6.0%
Industrial 2-Bedroom Average Rent $1,258 $1,247 $1,250
New Rental Supply (units) 2,437 1,414 679
Availability Rate 9.8% 8.2% 7.9%
Source: CMHC, CBRE Research, 2018.
Net Asking Rent (per sq. ft.) $7.08 $7.04 $7.08
Sale Price (per sq. ft.) $170 $165 $168
Net Absorption (million sq. ft.) (1.11) 2.46 2.40
Hotel
New Supply (million sq. ft.) 1.21 0.48 2.29
Under Construction (million sq. ft.) 0.24 1.87 2.10 Inventory (Rooms) 14,929 15,529 16,183
Source: CBRE Research, 2018.
Occupancy 59.0% 59.0% 59.0%
Average Daily Rate $145.00 $143.00 $145.00
Retail Source: CBRE Research, 2018.
Total Retail Sales per Capita $19,707 $21,005 $21,169
Total Retail Sales Growth 1.1% 8.9% 2.6%
Mall Sales Productivity (per sq. ft.) $788 $774 $776
New Supply (million sq. ft.) 0.90 0.46 1.29
Source: CBoC, ICSC, CBRE Research, 2018.
© 2018 CBRE Limited CANADA REAL ESTATE MARKET OUTLOOK 2018 CBRE RESEARCH
25RE GIONAL OUTLOOK
E D M O N TO N
KEY TRENDS
• Investor demand in the Edmonton market is increasing for towers, have been built, while Stantec Tower is still under
appropriately priced assets as leasing fundamentals construction and slated for completion in 2018. The
continue to improve. The lack of core product for sale has construction of ICE District, one of Canada’s largest
kept institutional investors on the sidelines and led to an mixed-use developments, has shifted the city’s core to 104
almost exclusively private buyer market in 2017. However, Avenue and 101st Street. Being overshadowed by three new
downtown Edmonton is beginning to see institutional state-of-the-art towers, downtown landlords have
interest again. In the previous business cycle, numerous embarked on capital improvement campaigns to renovate
business owners were in the market looking to acquire their older properties. In 2017, the Financial Building and Harley
own buildings, but were faced with a scarcity of available Court pioneered repurposing efforts for functionally
product. In this cycle, users have been more successful and obsolete office space in the core. In the coming years, up to
demand is expected to remain strong into 2018. Small to five additional towers could be repurposed or redeveloped.
mid-sized buildings coming to market are generally selling • Despite an overall increase in ecommerce activity across
quickly and it is not uncommon for multiple offers to be Canada, the retail market in Edmonton has remained
submitted. stable. Food and drug anchored sites are in high demand
• Space requirements from energy tenants are increasing as with cap rates comparable to pre-recession times. The retail
the price of oil continues to rise and companies continue to market has also seen growth from the new cannabis
restructure to improve efficiency. Positive absorption is industry. With the legalization of recreational cannabis use
expected in oil and gas markets this year with companies in Canada slated for July 1st, 2018, the retail market is
increasing their budgets to meet higher market demands. quickly ramping up in preparation.
The industrial market also has a strong value-add oil and • The economic fabric of Edmonton is steadily diversifying
gas sector which is expected to grow significantly in the towards value-add industries. Business and professional
coming year. For example, the $9.3 billion North West service sectors outside of the oil and gas industry such as
Refining is an Alberta-based energy producer that creates technology, health and law are spurring office leasing
value-added products from bitumen. Their three-phased activity. Demand for industrial space has been driven by
refinery is partially complete and situated in Sturgeon tenants in industries such as cannabis, cryptocurrency
county, north of Edmonton. mining, automotive, construction and indoor recreational.
• After a quiet few years, Edmonton’s core is gaining vigour
and buzz, and the downtown skyline is getting a facelift
following years of limited development. In just under three
years, Enbridge Centre and Edmonton Tower, two class AAA
© 2018 CBRE Limited CANADA REAL ESTATE MARKET OUTLOOK 2018 CBRE RESEARCH
26P ROJECTS TO WATCH
EDMONTON
Ice District
ICE District is quickly becoming the centerpiece of Edmonton’s downtown core.
The $2.5 billion Phase I is well underway with Rogers Place and Edmonton Tower
completed and operational. The JW Marriott, Stantec Tower, The Legends and Sky
Residences are currently under construction and slated for completion between
2018 and 2019. Construction of Block BG, which includes approximately 560
purpose built rental units, has begun and move-ins are expected to begin in the
spring of 2020. Phase II of the development, north of Rogers Place, is currently in
the planning stage.
PHOTO CREDIT: Katz Group
Valley Line
The Valley Line LRT is part of the greater Edmonton LRT Network Plan, a long-
term vision to expand the city’s public transportation network. Construction of
the southeast portion has commenced and is expected to be completed by 2020
with an anticipated capital cost of $1.8 billion. The full Valley Line will extend to
Mill Woods Town Centre in the southeast and to Lewis Farms in the west end of
the city. This expansion is anticipated to draw more labour to downtown from the
suburbs. The Valley Line LRT will have 28 stations and is forecast to service
100,000 people per day.
Inter Pipeline Ltd
Inter Pipeline Ltd. recently announced the construction of a $3.5 billion world-
class integrated propane dehydrogenation and polypropylene plant in the Alberta
Industrial Heartland, just northeast of the City of Edmonton. The facility will
transform propane into 525,000 tonnes of polypropylene per year, a high value,
easily transportable plastic used for manufacturing a wide range of finished
products. With over $35 billion invested to date, and a proposed $15 billion in
additional investment expected over the next decade, the Industrial Heartland is a
major hydrocarbon processing center which produces 43% of the country’s basic
chemical manufacturing.
© 2018 CBRE Limited CANADA REAL ESTATE MARKET OUTLOOK 2018 CBRE RESEARCH
27RE GIONAL STATISTICS
EDMONTON
Office Investment
Vacancy Rate 17.5% 18.7% 19.2% Office $128 $404 $260
Class A Net Asking Rent (per sq. ft.) $23.43 $22.16 $22.00 Industrial $566 $397 $678
Net Absorption (million sq. ft.) (0.12) (0.30) 0.24 Retail $624 $692 $580
New Supply (million sq. ft.) 1.12 0.00 0.65 Multifamily $723 $296 $500
Under Construction (million sq. ft.) 0.60 0.60 0.00 ICI Land $394 $300 $300
Hotel* $19 $275 $200
Total $2,453 $2,364 $2,518
Vacancy Rate 18.4% 19.1% 18.8%
Class A Net Asking Rent (per sq. ft.) $20.11 $18.51 $18.50
Net Absorption (million sq. ft.) (0.34) (0.02) 0.14 Office - Downtown Class A (%) 6.75 - 7.25 6.75 - 7.50 6.75 - 7.50
New Supply (million sq. ft.) 0.15 0.07 0.13 Office - Suburban Class A & B (%) 6.75 - 8.00 6.75 - 8.00 6.75 - 8.00
Under Construction (million sq. ft.) 0.11 0.15 0.05 Industrial - Class A & B (%) 5.25 - 8.00 5.25 - 8.00 5.25 - 7.50
Retail - Neighbourhood (%) 5.75 - 6.25 5.50 - 6.00 5.50 - 6.00
Multifamily - High Rise Class B (%) 4.75 - 5.25 4.50 - 5.00 4.50 - 5.00
Vacancy Rate 17.8% 18.8% 19.1%
Hotel - Downtown Full Service (%) 7.75 - 8.75 7.25 - 8.75 7.25 - 8.75
Class A Net Asking Rent (per sq. ft.) $22.33 $20.93 $20.67
*Market and surrounding region
Net Absorption (million sq. ft.) (0.46) (0.32) 0.38 Source: CBRE Research, 2018.
New Supply (million sq. ft.) 1.27 0.07 0.78
Under Construction (million sq. ft.) 0.71 0.75 0.05
Multifamily
Source: CBRE Research, 2018.
Vacancy Rate 7.1% 7.0% 6.2%
Industrial 2-Bedroom Average Rent $1,229 $1,215 $1,210
New Rental Supply (units) 3,358 1,923 1,457
Availability Rate 7.6% 7.6% 7.4%
Source: CMHC, CBRE Research, 2018.
Net Asking Rent (per sq. ft.) $9.51 $9.71 $9.71
Sale Price (per sq. ft.) $139 $139 $139
Net Absorption (million sq. ft.) 0.80 0.61 1.60
Hotel
New Supply (million sq. ft.) 1.61 0.60 1.50
Under Construction (million sq. ft.) 0.65 1.04 0.50 Inventory (Rooms) 15,734 16,624 17,031
Source: CBRE Research, 2018.
Occupancy 59.0% 57.0% 57.0%
Average Daily Rate $130.00 $130.00 $133.00
Retail Source: CBRE Research, 2018.
Total Retail Sales per Capita $18,661 $19,739 $19,898
Total Retail Sales Growth (1.1%) 8.0% 2.5%
Mall Sales Productivity (per sq. ft.) $765 $730 $731
New Supply (million sq. ft.) 0.79 0.70 0.40
Source: CBoC, ICSC, CBRE Research, 2018.
© 2018 CBRE Limited CANADA REAL ESTATE MARKET OUTLOOK 2018 CBRE RESEARCH
28RE GIONAL OUTLOOK
WINNIPEG
KEY TRENDS
• Winnipeg’s labour force growth is expected to remain • In the downtown core, Class A and higher quality Class B
steady going forward due to continued job creation. office buildings continue to perform well, while lower
According to The Conference Board of Canada’s 2017 quality Class B space has seen increasing vacancies.
Metropolitan Outlook report, Winnipeg’s unemployment Winnipeg is catching up to the global trend of bifurcation
rate will drop from 5.8% in 2017 to 5.5% by 2021. Growth in in the demands of office users to premium A and B class
potential output in Manitoba may overtake that of all the space, as well as the modernized Class C market. An
western provinces, owing in part to the province’s increase in capital investment in existing buildings has
considerably younger demographic profile as compared to emerged in the wake of True North Square, which will be
the rest of Canada. the new standard of quality office space in Winnipeg.
While the face of Portage Avenue and Main Street is
• Continuous economic expansion coupled with little new
changing, expect this large node to remain the centre of
supply has resulted in the industrial availability rate
commerce in Winnipeg, complimented by new options
compressing to a 5-year low. While there is a need for new
in the SHED district.
supply to enter the market, high construction costs have
tempered the development community’s confidence as • The suburban office market has seen speculative
stretched rental rates are required to justify the high cost of construction for the first time in recent years. The success
development. Vacancy will remain compressed causing of these projects has bolstered confidence in the market
rental rates to rise at an increasing rate. and is expected to drive further expansion in 2018.
• There is some relief on the horizon for industrial inventory • While the investment market has remained steady, moving
as both QuadReal and Hopewell have land slated for forward Winnipeg could see high dollar volumes traded in
industrial and mixed-use development in the North and 2018. As large institutional investors focus on core
South ends of the city. In addition, subsequent phases of Canadian markets, the disposition of assets considered
successful business parks in CentrePort will get underway non-core to institutions would result in good buying
in 2018. opportunities for investors of a different lens. This could
tip the scale from another consistent year, to one that
includes significant trades.
© 2018 CBRE Limited CANADA REAL ESTATE MARKET OUTLOOK 2018 CBRE RESEARCH
29P ROJECTS TO WATCH
WINNIPEG
True North Square
True North Square is a 1-million sq. ft. mixed-use development comprised of
office, retail, residential and hotel components in the Sports Hospitality, and
Entertainment District in downtown Winnipeg. Situated between Bell MTS Place
and the RBC Convention Centre, the first of four high-rise buildings will be a
365,000 sq. ft. 17-storey Class A office tower to be completed in Summer 2018. The
project has secured Bank of Nova Scotia and Thompson, Dorfman, Sweatman LLP
as anchor office tenants, along with Manitoba Liquor Marts as a key retail tenant.
The expanded inventory will cause vacancy rates to jump, not as a result of
weakening in the market, but the result of a strong market realizing
inventory expansion.
Bishop Grandin Crossing
Hopewell’s Bishop Grandin Crossing is a 132-acre mixed-use industrial, office,
retail and multifamily transit-oriented infill development. It is situated in the
high-growth southwest quadrant on Winnipeg’s inner ring road, adjacent to the
future southwest Rapid Transit corridor. With 44-acres dedicated to industrial
development, this project should help to ease the industrial supply crunch that
has formed in recent years. Another 23 acres have been slated for commercial
development and 32 acres are earmarked for the development of over 1,100
multifamily units.
Phase II Southwest Rapid Transit Corridor
The development of the Bus Rapid Transit system is a key component of
Winnipeg’s Master Transportation Plan. With the southwest area’s rapid
population growth, construction for Phase II of the Southwest Corridor is
underway. The project will connect the University of Manitoba, residential
communities, suburban employment areas and downtown via a high-speed
roadway. New infrastructure for the project includes tunnels, bridges, road
widenings, cycling paths and park-and-rides. The project will transform
transportation and consumer habits in the southwest region during construction
and upon completion.
© 2018 CBRE Limited CANADA REAL ESTATE MARKET OUTLOOK 2018 CBRE RESEARCH
30You can also read