TECHVIEW REPORT ELECTRIC BUSES - Fraunhofer IMW
←
→
Page content transcription
If your browser does not render page correctly, please read the page content below
FR AU NHOFE R-ZEN T RUM FÜ R I N TE R N AT I O N ALES MA N AG EMEN T U ND W I SSENSÖKO N OM I E

TECHVIEW REPORT
ELECTRIC BUSES

FRAUNHOFER MOEZ

TECHVIEW REPORT
Electric Buses

Autor:
Michael Benz

Unter der Mitarbeit von:
Karl Gürges, Sebastian Borufka

Gefördert vom European Business and Technology Center EBTC
TECHVIEW REPORT
Electric Buses
Table of Contents

1        Overview and taxonomy .................................................................................. 7
         Propulsion systems ............................................................................................... 9
         Electrical energy storage-systems ......................................................................... 9
1.2.1    Batteries ............................................................................................................... 10
1.2.2    Ultracapacitors ..................................................................................................... 11
1.2.3    Fuel cells .............................................................................................................. 11
         Charging infrastructure ........................................................................................ 11

2        European market overview .............................................................................. 13
         Current status of the market ................................................................................ 13
         Key Players ........................................................................................................... 15
2.2.1    Original equipment manufacturers ....................................................................... 15
2.2.2    Battery manufacturers .......................................................................................... 16
2.2.3    Alternative propulsion systems ............................................................................. 17
2.2.4    Charging infrastructure ........................................................................................ 17
         SWOT-analysis ..................................................................................................... 18
         Technology trends................................................................................................ 19

3        Indian market overview ................................................................................... 21
         Market overview .................................................................................................. 21
         Current status ...................................................................................................... 22
         SWOT-analysis ..................................................................................................... 25
         Technology trends................................................................................................ 26

4        EU-India comparison & strategic recommendation ........................................ 27
         EU-India industry comparison ............................................................................... 27
         Market drivers and challenges .............................................................................. 28
         Policies and regulatory framework in EU and India ............................................... 29
4.3.1    Policies and regulatory framework in the EU ........................................................ 29
4.3.2    Policies and regulatory framework in India ........................................................... 30
         SWOT-analysis from an EU perspective................................................................. 31
         Strategic recommendation for validation and commercialization of technology
         in India ................................................................................................................. 32
4.5.1    How does the company want to commit to the Indian market? ........................... 32
4.5.2    Which product strategy should the OEM choose? ................................................ 33

5        Case study: Solaris Bus & Coach S.A. ............................................................... 35

6        Summary ............................................................................................................ 37

7        Literature ........................................................................................................... 38

8        Appendices ........................................................................................................ 42
         Overview European OEMs .................................................................................... 42
         Overview European producers of EES-systems ...................................................... 43
         Overview European producers of alternative powertrains ..................................... 44
         Overview European producers of charging infrastructure ..................................... 44

Fraunhofer MOEZ                         Electric Buses                                                                                   4 | 44
Overview and taxonomy
Abbreviations
AISC Automotive Industry Standards Committee
BRTS Bus rapid transit-system
BSES Bharat Stage Emission Standards
CKD Completely knocked down
CNG Compressed natural gas
EES Electrical energy storage
EV Electric vehicle
GHG Greenhouse gas
HEB Hybrid electric bus
ICE Internal combustion engine
IEC International Electrotechnical Commission
JNNURM Jawaharlal Nehru National Urban Renewal Mission
KERS Kinetic energy recovery-system
LFP Lithium-ferrous-phosphate
Li-ion Lithium-ion
Li-s Lithium-sulfur
NiCd Nickel-cadmium
NiMH Nickel-metal hydride
NMC Nickel-manganese-cobalt
OEM Original equipment manufacturer
PEB Pure electric bus
R&D Research & development
STU State Transport Undertaking
UC Ultracapacitors
UNECE United Nations Economic Commission for Europe
Fraunhofer MOEZ Electric Buses 5 | 44Overview and taxonomy List of Figures Fig. 1: Taxonomy of alternative bus technologies ................................................................ 8 Fig. 2: Overview alternative propulsion systems .................................................................. 9 Fig. 3: Li-ion cell ................................................................................................................. 10 Fig. 4: Value chain of alternative buses ............................................................................... 15 Fig. 5: Roadmap of future development in battery technology ............................................ 20 Fig. 6: Central legal and strategic questions ........................................................................ 32 List of Diagrams Dia. 1: Worldwide bus production by region (2011-2013) .................................................. 13 Dia. 2: Development of newly registered buses and coaches in the EU-27 (2008-2013) ...... 14 Dia. 3: Mean market share of newly registered buses in the EU-27 (2008-2013) ................ 14 Dia. 4: Market shares of Indian city bus market 2012/2013 ................................................ 21 Dia. 5: Proposed demand incentives for low floor urban buses ........................................... 23 List of Tables Tab. 1: Exemplary supplier relationship for hybrid propulsion systems in 2012 .................... 17 Tab. 2: Assumed price differences between European and Indian OEMs ............................. 27 Fraunhofer MOEZ Electric Buses 6 | 44
Overview and taxonomy
1       Overview and taxonomy

With a growing number of people living in urban areas, municipal and government
officials face a number of challenges like increasing noise emission as well as air
pollution. Especially cities in developing economies like India have to consider new
means of public transport in order to tackle these pressing issues.
Due to the ongoing development in the field of electric mobility, buses have the ability
to benefit from the rapid development in propulsion technology, electrical energy
storage-systems (EES) and the charging infrastructure in order to make cities cleaner
and more livable.
Even though the development of hybrid electric buses (HEB) and pure electric buses
(PEB) is at a stage of infancy, a large number of bus producers have made a
commitment in finding suitable substitutes for diesel technology.
The following section focuses on the technological aspects of alternative bus concepts.
The taxonomy (See fig. 1) shows the affected technological fields that one has to
consider when examining the general development of buses. After that, the analysis
examines the already mentioned key technologies that determine the development of
alternative buses.

Fraunhofer MOEZ               Electric Buses                                                                       7 | 44
Overview and taxonomy

                                                                                                                                                         Fig. 1: Taxonomy of
                                                                                                                                                         alternative bus technologies

                                                                     Alternative Bus
                                                                      Technologies                                                                       Source: Fraunhofer MOEZ

                    Charging                                         Energy-Storage
                                                                                                                         Propulsion
                  Infrastructure                                        Systems

  Overhead Line     Induction            Plug-in    Ultracapacitor      Battery          Fuel Cell      Pure Electric        Hybrid        Motor

                         Static Inductive                                  Lead-Acid                          Inverter          Parallel   Synchronous

                                                                            Nickel-
                       Dynamic Inductive                                                                                        Series      Induction
                                                                           Cadmium

                                                                          Nickel-Metal
                                                                                                                             Combination    Wheel Hub
                                                                            Hydride

                                                                          Lithium-ion

                                                                        Sodium-Nickel-
                                                                           Chloride

                                                                           Metal-Air

                                                                          Redox-Flow

Fraunhofer MOEZ                    Electric Buses                                                                               8 | 44
Overview and taxonomy
Propulsion systems
There are mainly two propulsion systems that make use of electric energy - pure
electric and hybrid systems.
The electric drive is the connection between the EES-system and the driveline. It
includes all components that are necessary to transform the stored electro-chemical
energy of the EES-system to mechanical energy. Generally speaking the inverter
transforms the direct current from the battery to alternating current used by the
driveline. Additionally, the electric drive allows the regeneration of energy. In this
process the mechanical energy from breaking is transformed back to electrochemical
energy, which in turn can be stored in the EES-system. This energy recycling is generally
realized by kinetic energy recovery-systems (KERS). It is especially useful for buses in
cities due to stop and go traffic and the regular service at bus stops. 1
Hybrid drives combine the electric engine with a conventional internal combustion
engine (ICE). The vehicle is still primarily running on fuel with an electric powertrain as
an additional drive in order to reduce fuel consumption. The first type of hybrid
propulsion system is the parallel hybrid, which connects both engines to the power
transmission. In this case, the vehicle can be powered by either one of the engines or
by both simultaneously. The second type of hybrid drive is the serial hybrid. Thereby the
ICE is solely connected to the power converter in order to charge the battery and to
propel the electric engine. There is no direct connection to the transmission. The third
type is the combination hybrid. It combines both other types of hybrid drives. The ICE is
connected to the transmission and helps to recharge the battery as well, which makes
its technology more complex.2
Fig. 2: Overview alternative
propulsion systems
Source: Fuel Cells and
Hydrogen Joint Undertaking
(2014); Shen et al. (2011)
Electrical energy storage-systems
The feasibility of electric buses depends mainly on the onboard EES-system. Currently,
there are three EES-systems available on the market: batteries, ultracapacitors (UC), and
fuel cells. They have different technological attributes and economic characteristics.
Their commercial viability depends on a number of factors, which tend to work in
opposite directions. These factors can be subsumed under safety, durability, costs,
environmental sustainability, energy-density, and performance. It is especially necessary
to consider all these factors in order to meet demands of public transport. Furthermore,
1
Kampker 2013
2
Shen et al. 2011
Fraunhofer MOEZ Electric Buses 9 | 44Overview and taxonomy
finding a suitable EES-system is crucial in order for PEB or HEB to become a viable
alternative to diesel buses.3
1.2.1 Batteries
PEBs and HEBs most commonly use batteries as an EES-system. Batteries are electrically
connected galvanic cells. A galvanic cell is a chemical device that consists of two
electrodes, an anode and a cathode. Within the electrodes an active material is
integrated, which allows the storage of electrical energy. During the charging process
the electrolyte transforms electrical energy into chemical energy. Thereby, the anions
are transmitted to the anode and the cations to the cathode. The whole process is
reversed once the battery discharges.
Lithium-ion (li-ion) batteries have proven to be the most promising EES-system for
electric vehicles (EV). Theoretically, li-ion batteries can combine a high specific power
(300 Wh/kg), a high energy density (90-140 Wh/kg), and a low self-discharge over
time. Additionally, their low weight and endurance of high temperatures make them
suitable for the usage in PEBs. Li-ion batteries are able to endure approximately 1,000-
1,500 loading cycles. The batteries consist of an oxidized cobalt material on the
cathode and a carbon based material on the anode. Lithium salt is used as the
electrolyte. However, li-ion batteries are still expensive in production. Also, the
electrolyte is highly inflammable and it requires a sufficient battery management
system.
Fig. 3: Li-ion cell
Source: Karlsruhe Institute of
Technology
However, other types of batteries have proven to be disadvantageous compared to li-
ion batteries. Lead-acid batteries consist of the lead as the negative and lead oxide as
the positive active material, as well as diluted sulfuric acid as the electrolyte. It is a
mature technology with low manufacturing costs, but very low energy density (20-30
Wh/kg). Nickel-metal hydride (NiMH) batteries are more feasible than lead-acid
batteries since they have twice the energy-density (40-55 Wh/kg), are operable at high
voltage and have a long life of approximately 2,000 cycles. However, they tend to
discharge at high load currents and the battery capacity reduces after 200-300 loading
3
Deutsches CleanTech Institut 2010
Fraunhofer MOEZ Electric Buses 10 | 44Overview and taxonomy
cycles. Compared to li-ion batteries, the battery storage of NiMH batteries is lower and
needs more time to charge.4
1.2.2 Ultracapacitors
UCs store energy by mechanically separating the negative and the positive charges on
two parallel plates, but connects them electrically via an electrolyte. The process allows
the physical storage of the charges on the electrodes. If there is voltage applied to the
capacitor a Helmholtz double layer is formed at both electrodes. As a result, a layer of
anions or cations is deposited on the opposite electrode. Since this process does not
contain chemical variations on the electrodes, UC have a longer life cycle than
batteries. Furthermore, they have a higher power density than batteries and can be
charged and discharged within a shorter period. On the downside, they have a much
lower energy density than batteries. They are able to store only 10% of the energy, li-
ion batteries can store. UCs are either based on carbon or metal fiber composites,
foamed carbon, carbon particulate with a binder, doped conducting polymer films on a
carbon cloth or mixed metal-oxide coatings on a metal foil.5
1.2.3 Fuel cells
Fuel cells generate electricity by converting a fuel-like hydrogen (anode) with an
oxidant (cathode). The anode and cathode are isolated by a membrane (electrolyte),
which allows charges like water protons to pass from one side of the cell to the other.
The isolated electrons produce energy by moving from the anode to the cathode
through an external circuit. In comparison to batteries, fuel cells need a continuous
source of fuel and oxygen to sustain the chemical reaction. Hydrogen has the highest
energy density available, but hydrocarbons or alcohols are also suitable as fuels. Other
oxidants include chlorine and chlorine-dioxide. Fuel cells have a high conversion
efficiency of fuel to electrical energy, a low noise emission and almost no greenhouse-
gas (GHG) emissions. Nevertheless, they have a low energy density, which makes large
fuel tanks necessary. Furthermore, fuel cells have a longer response time than UC or
batteries and are still more expensive due to the high cost of components like platinum
and palladium.6
Charging infrastructure
The necessary infrastructure and technology to charge the EES-systems in HEBs or PEBs
can be categorized in plug-in, inductive and overhead charging. The future success of
these charging methods is linked to the development of EES-systems.
Plug-in technology relates to the direct charging of PEBs or HEBs via charging stations,
which can either be localized at the bus depot or the end of the bus route. The
traditional plug-in charging is standardized in terms of mode (IEC 61851-1) and type of
plug (IEC 62196-1) by the International Electrotechnical Commission (IEC). There are
four different modes (mode 1-mode 4), which are regulated by the electric current and
the level of transferred electricity, whereas mode 3 is the most common and mode 4
the fast-charging method.7 The advantage of plug-in charging technology is that its
expansion can be linked to the expansion of the infrastructure needs of personal EVs.
However, in order to be suitable to the needs of public transport, the charging stations
4
Doetsch et al. 2014; Khaligh et al. 2010; eMobilitätOnline
5
Fraunhofer 2014; Khaligh et al. 2010
6
Khaligh et al. 2010
7
Claude Ricaud et al. 2010
Fraunhofer MOEZ Electric Buses 11 | 44Overview and taxonomy
have to be either mode 4 at the end of the bus route or mode 3 when charged
overnight. Obviously the latter is intervened with the EES-system, which has to provide
a power supply for the whole day. However, the requirements of daily bus routes
cannot be managed by current EES-systems.
Apart from the standard charging model using a plug, inductive technology charges
the bus wirelessly by creating a magnetic field between two inductive plates, which are
embedded in the ground. Thus, PEBs as well as HEBs can be recharged while driving
(dynamic inductive charging) or standing (static inductive charging) without a physical
connection to the charging facilities. This offers the possibility to charge the bus on its
normal route or at designated charging points, which could be a number of stations on
its route.8
The second alternative is overhead charging. It basically uses the same method that has
been applied by trolleybuses and trams since the early 20th century. Thereby trolley
poles on top of the bus transfer the current flow either directly to the engine or use it
to charge the EES-system. Due to the large necessary infrastructure investments and
the aesthetic constrains of visible overhead wires, just a few number of new projects
use the constant overhead current flow. Recent approaches include fast-charging-
systems that recharge the bus at every third or fourth stop with a short and intense
current as well as a longer charge at the end of the route via a retractable pole.9
The two latter alternatives are able to bypass the constraints of current EES-systems in
order to make PEBs suitable for the daily demands of public transport. The
complementary charging possibilities allow the original equipment manufacturers
(OEMs) to reduce the amount of EES-systems used. Thereby the reduced weight
extends the range of the bus as well as reduces the costs for EES-systems. On the
downside, both alternatives make additional infrastructure investment necessary, which
is unfavorable for the general acceptance of inductive or overhead charging.
8
Frost & Sullivan 2014a
9
ABB 2013
Fraunhofer MOEZ Electric Buses 12 | 44European market overview
2 European market overview
The European market is one of the leading regions for innovation in the bus sector.
However, considering the general output per region, Asia is by far the biggest producer
since it compromises over two-third of the worldwide output of buses and coaches.
The Asian dominance is mainly led by the increasing output of Chinese OEMs. On the
contrast the European continent produces one fourth of the total worldwide output;
similar to the level of the Americas (See dia. 1).10
Dia. 1: Worldwide bus
1.00% production by region (2011-
2013)
15.00%
Europe Source: Organisation
Internationale des
13.00% Americas Constructeurs d’Automobiles
Asia-Oceania (OICA)
71.00%
Africa
The following section will give a short overview over the European market for diesel
buses as well as HEBs and PEBs. It will take the current market status, value chain, key
players and technological development into account.
Current status of the market
The registration of buses in the EU peaked at 41,997 units in 2008 after it had seen a
constant increase in output the prior years. Since then, the EU bus market has suffered
from a significant downturn in demand.11 Due to the Eurozone crisis in the aftermath
of the financial crisis in 2009, the European governments set up a number of stimulus
packages. They helped limiting the annually decreasing output of OEMs to 10% in
2009 and 18% in 2010, compared to the peak output in 2008. However, after most
stimulus packages expired, new registrations of buses and coaches plummeted at
30,181 units in 2012 (-24.40%). Although sales of buses slightly increased in 2013 it is
far away from the previous numbers prior before 2009 (See dia. 2).12
10
Please note that the OICA defines Europe as the whole European continent including the “Common-
wealth of Independent States”, the EU and Serbia.
11
ACEA 2013
12
Please note that the EAMA defines Europe as the former EU-27 members
Fraunhofer MOEZ Electric Buses 13 | 44European market overview
Dia. 2: Development of newly
45,000 0% registered buses and coaches
in the EU-27 (2008-2013)
40,000
-5%
35,000 Source: European Automobile
Manufacturer's Association
30,000 -10% (EAMA)
25,000
-15%
20,000
15,000 -20%
10,000
-25%
5,000
0,000 -30%
2008 2009 2010 2011 2012 2013
Total output Relative change to 2009
Two third of the total registrations of buses over 3.5 tons are captured by four of the
largest European economies Germany, France, UK, and Italy. Their spending on
transport has the biggest impact on bus sales, which could be seen in 2009, when a
significant downturn in the Italian registrations had a tremendous impact on the
decline in registrations for Europe in total (See dia. 3).
Dia. 3: Mean market share of
newly registered buses in the
France EU-27 (2008-2013)
Germany Source: EAMA
20.00% 19.60%
Italy
3.70% Others
7.30% 16.00%
Spain
Sweden
22.20% 11.10%
United
Kingdom
The European bus market (w/o Russia) is saturated and expected to settle down
between 23,000 and 27,000 vehicles per year over the long term. Within this
spectrum, city buses have a share of approximately 40% and coaches/ interurban buses
of approximately 60%. Sales generally fluctuate based on general market cycles.13
Currently new vehicles are solely acquired to replace vehicles already withdrawn from
service. The biggest customers of city bus manufacturers are municipalities and public
transport companies. Currently, they tend to extend the duration of their fleet due to
13
Based on a recent interview with Richard Averbeck who is currently a consultant. He obtained extensive
insight in this market due to a long career in the bus sector.
Fraunhofer MOEZ Electric Buses 14 | 44European market overview
fiscal restrictions.14 This trend can be expected to continue considering the European
Treaty on Stability, Coordination and Governance that laid the groundwork for national
laws, which require stricter fiscal restrictions.15 Nevertheless, new growth impulses and
regulations are expected to occur since the latest government programs in Europe
target electric mobility.
Key Players
Europe is home of a variety of manufacturers for high technology appliances since
automotive and electronic industries play an important role in Germany, France and
other European countries. The upcoming market for HEBs and PEBs is an opportunity
for cross-industry cooperations in the development of engines, batteries and OEMs.
The following section will give a short overview over the variety of different industry
sectors and their main players which are incorporated in the overall value chain of HEBs
and PEBs (See fig. 4).16
Fig. 4: Value chain of
alternative buses
Source: Fraunhofer MOEZ,
Frost & Sullivan (2013)
2.2.1 Original equipment manufacturers
There is an extensive number of OEMs for buses and coaches in Europe. They fall in
two sectors. The first sector is composed by larger manufacturers (considering total
output) like Volvo, Scania, Iveco, MAN and Daimler. These OEMs are all part of
multinational corporations, which are usually active in multiple vehicle sectors. The first
sector-OEMs have not produced a PEB yet, but offer HEBs and develop other
14
VDA 2013
15
European Commission 2012
16
Please check appendices for an extensive overview of European companies in each technology sector.
Fraunhofer MOEZ Electric Buses 15 | 44European market overview alternative propulsion systems based on fuel cells or hydrogen. Due to their extensive financial resources they are able to invest heavily in different new propulsion technologies and to expand to other markets outside of Europe. On the downside, they are usually pressured by the overall company strategy as well as shareholder interest. Thus, they are not able to diversify the propulsion system portfolio as much as the second sector-OEMs do. OEMs from the second sector are usually family-owned companies that are smaller in size and more specialized concerning their portfolio. They include OEMs like Van Hool, Solaris, Optare and Cobus Industries. In contrast to the first sector, they have been able to develop feasible HEBs as well as PEBs. UK is currently the largest demander of electric buses (78%). Thus, Optare and Wrights Electric from UK added PEBs to their product portfolios. Concerning the total market share, Daimler as the biggest supplier of diesel buses and coaches in Europe, increased its market share in 2013 to almost one third. It is followed by Iveco (17.2%), Ford (10%), MAN (9.3%) and Volvo (6.5%).17 Currently, Volvo captures about half of the total market share of hybrid buses in Europe; followed by ADL (17%) and Daimler (10%).18 However, the European PEB market is still considered at an early stage. Due to the decreasing demand as well as challenging regulatory standards for buses and coaches in general over the last years, competition has become fiercer and margins smaller. As a result, industry shifted production from high wage central European countries like Germany, France and Italy to countries with comparable low production costs, namely Poland and Turkey.19 It is expected that the European bus market in general will consolidate. This is especially unfavorable for OEMs of the second sector, since they do not have the financial backing to outsource their production or withstand a temporary drop in demand.20 2.2.2 Battery manufacturers The market for batteries is mainly determined by the development of alternative fuel technologies in the personal-vehicle sector. At the moment li-ion batteries are the only suitable EES-system for HEBs and PEBs. The main battery manufacturers are located in Asia, especially Japan and Korea. The worldwide li-ion battery market is currently dominated by five companies, which make up for 78.58% of the global supply. The Japanese Panasonic/Sanyo captured the biggest market share with 41.2%, followed by AESC (18.46%), Samsung (7.13%) and LGC (7.11%) from Korea. LiTec (4.68%) was a subsidiary of the Daimler Group and the only noticeable European producer of li-ion batteries with a significant global market share. 21 Nevertheless, Daimler has recently decided that it will terminate its engagement at LiTec and solely focus on its other li-ion battery endeavour Deutsche Accumotive.22 Other European companies engaging in the battery sector are ABB from Switzerland, Magna Steyr from Austria, Saft from France, Pardo from Italy. Still, these are not the leading companies in this area, but they play a significant role in their home markets. Other European companies that perform research and development (R&D) in this sector are for instance Evonik, BASF or Bosch from Germany. 17 ACEA 2013 18 Frost & Sullivan 2013 19 Newstix 2013; Averbeck 2014 20 The Market assessment in Chapter 2.2.1 is based on the Solaris case study in chapter 5 of this report. 21 Springer Professional 2014 22 Spiegel-Online 2014 Fraunhofer MOEZ Electric Buses 16 | 44
European market overview
2.2.3    Alternative propulsion systems

There are a few automotive suppliers that produce hybrid or solely electric propulsion
systems for commercial vehicles like buses and coaches. Due to the engineering
tradition in Germany, namely German companies like ZF, Bosch, Heinzmann, Voith and
Vossloh Kiepe are engaged in this sector. UK’s BAE is one of the few non-German
suppliers. Most OEMs buy their propulsions systems from the already mentioned
suppliers. Volvo is the only OEM that develops and produces their powertrains in-house
(See tab. 1).

             MAN       Daimler   Van        Solaris   ADL   Optare   Wright   Iveco   VDL     Tab. 1: Exemplary supplier
                                                                                              relationship for hybrid
                                 Hool                                Bus                      propulsion systems in 2012
 BAE                                                   x                       x
 Siemens           x                                          x        x                      Source: Frost & Sullivan (2013)
 Voith                              x             x
 Vossloh                                          x                                    x
 ZF                       x         x                                                  x

Due to the increasing restrictions on CO2 emissions, expected to be imposed by the EU
by 2020, most OEMs and as well as their suppliers will switch from diesel propulsion to
alternative propulsion systems.23

2.2.4    Charging infrastructure

Most PEBs in Europe are still in trial-phase. Only a small number of European OEMs
have developed solutions for a charging infrastructure. Most of them try to find a
suitable solution for the low range of current batteries. One approach is to develop
new charging methods, which make public infrastructure investment necessary.
For instance, the Mitsui-Arup joint venture MBK Arup Sustainable Projects (MASP) tests
an inductive system via underground induction coils, positioned at each end of a bus
route in Milton Keynes, UK.24 Furthermore, ABB introduced its flash charging method,
in which the bus receives a charge of around fifteen seconds every third or fourth stop
via overhead charging. At the terminal, the battery can be fully recharged within three
to four minutes.25 Another approach is to use existing charging infrastructure in cities.
A joint venture between Siemens and Rampini Carlo uses the already existing power
grid of trams for a partial charge of ten to fifteen minutes at the terminal. During the
night the batteries are fully recharged. 26 Assuming that the weight and duration of
battery technology improves over time, plugin-charging-systems that charge the vehicle
overnight will be the most suitable solution.27
From a practical point-of-view, providers of bus fleets will be reluctant to switch to
plug-in hybrids (during the daily route) or overhead charging technology since they
would have to deal with possible vandalism and safety measures. Considering the
current capabilities of the EES-systems, inductive charging systems would in that sense
be ideal, but the necessary infrastructure investment is comparatively larger. 28

23
   Averbeck 2015
24
   Arup 2014
25
   ABB 2013
26
   Siemens 2013
27
   Slavik 2014
28
   Averbeck 2014

Fraunhofer MOEZ                  Electric Buses                                                                        17 | 44
European market overview
SWOT-analysis
Strengths Weaknesses
European companies are among the global innovators in European OEMs and suppliers missed out on the early
most production stages of hybrid and electric buses. development and introduction of suitable EES-systems for
The European common market guarantees free movement of HEBs and PEBs.
goods, services, capital, and people. The cutting-edge development of the highly important li-ion
Wage- and competence-disparities across Europe allow batteries is mainly located in Asia.
OEMs and suppliers to optimize the quality and cost structure High production costs in Western Europe as well as
of their value chain. increasing production costs in Eastern Europe and Turkey.
A highly developed infrastructure as well as a plethora of Development in hybrid propulsion-systems is at the moment
well-educated human capital to maintain just-in-time mostly based on subsidies rather than commercial feasibility.
production and R&D. European OEMs have not standardized, which EES-system or
High quality- and industry-standards. charging infrastructure to use so far.
Opportunities Threats
Increasing urbanization puts pressure on city development. The stagnant demand for buses reduces the revenue in the
New public transport solutions like bus rapid transit-systems home markets of European OEMs.
(BRTS) as well as city-expansions are necessary to ease Expansion of Chinese manufacturers to Europe, since BYD
congestion, pollution as well as commuting time. offers a feasible PEB.
The demanding European emission standards prepare Even though there is a wide range of Europe-wide laws,
European producers for the emerging economies, where companies still have to consider numerous national laws as
urbanization and pollution are more crucial issues. well as cultural differences within Europe.
Functioning subsidy structure in the single European states Restrictive labor laws, which tend to be more restrictive than
and the EU, which could allow efficient support for the elsewhere around the world, which puts European OEMs and
development of PEBs, HEBs, EES-systems and the necessary suppliers into an unfavorable position compared to Asian
charging infrastructure. competitors.
Increasing crude-oil prices over the long term.
Fraunhofer MOEZ Electric Buses 18 | 44European market overview
Technology trends
The major components of an electric vehicle are the battery (EES), the traction motor
and the motor controller. However, the general acceptance of electric mobility as well
as the market penetration will mainly depend on the further technological
development of EES-systems. Maintaining the balance between factors of cost, driving
range, safety, energy- and power density will be crucial in that sense.29
Battery Technologies
It is expected that li-ion batteries will remain dominant in the short and medium term,
at least in the next six to ten years until suitable alternatives are commercially viable.30
The energy density of current materials can be improved from 140 up to 250 Wh/kg. 31
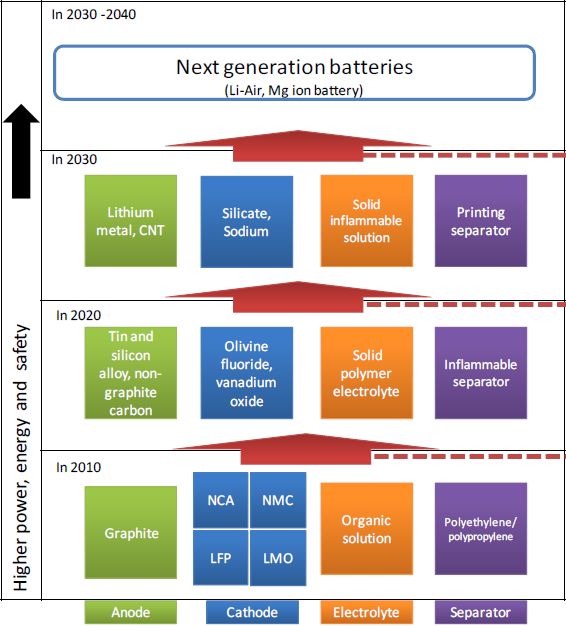
Regarding the anode materials, graphite as well as amorphous carbons are currently
most widely used. Graphite captures the biggest market share due to its balanced
profile of characteristics. Lithium-titanates will gain importance in the next years since
their recharging period is shorter and they are able to process higher currents.32 For
instance, Solaris and Vossloh Kiepe started using lithium-titanate batteries in a pilot-
project in Esslingen, Germany.33 Over the middle- and long-term carbon silicon-, carbon
tin composites, silicon-, non-silicon alloys, and lithium-metal will become more
important in order to increase the energy density.34
Considering the cathode’s active material, it is necessary to improve the performance
of the Nickel-manganese-cobalt (NMC) composition, which is the commercially most
viable cathode material at the moment. Further improvements are possible by
increasing the share of nickel as well as decreasing the share of manganese and cobalt
by 25% each, which would allow to increase the specific capacity from 150 to 220
mAh/g.35 Furthermore, lithium ferrous phosphate (LFP) will gain importance as a
cathode material over the next years since the ion supply is higher and it is considered
safer than layered oxides like NMC. Assuming researchers are able to increase its
electric conductivity by decreasing the size of the LFP-particles as well as using carbon
coatings.36
However, current li-ion-technology is limited. The next crucial step will be to develop
new materials as well as new cell concepts. One promising cell concept, which is
already in the development, is the Lithium-Sulphur (li-s) battery. It is superior to current
li-ion batteries because of its higher energy density, cheaper materials and lower
weight. The current energy density is 350 Wh/kg but is expected to increase up to 400
to 600 Wh/kg. It replaces graphite with a small amount of lithium metal, which
functions as electrode as well as lithium source. Furthermore, the layered oxides
currently used are replaced by sulphur, which is cheaper and able to use the lithium
more efficiently. However, li-s batteries still need at least six to ten years to gain market
maturity since they still have a low amount of charging cycles, which are related to
degradation processes of the electrolytes. 37
29
Meisenzahl et al. 2014
30
Averbeck 2014
31
Korthauer 2013
32
Wurm et al. 2013
33
Vossloh Kiepe 2014
34
Wurm et al. 2013
35
IAS 2014
36
Graf 2013
37
Althues 2014
Fraunhofer MOEZ Electric Buses 19 | 44European market overview
Another promising technology is Lithium-Air (li-air) in which lithium oxides at the anode
and oxides at the cathode get reduced. There is extensive research in this field due to
its promising characteristics. Theoretically, it is able to increase the energy density up to
twenty times. Practically, it is expected that the minimal energy density would be 500
Wh/kg. However, research is still in its infancy considering several technological
obstacles.38
Despite the development of EES-systems, energy efficiency especially for PEB and HEB
gain importance since their unsteady driving style strains the batteries additionally.
Therefore, other components of the buses have to use energy more efficient. One
crucial feature will be the development of regenerative braking systems, which use the
kinetic energy from breaking and reuse them when accelerating the vehicle. These
KERS are naturally linked to the development of the powertrain as well as in-wheel
UCs. The latter either complement the on-board EES systems or have the potential to
replace them completely.39
Fig. 5: Roadmap of future
development in battery
technology
Source: EBTC Cleantech
Mapping
38
Imanishi et al. 2014
39
Frost & Sullivan 2013; Siemens 2013
Fraunhofer MOEZ Electric Buses 20 | 44Indian market overview
3 Indian market overview
India is a lucrative market for domestic as well as foreign OEMs since it is the second
largest bus market in the world with an immense growth potential. The following
section will give a short overview over the current market status, gaps and
opportunities as well as the level of technology involvement.
Market overview
India is considered as a growing bus market with an increasing degree of competition
led by two domestic OEMs – Tata Motors and Ashok Leyland. Together they own 81%
of the city bus market, where Tata Motors holds 38% and Ashok Leyland 43% (See
dia. 4). In 2012/2013 74,728 buses were sold in total. Followed by a 10% increase the
following year, which is more than twice the amount of the European market.
Additionally, an estimated number of 35,000 overaged buses have to be replaced in
the near future.40 However, domestic sales decreased over the last months, but are
expected to rise again up to 12% in the next fiscal year .41 Foreign OEMs like Volvo,
Daimler AG or Scania prepare to enter the Indian bus market or to increase their
marginal market share.42 One main reason for that is the possibility to conduct business
without any noteworthy governmental restrictions, which is usually the case in China
(the biggest bus market in the world).43
Dia. 4: Market shares of Indian
city bus market 2012/2013
2.50%
Source: Motorindia/RACE
Tata Motors Analysis
17.00%
38.00% Ashok Leyland
Volvo
43.00% Corona Bus
VE Commercial Vehicles
In 2005 the Indian government initiated a massive city modernization program, the
Jawaharlal Nehru National Urban Renewal Mission (JNNURM). Its main goal was to
improve the quality of public transport by enhancing existing bus fleets and
infrastructure in Indian metropolitan regions by introducing BRTS. The most advanced
and developed Indian BRTS is currently located in Ahmedabad. This positive example
led other cities like Chennai, Kolkata, Bangalore or Indore to implement or launch a
similar transport system. Eleven BRTS projects have been sanctioned under the
JNNURM including Vijayawada, Jaipur, Pune and Kolkata and are at various stages of
implementation so far.44 The main reason for BRTS as a central mean of the JNNURM
40
Motorindia 2013
41
The Economic Times 2015
42
Frost & Sullivan 2012a
43
Averbeck 2015
44
EMBARQ India 2014
Fraunhofer MOEZ Electric Buses 21 | 44Indian market overview
was the massive daily congestion of most Indian cities. Furthermore, a lot of cities with
more than 1 million inhabitants do not have an adequate bus system.
The implementation of BRTS and the funding of purchases of city buses under JNNURM
led to the introduction of modern low floor buses which made bus services more
attractive. In the first phase of JNNURM over 15,000 buses were purchased.45 The main
goal of the second phase was an implementation of articulated and hybrid buses.
Especially Tata Motors and Ashok Leyland benefited from JNNURM since they received
the majority of orders. However, over the years the success of JNNURM has been
widely criticized, which is the reason why the government decided to let the program
expire. Instead the government introduced a new “Smart Cities project”, where
transport (including public transport) will be one crucial element.46
Diesel-powered buses dominate the Indian bus market with approximately 95% of the
total city buses. The remaining 5% are mainly caused by compressed natural gas (CNG)
buses, which Tata introduced in 2010 and which is solely used in New Delhi.47
Furthermore, Tata as well as Ashok Leyland try to follow foreign OEMs in adding other
alternative buses like HEBs and PEBs to their portfolio. In January 2015 Ashok Leyland
announced that it would start producing a PEB in cooperation with Optare. Depending
on regulations, Ashok plans to launch the bus in the Indian market as a completely
build-up unit in the next two years.48 However, the Chinese BYD already introduced the
first PEB in Bangalore in 2014. The bus was given to Indian government on a free of
cost trial basis.49 Nevertheless, it can be assumed that in short- and mid-term diesel will
remain the first choice powertrain in India, but alternate technologies are expected to
gain momentum over the next few years.50
Current status
A big advantage of domestic OEMs is the lower market price for conventional diesel
and alternative powertrain buses compared to Europe or North America. 51 Furthermore
the market is already consolidated. Years of isolation of the Indian market have led to
the development of a well-structured dealer and service network for domestic
manufacturers. About 90% of the market share is split between few Indian
manufacturers, what makes it hard for foreign companies to enter the market with
new brands and compete with the low priced products of the domestic OEMs.52
Additionally, foreign companies have to deal with complex rules and state structures,
as well as high import duties and capital investments, which further their competitive
disadvantage. Lastly, domestic OEMs have the advantage of strong cooperative
partnerships with the State Transport Undertakings (STU). All new BRT-projects initiated
by transport agencies will be immediately supported by OEMs like Tata Motors or
Ashok Leyland.53
The R&D-level of domestic OEMs and component manufacturers concerning all key
components is low compared to the level of foreign OEMs. Due to the years of
isolation of the Indian market and a low R&D level India technologically lags behind
45
Ministry of Urban Development 2012
46
Ministry of Urban Development 2014
47
Frost & Sullivan 2012b; Tata Motors 2010
48
The Hindu 2014a
49
The Hindu 2014b
50
Frost & Sullivan 2012b
51
Frost & Sullivan 2013
52
KPMG 2011
53
Frost & Sullivan 2012b
Fraunhofer MOEZ Electric Buses 22 | 44Indian market overview
other nations. Additionally Indian cities still lack behind in terms of necessary
infrastructure investment. However, Infrastructure investment is especially important
for the implementation of electric buses since they require charging infrastructure as
well as a sufficient road network. At the moment many cities and their transport
systems are not able to handle the growing transport demand, which leads to massive
congestion on a regular basis. As a result, passengers use inter-mediate public
transport, such as rickshaws or mini buses, adding to traffic congestion.
The Indian bus market is still an emerging market where an increasing government
support is needed. The government takes a leading role in the adoption of electric
mobility by intervening in five main areas: demand creation, supply related
interventions, power and charging infrastructure, R&D and the infliction of stringent
fuel efficiency measures.54 Demand could be stimulated through the mandating of
electric or hybrid buses in public transport or through subsidies like cash or tax
incentives. Also supply related interventions are necessary to spur domestic
manufacturing, for example through tax holidays or accelerated depreciation. The
proposed incentives (See dia. 5) in the National Electro Mobility Mission Plan have not
yet been materialized, but once implemented, they could be an opportunity for OEMs.
Dia. 5: Proposed demand
$70,000 incentives for low floor urban
buses
$60,000
$50,000 Source: Ministry of Heavy
Industries & Public Enterprises
$40,000
$30,000
$20,000
$10,000
$0,000
First 900 Buses Next 750 Buses Next 600 Buses Next 450 Buses Next 300 Buses
HEB 10-20 kWh Plug-in HEB 50-70 kWh PEB >100kWh
Regarding the infrastructure there is still room for improvement, but India already
invested heavily in the road network linking all main centers of the country. From 2012
to 2017 about $ 1 trillion will be invested in infrastructure. Also urbanization trends
have paved the way for the development of satellite towns, which are supposed to
amount 70 by 2020. In 2025, 38% of the Indian population will live in urban regions,
resulting in growing demand for commuter services. This is why bus transport is and
will be the most-sought after form of transport and shows the importance of
infrastructure investments.55
To strengthen the local R&D-base both government and industry investments are
required. In order to become globally competitive, Indian companies need to improve
their R&D capabilities in research areas like battery cell or power-train technologies.
Strategic cooperations and knowledge sharing with foreign manufacturers could help
to improve the R&D level. Once electric vehicles accomplish economic viability and are
54
Ministry of Urban Development 2012
55
Frost & Sullivan 2014b
Fraunhofer MOEZ Electric Buses 23 | 44Indian market overview more prevalent and accepted than today, stringent fuel efficiency norms can be an important instrument to support the sale of electric vehicles. In the past bus transport also battled with its negative image among the public, as it was considered unreliable, slow, uncomfortable, noisy and polluting. A solution to this problem will be the greater adoption of HEBs and PEBs in Indian cities, since they enable the reduction of the high pollution levels. Especially air quality has become a pressing issue in the last years since the vehicular density in India is supposed to fivefold until 2030. Together with the implementation of BRTs across the country they could enhance the image of bus transport. 56 Major threats for domestic OEMs are global players like Daimler or Volvo entering the market. With India being the second biggest market for heavy buses worldwide, global players are keen to participate in this market in order to safeguard their global market share. Chinese bus producers may compete from two ends of the market: on the lower end they have low priced tech products, on the upper end they offer competitively priced hybrid and electric buses due to massive government support.57 Another problem for both domestic and foreign OEMs are the lack of government incentives as well as the high acquisition costs of PEBs compared to conventional diesel buses, which has made it more difficult to sell PEBs to Indian customers. In addition there is less price pressure to upgrade bus technology due to the current low of the crude oil price. Furthermore, rail based solutions and metro services in big cities represent a threat for bus transport in general, as they are considered the most prestigious form of urban transport.58 56 The Hindustan Times 2014 57 Frost & Sullivan 2013; Averbeck 2015 58 Frost & Sullivan 2012b Fraunhofer MOEZ Electric Buses 24 | 44
Indian market overview
SWOT-analysis
Strengths Weaknesses
Far lower regional market price for conventional diesel and
alternative powertrain buses compared to Europe or North Low R&D level of OEMs and component manufacturers
America concerning all key components
Largely consolidated market, about 90% of the market share is Lack of necessary EV-infrastructure
split between few Indian manufacturers Insufficient electricity network
Well-structured dealer and service network for domestic OEMs Lack of government support/limited public money for public
Market barriers for entering OEMs caused by complex rules and transport
state structures as well as high import duties and capital Products with a lower construction quality compared to
investments European products
Domestic OEMs have strong cooperative partnerships with STUs
Opportunities Threats
Demand creation through the mandating of HEBs or PEBs in
public transport or through subsidies
Stringent fuel efficiency norms to support EV-sales Global player like Daimler, Volvo or BYD entering the market
High investments in the Indian infrastructure and road network High acquisition costs of HEB and PEB compared to conventional
over the next years diesel buses
High mobility needs due to a high level of urbanization Less price pressure to upgrade the technology due to the current
Government and industry investments in R&D in order to low of the crude oil price
become globally competitive Rail-based solutions and metro services
Implementation of BRTs across the country
India as a production and distribution hub to reach African and
Asian markets
Fraunhofer MOEZ Electric Buses 25 | 44Indian market overview
Technology trends
The current level of technology involvement is limited.59 The low and uncertain demand
for EV in the past led to significant underinvestment for specialized EV components.60
In India, the Lead-Acid technology holds a major share in electric vehicles battery.
Nevertheless, institutes like the Centre for Automotive Energy Materials runs R&D-
programs on materials and components for electric and hybrid vehicles. They especially
focus on the development of li-ion batteries as the biggest concern related to EVs is the
battery technology.61
OEMs like Ashok Leyland or Tata Motors already manufacture HEB or PEB and
undertake research on the development of powertrains and EES-systems. They
especially benefit from the technological expertise and R&D-level of their acquired
subsidiaries (Optare or Jaguar Land Rover Automotive). Other automotive
manufacturers like Mahindra Reva, composed of the former electric vehicle
manufacturer Reva and Mahindra & Mahindra, are also investing in alternative
technologies for the long term. However, a majority of the EV-technologies and
products still needs to be imported. Therefore, at the time of writing, mainly assembly
activities are taking place in India.62
The collaboration of Indian companies with foreign, technologically more sophisticated
products and the resulting higher expectations of quality, safety and reliability at
reasonable total cost of ownership will lead to technological advances of domestic
products.63 Additionally, stricter emission standards will necessitate more efficient and
cleaner technologies. Besides, the petrol and diesel prices have more than doubled in
India since 2000 and together with the raise of taxes on petrol and diesel (by the
incumbent Modi government), a shift to alternate technologies is becoming
increasingly important.64
59
Frost & Sullivan 2012b
60
Ministry of Urban Development 2012
61
International Advanced Research Centre for Powder Metallurgy & New Materials 2015
62
Ministry of Urban Development 2012
63
KPMG 2011
64
Mypetrolprice.com 2015
Fraunhofer MOEZ Electric Buses 26 | 44EU-India comparison & strategic
4 EU-India comparison & strategic recommendation recommendation
EU-India industry comparison
European companies are among the most innovative developers and producers of HEBs
and PEBs in the world. This is related to the steady improvement of key components of
the diesel or hybrid propulsion systems. Nevertheless, European OEMs as well as
suppliers lack behind in the development of suitable EES-solutions in order to catch-up
globally in the PEB-sector. However, OEMs of the first sector are under pressure by the
saturated European market and low-cost competition from Eastern Europe and Turkey
to globalize their sales as well as their production facilities in order to compete on a
global scale.
The Indian bus market is the second largest in the world and mainly divided between
the two domestic producers Tata and Ashok Leyland. Even though both companies
have introduced HEBs, both have been known for affordable products with basic
technological, comfort and security standards. Hence, the price difference between
Indian and European buses reflects the technological differences (See tab.2).
Nevertheless, Tata as well as Ashok Leyland are catching up in the PEB- and HEB-
market. For instance, Ashok Leyland plans to introduce a PEB in 2017. 65 Since the
Indian and other Asian markets offer massive growth potential, Indian OEMs see no
reason to expand to other markets than these emerging ones in Asia, South America or
Africa.
Diesel Bus Hybrid Bus Electric Bus Tab. 2: Assumed price
differences between European
and Indian OEMs
Europe $300,000 – $410,000 $450,000 – $540,000 $595,000 – $680,000
Source: Frost & Sullivan (2013)
India $75,000 - $110,000 $175,000 – $255,000 $325,000 – $400,000
Difference approx. 25% approx. 39-47% approx. 55-58%
As in other areas of vehicles, OEMs and suppliers have the chance to expand their
operations in the value chain in the electric bus segment. Utilities and 3rd parties can
position themselves as mobility providers, undermining OEMs’ positioning with respect
to the customers.
Major opportunity for the EU exists in the areas where only partial solutions exists like
in the case of batteries & technology to extend the range of EV’s, reducing the
charging time etc. (CTM)
65
Indian Autos Blog 2015
Fraunhofer MOEZ Electric Buses 27 | 44EU-India comparison & strategic
Market drivers and challenges recommendation
Since the European market is considered saturated, this chapter will solely focus on the
drivers and challenges of the Indian bus market.
Even though the Indian bus market is largely consolidated, it still offers growth
potential (also for foreign OEMs) due to its enormous size of at least 80,000 units
produced per year.66
The following reasons underline this assumption:
India’s prolonged growth has led to an uncontrollable urbanization as economic wealth
is mainly located in urban areas. Additionally, the urbanization is fueled by the
migration of the rural population and the general population growth. As a result, the
growing numbers of commuters are taking a toll on local transport and infrastructure
leading to massive congestion. Furthermore, noise- as well as GHG-emissions are
threatening the health and life quality of people in these regions. 67
PEBs as well as HEBs are promising solutions to tackle most of these issues since buses
are already used for 55% of total trips in Indian metropolitan regions. The national as
well as local governments have therefore implemented several policies. For instance, a
number of subsidies are focusing on alternative propulsion systems as well as new
infrastructure solutions like BRTS.68 Since the existing BRTS in Ahmedabad is considered
as a success story, a number of new BRTS are being built or are already implemented.69
Furthermore, the market entry of Volvo has triggered a paradigm shift in terms of
lower total lifetime costs and comfort. Indian bus companies have begun to realize that
it pays off to invest in high quality buses. This proves that there is a potential market
for high-quality buses from European OEMs.
Nevertheless, domestic and foreign OEMs are facing obstacles that might hinder
market growth. The JNNURM purchase program is not likely to be repeated in the near
future due to its long duration and extent. Because of this cities, municipalities, and
transport companies have little incentive to purchase PEBs or HEBs at the moment.
Additionally, the general rise of household income leads to a growing number of car
owners, who will be reluctant to travel by bus. 70 Another reason is that especially BRTS
face competition by rail and metro services, which are avoiding traffic altogether and
are considered more prestigious for a city. 71 Even though BRTS cost a fraction of rail
services, municipalities and cities have to invest in charging infrastructure in order to
electrify public bus services. Furthermore, the Indian infrastructure tends to be partly
unreliable, namely the insufficient electricity network which causes heavy blackouts.
Also the inadequate road infrastructure could make the purchase of expensive PEBs or
HEBs questionable.72
66
Motorindia 2013
67
World Bank 2013
68
Frost & Sullivan 2012b
69
Frost & Sullivan 2013
70
Verband der Automobilindustrie 2015
71
Business Standard 2015
72
Deutsche Presse-Agentur 2014
Fraunhofer MOEZ Electric Buses 28 | 44You can also read