The Economic and Monetary Union: Past, Present and Future - europa.eu
←
→
Page content transcription
If your browser does not render page correctly, please read the page content below
STUDY
Requested by the ECON committee

                The Economic and
                 Monetary Union:
                 Past, Present and
                       Future
                 Monetary Dialogue January 2019

          Policy Department for Economic, Scientific and Quality of Life Policies
                               Author: Marek Dabrowski
                        Directorate-General for Internal Policies                   EN
                               PE 631.040 - January 2019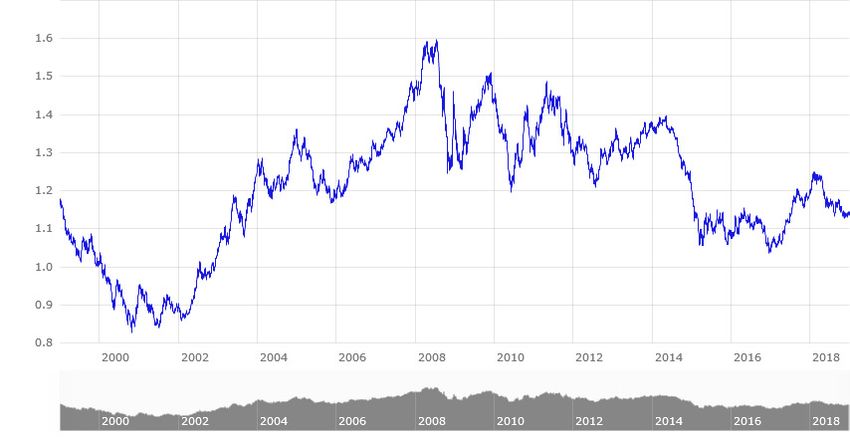
The Economic and
Monetary Union: Its
 Past, Present and
       Future
 Monetary Dialogue January 2019

Abstract
Twenty years of euro history confirms the euro’s stability and
position as the second global currency. It also enjoys the support
of majority of the euro area population and is seen as a good
thing for the European Union. The European Central Bank has
been successful in keeping inflation at a low level. However, the
European debt and financial crisis in the 2010s created a need for
deep institutional reform and this task remains unfinished.
This document was provided by Policy Department A at the
request of the Committee on Economic and Monetary Affairs.
This document was requested by the European Parliament's Committee on Economic and Monetary
Affairs.

AUTHORS
Marek Dabrowski, CASE – Center for Social and Economic Research

ADMINISTRATOR RESPONSIBLE
Dario PATERNOSTER

EDITORIAL ASSISTANT
Janetta CUJKOVA

LINGUISTIC VERSIONS
Original: EN

ABOUT THE EDITOR
Policy departments provide in-house and external expertise to support EP committees and other
parliamentary bodies in shaping legislation and exercising democratic scrutiny over EU internal
policies.

To contact the Policy Department or to subscribe for updates, please write to:
Policy Department for Economic, Scientific and Quality of Life Policies
European Parliament
L-2929 - Luxembourg
Email: Poldep-Economy-Science@ep.europa.eu

Manuscript completed in January 2019
© European Union, 2019

This document is available on the internet at:
http://www.europarl.europa.eu/committees/en/econ/monetary-dialogue.html

DISCLAIMER AND COPYRIGHT
The opinions expressed in this document are the sole responsibility of the authors and do not
necessarily represent the official position of the European Parliament.
Reproduction and translation for non-commercial purposes are authorised, provided the source is
acknowledged and the European Parliament is given prior notice and sent a copy.
For citation purposes, the study should be referenced as: Dabrowski, M., The Economic and Monetary
Union: Its Past, Present and Future, Study for the Committee on Economic and Monetary Affairs, Policy
Department for Economic, Scientific and Quality of Life Policies, European Parliament, Luxembourg,
2019.
The Economic and Monetary Union: Its Past, Present and Future

CONTENTS
LIST OF ABBREVIATIONS                                                                                               4
LIST OF FIGURES                                                                                                     6
LIST OF TABLES                                                                                                      6
EXECUTIVE SUMMARY                                                                                                   7
1.   INTRODUCTION                                                                                                   8
2.   HISTORY OF THE COMMON CURRENCY PROJECT AND ITS IMPLEMENTATION                                                  9
     2.1.    Historical and theoretic background                                                                    9
     2.2.    From the Werner Report to the Maastricht Treaty (1969-1992)                                           10
     2.3.    Preparation phase (1993-1998)                                                                         11
     2.4.    The first decade (1999-2008)                                                                          12
     2.5.    The second decade (2009-2018)                                                                         13

3.   EA PERFORMANCE IN ITS FIRST TWENTY YEARS                                                                      16
     3.1.    Inflation, exchange rate and the share in global official reserves                                    16
     3.2.    GDP growth and unemployment                                                                           18
     3.3.    Fiscal performance                                                                                    20
     3.4.    Public attitude to common currency                                                                    23

4.   LOOKING AHEAD: HOW TO REFORM THE EMU?                                                                         26
     4.1.    Does a monetary union need a deeper fiscal and political union?                                       26
     4.2.    How to deepen a fiscal and political union?                                                           27
     4.3.    Fiscal sustainability challenge                                                                       27
             4.3.1. Importance of fiscal discipline                                                                27
             4.3.2. Market discipline vs. fiscal rules                                                             28
             4.3.3. Debt mutualization: the wrong sort of federalism                                               29
             4.3.4. How to overhaul the EU fiscal discipline mechanism?                                            30
     4.4.    EMU enlargement                                                                                       30

REFERENCES                                                                                                         33

PE 631.040                                                    3
IPOL | Policy Department for Economic, Scientific and Quality of Life Policies
LIST OF ABBREVIATIONS
BLEU Belgium-Luxembourg Economic Union
BU Banking Union
EA Euro area
ECB European Central Bank
ECOFIN Economic and Financial Affairs Council
ECU European unit of account
EDIS European Deposit Insurance System
EDF Excessive Deficit Procedure
EEC European Economic Community
EFSF European Financial Stability Facility
ELA Emergency Liquidity Assistance
EMCF European Monetary Cooperation Fund
EMI European Monetary Institute
EMS European Monetary System
EMU Economic and Monetary Union
ERM Exchange Rate Mechanism
ESCB European System of Central Banks
ESM European Stability Mechanism
EU European Union
GDP Gross Domestic Product
GG general government
IMF International Monetary Fund
MIP Macroeconomic Imbalance Procedure
4 PE 631.040The Economic and Monetary Union: Its Past, Present and Future MRO Main Refinancing Operations OCA optimum currency area SGP Stability and Growth Pact TEU Treaty on European Union TFEU Treaty on the Functioning of the European Union UK United Kingdom US United States (of America) USD United States dollar WWI World War I WWII World War II PE 631.040 5
IPOL | Policy Department for Economic, Scientific and Quality of Life Policies

LIST OF FIGURES
Figure 1:     Inflation, end of period, 2000-2023 (in %)                                             16
Figure 2:     Exchange rate of EUR against USD, 1999-2018, in USD per 1 EUR                          17
Figure 3:     Currency composition of official exchange rate reserves, 2010-2018, in % of total
              allocated reserves                                                                     18
Figure 4:     Annual change in GDP, constant prices, 2000-2018 (in %)                                19
Figure 5:     Unemployment rate, 2000-2018 (in % of total labour force)                              19
Figure 6:     Support for the EUR as a home country currency, 2002-2018, in % of total number of
              respondents in the EA                                                                  23
Figure 7:     Support for the EUR as home country currency, 2017-2018, in % of total number of
              respondents in each EA country                                                         24
Figure 8:     Support for using the EUR in the EU, 2010-2018, in % of total number of respondents in
              the EA                                                                                 25

LIST OF TABLES
Table 1:      General government net lending/borrowing, 1999-2018 (in % of GDP)                      21
Table 2:      General government gross debt, 1999-2018 (in % of GDP)                                 22

                                                       6                                      PE 631.040
The Economic and Monetary Union: Its Past, Present and Future
EXECUTIVE SUMMARY
• The road to the European currency took more than 20 years. From the first memorandum of the
European Commission on this topic in 1969 and the Werner Report in 1970, to signing the
Maastricht Treaty in 1992, it took nearly 30 years until the euro was launched on 1 January 1999.
This road was not easy. The collapse of the Bretton Woods system in 1971, two oil price shocks in
the 1970s and the resulting stagflation delayed political approval of the project by more than a
decade. Then the crisis of the European Monetary System in 1992-1993 complicated Stage 1 of the
preparatory phase.
• The first two decades of euro functioning confirmed its stability, its role as the second most
important global currency, and the ability of the European Central Bank (ECB) to keep inflation low.
The euro enjoys the support of the majority of the euro area population and is seen as a good thing
for the European Union (EU).
• In most of its first decade (1999-2008), the European economy enjoyed high growth and
macroeconomic and financial stability. This changed, however, in the second decade (2009-2018)
when the global and European financial crises hit the European economy. The monetary response
of the ECB was largely adequate – the euro area managed to resist deflationary pressure coming
from a far-reaching financial disintermediation. However, countries which suffered from a
sovereign debt or banking crisis (or both) had to resist market pressures on their exit from the euro
area. Greece, which experienced the longest and most painful crisis, found itself on the verge of
leaving the euro area in July 2015, which was eventually avoided by the third rescue package
provided by the European Stability Mechanism (ESM).
• All crisis-affected countries that lost market access received a conditional bailout provided by other
euro area countries and the International Monetary Fund, with the support of the ECB. This meant,
however, circumventing a no-bailout clause in the Treaty on the Functioning of the European
Union. The content of rescue packages and how they were delivered remains a subject of political,
economic and legal controversy until now.
• The crisis experience triggered a series of institutional reforms in the EU and euro area. They
included, among others, strengthening the Stability and Growth Pact (SGP) and adopting the Fiscal
Compact, introducing national fiscal rules, launching the Macroeconomic Imbalance Procedure
and European Semester, setting up the ESM and Banking Union (without the European Deposit
Insurance System (EDIS), which is still a subject of political discussion).
• The reform of the euro area needs to continue. The reform agenda was elaborated in the Five
Presidents Report in 2015. However, there is a lack of consensus with respect to several proposals,
for example, the degree of further fiscal and political integration, debt mutualization, the euro area
budget, financial instruments which could cushion asymmetric shocks, etc.
• Given the high level of public debt in several euro area countries and the fiscal roots of most crisis
episodes, strengthening fiscal discipline is the most important task. This can be done by restoring
the no-bailout clause (market discipline) on the one hand and simplifying the SGP on the other.
• The EU member states that remain outside the euro area should consider euro adoption in the not-
so-distant future. This would make the EU more homogenous economically and politically and help
avoid institutional problems related to multi-speed integration.
PE 631.040 7IPOL | Policy Department for Economic, Scientific and Quality of Life Policies
1. INTRODUCTION
1 January 2019 marked the 20th anniversary of the launch of the European Union (EU)’s common
currency – the euro (EUR), after almost three decades of political and academic debate and preparatory
work. It constituted a major step forward in the process of economic and political integration in Europe.
After the first relatively tranquil decade, the beginning of the second decade brought with it a series of
strains and institutional challenges, which originated first from the global financial crisis of 2007-2009
and then from the series of debt and financial crises in the Euro area (EA) periphery. The sovereign debt
and financial crisis in Greece in 2010-2016 proved the most dramatic case in this series – the country
was on the verge of exiting from the common currency area in the summer of 2015.
Since 2010, under pressure from the crises, EA countries started reforms aimed both at resolving the
ongoing crises and increasing resilience against future turbulences. These measures involved the
creation of common rescue funds, which provided financial aid to countries in trouble, under the
condition that they conduct their respective macroeconomic adjustments and structural and
institutional reforms. The EA countries also strengthened fiscal discipline at the national level, adopted
a common monitoring framework of macroeconomic and structural policies, and created a Banking
Union (BU). However, towards the end of the second decade when the macroeconomic situation
improved and economic growth resumed, the political appetite for continuing those reforms faded.
For example, the BU, the most important piece of reforms adopted in the 2010s remains unfinished
because of the lack of consensus on how the European Deposit Insurance Scheme (EDIS) should be
designed (see Schoenmaker, 2018).
Overall, despite the crisis-related shocks in the first half of the 2010s, the common currency project
proved successful. The Euro (EUR) is the second most important global currency, after the US dollar
(USD). It has a largely stable exchange rate against other major currencies and annual inflation in the
EA has not exceeded the targeted 2% for most of its life time. However, looking ahead, there are at least
three challenges which should be addressed. First, the reform of the EA should be continued in order
to increase its resilience against future potential shocks. Second, the international role of the Euro
should be increased; this question was raised in the second half of 2018 by the European Commission.
Third, nine EU members states remain outside the EA (the so-called “outs”) even if seven of them
accepted the legal obligation to adopt the common currency when they joined the EU. This creates
various economic and political problems, including the phenomenon of multi-speed integration.
Again, since 2017, the European Commission (EC) initiated the policy of encouraging the “outs” to join
the EA once they are economically and politically ready.
The purpose of this briefing paper is to summarise the history of the Euro project and its
implementation, review its main accomplishments and unsolved problems and discuss the direction
of its further evolution in the subsequent decades of its existence.
The paper’s structure is as follows. In Section 2, we present a brief history and theoretical background
of the common currency project and its implementation both before its launch in 1999 and in the first
two decades of its functioning. In Section 3, we analyse the macroeconomic performance of the EA in
terms of exchange rate stability, inflation and its role as a reserve currency, growth and unemployment,
fiscal indicators as well as the attitude of EU citizens towards the common currency. In Section 4, we
discuss potential directions of the EA reform, including the perspectives for EA enlargement.
Our analysis has a narrative character and is based largely on a literature review and supported by
statistical presentations.
The author would like to thank Paulina Szyrmer for her editorial assistance.
8 PE 631.040The Economic and Monetary Union: Its Past, Present and Future
2. HISTORY OF THE COMMON CURRENCY PROJECT AND ITS
IMPLEMENTATION
In this section we present a brief history of the Euro project, including its historical roots and theoretical
background (Subsection 2.1), the road to the EMU (Subsection 2.2), the preparatory phase in the 1990s
(Subsection 2.3), and the first two decades of its functioning divided into two subperiods: 1999-2008
(Subsection 2.4) and 2009-2018 (Subsection 2.5)
2.1. Historical and theoretic background
The history of monetary unions1 of largely sovereign states in Europe preceded the post-WWII projects
of political and economic integration that led to the birth of the EEC in 1957 and then the EU in 1993.
It goes back to the 19th century when three monetary unions existed in Europe: the German Monetary
Union (prior to German political unification in 1871), the Latin Monetary Union (1865-WWI, formally
until 1927), the Scandinavian Monetary Union (1873-WWI). The German Monetary Union was gradually
created in the 1830s and 1840s and was preceded by a customs union (Zollverein) since 1834 (James,
1997).
Due to the technical specifications of monetary systems based on metallic standards, the 19th century
unions were concentrated on the unification of the gold and silver content of national coins and their
free circulation across unions’ member states (Cohen, 2008).
The gold standard, which dominated the world economy since the 1860s until WWI and then, in a
modified form, until the Great Depression of 1929-1933, can also be considered a looser form of a
monetary union (a system of permanently locked exchange rates to gold).
In the 20th century, the Belgium-Luxembourg Economic Union (BLEU) which had a common currency
(the franc) and existed between 1922 and 1998, can be considered a successful example of monetary
unification, albeit on a geographically smaller scale. After 1998, the franc was replaced by the Euro.
The modern intellectual background of monetary unification was provided by the optimum currency
area (OCA) theory, first elaborated by Mundell (1961) and then further developed by McKinnon (1963)
and other scholars. The original OCA theory tried to balance the advantages of stable exchange rates
(lower cross-border transaction costs) against the disadvantages coming from giving up an exchange
rate adjustment tool in the case of an asymmetric shock.
Consequently, the OCA was to be the area that would be unlikely to suffer from shocks due to its
internal synchronisation of the business cycle. Alternatively, if an asymmetric supply-side shock
happened anyway, it could be absorbed by either factor mobility (of labour and capital) or by fiscal
transfers within the OCA.
The OCA theory arose at a time when the Bretton Woods system of fixed-but-adjustable exchange
rates, indirectly linked to the gold parity via the USD started to experience increasing strains. The
inconsistency of national fiscal and monetary policies, especially in the US, the central country of this
system, with its established pegs was a major cause of these tensions. Furthermore, activist monetary
policy and free capital movement were inconsistent with fixed exchange rates – the principle of the
“impossible trinity” (see e.g. Frankel, 1999) or the “macroeconomic trilemma” (see e.g. Obstfeld et al,
2004), both based on the Mundell (1963) – Flemming (1962) model of an open economy.
1
For various definitions of monetary unions see Dabrowski (2015a).
PE 631.040 9IPOL | Policy Department for Economic, Scientific and Quality of Life Policies
Because economic policies in the post-WWII period referred predominantly to the Keynesian school,
they were based on the assumption of sticky prices and wages (at least in the short-term) and,
therefore, they preferred to use monetary and fiscal policies in business cycle management and
adjustment to shocks. This led to an interpretation of the OCA theory in favour of exchange rate
flexibility rather than monetary unification.
However, three important arguments were missed in this early debate. First, many existing national
states with single currencies did not constitute OCA according to Mundell (1961) and McKinnon’s
(1963) criteria but nobody suggested their monetary fragmentation. Second, once established, a
monetary union may help in the internal harmonization of economic policies and synchronisation of
business cycles, i.e., it leads to the endogenization of the OCA criteria (Frankel and Rose, 1998). Third,
for countries that face historical legacies of monetary instability and high inflation, and therefore,
limited public trust in their currencies, joining a monetary union provides an opportunity to overcome
these problems at a relatively low cost by importing credibility from the outside.
Interestingly, Mundell in his later publications (1973a, 1973b, 1997) supported the euro project,
referring to some of the above-mentioned arguments.
Nevertheless, the idea of a monetary union in Europe has been always controversial in academic circles,
both in the period of its formation (late 1980s and 1990s) and during its actual functioning, especially
when the debt and financial crisis hit the EA periphery between 2010 and 2016. Critiques of the single
currency have come both from representatives of the Keynesian school (e.g., Paul Krugman, 2011) and
the monetarist school (e.g., Friedman, 1997). However, a review of this debate remains beyond the
scope of this paper.
2.2. From the Werner Report to the Maastricht Treaty (1969-1992)
The first initiatives towards a single currency in the European Economic Community (EEC) go back to
1969 when the European Commission (1969) produced a memorandum on the co-ordination of
economic policies and monetary co-operation within the Community. It was followed by a decision at
the EEC summit in The Hague that same year to build the Economic and Monetary Union (EMU). In
response to the Council’s request, a group of experts, led by the Prime Minister and Minister of Finance
of Luxembourg, Pierre Werner, elaborated the first plan in 1970, according to which the EMU was to be
built in stages through the end of the 1970s 2.
However, the collapse of the Bretton Woods system in 1971 followed by a series of macroeconomic
turbulences and magnified additionally by two oil shocks (in 1973 and 1978) delayed the
implementation of the EMU project by almost two decades. In the meantime, EEC member states tried
to undertake partial coordination of monetary policies. First, in 1972, they established the “snake in the
tunnel”, a mechanism of limited managed floating of their currencies against each other. Then, at the
Brussels 1978 summit, they implemented the European Monetary System (EMS) based on a mechanism
of fixed-by-adjustable exchange rates, similar to the Bretton Woods system (see Muorlon-Druol, 2017).
This mechanism was called the Exchange Rate Mechanism (ERM1). Simultaneously, the same EEC
summit in Brussels created the European unit of account (ECU).
After adopting the Single Market program in 1985, interest in building the EMU came back. Although
in political and legal terms the common currency constituted a separate integration component from
the Single Market, in economic terms, it was a logical continuation of the former. The elimination of
2
This subsection draws from the official historical sheets of the European Parliament - see
http://www.europarl.europa.eu/factsheets/en/sheet/79/history-of-economic-and-monetary-union.
10 PE 631.040The Economic and Monetary Union: Its Past, Present and Future cross-border barriers to the free movement of goods, services, capital and people cannot be complete when each member state has its own currency, some with floating exchange rates (see European Commission, 1990). The first step in the new round was taken at the Hannover EEC summit in June 1988, which confirmed the goal of building the EMU and asked the Committee chaired by the European Commission President Jacques Delors to produce a report that would propose the concrete steps to achieve that goal. The Delors Report (Committee, 1989) presented in April 1989 was subsequently approved at the EEC summit in Madrid in June 1989. At this summit, it was also decided to take the first concrete step towards monetary and financial integration, that is, to abolish the remaining restrictions on capital movement by 1 July 1990. At the next EEC summit in Strasbourg in December 1989, policymakers decided to call the Inter- Governmental Conference to negotiate the respective Treaty changes. This resulted in drafting a new Treaty on the European Union, accepted by the EEC summit in Maastricht in December 1991 and formally signed on 7 February 1992. 2.3. Preparation phase (1993-1998) The smooth negotiation and approval of the EMU blueprint was possible due to the strong political partnership between the President of France, François Mitterrand, and German Chancellor Helmut Kohl (Mourlon-Druol, 2017). Geopolitical changes in Europe – the demise of the Soviet bloc, the reunification of Germany and the disintegration of the Soviet Union itself – also helped this process. However, the ratification of the Maastricht Treaty did not go smoothly in some countries. The first ratification referendum in Denmark on 2 June 1992 was narrowly lost. This led to granting this country an opt-out provision from adopting a common currency (similar to the UK, which received such an option at the time of negotiating the Maastricht Treaty). The second referendum in May 1993 approved the treaty changes. A similar referendum in France in September 1993 was only narrowly won (50.8%). In the UK, the treaty was ratified by only a very narrow majority in the Parliament. In addition to political troubles or perhaps partly as a result of them, in 1992-1993, the EMS was exposed to a series of speculative attacks (see Buiter et al., for their overview). They resulted in the devaluation of the British pound and the Italian lira (see Demertzis et al., 2017) in September 1992 and their withdrawal from the ERM1. In the subsequent months, Spain, Portugal and Ireland also had to devalue their currencies and the three Scandinavian countries (Finland, Norway and Sweden) had to abandon their unilateral pegs to the ECU (in the case of Finland and Sweden, the consequences of their domestic financial crises in the early 1990s also played an important role). The French franc was also subject to several rounds of speculative pressures. Eventually, in August 1993, the ERM1 fluctuation bands were broadened from +/-2.25% to +/- 15% against central parity. Struggling with the ERM1 crisis consumed most of the remaining Stage 1 time of the EMU implementation timetable (ending, according to the Maastricht Treaty, on 31 December 1993). This was a serious blow to the credibility of the EMS and the perspectives for a common currency project. Many commentators, in particular, those who were not enthusiasts of the EMU, saw it as its end. On the other hand, many economists interpreted this crisis as an empirical confirmation of the “impossible trinity” (see Subsection 2.1) and the unsustainability of the so-called intermediate or hybrid exchange rate regimes under which authorities try to manage simultaneously both money supply (or interest rates) and the exchange rate, in a world of unrestricted capital movement (see Eichengreen and Wyplosz, 1993; Obstfeld and Rogoff, 1995). Going towards a common currency (one of the forms of the so-called hard peg) should have eliminated this vulnerability. PE 631.040 11
IPOL | Policy Department for Economic, Scientific and Quality of Life Policies

Stage 2 of EMU implementation (1 January 1994 to 31 December 1998) happened under more tranquil
and orderly economic circumstances. This period brought several important institutional and policy
steps in preparation for launching the common currency 3:
•   Establishing the European Monetary Institute (EMI) on 1 January 1994 based on the existing (since
    1973) European Monetary Cooperation Fund (EMCF). The EMI was replaced by the European
    Central Bank (ECB) and the European System of Central Banks (ESCB) on 1 July 1998;
•   Introducing a ban on central bank credit to government and non-banking institutions/ companies;
•   Adjusting the national central bank legislation to the requirement of the Maastricht Treaty;
•   Adjusting national monetary and fiscal policies to meet the EMU accession criteria established by
    the Maastricht Treaty;
•   Accepting the name of the new currency (EUR) in December 1995;
•   Adopting the Stability and Growth Pact (SGP) by the European Council meeting in Amsterdam on
    16-17 June 1997 aimed at strengthening fiscal discipline on the national level;
•   Selection of 11 original members of the EMU (Austria, Belgium, Finland, France, Germany, Ireland,
    Italy, Luxembourg, the Netherlands, Portugal and Spain) which were to adopt the euro as of 1
    January 1999 by the European Council in Brussels on 3 May 1998;
•   Fixing irrevocable exchange rates between national currencies and EUR.

2.4.       The first decade (1999-2008)
On 1 January 1999 the new currency was launched along with the single ECB monetary policy and the
SGP entered into force. The new ERM2 mechanism was also launched which served as a two-year trial
period before the adoption of the Euro.
However, the monetary union was not complete in the first three years of its existence because there
were no Euro banknotes or coins. Therefore, all cash operations had to be conducted in old national
banknotes and coins. Together with the continued quotation of prices and wages in national currencies
(parallel to quoting in EUR) not much changed in the daily perception of the population and other cash
users. This change came three years later (since 1 January 2002) when EUR banknotes and coins
replaced the remnants of national currencies.
In the first decade of its functioning, the number of EMU members increased from the original 11 to 15
after admitting Greece (1 January 2001, probably the most controversial accession decision given
Greece’s chronic fiscal imbalances and the poor quality of its fiscal statistics), Slovenia (1 January 2007),
Cyprus and Malta (both on 1 January 2008). In addition, two countries outside the EU unilaterally
adopted the EUR as their national currencies: Montenegro (November 1999) and Kosovo (January
2002). The EUR is also used in four European microstates – Andorra, Monaco, San Marino and the
Vatican and in some overseas and dependent territories of the EU member states.
The ECB monetary policy was run smoothly, drawing on the credibility, track record, and operational
experience of the German Federal Bank (Bundesbank), institutionally the strongest central bank in the
EU before launching the euro, and the issuer of the EMS anchor currency (German Mark).
The primary objective of the ECB has been to maintain price stability, which has been operationalized
by the ECB Governing Council as maintaining “…inflation below, but close to, 2% over the medium term”

3
    See, among others, https://www.ecb.europa.eu/ecb/history/emu/html/index.en.html.

                                                       12                                         PE 631.040
The Economic and Monetary Union: Its Past, Present and Future
(ECB 2011, p.7). In its monetary policy decisions, the ECB has followed the stability-oriented two-pillar
strategy based on economic and monetary analysis (ECB 2011, p. 69-72), which differs from both
traditional monetary targeting and direct inflation targeting frameworks but draws from the
experience of both 4.
In the first decade, the ECB interest rate for main refinancing operations (MRO) varied between 2.00%
and 4.75% with the lowest level of 2.00% in the period between 6 June 2003 and 6 December 2005 and
the highest level of 4.75% in the short period between 6 October 2000 and 11 May 2001 5.
The actual inflation exceeded the 2% maximum inflation target through most of the examined period
(see Subsection 3.1) but the economy grew at a relatively high pace (see Subsection 3.2). Both trends
reflected the period of economic boom in the world economy, especially between 2003 and 2007,
which preceded the global financial crisis of 2007-2009 (see Dabrowski, 2018).
However, there were some warnings, especially towards the end of the first decade, which signalled
the possibility of later troubles.
First, fiscal discipline in most EMU member states remained weak, and both the Maastricht Treaty and
SGP criteria were not observed (see Subsection 3.3). This included the two largest member states –
France and Germany – which successfully pushed for the relaxation of the SGP rules in 2005. As a result,
most of EA did not built sufficient counter-cyclical fiscal buffers for the subsequent downturn period
(Dabrowski, 2015a).
Second, due to weak banking prudential regulations, the banking system in the EA and EU became
“infected” by imprudent practices and instruments originating from the US housing market and US
financial sector, which eventually led to banking crises in several EU member states (see Subsection
2.5).
Third, the successful introduction of the EUR led to a substantial decrease in nominal interest rates in
peripheral EA countries which, in many instances, became negative in real terms. This led to local credit
booms and housing bubbles in countries such as Spain, Ireland, Cyprus, Slovenia and others (similar to
the US) that busted once the global financial crisis started.
The last year of the first decade (2008) was already marked by the global financial crisis that started in
the US subprime mortgage market in the summer of 2007. Although this crisis reached Europe with
some time-lag, in the second half of 2008 all EA economies were already suffering from a recession and
serious tensions in the financial sector.
2.5. The second decade (2009-2018)
Most of the second decade of the EUR functioning had to be devoted to adopting various anti-crisis
measures and developing institutional changes aimed at increasing EA resilience in case of future
turbulences.
The second decade started in the aftermath of the global financial shock caused by the Lehman
Brothers collapse on 15 September 2008, which hit Europe immediately. The ECB reacted with gradual
cuts of MRO interest rates – from 4.25% in July 2008 to 1% in May 2009. Then after a short episode of
hiking the MRO rate to 1.25% in April 2011 and to 1.50% in July 2011, it was cut again to 1.25% in
4
A focus on monetary conditions (second pillar) can be considered an advantage as compared to “pure” inflation
targeters because it allows for detecting potential credit bubbles in their early stages (see Issing, 2003).
5
See https://www.ecb.europa.eu/stats/policy_and_exchange_rates/key_ecb_interest_rates/html/index.en.html.
PE 631.040 13IPOL | Policy Department for Economic, Scientific and Quality of Life Policies
November 2011 and then gradually down to 0.25% in November 2013 and further down to 0.05% in
September 2014 and 0.00% in March 2016.
The ECB deposit facility interest rate became negative in June 2014 and since March 2016 it has
amounted to -0.40% 6.
Apart from cutting interest rates, the ECB also used several “non-standard” measures aimed at
addressing the consequences of the global financial crisis and then, since 2010, of the European
sovereign debt and financial crisis. They both had an EA wide and country-specific character, for
example, the Emergency Liquidity Assistance (ELA) in the case of Greece (Praet, 2016).
In January 2015, after its short-term interest rates hit the zero-level band (see above), the ECB launched
large-scale quantitative easing operations (Constancio, 2015), which primarily targeted the sovereign
debt market, due to an insufficient supply of commercial bonds and papers.
Overall, the ECB seemed to be successful in resisting deflationary trends originating from the post-crisis
financial disintermediation and subsequent tightening of banking regulation. At the end of 2018 and
beginning of 2019, the main challenge that the ECB faces is the “normalisation” of its monetary policy
after a decade of using unconventional measures and very low interest rates (Dabrowski, 2018).
Apart from monetary shock, the global financial crisis of 2007-2009 led to banking crises in most EU
and EMU member states. To resolve those crises, substantial budget injections were needed, which
together with aggressive countercyclical fiscal policies and a recession led to a rapid increase in public
debt in relation to GDP in several countries (see Subsection 3.3).
Laeven and Valencia (2012, Table A2) estimated gross and net direct fiscal costs of policy responses to
systemic banking crises for the period 2007-11, which covered the first phase of the global financial
crisis and the early part of the European financial crisis 7. Gross direct fiscal outlays involve government
expenditure for bank recapitalization and asset purchases. Net fiscal outlays are equal to the difference
between gross outlays and amounts recovered.
The highest gross fiscal outlays were recorded in Ireland (40.7% of GDP), Greece (27.3% of GDP), the
Netherlands (12.7% of GDP) and the UK (8.8% of GDP). However, in the Netherlands and the UK, part of
the government support was recovered, so the net outlays in the analysed period amounted to 5.6%
and 6.6% of GDP, respectively.
As a result of mounting public debt and banking troubles (most frequently, a combination of both)
several EMU countries had to ask for external assistance – usually provided by the “Troika”, that is, the
International Monetary Fund (IMF), European Commission and ECB. A series of crises started from
Greece (May 2010) and then involved Ireland (November 2010), Portugal (April 2011), Spain (June 2012)
and Cyprus (June 2012). Italy (2011-2012 and then again 2017-2018) and Slovenia (2013-2014) also
experienced serious problems in their banking sectors (both) and in serving its public debt (Italy) but
avoided external assistance.
The Greek crisis was the longest and most painful. It lasted more than 8 years: Greece successfully
ended the last aid program in August 2018. In the summer of 2015, it was on the verge of leaving the
EA. At the very last minute, the government of Prime Minister Alexis Tsipras, which played with the idea
of Grexit in the first half of 2015 and took a confrontational approach to “Troika”, and a substantial part
of Greek society reflected on the devastating consequences that such an exit would have for the
6
See https://www.ecb.europa.eu/stats/policy_and_exchange_rates/key_ecb_interest_rates/html/index.en.html.
7
The analysed time span left out the later stages of banking crises in Greece, Spain, Cyprus, Slovenia and Italy.
14 PE 631.040The Economic and Monetary Union: Its Past, Present and Future
country and they returned to the negotiating table (see Dabrowski, 2015b; Darvas and Wolff, 2015).
This was probably the most dramatic test of sustainability of a common currency.
In the initial phase of the crisis, there were a lot of financial market speculations on the perspective of
leaving the EA by countries in trouble. In principle, there were two misconceptions behind those
speculations. The first was that sovereign default was considered equivalent to leaving the EA. The
second misconception considered an exit from the common currency area as another form of ordinary
devaluation. However, over time, markets learned that the construction of the EMU was much stronger
than any exchange-rate arrangement (like the ERM1) in the past or even a currency board (for example
Argentina which was forced to leave the currency board in 2002) and speculations gradually stopped.
On 26 July 2012, ECB Governor Mario Draghi famously declared that within its mandate “…the ECB is
ready to do whatever it takes to preserve the euro.” 8 This also contributed to making markets less nervous.
Despite internal troubles the EMU admitted four new members: Slovakia (1 January 2009), Estonia (1
January 2011), Latvia (1 January 2014) and Lithuania (1 January 2015).
The ongoing crisis encouraged the EU governing bodies and EU member states to undertake several
reform steps. They included, among others, the so-called Six-Pack legislation, which strengthened the
SGP, obliged member states to establish national fiscal rules and initiated the Macroeconomic
Imbalance Procedure (MIP) (in force since December 2011) and Two-Pack legislation (May 2013), the
European Semester (operational since November 2010), the European Financial Stability Facility (EFSF,
operational since June 2010) and the European Stability Mechanism (ESM, operational since October
2012), the Treaty on Stability, Coordination and Governance in the EMU (the so-called Fiscal Compact,
in force since January 1, 2013), and the Banking Union (2013).
The future-oriented debate on the new EMU institutional architecture initiated in this period led to the
publication of the so-called Five-Presidents Report (Juncker et al., 2015). However, the implementation
of this blueprint is going slowly. There is still a lot of intellectual and political disagreement on the
direction in which the EMU reform should go. We will return to this question in Section 4.
The flagship reform of the 2010s, the Banking Union, remains unfinished because of the lack of
consensus on how the EDIS should be designed (Schoenmaker, 2018). The main concerns relate to high
banks’ exposure to sovereign debt in some countries, the varied quality of this debt and the high-level
of non-performing loans (Stark, 2018).
The MIP procedure does not work in practice and both its conceptual foundations and practical
implementation raise various doubts (Dabrowski, 2015a). Despite its strengthening in 2011, the SGP is
not observed by all member states (see Subsection 2.3). The European Semester does not play the
expected role in peer-review and guiding countries’ fiscal, macroeconomic and structural policies
(Efstathiou and Wolff, 2018).
8
https://www.ecb.europa.eu/press/key/date/2012/html/sp120726.en.html.
PE 631.040 15IPOL | Policy Department for Economic, Scientific and Quality of Life Policies
3. EA PERFORMANCE IN ITS FIRST TWENTY YEARS
This section summarizes the macroeconomic performance of the EA since the launch of the common
currency project in 1999, the international role of the EUR and the attitude of EU/EA citizens to a
common currency. In subsection 3.1 we analyse inflation performance, the EUR-to-USD exchange rate
and the role of the EUR as the second most important reserve currency. Subsection 3.2 includes an
analysis of GDP and unemployment and Subsection 3.3 includes an analysis of fiscal indicators.
Subsection 3.4 presents the attitudes of EU/EA citizens to a common currency.
3.1. Inflation, exchange rate and the share in global official reserves
Figure 1 presents the end-of year inflation in the EA in comparison with the US and Japan, for the period
of 2000-2018. For most of the examined period, except for 2001, 2003, 2008, 2010, and 2012, the EA
had lower inflation than the US. However, until 2012, the EA inflation rate frequently exceeded 2% (the
upper inflation target of the ECB). This occurred in 2000-2002, 2004-2005, 2007, and 2010-2012. In
several years (2000, 2002, 2004-2007, 2011, and 2016-2017), US inflation also exceeded 2%, the official
inflation target of the Federal Reserve System since 2012. Furthermore, US inflation performance has
been slightly more volatile as compared to the EA, especially in the period preceding the global
financial crisis.
Figure 1: Inflation, end of period, 2000-2023 (in %)
5,0
4,0
3,0
2,0
1,0
0,0
-1,0
-2,0
EA Japan US
-3,0
2000 2001 2002 2003 2004 2005 2006 2007 2008 2009 2010 2011 2012 2013 2014 2015 2016 2017 2018
Note: data for 2018 based on the IMF staff estimate.
Source: IMF World Economic Outlook database, April 2018.
16 PE 631.040The Economic and Monetary Union: Its Past, Present and Future On the other hand, Japanese inflation was the most volatile among the three analysed currency areas and was systematically lower than in the EA and US, except for a short episode in 2014. During several years (2000-2003, 2005, and 2009-2012), it was even negative. Since 2000, the US has not recorded a negative inflation rate, and the EA—only once in 2014 (-0.2%). This means that the fear of deflation so prevalent in the economic debates of both the early 2000s and the early 2010s was not well grounded. Figure 2 shows the EUR exchange rate against the USD. Between 1999 and 2018, it fluctuated in the range of 0.8 USD to 1.6 USD for 1 EUR, which reflected a divergence in business cycles and monetary policy cycles in the US and EA. The weakest exchange rate of the EUR (below 1 USD for 1 EUR) was recorded between 2000 and 2003, and the strongest was recorded just before the global financial crisis (2006-2008). Since 2015, the fluctuation band has narrowed and the exchange rate has been oscillating around 1.10-1.2o USD for 1 EUR. Interestingly, in the period of the debt and financial crisis in the EA periphery, the EUR remained relatively strong – between 1.2o to 1.50 USD for 1 EUR. This means the credibility of the EUR was never questioned by financial markets despite speculations of countries in trouble potentially exiting the common currency area. Figure 2: Exchange rate of EUR against USD, 1999-2018, in USD per 1 EUR Source: ECB. Figure 3 presents the composition of the global official foreign exchange reserves by major currencies. The EUR occupies the second position after the USD and is well ahead other currencies. However, its share did not increase in the reported period (2010-2018). It fluctuates in the range of 20-20% of total allocated reserves depending on changes in its exchange rate (in the beginning of the 2010s it was higher because of a stronger exchange rate). Central banks’ demand for reserve currencies are determined mainly by private sector transactions and their needs and preferences. In turn, the latter depend on the so-called network externalities and depth of financial markets in a given currency and the liquidity and sophistication of available financial instruments. In this respect, due to the unfinished process of building a Banking Union and Capital PE 631.040 17
IPOL | Policy Department for Economic, Scientific and Quality of Life Policies

Market Union, the EA remains behind the USD currency area. Therefore, changing this situation and
increasing the international role of the EUR as declared in the State of the Union address to the
European Parliament in September 2018 will take time and will require a coordinated effort in many
policy fields (see Efstathiou and Papadia, 2018)

Figure 3:          Currency composition of official exchange rate reserves, 2010-2018, in % of
                   total allocated reserves
    100%

    90%

    80%

    70%

    60%

    50%

    40%

    30%

    20%

    10%

     0%
           Q1 2010
           Q2 2010
           Q3 2010
           Q4 2010
           Q1 2011
           Q2 2011
           Q3 2011
           Q4 2011
           Q1 2012
           Q2 2012
           Q3 2012
           Q4 2012
           Q1 2013
           Q2 2013
           Q3 2013
           Q4 2013
           Q1 2014
           Q2 2014
           Q3 2014
           Q4 2014
           Q1 2015
           Q2 2015
           Q3 2015
           Q4 2015
           Q1 2016
           Q2 2016
           Q3 2016
           Q4 2016
           Q1 2017
           Q2 2017
           Q3 2017
           Q4 2017
           Q1 2018
           Q2 2018
           Q3 2018
                          USD     EUR    CNY        JPY   GBP   AUD   CAD   CHF   others

Source: IMF COFER (as of 13 January 2019).

3.2.        GDP growth and unemployment
Figures 4-5 present the annual changes in real GDP and unemployment rates in the US, the EA, and
Japan for the period of 2000-2018. 9
Regarding GDP dynamics, Figure 4 clearly shows that the three largest advanced economies have not
been leaders in terms of the world’s economic growth (in fact, they lost their leadership roles in the
early 1990s). Global growth has been increasingly driven by the catch-up growth of emerging-market
and developing economies before, during, and after the global financial crisis of 2007-2009.
The US outperformed the EA and Japan for most of the examined period, except for 2001 (the dotcom
recession and the shock which followed the 9/11 terrorist attack), 2006-2008, 2010, and 2016. Japan
systematically underperformed, except for 2010 and 2013. The EA also underperformed, except for
2001, 2006-2008, and 2016; however, it performed better than Japan, except for 2003 and 2012-2013
(the peak of the EA financial crisis).

9
     This subsection draws from Dabrowski (2018).

                                                           18                               PE 631.040
The Economic and Monetary Union: Its Past, Present and Future
Figure 4: Annual change in GDP, constant prices, 2000-2018 (in %)
5
4
3
2
1
0
-1
-2
-3 EA Japan US
-4
-5
-6
2000 2001 2002 2003 2004 2005 2006 2007 2008 2009 2010 2011 2012 2013 2014 2015 2016 2017 2018
Note: data for 2018 based on the IMF staff estimate.
Source: IMF World Economic Outlook database, April 2018.
Figure 5: Unemployment rate, 2000-2018 (in % of total labour force)
12,0
11,0
10,0
9,0
8,0
7,0
6,0
5,0
4,0
3,0
EA Japan US
2,0
2000 2001 2002 2003 2004 2005 2006 2007 2008 2009 2010 2011 2012 2013 2014 2015 2016 2017 2018
Note: data for 2018 based on the IMF staff estimate.
Source: IMF World Economic Outlook database, April 2018.
PE 631.040 19IPOL | Policy Department for Economic, Scientific and Quality of Life Policies
Comparing the EA with the US, the former had two periods of lower growth—between 2002 and 2005
and between 2009 and 2015. In 2016-2017, the growth rates of both economies tended to converge.
A decade after the eruption of the global financial crisis, it is also clear that neither the EA, nor the US
are going to return to their pre-crisis rates of growth, at least not in the near future. This is not only a
consequence of the unhealthy character of the pre-crisis boom, which was based on several financial
bubbles (see Dabrowski, 2010) and crisis-related wounds (for example, far-reaching financial
deleveraging—see Subsection 3.1). It is also a result of changes in supply-side factors—not always
necessarily in favour of faster growth. They include a decline in the working-age population (Europe
and Japan), population aging, and the end of the main phase of the third industrial revolution based
on the mass implementation of information and communication technologies, which caused slow
growth in total factor productivity as compared to the second half of the 1990s and early 2000s
(Gordon, 2016, pp. 601-602).
Figure 5 shows that the differences in the unemployment rates of the three analysed currency areas
have a systematic character. Japan has had the lowest unemployment rates, despite also having the
lowest inflation and growth rates. The US has also recorded relatively low unemployment rates, except
for the post-crisis period of 2009-2012, but they are higher than those of Japan. The EA has had the
highest level of unemployment. The differences in unemployment rates seem to be determined by the
differences in the labour market institutions in individual economies.
3.3. Fiscal performance
Tables 1 and 2 present basic fiscal indicators – general government (GG) net lending/ borrowing (that
is, GG balance) and gross debt, both in relation to GDP – for all EA countries and, for comparison, for
the US, UK and Japan. Both tables cover the period of EUR functioning, that is, 1999-2018.
As seen in Table 1, all EA countries except Estonia did not observe the deficit criterion (max. 3% of GDP)
for at least a few years, sometimes much longer as in the case of Greece, Portugal, France, Cyprus, Italy
or Spain. There is little comfort in the fact that Japan, the UK and US are doing even worse.
Despite some improvement in current fiscal balances since 2015 and an ongoing economic boom, in
several countries this is not enough to significantly decrease the debt-to-GDP ratio and create fiscal
buffers for the future. One must remember that 2015-2018 were characterised not only by growth
recovery (Figure 4) but also by record-low interest rates (see Subsection 2.5).
Table 2 shows that there is still a substantial number of EA countries in which GG gross debt exceeds
the Maastricht limit of 60% of GDP. In 2018, seven countries recorded a very high debt level: Greece
(188.1% of GDP), Italy (130.3% of GDP), Portugal (120.8% of GDP), Cyprus (112.3% of GDP), Belgium
(101.1% of GDP), Spain (97.2% of GDP) and France (96.7%). Among previously highly-indebted
countries, only Ireland and Germany managed to substantially reduce their debt levels.
This situation makes the EA vulnerable to any future shocks, especially in the case of growth
deterioration, banking troubles, increase in market interest rates or political turbulence.
20 PE 631.040The Economic and Monetary Union: Its Past, Present and Future
Table 1: General government net lending/borrowing, 1999-2018 (in % of GDP)
Country 1999 2000 2001 2002 2003 2004 2005 2006 2007 2008 2009 2010 2011 2012 2013 2014 2015 2016 2017 2018
Austria -2.6 -2.1 -0.7 -1.9 -1.4 -4.8 -2.5 -2.6 -1.4 -1.5 -5.4 -4.5 -2.6 -2.2 -2.0 -2.7 -1.0 -1.6 -0.7 -0.2
Belgium -0.6 -0.1 0.2 0.0 -1.8 -0.2 -2.8 0.2 0.1 -1.1 -5.4 -4.0 -4.1 -4.2 -3.1 -3.1 -2.5 -2.5 -1.0 -1.2
Cyprus -4.1 -2.2 -2.1 -4.1 -5.9 -3.7 -2.2 -1.0 3.2 0.9 -5.4 -4.7 -5.7 -5.6 -3.3 -0.2 -0.2 0.4 1.8 2.1
Estonia -3.4 -0.1 0.2 0.4 1.8 2.4 1.1 2.9 2.7 -2.7 -2.2 0.2 1.2 -0.3 -0.2 0.7 0.1 -0.3 -0.3 -0.5
Finland 1.6 6.7 4.9 4.0 2.3 2.2 2.6 3.9 5.1 4.2 -2.5 -2.6 -1.0 -2.2 -2.6 -3.2 -2.8 -1.8 -0.6 -0.9
France -1.6 -1.3 -1.4 -3.2 -4.0 -3.6 -3.4 -2.4 -2.6 -3.3 -7.2 -6.9 -5.2 -5.0 -4.1 -3.9 -3.6 -3.6 -2.6 -2.6
Germany -1.7 0.9 -3.1 -3.9 -4.2 -3.7 -3.4 -1.7 0.2 -0.2 -3.2 -4.2 -1.0 0.0 -0.1 0.6 0.8 0.9 1.0 1.5
Greece -5.8 -4.1 -5.5 -6.0 -7.8 -8.8 -6.2 -5.9 -6.7 -10.2 -15.1 -11.2 -10.3 -6.6 -3.6 -4.0 -2.8 0.7 1.1 0.5
Ireland 2.4 4.9 1.0 -0.5 0.4 1.3 1.6 2.8 0.3 -7.0 -13.8 -32.0 -12.8 -8.1 -6.1 -3.6 -1.9 -0.5 -0.3 -0.2
Italy -1.8 -2.4 -3.4 -3.0 -3.3 -3.5 -4.1 -3.5 -1.5 -2.6 -5.2 -4.2 -3.7 -2.9 -2.9 -3.0 -2.6 -2.5 -2.3 -1.7
Latvia -3.4 -2.5 -2.0 -2.5 -1.6 -1.0 -1.0 -0.5 0.6 -3.2 -7.0 -6.5 -3.2 0.2 -0.6 -1.7 -1.5 -0.4 -0.8 -1.2
Lithuania -8.3 -4.0 -3.6 -1.8 -1.3 -1.5 -0.5 -0.4 -1.0 -3.3 -9.3 -6.9 -8.9 -3.1 -2.6 -0.7 -0.2 0.3 0.5 0.6
Luxembourg 3.7 5.9 5.9 2.4 0.2 -1.3 0.1 1.9 4.2 3.3 -0.7 -0.7 0.5 0.3 1.0 1.3 1.4 1.6 1.5 1.1
Malta n/a -5.8 -6.5 -5.7 -9.1 -4.4 -2.6 -2.5 -2.1 -4.2 -3.2 -2.4 -2.4 -3.5 -2.4 -1.8 -1.1 1.0 3.9 1.7
Netherlands 0.3 1.9 -0.3 -2.1 -3.0 -1.7 -0.3 0.2 0.2 0.2 -5.4 -4.9 -4.2 -3.8 -2.3 -2.2 -2.0 0.4 1.1 0.6
Portugal -3.0 -3.4 -4.8 -3.8 -4.4 -6.1 -6.2 -4.2 -3.0 -3.8 -9.8 -11.2 -7.4 -5.7 -4.8 -7.1 -4.3 -2.0 -3.0 -0.7
Slovakia -7.3 -12.0 -6.4 -8.1 -2.7 -2.3 -2.9 -3.6 -1.9 -2.4 -7.8 -7.5 -4.3 -4.3 -2.7 -2.7 -2.7 -2.2 -1.0 -0.7
Slovenia -0.6 -1.2 -1.2 -1.4 -1.3 -1.3 -1.0 -0.8 0.3 -0.3 -5.4 -5.2 -5.5 -3.1 -13.8 -5.8 -3.3 -1.7 -0.8 0.2
Spain -1.4 -1.1 -0.5 -0.4 -0.4 0.0 1.2 2.2 1.9 -4.4 -11.0 -9.4 -9.6 -10.5 -7.0 -6.0 -5.3 -4.5 -3.1 -2.7
Japan -6.9 -8.3 -6.5 -7.9 -8.0 -5.9 -5.0 -3.5 -3.2 -4.5 -10.2 -9.5 -9.4 -8.6 -7.9 -5.6 -3.8 -3.7 -4.3 -3.7
UK 0.6 1.4 0.2 -1.9 -3.1 -3.1 -3.1 -2.8 -2.6 -5.2 -10.1 -9.3 -7.5 -7.6 -5.3 -5.4 -4.2 -2.9 -1.8 -2.0
US n/a n/a -0.1 -3.3 -4.3 -3.9 -2.8 -1.7 -2.5 -6.3 -12.7 -10.6 -9.3 -7.6 -4.1 -3.7 -3.2 -3.9 -3.8 -4.7
Note: red font IMF staff estimate.
Source: IMF World Economic Outlook database, April 2018.
PE 631.040 21IPOL | Policy Department for Economic, Scientific and Quality of Life Policies
Table 2: General government gross debt, 1999-2018 (in % of GDP)
Country 1999 2000 2001 2002 2003 2004 2005 2006 2007 2008 2009 2010 2011 2012 2013 2014 2015 2016 2017 2018
Austria 61.1 65.7 66.4 67.0 64.9 64.8 68.3 67.0 64.7 68.4 79.6 82.4 82.2 81.7 81.0 83.8 84.3 83.6 78.6 74.2
Belgium 114.4 108.8 107.6 104.7 101.1 96.5 94.7 91.1 87.0 92.5 99.5 99.7 102.6 104.3 105.5 107.0 106.1 106.0 103.4 101.2
Cyprus 55.7 56.0 57.5 61.0 63.0 64.7 64.0 59.0 53.1 44.1 52.8 55.8 65.2 79.2 102.1 107.5 107.5 106.6 97.5 112.3
Estonia 6.0 5.1 4.8 5.7 5.6 5.1 4.5 4.4 3.7 4.5 7.0 6.6 6.1 9.7 10.2 10.7 10.0 9.4 9.0 8.8
Finland 44.0 42.5 40.9 40.2 42.7 42.6 39.9 38.1 34.0 32.7 41.7 47.1 48.5 53.9 56.5 60.2 63.5 62.9 61.3 60.5
France 60.5 58.9 58.3 60.3 64.4 65.9 67.4 64.6 64.5 68.8 83.0 85.3 87.8 90.6 93.4 94.9 95.6 96.6 96.8 96.7
Germany 60.0 58.9 57.7 59.4 63.1 64.8 67.0 66.5 63.7 65.2 72.6 80.9 78.6 79.8 77.5 74.6 70.9 67.9 63.9 59.8
Greece 98.9 104.9 107.1 104.9 101.5 102.9 107.4 103.6 103.1 109.4 126.7 146.3 180.6 159.6 177.9 180.2 178.8 183.5 181.8 188.1
Ireland 46.6 36.1 33.2 30.6 29.9 28.2 26.1 23.6 23.9 42.4 61.5 86.0 110.9 119.9 119.8 104.3 76.9 73.6 68.6 66.6
Italy 109.7 105.1 104.7 101.9 100.5 100.1 101.9 102.6 99.8 102.4 112.5 115.4 116.5 123.4 129.0 131.8 131.5 132.0 131.8 130.3
Latvia 11.8 12.1 13.9 13.1 13.9 13.8 11.2 9.2 7.2 16.2 32.5 40.3 37.5 36.7 35.8 38.5 34.9 37.4 36.3 35.0
Lithuania 28.1 23.5 22.9 22.1 20.4 18.7 17.6 17.2 15.9 14.6 29.0 36.2 37.2 39.8 38.8 40.5 42.6 40.1 39.7 37.0
Luxembourg 7.1 6.5 6.9 6.8 6.8 7.3 7.4 7.8 7.7 14.9 15.7 19.8 18.7 21.7 23.7 22.7 22.0 20.8 23.0 22.8
Malta 69.5 64.2 70.1 64.9 68.7 71.1 70.0 64.5 62.3 62.6 67.6 67.5 70.1 67.7 68.4 63.7 58.6 56.3 50.7 45.1
Netherlands 57.5 50.9 48.2 47.5 48.7 49.1 48.5 44.1 42.0 53.8 55.8 58.6 60.8 65.5 67.0 67.1 64.0 61.3 56.5 53.1
Portugal 51.0 50.3 53.4 56.2 58.7 62.0 67.4 69.2 68.4 71.7 83.6 90.5 111.4 126.2 129.0 130.6 128.8 129.9 125.7 120.8
Slovakia 47.1 49.6 48.3 42.9 41.6 40.6 34.1 31.0 30.1 28.5 36.3 41.2 43.7 52.2 54.7 53.5 52.3 51.8 50.9 49.2
Slovenia 22.0 29.0 28.5 28.4 27.0 26.8 26.3 26.0 22.7 21.6 34.5 38.2 46.4 53.8 70.4 80.3 82.6 78.6 73.6 69.7
Spain 62.5 58.0 54.2 51.3 47.6 45.3 42.3 38.9 35.5 39.4 52.7 60.1 69.5 85.7 95.5 100.4 99.4 99.0 98.4 97.2
Japan 131.1 137.9 146.8 156.8 162.7 171.7 176.8 176.4 175.4 183.4 201.0 207.9 222.1 229.0 232.5 236.1 231.3 235.6 237.6 238.2
UK 39.8 37.0 34.3 34.4 35.6 38.6 39.8 40.7 41.7 49.7 63.7 75.2 80.8 84.1 85.2 87.0 87.9 87.9 87.5 87.4
US n/a n/a 53.2 55.6 58.7 66.2 65.6 64.3 64.8 73.8 86.9 95.5 99.9 103.3 104.9 104.6 104.8 106.8 105.2 106.1
Note: red font IMF staff estimate.
Source: IMF World Economic Outlook database, April 2018.
22 PE 631.040The Economic and Monetary Union: Its Past, Present and Future
3.4. Public attitude to common currency
Public attitudes to the EUR can either be measured by the results of opinion polls or analysed by the
observation of microeconomic behaviour (portfolio choices). The first approach is represented, among
others, by the European Commission’s annual Eurobarometer surveys (see e.g. Eurobarometer, 2018),
which provide comparable results of opinion polls for long periods of time.
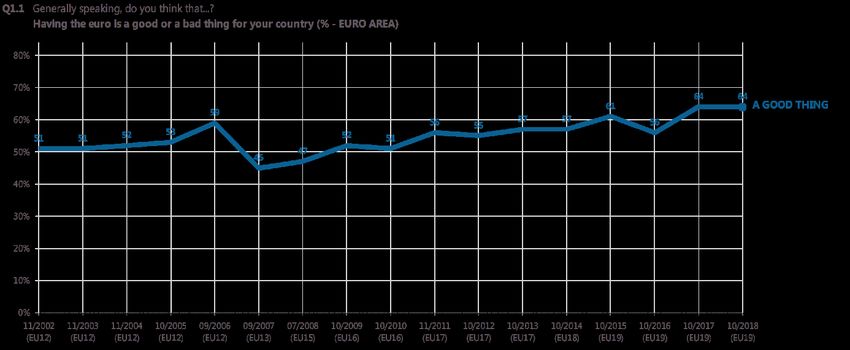
Measuring support for the EUR as a home country currency started in 2002 when EUR cash was
introduced into circulation. This support has remained relatively stable, above 50% (Figure 6). Only in
2007 was a substantial drop in support recorded. Since 2011, a period of debt and financial crisis on the
EA periphery, support for the EUR has grown systematically, reaching 64% in 2017.
Figure 6: Support for the EUR as a home country currency, 2002-2018, in % of total
number of respondents in the EA
Source: https://ec.europa.eu/info/news/eurobarometer-2018-nov-20_en.
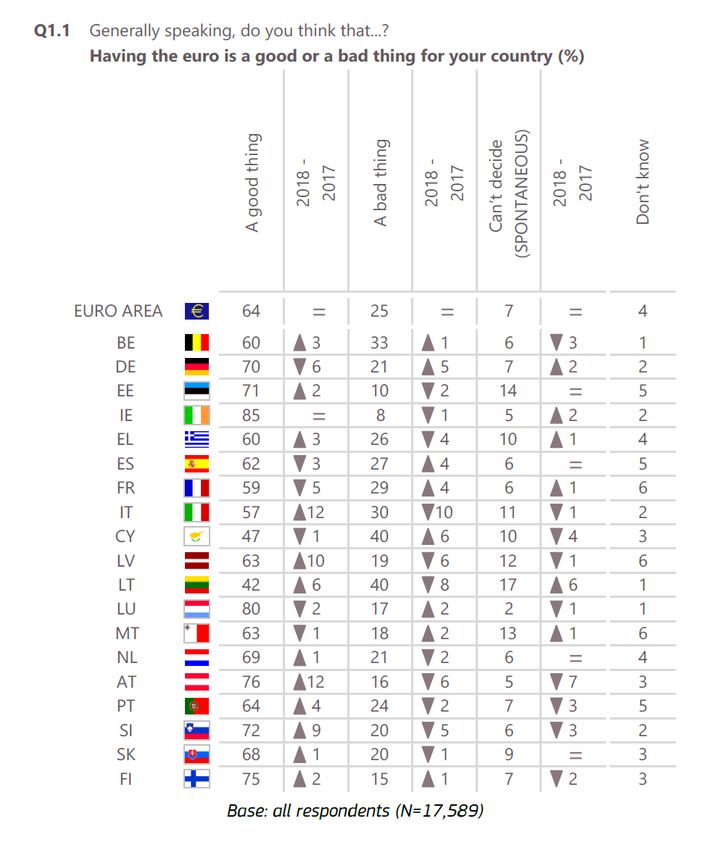
Looking at the survey results by individual countries (Figure 7), a differentiation of support is obvious
but not as dramatic as one might expect following national political discourses. In 2018, the highest
support was recorded in Ireland (85%) followed by Luxembourg (80%) and Austria (76%). The lowest
support (below 50%) was recorded in Cyprus (47%) and Lithuania (42%).
Interestingly, in Italy where two ruling political parties voiced a sceptical approach to EUR, public
support for the common currency increased dramatically (by 12 percentage points) between 2017 and
2018. In countries which suffered from debt and financial crises just a few years earlier and whom many
commentators and experts advised to leave the EA (Greece, Ireland, Portugal, Spain, Slovenia), support
for the EUR remains high. Cyprus is the only post-crisis country where support is low.
Figure 8 presents support for the EUR as a potentially good thing for the entire EU. The time series is
shorter (since 2010) but results look even better than in the case of the previous question. However, it
is worth remembering that this question is more “abstract” for most respondents than the question
related to their home countries.
PE 631.040 23You can also read