The cost of adjustment: emerging challenges for the UK economy - IFS Green Budget 2020: Chapter 3 - Institute for Fiscal ...
←
→
Page content transcription
If your browser does not render page correctly, please read the page content below

lnstitute for Fiscal Studies

IFS Green Budget 2020: Chapter 3

Benjamin Nabarro

The cost of
adjustment:
emerging
challenges for the
UK economy

132 The IFS Green Budget: October 2020
3. The cost of
adjustment:
emerging challenges
for the UK economy
Benjamin Nabarro (Citi)
Key findings
1 Brexit remains a substantial economic challenge for the UK. The
options currently on the table appear to be restricted to only a
thin trade deal or a no-deal exit. We anticipate that the former
case would leave the UK economy 2.1% smaller in 2021
than in a counterfactual where the transition period
continues indefinitely; a no-deal exit could see output
depressed by an additional 0.5–1.0%.
2 The path that Brexit-related economic impacts take over the
next 12–24 months will depend on when changes associated
with the UK’s exit from the Single Market and Customs Union
begin to materialise, and the extent to which firms have already
acted to improve their resilience. We think the majority of
Brexit-related adjustment lies ahead. Weak sterling since
2016 has provided an incentive for many firms to maintain UK
operations where they can, even if now unviable in the longer
term. Low investment to date may reflect some long-term
adjustment, but also reduces overseas firms’ economic ties to
the UK. Brexit-related adjustments could now therefore prove
more front loaded.
The Institute for Fiscal Studies, October 2020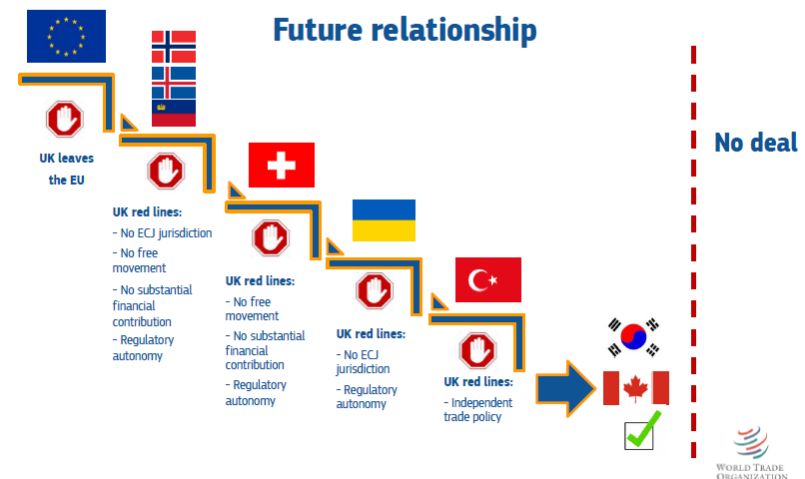
The cost of adjustment: emerging challenges for the UK economy 133
3 Both COVID and Brexit are likely to result in medium-term
economic reconfiguration, as well as near-term disruption.
The UK labour market, in particular, has shown itself better able
to adjust during previous downturns than other countries. Even
so, the ‘double whammy’ of COVID and Brexit will make
adjusting to the new normal a huge challenge.
4 Adjustment to a post-COVID, post-Brexit new normal will
have economic costs that last into the long term. A
rebalancing away from the consumer services sector (COVID)
and some parts of manufacturing and financial/ business
services (Brexit) would make much of the accumulated capital
and skills in these sectors less valuable. For workers, the longer
they remain unemployed, the worse their prospects in the labour
market. This can have consequences that last for decades.
5 The economic response to COVID-19 has seen monetary and
fiscal policy complement each other, as the Bank of England
and the government both seek to support the economy.
However, this complementarity is less assured in the medium
term: upward pressure on inflation (and particularly inflation
expectations) could lead to the Bank tightening monetary
policy even if fiscal policy still needs to remain loose. The
UK’s dependence on foreign credit remains a notable additional
vulnerability. More fiscal support will likely be needed in the near
term. But getting the public finances on a sustainable trajectory
in the medium term is also now a key challenge.
3.1 Introduction
All indications are that the UK and the EU are on track to agree only a ‘thin’ trade
deal (if any). This sort of agreement is unlikely to avert most of the adverse
consequences for UK–EU trade associated with Brexit. Deal or no deal, the UK is
therefore on track for substantial economic disruption after the end of the transition
period on 31 December 2020.
The Institute for Fiscal Studies, October 2020134 The IFS Green Budget: October 2020 By and large, the consequences of Brexit will be felt in different parts of the economy from the consequences of the pandemic. However, we think impairments associated with COVID are still likely to compound the near-term economic consequences of Brexit – weighing on both public and private preparedness as well as firm resilience. We expect additional Brexit-related disruption to leave output 2.1% lower in 2021 compared with a counterfactual scenario in which the UK remained in the Single Market and Customs Union. In a normal year, this would be sufficient to push the UK economy into a recession. While we expect some of these losses to be recovered over subsequent years, some permanent losses are also likely. Both Brexit and COVID imply significant structural reconfiguration in the UK economy in the years to come. Brexit is likely to imply persistently lower trade volumes, even with additional trade agreements. The implication is that some of the sectors where the UK specialises (where exports make up a large share of economic activity) will become smaller, with an associated reduction in economic capacity. While at this stage only a matter of judgement, we also expect COVID to have similar – and indeed larger – long-term ramifications. We expect some permanent reductions in consumer services demand in the wake of the pandemic, for example, as more choose to work from home and cause a more permanent move of economic activity outside of major city centres. This would also imply a permanent write- down to certain, specific, capacity. We expect output to remain 4.5–5.0% below its 2016–19 trajectory in 2024. We expect this gap to persist thereafter. As Figure 3.1 shows, this is equivalent to an annualised GDP loss of £109 billion in 2016 prices. Roughly 1–1.5 percentage points (ppt) of this effect is the result of permanent reconfiguration and additional write-offs associated with the UK’s exit from the EU Single Market and Customs Union. While Brexit uncertainty has (as we noted last year) likely weighed on UK growth between 2016 and 2019, the additional impact from here reflects the confirmation of a more distant relationship with the EU than might have been previously expected and (as we discuss below) our view that most of the associated economic costs still likely lie ahead. The remaining 3–3.5ppt is the result of more permanent reconfiguration in the aftermath of COVID-19. The Institute for Fiscal Studies, October 2020
The cost of adjustment: emerging challenges for the UK economy 135
Figure 3.1. UK real quarterly GDP in various policy scenarios (2016 prices)
600
580
Quarterly real GDP (£bn)
560
540
520
500
480
460
440
420
400
Mar-19
Mar-20
Mar-21
Mar-22
Mar-23
Mar-24
Sep-19
Dec-19
Sep-20
Dec-20
Sep-21
Dec-21
Sep-22
Dec-22
Sep-23
Dec-23
Sep-24
Dec-24
Jun-21
Jun-19
Jun-20
Jun-22
Jun-23
Jun-24
Actual Citi forecast No Brexit 2016–19 trend
Note: GDP is calculated as a chained value measure. The OBR-EFO reference scenario is
derived from tables 2.3 and 2.7 from the March 2020 Economic and Fiscal Outlook.
Source: ONS, OBR and Citi Research.
This degree of economic pain implies that policy support is likely to remain
necessary well into 2022. With monetary policy constrained, fiscal policy will
continue to carry the primary burden. For now, fiscal and monetary policy are
working in harmony to support the economy: as Chapter 5 discusses, the prospect
of low inflation for some time to come means that the Bank of England is expected
to keep monetary policy loose for the next few years. But in the medium term, such
support is clearly not guaranteed: despite the subdued outlook for overall growth,
broader economic reconfiguration could put upward pressure on inflation
expectations in particular. This could risk a tightening of monetary policy, even
before the economy has recovered to potential.
In the longer term, both COVID and Brexit constitute risks not just to the level of
output, but to potential growth rates. Weak productivity has been the UK
economy’s ‘Achilles heel’ since the financial crisis. Labour productivity in the UK
is already estimated to be 20% below its pre-financial crisis trend, an economic
collapse not seen for at least 250 years (Crafts and Mills, 2020). However, we think
it could get even worse. Lower levels of economic openness now pose additional
downside risks, since the UK will be less exposed to competition from international
The Institute for Fiscal Studies, October 2020136 The IFS Green Budget: October 2020
firms. Similarly, agglomeration economies in major urban centres tend to boost not
just the level of productivity, but also the rate of productivity growth. These too
may now prove less potent in a post-COVID world. However, potentially the
largest impact could come via lower rates of immigration and reductions in hours
worked. We expect net immigration rates to fall substantially over the coming years
as the government implements its new ‘points-based’ immigration regime. This, we
think, risks weighing further on potential growth.
The persistent economic impact of the current crisis means that the UK will at some
point almost certainly need fiscal consolidation in the form of tax rises or spending
cuts to bring down its deficit and prevent debt from growing unsustainably (see
Chapter 4). Downside risks to potential growth make this even more urgent as they
could increase the risk that fiscal policy is deemed to be on an unsustainable path.
The UK’s relatively large dependency on foreign capital increases the risk here,
especially in the event of another crisis. This could make it harder for the Bank of
England to loosen policy and (indirectly) protect fiscal space in the process.
Below, we begin in Section 3.2 by discussing the outlook for the economy as the
UK leaves the EU Single Market and Customs Union at the start of 2021. In Section
3.3, we discuss the outlook for UK output in the medium term as the structural
consequences of both Brexit and COVID materialise. In Section 3.4, we provide
some tentative initial thoughts on how both Brexit and COVID may impact growth
in the longer term, before turning to the outlook for monetary and fiscal policy in
Section 3.5.
3.2 Brexit: economic adjustment still lies
ahead
Four years and two general elections have passed since the 2016 EU referendum.
However, little in the rules governing the UK’s economic relationship with the EU
has actually changed. As the UK leaves the Single Market and Customs Union at
the end of 2020, Brexit will – economically speaking – ‘go live’. In principle,
workers and businesses have had several years to adjust their business models in
anticipation. But in practice, as in the experience of New Zealand when the UK
The Institute for Fiscal Studies, October 2020The cost of adjustment: emerging challenges for the UK economy 137
joined the European Economic Community in 1973,1 we think the UK economy has
actually adjusted relatively little to the new economic relationship with the EU. The
UK economy therefore faces another sharp economic adjustment at the start of
2021, even as the wider economic impacts of COVID continue to materialise.
What can be agreed?
Deal or no deal, substantial economic disruption in early 2021 is now likely
unavoidable. Most of the costs associated with Brexit are the result of ‘non-tariff
barriers’. These fall outside of the scope of conventional trade agreements (unlike
the EU Single Market). However, since the 2019 general election, any more
ambitious relationship has been ruled out. The amended political declaration
(October 2019) dropped previous suggestions of a ‘single customs territory’,
‘regulatory alignment’ and a deal on trade in goods that was ‘as close as possible’
(Owen, 2020). Instead, these were replaced by the aspiration of an ‘ambitious free
trade agreement’. Even the best-case scenario has therefore become firmly
anchored at the bottom of the set of ‘stairs’ that EU chief negotiator Michel Barnier
outlined in 2017 (see Figure 3.2).
Developments since have further compressed the range of potential economic
outcomes. Two factors have been key here. The first was the rejection over the
summer of any kind of extension to the transition period. The subsequent tight
negotiation timetable precluded a broader change of heart as well as a closer
agreement. It also undermined hopes of meaningful talks in a range of ancillary
areas, such as customs facilitation or equivalence, that could have alleviated near-
term disruption associated with a deal.
Second, and more significant, was the UK’s rejection of widespread ‘level playing
field’ requirements set out by the EU at the beginning of the negotiations. The
political declaration required the UK sign up to commitments ‘commensurate with
the scope and depth of the future relationship’. The EU’s initial negotiating
mandate set out demands for so-called ‘dynamic alignment’ in a range of areas such
as labour and environmental standards, as well as state aid. This would have
1
Commonwealth countries lost their preferential access to UK markets in 1973 following the UK’s
entry into the EEC. New Zealand offers a case study. See box 2C of Bank of England (2018).
The Institute for Fiscal Studies, October 2020138 The IFS Green Budget: October 2020 Figure 3.2. Trade-offs between access and continued alignment in a potential Brexit deal Source: European Commission: slide presented by Michel Barnier to the Heads of State and Government at the European Council (Article 50) on 15 December 2017. committed the UK to ensure its own regulation remained in lockstep with the EU in future across these areas. The UK government has pushed back hard against such requirements. In its initial position paper in February 2020, the government noted it opposed ‘any obligations for our laws to be aligned with the EU’s’ (HM Government, 2020). Subsequent negotiations have seen the EU water down its demands. The EU is now reportedly seeking assurances on state aid only, as well as a handful of non-regression clauses in other areas. The issue is now reportedly whether the UK can agree to a shared ‘set of principles’ on subsidies, an associated domestic regulator with the power to enforce them, and a robust dispute resolution mechanism. This is substantially more limited than EU demands at the start of 2020. These (EU) concessions have likely come at a cost of ruling out a more ambitious agreement and greater EU market access for the UK. We think the reduced scope of an agreement has been evident in EU communications since both sides agreed to this narrower approach on 15 June. For example, the European Commission communication on 9 July seems to rule out customs facilitation, as well as the mutual recognition of professional qualifications (European Commission, 2020). The Institute for Fiscal Studies, October 2020
The cost of adjustment: emerging challenges for the UK economy 139
Both were often assumed elements of a future trade deal. This more threadbare
approach, in our view, also rules out other potentially important provisions within a
free trade agreement itself. This includes provisions such as a so-called ‘model 4’
agreement on trade in services, which makes it easier for individuals to travel into
another jurisdiction for the purpose of providing a service. Similarly, we also do not
expect more accommodative provisions with respect to rules of origin2 – this
seemed to be confirmed in recent weeks when the EU rejected UK proposals to
treat Japanese and Turkish intermediate imports as British for the purposes of UK
exports to the EU.
This may have important implications for the prospect of any further future deals
over the coming years. First, as the UK works to secure trade agreements with third
countries, the future of UK institutions and regulation is likely to remain in flux.
We think this will make the EU reluctant to grant much wider access in the absence
of sweeping guarantees. Second, the loss of trust between the UK and the EU
during the negotiations – not least as a result of the UK’s decision to contravene the
Withdrawal Agreement – may also mean future negotiations take place in a climate
of mutual suspicion. The focus on negotiating only one or two very specific
commitments, compared with more sweeping regulatory alignment, also risks
compounding the impact here, heightening EU suspicion. Third, and more
fundamentally, the fact that the UK is looking to diverge from the EU, rather than
converge, also means that some of the usual political imperatives resulting from
growing interdependence apply less strongly. This, again, suggests the lack of
material and sweeping commitments may have a more lasting impact.
At the time of writing, we continue to think a deal is more likely than not by the end
of 2020. However, the important point for the economic outlook from here is that
the range of potential outcomes associated with Brexit has narrowed significantly.
Less-disruptive options such as a customs union and/or continued membership of a
single market have been incrementally ruled out. The plausible deal that remains is
2
Rules of origin are the criteria used to govern the national source of a product. They are important
as they govern which goods exports (for example) by the UK to the EU are actually eligible for a
tariff reduction under the terms of a free trade agreement. Most rules of origin requirements require
that more than 50% of the value of that good has to have been produced in the country in question
to be eligible. In the UK–EU deal, we expect similar conditions to apply. We expect some
provisions on cumulation, meaning that intermediate goods imported from the EU to the UK and
re-exported back to the bloc count as ‘British’ for these purposes. However, we do not expect such
provisions to apply to goods imported from elsewhere, even when the country has a tariff-free
agreement with the EU (as Japan does, for example).
The Institute for Fiscal Studies, October 2020140 The IFS Green Budget: October 2020 – in a direct economic sense – now much closer to ‘no-deal’ than, say, former Prime Minister Theresa May’s ‘Chequers’ proposal in 2018. The scale of potential non-tariff barriers In the near term, the primary costs of Brexit are likely to come via an increase in non-tariff barriers and the resulting reductions in trade. In 2018, the Bank of England estimated around 80% of the total reduction in trade associated with Brexit would result from such restrictions (Bank of England, 2018). In total, we think additional barriers to UK trade with the EU are now likely to total 9% in tariff- equivalent terms even in the case of a deal. In the event of no-deal, we think the total impact could be as high as 13%. The additional 4 percentage point impact reflects first the impact of tariffs, but also some additional non-tariff barriers associated, in particular, with the transfer of personal data and equivalence processes for the financial sector. But, deal or no deal, the vast majority of the associated trade frictions now seem likely to materialise. The flipside of this is that the UK is now also likely to enjoy most of the additional domestic policy freedoms that would be available under a ‘no-deal’ scenario – providing wider policy discretion in the longer term. Our estimates for non-tariff barriers are a little higher now than the 2018 analysis conducted by the Treasury (see Table 3.1). This reflects two changes to any agreement compared with what was assumed then. First, as we noted above, we think UK service providers are now unlikely to benefit from a model 4 services agreement, inhibiting the ability of UK citizens to travel to the EU in order to provide a service. Second, UK-based professionals seem unlikely to benefit from Note and source for Table 3.1 Note: All non-tariff barriers are denoted in tariff-equivalent (%TfE) terms. EU tariffs are from the bloc’s ‘most favoured nation’ schedule. More granular analysis suggests these costs may actually be a little higher (the Office for Budget Responsibility (OBR) has estimated costs of around 3.3%). Rudimentary deal and no-deal columns denote total new UK–EU trade frictions. Data for non-tariff barriers in the event of a Treasury free trade agreement (FTA) and no-deal are taken from the Treasury’s (2018) long-term Brexit analysis. For no-deal, we use our own * figure for the financial sector assuming a less accommodative approach to equivalence than initially assumed by the Treasury. Source: ONS, HM Treasury (2018) and Citi Research. The Institute for Fiscal Studies, October 2020
The cost of adjustment: emerging challenges for the UK economy 141
Table 3.1. Sectoral exposure to a rudimentary Brexit deal
GVA UK–EU % of Non-tariff barriers EU Rudimentary No-
share trade trade tariffs deal (%) deal
(2017) with EU (%) (%)
Treasury No-deal Citi 2020
FTA (%TfE) (%TfE) FTA (%TfE)
Manufactured 9% £138bn 49% 8% 10% 8% 3% 8% 13%
goods
Agri-food 2% £17bn 74% 13% 15% 13% 20% 13% 35%
Non-financial 60% £265bn 51% 9% 12% 10% 0% 10% 12%
services
Financial 7% £35bn 38% 13% 15%* 13% 0% 13% 15%
services
Networks 8% £68bn 49% 5% 9% 7% 1% 7% 10%
Dwellings 14% - - - - - - - -
Total 50% 9% 10% 9% 2% 9% 13%
Note and source: See previous page.
The Institute for Fiscal Studies, October 2020142 The IFS Green Budget: October 2020
EU recognition of professional qualifications: an EU Commission communication
on 9 July suggests that this is unlikely to be agreed, meaning UK nationals will
have to ensure their qualifications are recognised by each respective member state
(European Commission, 2020).
The timing of non-tariff barriers
Non-tariff barriers can be ‘at the border’ measures such as customs checks. These
also include regulatory barriers, registrations and product standards (so-called
‘behind the border’ requirements). These costs may materialise at different speeds:
while the cost of additional customs restrictions on UK exports to the EU, for
example, will apply from day one, some other costs – such as regulatory
divergences – will accumulate over time.
We think most of the costs associated with Brexit are likely to prove relatively
front-loaded, implying greater economic disruption in 2021. Outside of
manufacturing, most of the additional regulatory burdens we highlight in Table 3.1
apply from day one – for example, new rules on the recognition of professional
qualifications, new licensing requirements, and limits on travel and selling services
into the bloc.
Within manufacturing, some of the regulatory costs may accumulate gradually – for
example, those associated with different regulatory regimes (around a third of the
total). But even here, the majority of non-tariff barriers are likely to apply
immediately. UK officials estimate the cost to UK companies of filling out customs
declarations alone, for example, could come to £7 billion a year.3 Other immediate
costs, such as the requirement to re-register as an authorised economic operator and
to re-apply for the appropriate licences in order to export, will also be significant
for many firms. Ciuriak et al. (2015) estimated administration costs alone could
come to roughly 0.3% in tariff-equivalent terms. These are mostly one-off costs, but
they are also likely to fall in 2021.
Lower levels of government preparedness in the wake of COVID risks
compounding some of these near-term economic costs for firms. The management
of and response to the pandemic have clearly – and rightly – occupied much of the
3
https://www.ft.com/content/fbc6f191-6d69-4dcb-b374-0fa6e48a9a1e.
The Institute for Fiscal Studies, October 2020The cost of adjustment: emerging challenges for the UK economy 143
government’s time and attention over the past six months. But while this has been
vital, it has inevitably detracted from the government’s Brexit preparations. Even
before the start of the outbreak in the UK, the Institute for Government noted that
the government would find it practically challenging to get the necessary Brexit-
related infrastructure in place quickly (Owen et al., 2020). The pandemic has made
this harder still.
In response, the government is considering some measures to reduce the scale of the
challenge. It is reportedly planning to revert to minimal checks on imports during
the first six months of 2021 regardless of whether a deal is agreed (implementing a
Transitional Simplified Procedure regime initially created for no-deal). Imports may
be less severely affected than exports initially as a result – though this would
actually worsen the impact on GDP (via net trade). However, soft-touch checks on
imports will not be a silver bullet to avoid disruption: since much of the freight
industry depends on two-way flows of goods, hold-ups to UK exports at the EU
border will have an impact on UK imports as well. At the very least, this would
imply a substantial increase in freight costs.
These knock-on effects of border disruption (such as traffic jams or hold-ups to
lorries travelling back and forth) imply more general risks to trade at the start of
2021, and an associated increase in costs. The UK needs to significantly expand its
own infrastructure to process customs exit declarations and clear consignments.
There are challenges associated with ‘roll-on-roll-off’ trade in particular. The UK
government is developing a new Border Operating Model (‘BOM’) IT system to
manage these flows, but time is tight. Failure risks clogging up the border through
the new year, resulting in larger delays and more costs for exporters and importers
alike. The likelihood of some additional disruption in early 2021 also implies a
somewhat front-loaded profile to the costs of the UK’s exit from the Single Market
and Customs Union. Some of these costs would likely ease subsequently.
There is still a risk that some barriers could materialise sooner than we expect.
Recent commentary suggests growing risks for business and finance in particular.
In the first case, data adequacy is a notable potential stumbling block: without ‘data
adequacy’ status certifying that the UK’s data protection rules are comparable to
those in the EU, companies will not be able to freely pass personal information
between the jurisdictions. In the latter case, it is not at all clear that the UK’s
financial sector will enjoy the sweeping equivalence-based access we currently
assume (which could entail the EU accepting UK regulations as largely equivalent
The Institute for Fiscal Studies, October 2020144 The IFS Green Budget: October 2020
to EU ones, meaning that businesses would not need to comply with the EU
regulations to operate there). With some EU countries now viewing the UK as an
‘economic competitor’,4 barriers in more strategically sensitive areas could emerge
somewhat faster, and prove larger, than we currently think. The challenge is that
these are often sectors in which the UK also enjoys a comparative advantage.
The timing and scale of adaptation to come
A key question regarding the economic costs of Brexit is the extent to which UK
businesses have used the time since the Brexit referendum to prepare themselves for
a new, looser relationship with the EU. There are two questions here:
First, to what degree have firms dialled down activity that could now be more
expensive as a result of the UK’s exit from the Single Market and Customs
Union?
Second, to what degree have firms readied themselves for the additional
administrative costs of operating outside of the EU?
Clearly, some businesses will have used the last four years to prepare. However, in
both respects, we think substantial challenges lie ahead. Indeed, some of the trends
since 2016 point to the economy becoming more susceptible to immediate
disruption over the coming months. Specifically, we think many firms have not
been able to brace themselves for the coming disruption owing to the effect of
COVID. In addition, we think the weakness of sterling has meant many firms have
chosen to keep activity open since 2016, even if it will become unviable after the
UK leaves the EU Single Market and Customs Union.
The role of weak sterling
Since 2016, the 20% depreciation of sterling has boosted growth, and profitability,
in economic sectors more exposed to Brexit. Across the UK economy, there are
some goods and services that are considered ‘tradable’ (such as cars or some
financial services) and others that are not (such as real estate activities). The
distinguishing feature is whether the good or service could be provided by a firm in
another jurisdiction. Among tradable groups, the ‘law of one price’ generally
applies, in that there is a global price for the good or service in question. When the
4
https://www.politico.eu/article/uk-to-become-economic-competitor-after-brexit-merkel-warns/.
The Institute for Fiscal Studies, October 2020The cost of adjustment: emerging challenges for the UK economy 145
currency depreciates, prices in this part of the economy subsequently increase
(since it costs more in sterling to meet the global price). Domestic firms producing
these goods and services suddenly enjoy an advantage, as the value of their goods
and services (in sterling terms) increases.
Since 2016, the 20% depreciation in sterling has significantly boosted prices in the
tradable sector. However, this change in the exchange rate has not been
accompanied by any of the actual changes in the UK’s external relationships (and
associated costs) that the exchange rate shift was supposed to reflect and offset. The
net result has been a notable jump in profitability in the tradable part of the
economy. This has boosted growth. Figure 3.3 shows that, since 2016, the tradable
sector has subsequently driven a disproportionate share of growth in the economy.
Different parts of the tradable sector have both positive and negative exposures to
Brexit. Theory predicts that higher post-Brexit barriers will hurt some companies
Figure 3.3. Year-on-year growth in gross value added (GVA) of the tradable
and non-tradable sectors
GVA, tradable sector GVA, non-tradable sector Total GVA
4%
3%
% growth, year on year
2%
1%
0%
-1%
-2%
EU referendum
-3%
2011 2012 2013 2014 2015 2016 2017 2018 2019 2020
Note: Tradable and non-tradable sectors derived using ONS supply and use tables across
two-digit SIC industrial classifications. The total imports plus exports are divided by the
sector’s GVA to obtain a traded share for each sector for 2015. A 10% threshold is then used
to delineate between tradable and non-tradable sectors (Betts and Kehoe, 2006; Broadbent
et al., 2019).
Source: ONS and Citi Research.
The Institute for Fiscal Studies, October 2020146 The IFS Green Budget: October 2020 and sectors in some parts of the tradable sector (where the UK has a comparative advantage relative to the EU) but could help others (where domestic firms had been struggling to compete with European companies). In the latter case, there is evidence of higher growth since 2016 as a result of sterling’s depreciation. Year-on- year growth in food manufacturing, for example, was above the average across the whole economy in all but one quarter between 2016 Q2 and 2019 Q1. This could indeed reflect some of the positive economic impacts from Brexit beginning to materialise, with weaker sterling providing these firms with a cost advantage over their EU (and indeed other global) competitors. However, these effects also seem to have boosted profitability and growth in areas that are now likely to be adversely affected by Brexit. In these areas, the substantial depreciation in sterling compared with the Euro has generated a significant cost incentive to keep activity in the UK as long as EU market access has remained unchanged. Given the transitory nature of the boost, firms may still have avoided new investment and other long-term commitments, but we think these incentives have stopped firms from divesting, precluding anticipatory adjustments and in some cases potentially driving additional hiring too. Looking forward, this means that, while depreciating sterling may have already delivered some of the potential growth benefits associated with Brexit, we do not think it has done the same for the larger set of costs. Instead, we think many of the associated divestments and losses still likely lie ahead. Uncertainty, investment and the rate of adjustment As we noted in last year’s Green Budget, high levels of uncertainty have weighed significantly on business investment in the UK since 2016 (Nabarro and Schulz, 2019). These effects have generally been concentrated in some of these tradable sectors – and particularly those at the greatest risk of being adversely affected by Brexit. Data from the Bank of England Decision Maker Panel survey, for example, have shown that weak investment has been concentrated in those areas of the economy that are likely to be more adversely affected by Brexit (Bloom et al., 2019). In this sense, some of the longer-term adjustments in capacity may have begun to materialise (though by no means all). However, for the near-term outlook, the decision to delay or cancel physical investments in the UK also increases the risk that businesses now respond quickly to the new trading relationship once the transition period has ended. The lack of The Institute for Fiscal Studies, October 2020
The cost of adjustment: emerging challenges for the UK economy 147
spending on physical investment has the effect of loosening the economic ties
between firms exporting to the EU and the UK economy itself. If firms maintain
significant investments in the UK associated with exports to the EU, they would
likely take longer to respond to the new trading relationship – instead seeking to
make the most of their existing sunk costs. The fact that firms have now dialled
down such investment could mean a more sudden adjustment. For the near-term
outlook, this now increases the risk of more sudden divestments.
Some of these risks may be particularly marked for the labour market. In response
to higher levels of uncertainty, many of the most-exposed sectors seem to have
focused on hiring in lieu of investment (see Figure 3.4). As discussed in last year’s
Green Budget, there are fewer irreversible costs associated with hiring than with
physical investments, so the former is preferable in a context of high uncertainty
(Nabarro and Schulz, 2019). But the end result is that some of the sectors that might
be most exposed to Brexit-related disruption have been boosting employment over
the last few years, leaving more workers potentially exposed to sudden changes as
the transition period ends. The UK labour market is likely to be weakened as a
result of the pandemic. These dynamics suggest another significant additional risk.
We expect unemployment to peak at 8–8.5% in 2021 Q2 (see Chapter 2).
Figure 3.4. Change in employment and business investment growth (% year
on year)
15% 3%
10% 2%
% change, year on year
% change, year on year
5% 1%
0% 0%
-5% -1%
-10% -2%
-15% -3%
Business investment (LHS)
Employment (RHS)
-20% -4%
2005 2007 2009 2011 2013 2015 2017 2019
Source: ONS and Citi Research.
The Institute for Fiscal Studies, October 2020148 The IFS Green Budget: October 2020
The complication of COVID-19
We think the pandemic is also likely to have weighed on business preparedness,
risking greater economic disruption and potentially more firm failures in early
2021. Recent survey evidence, summarised in Figure 3.5, suggests stalling progress
on Brexit preparations over 2020 as managerial time and capital have been
dedicated towards managing the COVID outbreak. A survey from the Institute of
Directors in mid–late June found that only 24% of firms claim that they are fully
prepared, 19% saying they are somewhat prepared but intend to do more, and
another 45% saying either they remained fully focused on the COVID-19 pandemic
for now or planned only to address Brexit once the future relationship was clearer.5
The Bank of England’s Decision Maker Panel survey also suggests little progress
Figure 3.5. Firms’ level of Brexit preparedness in summer compared with
January 2020
Total Manufacturing Distribution Services
70%
60%
50%
% of firms
40%
30%
20%
10%
0%
Significantly Somewhat No change in Somewhat less Significantly
more prepared more prepared level of prepared less prepared
preparedness
Note: The CBI’s July surveys were conducted between 25 June and 15 July 2020. 752
businesses responded.
Source: CBI and Citi Research.
5
https://www.iod.com/news/news/articles/IoD-figures-on-firms-Brexit-readiness.
The Institute for Fiscal Studies, October 2020The cost of adjustment: emerging challenges for the UK economy 149
on average over the summer months, likely well behind what might have been
hoped given the imminent end of the transition period.6
Forecasts for the economic impacts of Brexit
From here, we expect Brexit to provide something of an economic boost in 2020
Q4. Imports and inventories on both sides of the Channel are likely to pick up as
firms stockpile key resources in the run-up to the end of the transition period. In the
process, these trends may boost UK industrial production and GDP growth.
However, we expect these effects to prove somewhat more muted this time than
they were before the last Brexit deadline in October 2019. For one, inventory levels
in the UK are already relatively high – providing some existing protection against
trade disruption.7 The costs of stockpiling are likely to be higher than, for example,
in 2019 Q1 or Q3 (before the previous two Brexit deadlines) owing to limited
warehouse space in the run-up to Christmas. Dramatic increases in volumes of
online shopping in the wake of the pandemic suggest these effects may be even
more severe than in 2018 or 2019 (Marshall, Jack and Etherington, 2020). Some EU
firms may have also already reconfigured their supply chains away from the UK
since 2019, meaning that they will have less of an incentive to stock up on UK
goods and so reducing any potential export (and GDP) boost. Finally, Brexit
preparations have previously tended to eat into working capital (Bank of England,
2019). In the aftermath of COVID, with revenues depressed and debt elevated,
some businesses might now be constrained in their ability to finance higher
inventories.
We expect the new barriers between the UK and the EU to subsequently weigh
sharply on trade in 2021 Q1.8 Exports, we think, will likely be more severely
6
https://www.bankofengland.co.uk/decision-maker-panel/2020/august-2020.
7
CBI’s Industrial Trends Survey.
8
As discussed above, we expect much of the disruption to be felt immediately after the end of the
transition period. While the benefits of joining a trading area emerge over roughly a five-year
period, we expect the costs of leaving one to be felt much more quickly. Lower trade barriers are a
necessary but not sufficient ingredient for higher trade volumes; while firms might be slower to
build the new supply chains needed to take advantage of lower trade barriers, higher trade barriers
will weigh on their decision-making much more quickly. Our view that the impacts of leaving a
trading area are felt more quickly is also consistent with (albeit limited) international evidence,
such as the divergence in trading relationships between the UK and New Zealand in 1973. In the
UK’s case, these effects are compounded by front-loaded costs, lower investment and lower firm
resilience – as we discuss above.
The Institute for Fiscal Studies, October 2020150 The IFS Green Budget: October 2020 affected than imports initially. This primarily reflects the UK’s decision temporarily to take a more light-touch approach to customs barriers to imports than the EU. The disproportionate hit to exports is likely to weigh on the trade balance and GDP in 2021, though some of these imbalances may be unwound over subsequent years as UK barriers to imports are gradually implemented. We currently expect net trade to deduct 1.5ppt from growth in 2021, but add 0.6ppt in 2022. These effects come in the context of severely depressed import and export volumes in 2020 (which mean that net trade accounts for a smaller share of GDP). We expect exports and imports to lag their 2018 level respectively by 7.4% and 7.0% below in 2021. We expect the reduction in export volumes to have two additional impacts on the economy. First, as we noted above, we expect a small but significant hit to employment, and a further hit to consumption. Second, we expect a substantial write-off to capacity specific to EU value chains. We expect this latter effect to be concentrated within the manufacturing and business services sectors in particular. While gross business investment may pick up in 2021, we think a substantial increase in write-offs will mean that net investment (which is what contributes to GDP) will remain relatively subdued. After falling by 16.5% in 2020, we expect business investment to grow by just 4.1% in 2021 before recovering more strongly in 2022 and 2023. COVID further risks compounding these losses in 2021. While the most severe effects of the pandemic will be felt in different sectors from those most affected by Brexit, no part of the economy has emerged unscathed from COVID (see Chapter 2). With solvency deteriorating, firms are now more vulnerable to additional cash- flow disruption. Alongside lower preparedness (see above), this leaves firms more vulnerable. Those sectors of the economy more exposed to Brexit – such as manufacturing – also tend to have lower levels of cash reserves compared with their usual level of turnover (Saunders, 2020). In 2019, credit conditions also seemed to tighten somewhat among those firms more exposed to the fallout of Brexit (Bank of England, 2019). If repeated, these factors could risk a significant number of firm failures. All combined, transport, distributed services and manufacturing appear more exposed; as Table 3.2 shows, these sectors have a greater share of EU exports, but lower levels of preparedness and smaller cash buffers. Overall, in the event of a thin trade deal, we expect output in 2021 to be roughly 2.1% below where it would have been if the UK had instead chosen to remain in the Single Market and Customs The Institute for Fiscal Studies, October 2020
The cost of adjustment: emerging challenges for the UK economy 151
Union; even by the end of the forecast horizon (2024 Q4), we expect a substantial
gap of 1.4% to remain.
We expect a thin trade deal would push up inflation slightly over the coming years.
Around 13% of the CPI basket is imported directly; another 7% is indirectly
imported. In the event of a deal, we expect import prices to increase by around
Table 3.2. Indicators of Brexit exposure by broad sector group
GVA % Rudimentary % ‘very Corporate
share trade deal: new concerned’ cash
(2017) with barriers about the deposits
EU (%TfE) end of (divided by
(2017) transition turnover)
Manufactured 9% 49% 8% 36% 3.1
goods
Agri-food 2% 74% 13% - -
Non-financial 60% 51% 10% 35% 3.7
services
Financial 7% 38% 13% - -
services
Networks 8% 49% 7% 26% 1.7
Dwellings 14% - - - -
Total 50% 9%
Note: ‘% “very concerned” about the end of transition’ taken from CBI survey of non-financial
firms (conducted 25 June and 15 July; n=752). ‘New barriers’ reflect Citi estimates of non-
tariff barriers in the event of a rudimentary deal – expressed in ‘tariff equivalent’ terms (see
Table 3.1). ‘Corporate cash deposits (divided by turnover)’ taken from Saunders (2020).
Transport is included in non-financial services.
Source: CBI, ONS, Saunders (2020) and Citi Research.
The Institute for Fiscal Studies, October 2020152 The IFS Green Budget: October 2020
3.5% over 2021.9 Traditional rules of thumb would imply inflation (as measured by
the Consumer Prices Index, CPI) to increase by around 1–1.5% cumulatively over
the subsequent three years.
The additional costs of a ‘no-deal’ Brexit
As we noted above, we think most of the direct economic costs associated with
Brexit are likely to materialise whether the UK leaves with a thin trade deal or with
no deal at all. But leaving the EU without any deal at all would still impose
additional costs, mostly via sentiment. For the economy as a whole, additional
uncertainty and expectations of a more acrimonious medium-term UK–EU
relationship would both likely weigh. A no-deal exit could also impose substantial
additional direct costs in some sectors too. For example, the automotive
manufacturing sector would likely face much higher tariffs under no-deal than it
would even with a thin trade agreement. Some additional non-tariff barriers with
respect to financial equivalence or data adequacy (for example) would also be likely
to weigh on output. These effects could amount to 0.5–1.0% of GDP. In this
scenario, food and goods inflation could increase more sharply in 2021 owing to
more acute border disruption. However, the larger impact in this scenario would
likely be via additional sterling depreciation.
3.3 Scarring and the outlook in the
medium term
The long-term outlook in the wake of both COVID and Brexit depends both on how
different the new economic ‘normal’ looks from the prior one, and on how easily
the UK economy can adjust to it. In recent decades, the UK’s economic institutions
have shown themselves to be somewhat nimbler than those in some continental
European countries – especially within the labour market (Broadbent, 2012).
However, the UK now faces a unique ‘double whammy’ of structural changes in the
form of both COVID and Brexit. A period of sizeable economic adjustment is likely
to follow. Chapter 2 sets out that this implies a weaker near-term recovery.
However, below we explain that this is also likely to imply a lower level of output
9
This is based on a 10.7% increase in costs of exporting into the UK, which applies to 50% of all
imports. We assume that 60–70% of this is then passed through over 12 months.
The Institute for Fiscal Studies, October 2020The cost of adjustment: emerging challenges for the UK economy 153
in the longer term. A more protracted adjustment process risks compounding the
impact, with additional adverse labour market consequences.
COVID and Brexit: the cost of adjustment
We currently expect output in 2024 to lag the OBR’s March 2020 trajectory by
4.5% in the fiscal year 2024–25. This reflects more permanent changes in the
structure of the UK economy owing to the impact of both COVID (–3.2ppt) and
Brexit (–1.3ppt). This is considerably larger than the 1.5% impact forecast by the
Bank of England. This primarily reflects differing assessments of the scale and
costs associated with economic reconfiguration in the aftermath of both shocks.
The key drivers behind our more pessimistic forecast are a greater number of firm
bankruptcies and the associated write-down of capacity. Here, there are two sets of
factors at play:
A prolonged period of elevated virus concerns will see many firms go out of
business (especially within the UK consumer services sector). This will have
longer-term effects as their ‘firm-specific capital’ (for example, specific
machines, trained workers or branding) cannot be easily repurposed.
Persistent economic reconfiguration associated with both COVID and Brexit
will also see some sectors and geographies hit hard. This in turn will reduce the
economic value of the skills and capital specific to that sector or location, also
weighing on long-term capacity.
In both cases, we expect both COVID and Brexit to play a notable role. As we
noted above, the impact of COVID on both demand and costs is highly asymmetric,
with the impact disproportionately falling on the consumer services sector. Over the
coming months, we expect this to result in a substantial number of failures among
firms that, absent the virus, would have remained viable. Firms in these sectors
often contain a relatively large share of so-called ‘intangible capital’ in comparison
with their total asset base – though not as large as some other sectors (for example,
ICT).10 This capital tends to be inherently firm-specific – for example, buyer–
supplier relationships, brands and so on (Haskel and Westlake, 2017). This means
that much of this capacity will be lost when firms go out of business. While we
expect that bankruptcies will hit the least productive firms the hardest, overall these
10
See Corrado et al. (2016) and INTAN-Invest data.
The Institute for Fiscal Studies, October 2020154 The IFS Green Budget: October 2020
changes are still likely to weigh on long-run capacity (Andrews, Adalet McGowan
and Millot, 2017).
Even after the direct impact of the virus has died down, some of the behavioural
changes developed during lockdown may also likely persist, implying a permanent
shock to preferences and economic structure. This may prove partly geographical as
well as sectoral (see Chapter 7), with more economic activity moving out of major
urban agglomerations in the UK. Already, over the summer, it is striking how many
households seem to have chosen to move out of major cities.11 Given the fixed
costs involved in moving home, this implies a persistent underlying shift in
preferences. A shift to working from home and the related changes in consumer
services demand would also imply an associated change in where (as well as what)
capacity is needed. Recent data from the Institute of Directors suggest half of all
firms are intending to shift further towards home working on a more permanent
basis.12 This could see some existing types of capital – for example, a shop or cafe
in central London – being written down. These trends seem unlikely to reverse fully
even after a vaccine is available. We think this will drive the write-down of some
associated capacity, weighing on output in the longer term (Kozlowski, Veldkamp
and Venkateswaran, 2020).
As in the case of COVID, Brexit is also likely to require substantial economic
reconfiguration. Growth in the UK in recent decades has, in large part, been driven
by the cultivation of comparative advantages in areas such as business services and
finance. Given the close geographic proximity and the size of the EU, membership
and development of EU institutions has played an important part in this process.
The UK has developed a large surplus in services with the bloc, alongside a large
goods deficit. With the UK set to leave both the Single Market and the Customs
Union at the end of 2020, some of these developments will now likely go into
reverse. This also likely implies write-downs to associated capacity.
The question for capacity is twofold. First, to what degree can trade currently with
the EU be diverted to other jurisdictions? Here we think possibilities are very
limited. Much of the additional trade between the UK and Europe caused by
11
A range of soft data has indicated very robust demand for larger homes outside of major urban
agglomerations. See the RICS Residential Market Survey, August 2020.
12
https://www.iod.com/news/news/articles/Home-working-here-to-stay-new-IoD-figures-suggest.
The Institute for Fiscal Studies, October 2020The cost of adjustment: emerging challenges for the UK economy 155
membership of the EU is likely to be relatively specific to the two partners. Within
the manufacturing sector, for example, this reflects close integration with
transnational value chains. Services are generally excluded from conventional trade
agreements (the EU Single Market is a notable exception). This suggests only
limited opportunities to redirect existing exports elsewhere, even if the UK
succeeds in striking trade agreements with countries further afield. Instead, we
expect aggregate trade to lag for some time to come (see Figure 3.6).
If trade losses cannot be prevented, the second question is how much of the
associated capacity can be re-applied within the domestic economy. Trade tends to
boost productivity by facilitating economies of both scale and scope. Usually this
would mean that, even if this capital can be re-applied, its productivity would be
lower. Estimates of the impact of trade on productivity levels range from 0.16–0.25
(based on the closure of the Suez Canal between 1967 and 1975; Feyrer, 2009) to
0.42–0.6 (Feyrer, 2019) to 0.74 (Felbermayr and Groeschl, 2013) – based on recent
natural disasters. These suggest that a 1% drop in trade implies anything between a
0.16% and a 0.74% drop in national income per head. These are big effects, and
estimates that are more recent tend to be somewhat larger.
Figure 3.6. Real UK trade (adjusted for the export of non-monetary gold)
350 70%
Trade as % of GDP (RHS)
Total value of trade (LHS)
£ 2016 billion (chained value measure)
300 60%
250 50%
% of GDP
200 40%
150 30%
100 20%
50 10%
0 0%
1960 1970 1980 1990 2000 2010 2020
Note: Non-monetary gold is excluded from these data, as trade in this is overall neutral for
GDP.
Source: ONS and Citi Research.
The Institute for Fiscal Studies, October 2020156 The IFS Green Budget: October 2020 In our forecast, we assume a relatively low elasticity of 0.25 – for every 1% drop in trade, GDP per capita falls by 0.25%. However, some write-offs to firm- and sector- specific capital are likely in the face of the current shock. More rapid adjustments and higher rates of firm failures increase these risks. The risks may therefore be skewed towards larger write-downs. Labour market scarring While our central forecast is more pessimistic than others, there remain real risks that the outcome for the economy could be yet worse, if there are significant long- run impacts (‘scarring’) on the labour market. Broadly, there are two forms of economic scarring associated with higher unemployment. The first is the loss of so-called ‘matching capital’ associated with specific relationships between workers and employers (Quintini and Venn, 2013). This is precisely what the Coronavirus Job Retention Scheme was designed to prevent. Losing this capital by being made unemployed has significant impacts on longer-term earnings – typical estimates suggest that workers who are made unemployed are 6–9% less likely to be in work in the longer term, and have wages 8–10% lower than they would otherwise have had even if they find another job (Tumino, 2015). Importantly, these effects seem to apply even if workers are unemployed for a short period. As we noted in Chapter 2, we expect significant numbers of workers to face unemployment over the coming years, implying substantial losses here. A second form of scarring is losses resulting from the erosion of human capital as workers spend time out of paid work (Blanchard and Summers, 1986). Here too the effect can be significant, with a longer period of unemployment both reducing the chance of finding subsequent employment and reducing bargaining power for workers who do succeed in finding a job (Krueger, Cramer and Cho, 2014). Substantial economic reconfiguration increases the risk of such effects, as workers who become unemployed may find it takes longer to find a new job (or they might need to switch into a different sector or occupation entirely, also making the on-the- job skills they have built up less valuable). As we noted in Chapter 2, high uncertainty and low aggregate demand already risk a more protracted period of weak labour demand and high unemployment. Recent survey data suggest all sectors are now planning to reduce the size of the workforce (see Figure 3.7). The Institute for Fiscal Studies, October 2020
The cost of adjustment: emerging challenges for the UK economy 157
Figure 3.7. Expected impact of COVID-19 on workforce size, July 2020
Essential services
Other services
Non-food manufacturing and construction
Consumer-facing services
0%
% change in employment
-2%
-4%
-6%
-8%
-10%
-12%
2020 Q2 2020 Q3 2020 Q4 2021 Q1
Forecast period
Note: Answer to the question ‘Relative to what would have otherwise happened, what is your
best estimate for the impact of the spread of coronavirus (COVID-19) on the employment of
your business?’. Responses were collected from 3 to 17 July 2020.
Source: Bank of England Decision Maker Panel, Bank of England and Citi Research.
Sectoral reconfiguration adds to these headwinds to employment. Firms will need
time to build up an understanding of what kinds of workers their new business
model demands. Sectoral patterns in the recovery to date also imply a skew towards
more capital-intensive sectors and potentially a slower recovery in labour demand
as a result.
Nominal wage rigidities also risk weighing on labour demand on a more persistent
basis. Increases in the National Living Wage – to which the government committed
prior to the pandemic – and lower inflation both constitute challenges here as they
could make downward adjustment more difficult. This could pose a particular
challenge in the recovery from COVID and Brexit, for two reasons:
First, reallocating workers across sectors often results in the loss of human
capital and lower labour productivity, adding to labour costs. If wages are
restricted in how much they can fall – for example, as a result of large increases
in the minimum wage – this could cause a sharper rise in unemployment and
substantially slow the recovery.
The Institute for Fiscal Studies, October 2020You can also read