House prices in London - an economic analysis of London's housing market - Joel Marsden November 2015 - Greater London Authority
←
→
Page content transcription
If your browser does not render page correctly, please read the page content below

Working Paper 72

House prices in London – an economic analysis of
London’s housing market
Joel Marsden
November 2015
House prices in London – an economic analysis of London’s housing market
                                                                                                       Working Paper 72

copyright
Greater London Authority
November 2015

Published by
Greater London Authority
City Hall
The Queens Walk
London SE1 2AA

www.london.gov.uk
Tel 020 7983 4922

Minicom 020 7983 4000

ISBN 978-1-84781-613-9

Cover photograph

© Shutterstock

For more information about this publication, please contact:

GLA Economics

Tel 020 7983 4922

Email glaeconomics@london.gov.uk

GLA Economics provides expert advice and analysis on London’s economy and the economic issues facing
the capital. Data and analysis from GLA Economics form a basis for the policy and investment decisions
facing the Mayor of London and the GLA group. GLA Economics uses a wide range of information and data
sourced from third party suppliers within its analysis and reports. GLA Economics cannot be held responsible
for the accuracy or timeliness of this information and data. The GLA will not be liable for any losses suffered
or liabilities incurred by a party as a result of that party relying in any way on the information contained in
this report.
House prices in London – an economic analysis of London’s housing market
                                                                                                           Working Paper 72

Contents
Executive summary ...................................................................................................................... 2
1      Introduction ......................................................................................................................... 5
2      How are house prices set and do they matter?..................................................................... 6
3      Trends in the London housing market ................................................................................ 10
4 The affordability of housing in London, risks to the housing market and the responsiveness
of housing supply ...................................................................................................................... 21
5      Conclusions ........................................................................................................................ 49
Appendix 1: House prices to rent ratios, alternative investment returns and the buy-to-let
market ....................................................................................................................................... 50
Appendix 2: Demand from foreign and overseas investors ........................................................ 56

GLA Economics                                                                                                                                  1
House prices in London – an economic analysis of London’s housing market
                                                                                          Working Paper 72

Executive summary
This paper looks at the level of London’s house prices from an economic perspective. It looks at
the fundamental processes that drive the market for buying and selling homes, considering the
extent to which the observed changes in house prices are reasonable, and the possible long-
term consequences of house price inflation for London. While highlighting potential issues for
particular groups which may have long-term economic consequences, this paper focuses on the
price of homes and costs of housing in London in economic terms. It therefore primarily
considers the private market for owner-occupied and mortgage-backed housing.

In economic terms, house prices in equilibrium are set by the balance of demand and supply.
However if, for example, supply persistently fails to respond to higher prices, or if prices are
driven by factors other than the fundamental need for housing, the desire to buy it and
corresponding ability to pay, house prices may potentially be deemed unaffordable or
overvalued. This can place upward pressure on wages and the costs of doing business as well as
increase the risks to macroeconomic stability. Housing affordability is thereby defined in
economic terms as the relationship between market-determined housing costs and the ability to
pay for them. It does not relate to the concept of ‘affordable homes’, which refers to social
rented, affordable rented and intermediate housing, provided to specified eligible households
whose needs are not met by the market.

Even at equilibrium, prices will be beyond the budget of some households, leaving some unable
to pay and thereby unable to access home ownership. Such a lack of affordability, in social
terms, can also have perverse effects on the costs of living by pushing up rents, and may also
contribute to ill health and wellbeing due to sub-standard living conditions, over-crowding and
insecure tenure. High house prices and the associated concentration of wealth among
homeowners may also contribute to greater inequality across the generations and present a
barrier to social mobility.

London’s house prices are considerably higher, and have been rising at a faster rate than the
country as a whole. This is particularly true in desirable central London boroughs with median
house prices in 2014 as high as £860,000 in Westminster (up 11.4 per cent annually in the five
years since 2009) and £1.2 million in Kensington and Chelsea (up 12.2 per cent annually in the
five years since 2009) based on Land Registry data. This compares to a London borough low
median house price of £215,000 in Barking and Dagenham (up 6.1 per cent annually in the five
years since 2009), which is still higher than the national average for England and Wales of
£192,000 (up 2.6 per cent annually in the five years since 2009).

Over a longer-time horizon, housing markets in London have witnessed a number of ups and
downs, with volatile house prices in London tending to amplify changes in national house prices.
Although falls in the actual (nominal) value of the average home are relatively rare, London has
experienced several episodes of real house price deflation since the ONS data series began in
1969. From the patterns of previous cycles, there are no clear trends from price data alone to
suggest whether London house prices are approaching a new peak, and whether this will entail a
levelling off, or a more exceptional downward adjustment.

The observed increases in the price of the average London home have far exceeded growth in
individual earnings. This has led to house prices which were almost 10 times median earnings in
London in 2014, compared to about 4 times in 1997, and considerably higher than a previous
peak in 1974. Looking instead only at the earnings of residents in the top 70th percentile of

GLA Economics                                                                                           2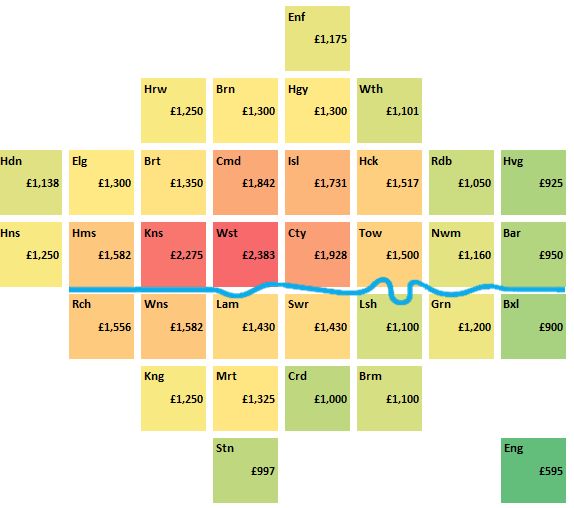
House prices in London – an economic analysis of London’s housing market
                                                                                           Working Paper 72

income earners indicates a ratio of more than 8.4 times earnings, with this measure of
affordability also widening over time. Such a measure does not however account for the role of
households with multiple earners, non-wage incomes, or the availability of mortgage finance,
and may therefore be an imperfect measure of the ability to finance home ownership insofar as
these other factors have changed over time.

The ratio of house prices to the incomes of mortgage-holders provides an alternative measure
of affordability. Based on this measure, London’s pre-crisis average house prices ranged
between 1.9 and 3.5 times the income of mortgage applicants, notably lower than the UK as a
whole. In each case the ratio of house prices to incomes ended the period at its peak level
immediately before the start of the economic downturn. The average house price in London
however is now 5.3 times the average income of mortgage applicants, compared to 4.4 times in
the UK as a whole, in excess of its pre-crisis peak. From a borrowers’ perspective, the median
value of mortgages secured on properties in London increased from being 2 times greater than
buyers’ median income in the 1980s, to more than 3.5 times the value of borrowers’ income by
2013. These measures reflect the high house price rises in the capital but may also capture
changes in the profile of applicants, or number of joint applications over time.

Standard measures of housing affordability in terms of the relationship between house prices,
earnings and incomes therefore suggest that there is an increasing affordability gap. An
alternative explanation for the observed trends in affordability, which the above ratios and
multiples do not account for, relates to changes in the quality of the surrounding local area and
the access to amenities that it offers. Evidence from academic research suggests that the wider
benefits of urban living may explain a part of the difference in housing costs across cities and
over time, as for example, cities have become safer, less crime-ridden places to live and a vibrant
cultural life has given cities an edge in attracting talent. In the past decade, there is a range of
evidence to suggest that London has become increasingly attractive as a place to live.

With the recent growth of the private rented sector and buy-to-let market, and recent growth
also in overseas ownership, there are arguably two extra components of demand compared to
the past. However, there is limited available evidence that either of these have had a profound
impact on house prices. Indeed, although increasingly supported by buy-to-let mortgages, the
share of the private rental market in London remains lower than it was previously in the 1960s
and 1970s. It is however arguable that the strong long-run performance of London housing
relative to alternative investments may have contributed to London’s housing stock being
increasingly seen as a vehicle in which to hold money, acting as a possible further incentive
towards owner-occupation. With regard to foreign or overseas ownership, the evidence is also
mixed, and on balance suggests that it is responsible for only a small share of transactions and
likely to have had only modest effects on house prices in London. There is also some evidence
to suggest that following the economic crisis, the additional demand for new build properties
may have to some extent lessened the negative impact of credit constraints on construction
activity.

The purchase price of a house is not however the same as the cost of owning a home. Instead,
the annual cost of home ownership can be more accurately measured by considering the share
of incomes devoted to housing. Based on measures of the cost of financing mortgage
repayments and the overall costs of housing, the annual cost of owning a home in London is
below its previous peaks. This is primarily due to the historically low mortgage interest rates that
homeowners currently face. This notwithstanding, since property prices (and the corresponding
size of advances) are much higher in London, mortgage holding households still spent

GLA Economics                                                                                            3
House prices in London – an economic analysis of London’s housing market
                                                                                            Working Paper 72

considerably more financing their mortgages costs in London than households in the rest of the
UK.

Buyers, and particularly first-time buyers, face significant upfront costs in buying a house. The
average deposit to income ratio for first-time buyers has increased at a rapid rate in London
since 2008, reaching a high of 125 per cent in 2014. This is considerably above its long-run
trend in the previous three decades, with deposits averaging 30 per cent of incomes from 1980-
2007. The rapid deterioration in the affordability of home purchase, on this measure, is driven
by a post-recession shift towards a larger size of deposits as a proportion of house values. There
are signs that the value of larger deposits is increasingly being met by young first-time buyers
through parental assistance and inheritance, which may have long-term implications for social
mobility and entrench wealth inequality across generations.

Insofar as high house prices in London are supported by low costs of credit, this may make the
London economy vulnerable to the risk of a price correction, particularly if the costs of
borrowing were to rise, or access to credit and alternative income streams were to tighten. The
Bank of England reports that a rise in bank rates from the current low of 0.5 per cent up to 2.5
per cent would almost double the proportion of households struggling to pay their mortgages
(as those financed by a variable rate would face higher monthly costs of repayment). Given its
increasingly high loan-to-income multiples, London households may be particularly exposed to
changes in mortgage interest rates. Based on CML data, it is found that an increase in mortgage
interest rates of three percentage points would significantly reduce affordability levels to their
previous 1990 lows (such that almost a third of household incomes is taken on mortgage
payments).

Demand for housing in London is partly driven by the desirability to live and work in London,
but is also partly driven by natural changes in population (in terms of births and deaths) as well
as socio-economic factors that drive household formation. It is this demand which, coupled with
the increased ability to finance home ownership, places upward pressure on the price of housing
in the capital. In a well-functioning housing market, the quantity of housing supplied should
increase in response.

Comparing the cumulative growth in the housing stock and household population with house
prices, it is notable that at a time of relatively stable real house prices from 1991 to 1997, the
year-on-year growth in the number of London households was slower than growth in the
number of London dwellings. Conversely, from 1998 to 2014, when the rates of growth in
London’s population and number of households started to increase in excess of growth in the
housing stock, real house prices rose by an annualised average of 9 per cent.

Limits on the responsiveness of supply seem to have amplified London house prices. Periods of
high increase in house prices in London have been accompanied by only modest increases in the
number of new homes built, and the levels of house-building in London have not kept pace with
changes in house prices or the population. A number of factors may explain why housing supply
in London has been relatively unresponsive to price signals to date, including constraints of the
planning system as well as a number of possible market frictions which may slow, or inhibit, the
response of private developers and house-builders. In this respect, further measures to
overcome constraints in housing supply can be seen as an important step to address
affordability in London’s housing market

GLA Economics                                                                                             4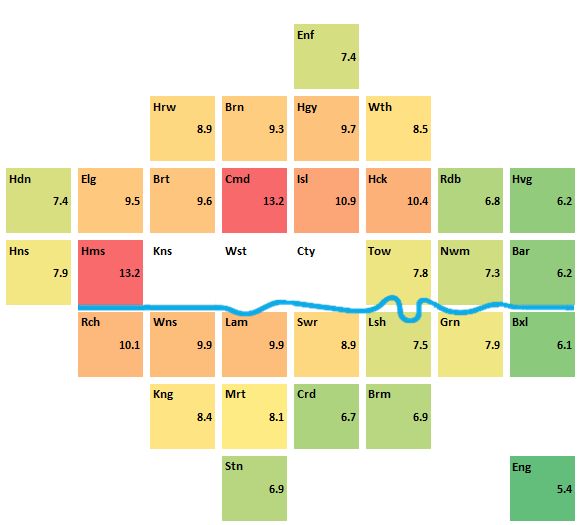
House prices in London – an economic analysis of London’s housing market
                                                                                          Working Paper 72

1        Introduction
There is considerable public debate and concern over the affordability of house prices in
London, and the potential risks of instability from the housing market. But do these concerns
have strong foundations? This paper aims to consider the level of London’s house prices from
an economic perspective. It looks at the fundamental processes that drive the market for buying
and selling homes, considering the extent to which the observed changes in house prices are
reasonable, and the possible long-term consequences of house price inflation for London.

The paper begins by considering how house prices are set and why this might matter. It then
presents the recent trends in the housing market, including a review of the data sources used
and some of the limitations faced in producing the analysis. It then proceeds to analyse whether
or not the evidence suggests house prices are in line with underlying economic ‘fundamentals’,
based on a range of indicators.

GLA Economics                                                                                           5
House prices in London – an economic analysis of London’s housing market
Working Paper 72
2 How are house prices set and do they matter?
In economics, the efficient allocation of resources requires that in the long run the price of any
market good or service should be determined by the balance of supply and demand. This is true
for the housing market as well, where the supply of houses for sale and the demand for housing
to occupy should determine prices.
In a well operating housing market the quantity of properties for sale should be determined by
the factors influencing the available housing stock, including the availability of land and the
cost of building new homes. Demand for housing is determined by housing need driven by
demographic developments, as well as the ability to pay (incomes, access to finance), and the
desire to purchase a house.
Unlike most market goods and services, which are demanded for the good itself – we demand
an apple because we want to consume it – some goods or services are instead demanded
because they provide access to other goods. Transport services, for example, are often
demanded so that we can ultimately consume another good or service (e.g. cinema). Housing is
also, in many respects, a good that is demanded indirectly – in terms of access to local facilities,
employment opportunities and other services it provides. Because of this, the desire to purchase
a house will be affected by demand for these other markets. High house prices in a particular
area may therefore reflect a relative abundance of amenities and offer residents a high quality
of life 1. London’s abundant amenities and access to employment opportunities, in this sense,
may to some extent compensate its residents for the high costs of housing.
High prices, in any market, reflect the intersection of strong demand and limited supply. If, at
any given current market price, the number of houses demanded increases then prices will rise
assuming fixed supply. Such changes, if driven by the fundamental determinants of demand and
supply (as set out above), could result in a dynamic supply response, that is, where possible,
there would be an increase in the quantity of houses supplied. Price rises driven by these
fundamentals should remain efficient in the long term.
However, in the period of adjustment, prices may be viewed as ‘unaffordable’ while prices are
high and the market is not supplying all that it should be. Since the demand for housing is
related to the demand for access to employment, local facilities and other services, these high
house prices can in turn have knock-on effects.
2.1 Housing market failures and economic imbalances
As stated above, the price for private market housing should, in theory, reflect the balance
between the supply of houses and the demand for living in them. In practice, however, the
supply and demand for housing may also be distorted by other factors unrelated to their
fundamental determinants.
On the demand side, for example, the use of housing as a long-term investment asset may
stimulate additional demand from investors and homeowners seeking to speculate on a
property’s value in the expectation of realising future capital gains. In turn, this speculative
1
Taking this logic a step further, it has been argued that ‘unaffordability’ at city level can itself be seen as an indicator of an
area’s desirability and the quality of life it offers. See for example, Gibbons, S., Overman, H., and Resende, G. ‘Real earnings
disparities in Britain’, SERC discussion paper 65.
GLA Economics 6House prices in London – an economic analysis of London’s housing market
Working Paper 72
demand may increase the price for London housing over and above the value of housing derived
from living there (because investors are expecting future price increases)2.
This effect will be exacerbated if investors choose to leave their investment units empty, and
thereby directly reduce the supply of available housing 3. There are also a number of innate
qualities to housing, such as its long life, fixed location, the uniqueness of each property, and
the one-off nature of most transactions, which mean that the market may fail to allocate
housing efficiently 4. On the supply side, for example, local scarcity of developable land, the time
it takes to construct new housing and planning restrictions may also impede a timely response
to changes in price 5. As a result, house prices may be subject to high levels of volatility, and
remain in excess of what might be considered as their equilibrium price for prolonged periods of
time.
The implications of market distortions and knock-on effects can be serious, profoundly
affecting the London economy and wellbeing of its residents. For London-based businesses, the
rising costs of housing in an area place upward pressure on wages as firms compensate their
workers for higher housing costs and/or longer commutes 6. In turn, this may present an
economic risk to London since it increases the costs of doing business, and reduces firms’ ability
to recruit and retain staff in the capital 7.
House price increases that are unrelated to the fundamental drivers of demand and supply, can
also pose a threat to economic stability. In the 1980s rising house prices contributed to an
economic boom that ultimately proved unsustainable. More recently, unsustainable house price
rises in the US contributed to the global financial crisis in 2008. House price inflation in each of
these examples increased indebtedness relative to income, and distorted economic behaviour.
As house prices accelerate in a boom, households take on increasingly higher levels of debt,
lenders are increasingly exposed to a volatile market and investment is increasingly directed
towards, arguably, non-productive assets and activities. This increases the risk of economic
instability if the costs of financing mortgage debt increases, or if house prices were to suddenly
fall in value.
2.2 The wider, social implications of house prices
One of the most challenging obstacles to living in London, in terms of cost, is the cost of
housing. In 2013, average housing expenditure in London was £135.90 per week, or 15 per cent
of total weekly household expenditure 8. This is higher than any other UK region, and average
2
Alternative investment-based metrics which consider the relationship between house prices, rents and returns from alternative
investments are considered separately in Appendix 1.
3
In 2013, an estimated 59,313 properties in London are empty based on DCLG council tax statistics, representing 1.7 per cent
of the total housing stock.
4
For an overview of the market failures associated with London’s housing market, see: GLA (2003), ‘Market failure and the
London housing market’, accessed on 22/09/14.
5
See for example, Department for Communities and Local Government (DCLG), ‘The impacts of restricting housing supply on
house prices and affordability’, November 2010
6
For example, 49 per cent of London employees say they would likely consider moving out of London if house prices and rents
continue to increase at current rates. Source: London First/Turner & Townsend, ‘Moving out: How London’s housing shortage is
threatening the capital’s competitiveness’, September 2014.
7
Based on a representative sample of London business units, the London Business Survey 2014 found that around 63 per cent
of businesses rated London as a poor or very poor location for their business in terms of the availability/cost of housing. Source:
GLA Economics, ‘London Business Survey 2014: main findings’.
8
Housing expenditure here incudes the cost of mortgage repayments and rent (less benefits, rebates and allowances received)
on primary dwellings, as well as the costs of maintenance and repairs. It excludes council tax and other rates, property
transaction costs, and expenditure on property improvements and insurance. Total expenditure includes all categories recorded
GLA Economics 7House prices in London – an economic analysis of London’s housing market
Working Paper 72
housing expenditure in the UK as a whole was £86.10 per week, equivalent to 12 per cent of
total weekly household expenditure. Such higher housing costs drive up the cost of living for
Londoners.
An individual household has a given amount of income to spend and cannot influence the price
of the goods and services it buys. In the market for any good or service, there will be a number
of households that are unable to purchase housing at a given market price as it will exceed their
budget. Even in a perfect market, housing costs will therefore be ‘unaffordable’ for those
households whose budget constraint falls below the going market rate. Housing affordability in
this sense relates to equity, rather than efficiency issues.
It follows that, if the costs of housing increase (relative to changes in household incomes), then
increasingly more households will find themselves priced out of the housing market; there will
be a growing gap between the willingness and ability to pay. Those priced out of owner
occupation will either move away, or turn to renting or social housing (if possible).
This inability to access home ownership is likely to be a particularly acute challenge for those
outside the labour market and dependent on fixed incomes from the state or other sources.
Rising housing costs may also lead to worse outcomes for those workers in sectors and low paid
occupations, where incomes fail to increase in line with the cost of living 9. It follows that a lack
of affordability in social terms can also have long-term implications for London businesses (and
their employees) that rely on the support services provided by other sectors, and relatively low-
paid workers. The economy in turn may suffer from the consequent impediments to labour
mobility as workers are unable to find somewhere to live within easy reach of the workplace.
High and rising house prices have also been linked to a number of social challenges, such as
sub-standard living conditions, overcrowding and insecure tenure 10. This can present serious
consequences for health, sustenance and the wellbeing of London’s population. A lack of
affordability can also place increased pressure on local public finances by, for example,
increasing the reliance on housing benefit 11 as well as costs associated with health, education
and to a lesser extent, crime and offending 12. The social costs of poor housing to individuals and
the state are particularly concentrated among those whose housing needs are not met and who
experience homelessness and temporary accommodation. While this paper is concerned with the
private market for housing, these costs may provide a rationale for the provision of a separate
market for ‘social housing’ below market rents.
Finally, the cost of housing can also raise a number of distributional effects. By increasing the
barrier to home ownership, high house prices can have a particularly limiting effect on first time
buyers, and particularly young households. At the time of the 2011 Census, 50 per cent of
London households owned their own homes (either outright or with a mortgage), compared to
65 per cent in England and Wales as a whole, and down from 59 per cent in 2001 13. Research
in the ONS Living Costs and Food Survey. Source: GLA Economics calculations based on ONS Family Spending 2013, reference
table 2.5.
9
For analysis of the persistence of low paid employment, see: GLA Economics, ‘Low pay in London’, February 2014.
10
See for example: Whitehead, C. and Travers, T. (2011), ‘The case for investing in London’s affordable housing’, LSE London.
11
The total housing benefit bill for London has increased from £2.5 billion to £6.2 billion (146 per cent) from 1998/99 to
2013/14. Source: Department for Work and Pensions, benefit expenditure and caseload tables 2014.
12
There are numbers of studies that clarify the extent that poor housing increases the costs to public finances. See, for example:
Friedman, D. (2010), ‘The social impact of poor housing’, 2010.
13
Source: GLA analysis of historical Census data, accessed on 06/08/15
GLA Economics 8House prices in London – an economic analysis of London’s housing market
Working Paper 72
for Halifax finds that compared with other regions, London has the highest proportion of young
people aged 20-45 who worry they will never be able to buy a house (82 per cent) 14, with the
majority of Londoners (69 per cent) citing high property prices as the most significant barrier to
homeownership.
This barrier can contribute to housing wealth inequality across the generations, and may also
limit social mobility. Property wealth is an important component of London’s unequal wealth
distribution, accounting for almost 40 per cent of total wealth among the wealthiest 20 per cent
of households in London 15. Housing wealth is also an important source of inheritance. During
2010-12, it is estimated that 168,000 individuals in London received some form of inheritance
in the preceding two years. Of these, 40,800 included a “house, flat, land, or share in property”,
accounting for 24 per cent of all inheritances within London 16.
So in conclusion, issues of house price affordability can be viewed in: (1) efficiency terms – the
extent to which demand and supply are in balance; and (2) equity or social terms when prices
are, arguably, in equilibrium but people cannot afford to pay. These present a range of different
risks and problems for the London economy and the wellbeing of its residents. While
highlighting potential issues for particular groups which may have long-term economic
consequences, this paper focuses on the price of homes and costs of housing in London in
economic terms. It therefore primarily considers the private market for owner-occupied and
mortgage-backed housing. It does not relate to the concept of ‘affordable homes’, which refers
to ‘social rented, affordable rented and intermediate housing, provided to specified eligible
households whose needs are not met by the market’ 17.
14
Findings are based on over 40,000 interviews with 20-45 year olds across the UK from 2011-2015. Source: Halifax, ‘Five years
of generation rent: perceptions of the first-time buyer housing market 2015’, April 2015.
15
The wealthiest 20 per cent of households in London held aggregate total wealth of £1,018 billion, of which £400 million was
held in net property wealth. Source: ONS wealth and assets survey.
16
This does not include inheritance involving property that is sold and reported as a monetary inheritance. Source: ONS ad hoc
analysis of the Wealth and Assets Survey, 26 January 2015.
17
For definitions of these terms, see: DCLG, ‘Definitions of general housing terms’, accessed on 01/10/15
GLA Economics 9House prices in London – an economic analysis of London’s housing market
Working Paper 72
3 Trends in the London housing market
This report next looks at the different ways in which house prices are measured and puts the
most recent house price rises in the context of experiences of the past 45 years. This serves to
provide a backdrop for the subsequent discussion on economic affordability and sustainability
of London house prices.
3.1 Measuring house prices and house price trends
There are a number of measures of house prices, which can give rise to different estimates of
the level of house prices and how they are changing over time. These reflect differences in the
underlying data and methodologies for their collection. There are two ‘official’ measures of
house price levels in the UK:
1) The Office for National Statistics (ONS) house price data: based on a representative sample
of UK-wide mortgage lending through the Regulated Mortgage Survey of the Council of
Mortgage Lenders 18.
2) Land Registry price paid data: based on a complete register of all residential sales at full
market value 19 in England and Wales.
Alternative datasets are also produced by Nationwide and Halifax based on their own mortgage
approvals, irrespective of whether these result in actual purchases. In addition, comparison
websites such as Rightmove.com and Zoopla produce measures of advertised asking prices and
estimated prices respectively, while the Royal Institution of Chartered Surveyors (RICS) produces
a leading sentiment indicator of conditions in the UK residential sales markets, based on new
buyer enquiries. Such indicators can be useful to anticipate emerging market trends. This is
because they overcome the time lags associated with the property search and offer process,
having a mortgage approved, a transaction completed and registered with the Land Registry20.
However, since they are based on a representative sample or comprehensive register of actual
house sales, the two official data sources provide a more reliable measure of the average price
of house sales at a particular point in time. Land Registry data is a particularly rich source of
data on the ‘going market rate’ of housing at a given time as it can also provide information at
borough level. It also includes transactions based on cash purchases as well as those backed by
mortgage finance, while the ONS data only captures purchases financed by UK mortgages 21.
ONS data instead benefits from a richer time series, providing data on house prices by UK
region back to 1969. The Land Registry data, though available at a more detailed level, dates
back only as far as 1996.
Since house price changes over time may be affected by the quality and characteristics of the
stock of housing available for purchase, the ONS, Land Registry, Nationwide and Halifax each
produce their own House Price Index (HPI). The change in the index compared to a year earlier
18
For further details see: ONS, ‘Official House Price Statistics Explained’, April 2013, accessed on 06/08/15
19
This excludes the sale of part of a property, a share of a property, or the sale of a property at a discount. Examples include
‘Right to Buy’ sales at a discount, repossession sales or transfers between parties on divorce. Further details are available at:
https://www.gov.uk/about-the-price-paid-data#data-excluded-from-the-house-price-index-and-price-paid-data, accessed on
06/08/15
20
For further information see the Council of Mortgage Lender (CML) mortgage statistics timeline accessed on 06/08/15.
21
Nationwide estimates that cash purchases represented 37 per cent of total housing market transactions in London in 2013, in
line with the UK average of 36 per cent. Source: Nationwide house price index, May 2015.
GLA Economics 10House prices in London – an economic analysis of London’s housing market
Working Paper 72
is used to tell whether prices are rising or falling. These indices also seek to isolate changes in
prices from changes in the mix of houses sold from period to period, though no source is able to
fully account for changes in the quality of housing stock that may result from home
improvements or deterioration.
The ONS, Nationwide and Halifax HPIs adjust for the changing mix of properties made available
in any given period (in terms of size, number of bedrooms and a range of other characteristics)
to measure the price of an ‘average house’ 22. The corresponding Land Registry HPI is instead a
form of ‘repeat sales regression’ index. This means that it measures average price changes in
repeat sales on the same properties. It thereby controls for differences in the characteristics of
each individual house that is resold. These indices are particularly relevant to understanding the
value to those holding property at a particular moment in time, and the value of the housing
stock that may be available for sale in the future.
While there are a range of sources available, the Land Registry data provides the most accurate
picture of prices paid in the housing market. However, although it is less comprehensive in its
coverage of transactions and arguably less rigorous in its mix-adjustment as a result 23, the ONS
HPI acts as a useful measure for the actual price of house sales for each UK region over longer
periods of time. The alternative datasets are based on advertised, as opposed to the realised
price of property transactions. The next section sets out the recent trends in London house
prices, and places these in the context of the national picture and previous economic cycles.
3.2 Trends in London house prices
In each year since Land Registry records began in 1996, the average (median) house price in
London 24 has exceeded the average for every other region in England and Wales. This gap in
average house prices between London and the country as a whole has also grown larger in each
year, with the exception of 2009 when year-on-year average prices in London fell by £10,000,
which was greater than the £1,000 fall in average prices in England and Wales (see Figure 1). In
the period from 1996 – 2014 the gap between the average prices paid for housing across the
different London boroughs has also grown markedly bigger. This reflects the rapid increase in
house prices in central areas, where house prices were relatively high at the start of the period.
22
By combining the average price for each combination of characteristics into an indexed measure of house prices that holds
these constant.
23
Research by the Institute for Fiscal Studies concludes that the ONS measure may be relatively more sensitive to changes in the
type of property sold, and consequently may over-estimate current levels of house prices due to the strength of the ‘prime’
London market. Source: Chandler, D. and Disney, R. (IFS), ‘Housing market trends and recent policies’, chapter 5 in: ‘The IFS
Green Budget: February 2014’.
24
In presenting the ‘average’ price, the median is typically used as it avoids over-estimates associated with mean values that
result from a positive skew in the distribution of house prices.
GLA Economics 11House prices in London – an economic analysis of London’s housing market
Working Paper 72
Figure 1: Median house prices in London exceed those across England and Wales,
1996-2014
Source: Land Registry price paid data. Notes: Excluded from the above figures are sales at less than market price
(e.g. Right to Buy), sales below £1,000 and sales above £20 million.
By looking at repeat sales on the same properties, the seasonally adjusted Land Registry HPI
signals an even sharper increase in London house prices in recent years. In the 12 months to
June 2015 house prices in London increased by 9.2 per cent, compared to 5.4 per cent across
England and Wales, and higher than any other region 25. In the five years since 2009, nominal
house prices 26 in London have risen year-on-year by an average of 7.8 per cent, compared to
2.6 per cent in England and Wales (see Table 1).
25
The annual change shown for February 2015 is the percentage change in the Land Registry HPI for the 12 months up to
February 2015. This measures average price changes in repeat sales on the same properties, and is not available below regional
level. Prices are not adjusted for inflation. For further information, see: https://www.gov.uk/government/statistical-data-
sets/house-price-index-statistical-report.
26
Nominal (or actual) house prices are not adjusted for inflation, and reflect the historical (or current) prices paid for a property.
GLA Economics 12House prices in London – an economic analysis of London’s housing market
Working Paper 72
Table 1: Median house prices and house price trends in London, England and Wales,
1996-2014
Median house prices, £ Compound growth rate, %
1996 2007 2009 2014 1996-2007 2007-2009 2009-2014
England and Wales 57,000 176,000 169,000 192,000 10.8 - 2.0 2.6
London 77,000 265,000 250,000 364,000 11.9 - 2.9 7.8
Inner London 87,000 313,000 323,000 462,000 12.3 1.7 7.4
Outer London 74,000 249,000 235,000 315,000 11.7 - 2.9 6.1
Source: Land Registry price paid data, annual median (rounded to the nearest £1,000). The compound growth rate
is the the year-on-year rate of growth able to account for the change in house prices over the period.
These aggregate figures for London disguise a great deal of variation across different parts of
London. The going market rate for houses sold in central boroughs in 2014 was particularly high,
with median house prices as high as £857,000 in Westminster and £1.198 million in Kensington
and Chelsea according to Land Registry data. In contrast, the average price paid for a house in
Barking and Dagenham was £215,000 in 2014 (see Figure 2). This median figure was however
still higher than the national average for England and Wales, which was £192,000 in 2014.
Figure 2: Median house prices by London borough in 2014
Source: Land Registry price paid data. Notes: City of London excluded due to low sample size. Excluded from the
above figures are sales at less than market price (e.g. Right to Buy), sales below £1,000 and sales above £20m.
Figures are rounded to the nearest £1,000.
GLA Economics 13House prices in London – an economic analysis of London’s housing market
Working Paper 72
Not only are house price levels across the London boroughs higher than the national average,
the rates of house price growth since the global recession have seen this gap grow larger. In the
five years from 2009 to 2014, average growth rates have exceeded the national average for
England and Wales (2.6 per cent) in each of the London boroughs. At the extremes, annual
average growth rates in the median house price over the period exceeded 10 per cent in
Haringey, Kensington, and Westminster. The average rate of growth in house prices in the outer
boroughs, while relatively more modest, is still high and averaged 4.6 per cent in Havering and
Enfield over the period (see Figure 3).
Figure 3: Average growth rate in median house prices by London borough, 2009-2014
Source: Land Registry price paid data. Notes: City of London excluded due to low sample size. Excluded from the
above figures are sales at less than market price (e.g. Right to Buy), sales below £1,000 and sales above £20m.
Notes: The average growth rate is the the year-on-year rate of growth able to account for the change in house
prices from 2009 to 2014.
The price of London rents
As with the price of buying a home, the median price of private monthly rents in London is also
considerably higher than in England as a whole. Based on data on private monthly rents from
the Valuation Office Agency (VOA), median rents in London in 2013/14 were £1,350 per
month, more than twice as high as median rents in England as a whole (£595 per month). The
VOA data provides a ‘snapshot’ on the median value of private monthly rents, and although it
cannot enable robust comparisons over time, it can be used to illustrate the differences in
GLA Economics 14House prices in London – an economic analysis of London’s housing market
Working Paper 72
average rents across London 27. Figure 4 shows that in the 12 months to March 2014, the
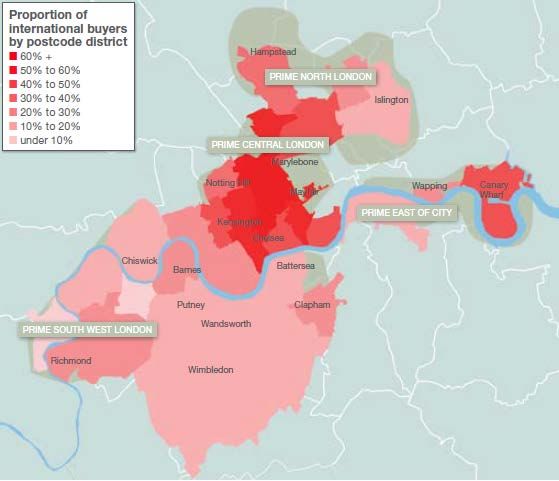
median monthly private rent was highest in Westminster (£2,383) and Kensington and Chelsea
(£2,275). These were the only two local authorities in England to have a median monthly private
rent of more than £2,000 in 2013/14. While considerably lower, median rents recorded in the
London Boroughs of Havering, Barking and Bexley were between 50-60 per cent above the
national average. These patterns of rents across London shown in Figure 4 appear highly
correlated with the house price data in Figure 2, and this relationship between house prices and
rents is explored in further detail in Appendix 1.
Figure 4: Median monthly private rents by London borough, 2013/14
Source: VOA median private monthly rents, 2013/14. Notes: Data is based on private rental data entered into the
lettings administrative information database were extracted for the twelve months to the end of March 2014. Cases
where there was evidence of a transaction (i.e. rent has been paid) were retained while those with limited or no
evidence of a transaction were removed.
London is not the only city where its residents face high levels of rents. Data from a UBS 2015
survey of 71 world cities found that London rent levels were, on average, the third highest in
the World behind New York and Hong Kong (see Table 2).
27
Further information on the VOA methodology for calculating private rents can be found at:
https://www.gov.uk/government/publications/private-rental-market-statistics-england-only/release-notes-10-june-
2014#methodology , accessed on: 02/10/15.
GLA Economics 15House prices in London – an economic analysis of London’s housing market
Working Paper 72
Table 2: Average monthly rents by selected major city, 2015
New Hong
London Chicago Doha Sydney Tokyo Paris Munich
York Kong
Normal
local rent £2,530 £1,680 £1,530 £1,440 £1,330 £1,160 £1,120 £1,050 £890
(£)
UBS rank 1 2 3 4 6 11 14 16 21
Source: UBS prices and earnings 2015. Notes: The figures given are values for average rent prices (monthly gross
rents) for local households. To capture local standards, the UBS survey asked for the price of a newly built
apartment of typical size, location, and amenities for the respective city. US dollar values given in the report have
been converted to pound sterling using the exchange rate 1 USD = 0.65 GBP.
3.3 Long-term trends in London house prices
Over a longer-time horizon, housing markets in London have witnessed a number of ups and
downs, with the rate of change in London house prices from year-to-year fluctuating widely
since the ONS data series on regional house prices began in 1969. This section places the
recent, post-downturn house price rises in the context of previous economic cycles and longer-
term trends.
Over the past 45 years, since the ONS series began, the London housing market has been
characterised by periods of rapidly increasing house prices followed by a levelling off period, or
a downward adjustment in house prices. An overall fall in the nominal value of the average
house in London is however unusual; nominal house price deflation was experienced in only two
periods in the previous 45 years, in 1991/92 and 2009. House price rises in London therefore
tend to be the norm, with nominal adjustments relatively rare, as well as relatively short-lived.
Compared to the UK as a whole, Figure 5 reveals a tendency for movements in London house
prices to be greater, thereby amplifying changes in national house prices. In addition, house
price trends in London have tended to precede those exhibited across the rest of the country.
These spatial differences in nominal house price changes across the UK are sometimes referred
to as a ‘ripple effect’ 28.
28
See for example: Meen, G. (1999) “Regional house prices and the ripple effect: a new interpretation”, Housing Studies, 14(6),
pp 733–753.
GLA Economics 16House prices in London – an economic analysis of London’s housing market
Working Paper 72
Figure 5: Volatility of year-on-year nominal house price inflation in London and the
UK
Source: ONS mix-adjusted house prices index, reference table 33. Notes: Data is based on mortgages completed
and adjusted for the mix of dwellings sold.
Figure 6 illustrates the volatility of house prices in real terms, relative to the price of other goods
and services consumed by households. This reveals significant episodes of real house price
deflation in 1973-1976, 1980-81, 1989-92 and 2007-09. The experience in the mid-1970s is
interesting because real house price deflation occurred while actual or nominal house prices
were continuing to grow. This occurred because rates of retail price inflation were especially
high during this period. For example, while house prices grew by 7 per cent in the year to 1976,
retail prices rose by 17 per cent. Relative to other consumer prices, house prices also decreased
in real terms in 2005 and 2011 (see Figure 6). So while nominal terms adjustments are rare, in
real terms such adjustments are more frequent with real prices decreasing in 11 of the last 35
years.
GLA Economics 17House prices in London – an economic analysis of London’s housing market
Working Paper 72
Figure 6: Volatility of year-on-year real house price inflation in London and the UK
Source: ONS mix-adjusted house prices index, reference table 33, ONS long term indicator of prices of consumer
goods and services (RPI all item). Notes: Data is based on mortgages completed and adjusted for the mix of
dwellings sold. The house-price index is deflated by all item retail prices to take account of the effects of inflation
on purchasing power 29.
Figure 7 shows the impact of general inflation on house price levels in London, and the
relationship with the wider business cycle. The recent upturn in the London housing market
follows the sharpest and deepest decline since the early 1990s. Based on ONS data from the
Regulated Mortgage Survey, London nominal house prices fell by 18.1 per cent from a pre-
recession peak in January 2008 to their lowest value in March 2009 30. This compares with a
nominal fall in average London house prices of 20.9 per cent from peak to trough in the two-
and-a-half years from the second quarter in 1989 to the fourth quarter of 1992 31.
29
This particular price level is a weighted index of the prices of categories of goods and services consumed by households,
where the weights reflect the proportion of total expenditure accounted for by each category of household consumption.
30
In nominal terms, using Land Registry price paid data, the price of an ‘average’ house in London fell from a peak of £350,529
in February 2008 to £292,497 in April 2009. This represents a fall of 17 per cent in less than 18 months.
31
Source: ONS table 8, mix-adjusted house price index, by region from Q2 1968 (quarterly) and from 2002 (monthly)
GLA Economics 18House prices in London – an economic analysis of London’s housing market
Working Paper 72
Figure 7: Nominal and real house price levels in London and the business cycle, 1969-
2014
Source: ONS House Price Index reference table 33, ONS long term indicator of prices of consumer goods and
services (RPI all item). Notes: the real house-price index is deflated by retail prices and rebased at 100 to take
account of the effects of inflation on purchasing power. Data is based on mortgages completed and adjusted for the
mix of dwellings sold. A downturn is defined as a period in which annual real GDP growth was less than 0 per cent.
Looking specifically at the peaks and troughs over time, there have been several prolonged
periods of strong house price increases in London and the UK as a whole (see Table 3). In the
eight years from 1982-1989, prior to the previous fall in London house prices in the early 1990s,
house prices in London more than tripled as a result of an average annual increase in nominal
London house prices of 17.1 per cent (or more than doubled in real terms due to 11.4 per cent
average annual real increases).
Periods of sharp house price inflation in London have however not always been followed by a
downward adjustment in prices, even in the event of a wider economic downturn. In the
recessions of 1974 and 1981, house prices in London continued to rise, albeit at much slower
annual rates than previously. The sharp increases in London house prices since the great
recession of 2008/09 can also be seen in the longer-term context, to continue on from the pre-
crisis trend rate (see Figure 7). In the 12 years prior to the 2008/09 recession, real house prices
in London had increased by an average annual rate of 9 per cent, and have subsequently
returned to these high levels.
GLA Economics 19House prices in London – an economic analysis of London’s housing market
Working Paper 72
Table 3: House prices and the business cycle in London during selected periods, 1970-
2014
Nominal house prices Real house prices RPI GVA GDP
Time period (CAGR, %) (CAGR, %) (CAGR, %) (CAGR, %) (CAGR, %)
London UK London UK All item London UK
1970 – 1973 28.5 27.0 18.4 17.0 8.6 4.7
1973 – 1975 2.8 7.1 - 14.4 - 10.8 20.1 - 2.0
1977 – 1979 26.0 22.5 13.7 10.5 10.8 3.6
1980 – 1981 3.0 5.5 - 7.9 - 5.7 11.9 - 0.8
1982 – 1989 17.1 15.2 11.4 9.6 5.1 3.9
1990 – 1992 - 7.1 - 2.6 - 11.4 - 7.1 4.8 - 0.4
1994 – 1996 2.0 2.1 - 1.0 - 0.8 2.9 2.6
1997 – 2007 11.7 11.2 8.7 8.2 1.5 6.3 3.1
2008 – 2009 - 8.2 - 7.6 - 7.9 - 7.3 - 0.5 - 1.5 - 4.3
2012 – 2014 12.9 6.7 9.9 3.9 2.7 *4.0 2.1
Whole period 10.2 9.3 3.8 3.0 6.1 2.2
Sources: ONS mix-adjusted house prices index, reference table 33, ONS regional workplace-based GVA, at current
basic prices, 1997 – 2013. ONS UK GDP, chained volume measures (real terms), 1970 – 2014. Notes: The
compound average growth rate (CAGR) is the the year-on-year rate of growth able to account for the change in
house prices or GVA/GDP from the first year to the last year of the period. *London GVA data for 2012-14 is for
the period 2012-13.
From the patterns of previous cycles, there are no clear trends from price data alone to suggest
whether London house prices are approaching a new peak, and whether this will entail a
levelling off, or a more exceptional downward adjustment. While a long-term trend in rising
house prices may be a cause for concern as it may, for example, signal a structural imbalance
between the demand and supply of housing, it is not necessarily unsustainable. It is a question
instead of understanding whether current house prices differ systematically from economic
fundamentals and are therefore vulnerable to an economic shock, or whether something
fundamental has changed in London’s housing market that can account for the recent house
price increases.
3.4 Summary of house price trends
House prices in London are currently experiencing rapid rates of growth – relative to the rest of
the country and relative to overall prices in the economy. One cause for concern may be that
the London housing market is characterised by periods of volatility, and though nominal falls in
the actual value of the average London home are relatively rare, real term adjustments are not
altogether uncommon. High house price inflation in itself is not however evidence that housing
is overvalued or unsustainable.
To address this issue, it is necessary to assess whether these prices relate to their underlying
determinants of demand and supply (e.g. purchasing a house as a medium to long-term asset
for residential purposes), or whether they are distorted by market failures, or a desire to
speculate in the expectation of future capital gains, or some other reason. In the next section, a
range of indicators are considered to assess whether or not the evidence suggests house prices
are in line with underlying economic ‘fundamentals’, and consider the possible economic
implications of actual prices for prospective first-time buyers.
GLA Economics 20House prices in London – an economic analysis of London’s housing market
Working Paper 72
4 The affordability of housing in London, risks to the
housing market and the responsiveness of housing supply
Section 2 highlighted that there are a number of demand and supply-related factors which
could explain London’s house prices and house price inflation of recent years. These include
fundamental drivers such as a possible rise in the ability to pay, the increased desirability of
London as a place to live and work, as well as socio-demographic developments of the London
population and household size.
This section considers a range of indicators in order to benchmark the observed changes in
house prices against trends in the ability to pay for housing in London. This provides an
assessment of the economic affordability of London house prices and, coupled with an
assessment of households’ sensitivity to interest rates and credit market conditions, the
sustainability of recent trends. The section finishes by considering the responsiveness of
housing supply to meet demand to live in London and dampen house price inflation in the long-
term.
4.1 The economic affordability of housing in London
One summary measure commonly used to assess housing market conditions is the degree to
which the cost of housing is within the reach of the average buyer. This can either be
determined in terms of house prices relative to the levels of incomes and earnings 32 among the
population, or in terms of the cost of owning a house – specifically, the ability of buyers to
obtain a mortgage and meet the expense of monthly repayments and service charges.
If the ratio between the cost of housing and incomes rises too high, purchasing a house would
be difficult. This could in turn lead to reduced demand and downward pressure on house prices
in the case of a well-functioning market. Otherwise, if market demand is not driven by the
economic fundamentals discussed in section 2, increased affordability constraints may lead to
the accumulation of unsustainable mortgage debt and could pose a threat to economic stability.
4.1.1 Are earnings and incomes in London keeping pace with house price rises?
A common gauge of whether or not housing is within reach of the typical buyer is the median
house price to median annual earnings ratio (‘median multiples’) 33. Earnings data is sourced
from the ONS Annual Survey of Hours and Earnings (ASHE), and can be measured on the basis
of where workers work (workplace-based earnings), and where they live (resident-based
earnings).
While the overall picture for England as a whole is largely unchanged irrespective of whether
workplace or resident earnings are used, patterns of commuting mean that greater differences
are observed at regional and local authority level. Based on the ASHE data, median earnings for
a full-time employee working in London were approximately 7 per cent or (£2,300 higher than
32
Earnings are the paid income from work. Personal or individual income differs from earnings in that it includes income from
pensions and investments or social security benefits, for example, as well as earned income. Household income is taken as the
combined income for all people in the household.
33
The median is typically the preferred measure of a typical home, as this reduces the effect of extreme prices (usually at the
higher end of the scale) that influence the mean (or average) value.
GLA Economics 21You can also read